
Retirement Savings and Types of Investment Assets Among ...
89
Utah State University Utah State University DigitalCommons@USU DigitalCommons@USU All Graduate Theses and Dissertations Graduate Studies 12-2008 Retirement Savings and Types of Investment Assets Among Near- Retirement Savings and Types of Investment Assets Among Near- Retirees Aged 51-64: How do Women Invest Differently Than Retirees Aged 51-64: How do Women Invest Differently Than Men? Men? Katrina R. Nye Utah State University Follow this and additional works at: https://digitalcommons.usu.edu/etd Part of the Social and Philosophical Foundations of Education Commons Recommended Citation Recommended Citation Nye, Katrina R., "Retirement Savings and Types of Investment Assets Among Near-Retirees Aged 51-64: How do Women Invest Differently Than Men?" (2008). All Graduate Theses and Dissertations. 6. https://digitalcommons.usu.edu/etd/6 This Thesis is brought to you for free and open access by the Graduate Studies at DigitalCommons@USU. It has been accepted for inclusion in All Graduate Theses and Dissertations by an authorized administrator of DigitalCommons@USU. For more information, please contact [email protected].
Transcript of Retirement Savings and Types of Investment Assets Among ...

Utah State University Utah State University
DigitalCommons@USU DigitalCommons@USU
All Graduate Theses and Dissertations Graduate Studies
12-2008
Retirement Savings and Types of Investment Assets Among Near-Retirement Savings and Types of Investment Assets Among Near-
Retirees Aged 51-64: How do Women Invest Differently Than Retirees Aged 51-64: How do Women Invest Differently Than
Men? Men?
Katrina R. Nye Utah State University
Follow this and additional works at: https://digitalcommons.usu.edu/etd
Part of the Social and Philosophical Foundations of Education Commons
Recommended Citation Recommended Citation Nye, Katrina R., "Retirement Savings and Types of Investment Assets Among Near-Retirees Aged 51-64: How do Women Invest Differently Than Men?" (2008). All Graduate Theses and Dissertations. 6. https://digitalcommons.usu.edu/etd/6
This Thesis is brought to you for free and open access by the Graduate Studies at DigitalCommons@USU. It has been accepted for inclusion in All Graduate Theses and Dissertations by an authorized administrator of DigitalCommons@USU. For more information, please contact [email protected].

RETIREMENT SAVINGS AND TYPES OF INVESTMENT ASSETS AMONG
NEAR-RETIREES AGED 51 - 64: HOW DO WOMEN INVEST
DIFFERENTLY THAN MEN?
by
Katrina R. Nye
A thesis submitted in partial fulfillment of the requirements for the degree
of
MASTER OF SCIENCE
in
Family, Consumer, and Human Development (Consumer Sciences)
Approved: ______________________________ ______________________________ Yoon G. Lee, Ph.D. Thomas R. Lee, Ph.D. Major Professor Committee Member ______________________________ ______________________________ Alena C. Johnson, M.S. Byron R. Burnham, Ed.D. Committee Member Dean of Graduate Studies
UTAH STATE UNIVERSTIY Logan, Utah
2008

ii
Copyright © Katrina R. Nye 2008 All Rights Reserved

iii
ABSTRACT
Retirement Savings and Types of Investment Assets Among Near-Retirees Aged 51 – 64:
How Do Women Invest Differently Than Men?
by
Katrina R. Nye, Master of Science
Utah State University, 2008
Major Professor: Dr. Yoon G. Lee Department: Family, Consumer, and Human Development
The purpose of this study was to examine the financial portfolios of near-retiree
women and compare their assets to near-retiree men. This study also investigated how
economic and demographic factors were associated with the probability of holding
aggressive assets and the level of savings. Socioeconomic variables were used to create a
profile of the investment behaviors and to examine the level of savings among near-
retiree women and men. Specific variables key to the study included household income,
age, marital status, education, race, and self-reported health of near-retiree women and
men.
The descriptive statistics indicated that overall, average levels of all asset
categories for the female group were much lower than they were for the male group
among near-retirees. According to the findings of this study, women tended to invest in

iv safer assets such as CDs, savings bonds, and T-bills rather than in more aggressive assets
such as stocks, business assets, and real estate assets.
The results from both the logistic regression and Ordinary least squares regression
analyses indicated that gender had no statistically significant impact on the investment
and savings behavior among near-retirees aged 51 - 64. However, household income,
age, marital status, education, race, and the self-reported health status of near-retirees
were all significant determinants of the investment and saving behavior among near-
retirees aged 51 - 64. For example, near-retirees, with higher income, older, married,
higher education, Whites, and in good health, were more likely to own aggressive assets
and reported higher level of savings as compared to other near-retirees.
This study also explored socioeconomic factors associated with the level of
savings among near-retiree women aged 51 - 64. The findings of this study indicated that
household income, age, education, and race were significant determinants of the level of
savings among near-retiree women aged 51 - 64. The results of the OLS regression
analysis showed that women with lower income, younger, less education, and non-Whites
reported lower levels of savings than did other women. Implications of the findings,
limitations of the current study, and suggestions for future study were presented in the
final section.
(88 pages)
v
ACKNOWLEDGMENTS
I would like to sincerely thank all the individuals who supported me throughout
this research study, especially my committee members. I thank Dr. Yoon Lee, my major
professor, for never giving up on me and continually pushing me through to the end. I
owe my deepest gratitude to her since she truly believed that I could accomplish this
difficult task and finish my graduate degree. I thank her for her knowledge of research,
writing, editing, and her countless hours of guidance and encouragement. I know that I
would never have finished this study if it were not for her support. She spent so many
hours at her computer with me editing, rewriting, and editing again. She is a wonderful
example of what a major professor really means. I owe the accomplishment of my
degree to her.
I also thank the other members of my committee, Dr. Tom Lee and Alena
Johnson. They offered me insight to make appropriate changes and revisions for a better
project. I thank them both for their support and knowledge.
I sincerely thank my parents for constantly asking me how my study was coming
along and their continual encouragement. I also thank all my friends and co-workers at
Utah State University, particularly those at the School of Graduate Studies and the
Department of Economics. Thank you for enduring the last three years of my graduate
program with me.
I especially owe my deepest gratitude to my husband (Chad) and children (Kyler,
Makayla, and Kaden). I thank them for enduring the emotional roller coaster that I have
taken them on. Thank you for helping me make it through these last few years especially

vi the last few months of research and writing. I could not have kept my sanity had it not
been for them and their constant hugs and kisses. I love you so much!!
Katrina R. Nye
vii
CONTENTS
Page
ABSTRACT....................................................................................................................... iii
ACKNOWLEDGMENTS ...................................................................................................v
LIST OF TABLES............................................................................................................. ix
CHAPTER
I. INTRODUCTION .......................................................................................1
Women and Retirement Savings......................................................4 Need for Study .................................................................................5 Objectives of the Study....................................................................8 Research Questions..........................................................................8 Benefits of the Study........................................................................9
II. LITERATURE REVIEW ..........................................................................11 Public Programs .............................................................................11 Pensions – 401(k) Accounts...........................................................15 Gender............................................................................................17 Age.................................................................................................20 Income............................................................................................22 Marital Status .................................................................................23 Other Sociodemographic and Economic Factors...........................25 Conceptual Framework..................................................................29 Hypotheses.....................................................................................30
III. METHODS ................................................................................................35 Data and Sample ............................................................................35 Data Analysis .................................................................................36 Variables ........................................................................................37
IV. RESULTS ..................................................................................................40 Socioeconomic Profiles of Near-Retiree Women and Men...........40 Financial Profiles of Near-Retiree Women and Men ....................42 Logit Results of the Likelihood of Owning Aggressive Assets.....48
viii
OLS Results of Net Worth.............................................................57
Page
V. SUMMARY, IMPLICATIONS, AND CONCLUSIONS.........................67 Summary........................................................................................67 Implications of the Study...............................................................69 Limitations of the Study.................................................................71 Recommendations for Future Research .........................................72 Conclusions....................................................................................73 REFERENCES ..................................................................................................................75

ix
LIST OF TABLES
Table Page
1 Variable Measurements (N = 7,922).........................................................................38
2 Socio-Economic Profiles of Women and Men Aged 51–64.....................................41
3 Financial Profiles of Women and Men Aged 51-64 (N = 7,922)..............................44
3-1 Asset Ownership of Near-Retiree Women and Men Aged 51-64 (N = 7,922) ........46 4 Logistics Regression Results for Aggressive Asset Ownership Among Near-Retirees (N = 7,922) ........................................................50 4-1 Logistic Regression Results for Aggressive Asset Ownership Among Near-Retiree Women (n = 4,525)..............................................53 4-2 Logistic Regression Results for Aggressive Asset Ownership Among Near-Retiree Men (n = 3,397) ...................................................56 5 OLS Results of Net Worth Among Near-Retirees (N = 7,922) ................................59
5-1 OLS Results of Net Worth Among Near-Retiree Women (n = 4,525) ....................61
5-2 OLS Results of Net Worth Among Near-Retiree Men (n = 3,397)..........................65

CHAPTER I
INTRODUCTION
The economic well-being of most Americans has improved dramatically since the
1960s (Clark, Burkhauser, Moon, Quinn, & Smeeding, 2004; Karamcheva & Munnell,
2007; Munnell, 2004b). According to the U. S. Department of Labor - Bureau of Labor
Statistics (2007a), the unemployment rate in 2007 was 4.6% as compared to a high of
10.8% in the early 1980s and an average rate of 7 to 9% during that decade. Poverty
rates have also decreased significantly since the late 1950s from 18.5% to a current rate
of 9.8% for families (U.S. Census Bureau, 2007). Even though poverty rates and
unemployment rates have decreased significantly, an area of concern for many financial
educators, financial planners, and policy makers is the aging population and the
accumulation of retirement savings; particularly near-retiree households (Butricia, Iams,
& Smith, 2003).
People are living longer than earlier generations due to immunizations,
preventative health care, public health interventions, and more advanced medical
procedures (Dollemore, 2006; Hodes, 2001; National Institute of Aging, 2007). In the
1930s, the life expectancy rate for people age 65 was 12 years for men and 13 years for
women and, currently, the life expectancy rate beyond retirement is 16 years for men and
19 years for women (Munnell, 2004a). As reported in an Administration on Aging
publication using U.S. Census Bureau data for 2006, people reaching age 65 have an
average life expectancy of an additional 19.8 years for females and 16.8 years for males.
Life expectancy rates are at a record high and continue to rise (Center for Disease
Control, 2005). With modern technological advances and better medical treatments, life

2 expectancy rates beyond retirement are expected to increase to an estimated 20 years
(males) and 23 years (females) by 2080 (Munnell).
Modern advances have also improved work place safety resulting in fewer deaths
to workers (Asche, 2007). With a larger portion of the population (approximately 76
million people) in the baby boom cohort (those born between 1946 & 1964), most of the
overall population will consist of elderly retirees (Butrica et al., 2003). In 2005, the older
population of persons 65 and older amounted to 36.8 million which represented
approximately 12.4% of the American population (Administration on Aging, 2006). One
in every eight people is a member of the aging population (Butrica et al.). The 65 and
older age group will increase from 35 million in 2000 to 40 million in 2010 and then to
55 million in 2020 (Administration on Aging). The age cohort 85 and older is also
projected to increase from 4.2 million in 2000 to 6.1 million in 2010 and then to 7.3
million in 2020 (Administration on Aging).
Because of longer life spans, Americans must focus more of their attention on
financial security and preparing for retirement. Preparing for retirement at any age is a
challenge that needs immediate attention due to the fact that many pre-retirees are not
adequately prepared for a lengthy retirement. Many retirees underestimate life
expectancy rates; therefore, they do not plan retirement accumulation amounts
appropriately. If retirees underestimate life expectancy rates, they may outlive
accumulated assets resulting in being unprepared to meet financial obligations during
retirement. According to the American Academy of Actuaries (2002), 67% of women
3 and 55% of men underestimate their longevity. Understanding the effect that longer life
spans create for retirees is crucial when preparing for the future.
It is recommended that retirees should plan on having approximately 70% of their
pre-retirement income per year throughout retirement (Munnell & Soto, 2005). This is
known as the replacement rate which is defined as the ratio of post-retirement income to
pre-retirement income (Munnell & Soto). Replacement rates are useful when assessing
how well retirees can maintain their pre-retirement levels of consumption throughout
retirement. Knowing the replacement rate is important for near-retirees when they are
planning and saving for the future.
Unfortunately, the rate of savings is low for many pre-retirees. According to the
2007 Retirement Confidence Survey (RCS), almost half of workers saving for retirement
had an accumulated amount of less than $25,000 in personal savings (not including the
value of their home or any defined-benefit plan; Helman, Greenwald, VanDerhei, &
Copeland, 2007). The survey also reported that seven in ten workers indicated that their
assets amounted to less than $10,000. Merrill Lynch & Co (2004) also reported that 56%
of pre-retirees indicated that their primary source of income during retirement will come
from personal savings or a 401(k) account; however, most respondents had only
accumulated an average savings amount of $51,000.
Another issue that cripples future retirees is the switch from defined-benefits
plans to defined-contribution plans. Defined-benefit plans help protect workers from
outliving their assets during retirement; however, many companies no longer offer this
retirement option (Clark et al., 2004). Many workers are counting on employer-provided

4 benefits throughout retirement; however, only 41% of workers indicated that they or their
spouse currently have a defined-contribution plan (Helman et al., 2007).
According to the 2004 Survey of Consumer Finances, only 11% of all participants
contributed the maximum amount to their 401(k) accounts (Munnell & Sunden, 2006).
Not only are employees losing all the accumulated interest that could be growing, but
they are also losing all the employer matched amounts as well. Munnell & Sunden
reported that approximately 17% of workers have also experienced a reduction in
retirement benefits offered by their employer. Workers age 55 and older were more
likely to report this reduction in benefits; unfortunately, it is the near-retirees that need
this additional assistance more. The future may be very challenging for those retirees
that did not accumulate enough personal savings or 401(k) amounts today.
Women and Retirement Savings
Overall, women do not have financial knowledge to help them plan appropriately
for retirement as their male counterparts have (Glass & Kilpatrick, 1998). Some women
may feel inadequate when making important retirement decisions. With the shift to
defined-contribution plans, employers are putting more responsibilities back onto the
employee themselves to save for retirement. This may be challenging for those women
that are not receiving these benefits due to part-time employment or full-time jobs that
don’t offer such crucial benefits.
A majority of the elderly population will consist of women. It was reported that
older women, 65 and older, outnumbered older men at 21.4 million women, compared to

5 15.4 million men (Administration on Aging, 2006). In addition, half of older women
(those 75 and older) live alone. Men are more likely to be married than are women.
Though people are living longer, many women will be living longer but will also be
living alone. Approximately, 30% of noninstitutionalized older people live alone (7.7
million women and 2.9 million men; Administration on Aging).
Preparing for financial security has never been an easy task for any individual, but
it seems to be particularly difficult for the female population due to low wages, less
workforce participation, and fewer retirement benefits. Women live longer than their
male counterparts (19.8 and 16.8, respectively; Administration on Aging, 2006), have
lower pension coverage (Bajtelsmit et al., 2005; Block, 2006; Rappaport, 2007), and a
longer tradition of not managing the family finances. Women also tend to have part-time
jobs or jobs with inadequate retirement benefits, and more time out of the workforce
caring for children. Women, today, are retiring earlier, living longer, and leaving the
workforce with 40% less savings than men (Buffa, 1995).
Need for Study
Many Americans are not saving money, especially the appropriate funds towards
retirement. There is an increased number of people approaching retirement age that may
be well below the savings levels. Korczyk (2001) stated that many working Americans,
including baby boomers, do not know how much they need to have saved for retirement,
let alone how much they have in their investment portfolio. It was also noted that only
43% of workers reported they have tried to calculate how much money is needed by the
6 time they retire in order to live comfortably during retirement (Employee Benefit
Research Institute & Greenwald & Associates, 2007).
Many women do not know how much is realistically needed to retire comfortably.
Alcon (1999) reported that only 36% of women have calculated how much money they
need to save in order to retire and remain in a similar state of comfort. Alcon also noted
that 46% of women have no idea how much money they need in order to retire, while
22% of men do not know how much money they need. Women are significantly lacking
in knowledge regarding financial aspects (Alcon).
A study conducted by the National Center on Women and Aging found that many
women fear making mistakes when planning for retirement (Alcon, 1999). Feelings of
inadequacy and intimidation overwhelm some women into complete denial of the
importance of planning for the future. Women often have left the management of the
family income to someone else while their priority lay with caring for the family
members rather than the future.
Other research also shows that men and women differ significantly when it comes
to investing (Bajtelsmit & Bernasek, 1996). There is a difference in knowledge,
attitudes, and behavior regarding money aspects. Women tend to save less, know less
about investing, and invest more conservatively than men. Women tend to characterize
their risk tolerance as low compared to men. Risk tolerance also varies depending on
age, education, and income (Bajtelsmit & Bernasek). Younger, more educated women,
tend to be less risk averse than their older, less educated female counterparts.

7 Many women are not educated on the various types of investment vehicles that
are available for consumers. Women are more familiar with financial options such as
CDs and savings bonds, which unfortunately, do not have as great of a return as the more
aggressive mutual funds, stocks, annuities, and corporate and municipal bonds. Women
understand CDs and savings bonds, but lack the appropriate knowledge with more
aggressive investments. Women mistakenly assume that because they can manage the
household budget, they can also understand the long-term asset building strategies that
men are typically more familiar with (Alcon, 1999).
Women have come a long way the last few decades as compared to earlier
generations of women. They are living longer and obtaining better educations and
employment, but women still earn less than their male counterparts, take more time out of
the workforce for child rearing, are more likely to live alone in old age, and suffer more
chronic health conditions than their husbands or male peers (Alcon, 1999). Women live
longer in retirement, but have less income and assets to spread over a longer period of
time. Many women face these realities and challenges without the confidence in their
investment strategies of basic financial concepts, particularly regarding future financial
planning.
The retirement system is based on working earnings causing women to be left
without enough resources because of the limited time in the workforce and lower overall
lifetime earnings. Women tend to outlive their male counterparts; unfortunately, many
women are also outliving their limited retirement accounts leaving many women poor in
old age (Munnell, 2004b). Women are living longer and saving less for retirement;
8 therefore, a new study on women’s retirement savings is important and needed in order to
educate women on the importance of proper investing for retirement.
Objectives of the Study
This study examines the financial portfolios of near-retiree women aged 51 - 64
and compares their assets to near-retiree men aged 51 - 64. This study also investigates
how economic and demographic factors are associated with the probability of holding
aggressive assets and the level of savings. There are four main objectives to this study:
(1) To examine the type of assets and level of savings of near-retiree women; (2) To
compare the type of assets and level of savings of near-retiree women as compared to
near-retiree men; (3) To investigate the factors associated with the probability of holding
aggressive assets among near-retiree women; and (4) To explore the factors associated
with the level of savings among near-retiree women.
Research Questions
To accomplish the four objectives, the following research questions are
considered in this study:
1. a. How much do women have saved/invested in the near-retirement stage?
b. How does the level of savings of women differ from that of men in the near-
retirement stage?
2. a. What type of investment assets do near-retiree women hold in their financial
portfolios – how much do they hold in aggressive assets?

9
b. How does the financial portfolio of women differ from that of men in the near-
retirement stage? How does the distribution of financial assets (e.g., CDs, checking
accounts, stocks, bonds, real estate assets, automobiles, and home equity) differ
between women and men in the near-retirement stage?
3. What socioeconomic factors are associated with the probability of holding
aggressive assets (stocks and mutual funds) among near-retiree women aged 51 – 64?
4. What socioeconomic factors contribute to the level of savings among near-retiree
women aged 51 - 64?
Benefits of the Study
Retirement planning is very difficult for many people, but it is crucial for women
that are entering the near-retirement stage. Since this study investigates the factors
associated with the types of aggressive versus safe assets, the findings of this study are
beneficial to professionals, financial educators, and planners when they educate
individuals, in particular women, to make better investment decisions. Financial planners
and educators can better address this problem and work with clients to gain control of
their financial situations and invest their money more appropriately, particularly with
women.
The findings of this study also benefit policy makers in important retirement
policy decisions to assist with the distribution of limited resources to appropriate
educational programs for women, and to allocate financial subsidies to women living at
or near poverty levels. Adequate retirement savings is a problem that is not going to get
10 easier for future retirees and young workers, especially women; thus, this study may
assist women near the retirement stage when making decisions for retirement, particularly
how and where to invest (safe assets or aggressive assets).
In addition, this study may aid researchers who are interested in women and
retirement issues. Since the aging issue is often discussed as a woman’s issue,
understanding retirement savings and retirement preparedness among near-retiree women
is critical; thus, the findings of this study contribute to future progression of research in
the personal or family finance area, especially with issues regarding women.

11
CHAPTER II
LITERATURE REVIEW
This section begins with the role of public programs as a retirement income
source and followed by the changes in pensions from defined-benefit plans to defined-
contribution plans such as 401(k) accounts. This chapter also includes literature related
to retirement savings issue by socioeconomic factors (e.g., gender, age, income, marital
status, education, race, and health). The last section of this chapter presents the
conceptual framework of this study and a set of hypotheses.
Public Programs
Role of Public Sector
The role of the public sector, the government, is guaranteeing that peoples’ rights
are protected and enforced, both ethically and financially. The government collects taxes
and provides public goods to everyone without exclusion. The government also
intervenes in the economics of aging by establishing property right guarantees, subsidizes
savings, and provides social insurance and minimum income protections (Clark et al.,
2004).
In 1974, ERISA (Employee Retirement Income Security Act) provided workers
with an insurance that guaranteed pension plans during retirement. The government
requires employers to meet certain standards to participate in programs such as this.
ERISA guards against pension funds running out during retirement and does not tolerate

12 discrimination for minority workers that are eligible for company pensions (Clark et al.,
2004).
The government encourages individual savings; therefore, it grants tax exclusions
for pension plan contributions and allows earnings to grow tax-free, which helps with the
accumulation levels to be much higher. Without these government subsidies to
individuals, saving levels would be much lower. The government withholds taxes from
paychecks of employees for a social insurance program called Social Security. The
government offers Medicare to the elderly to assist with medical expenses (Clark et al.,
2004).
The role of government program is to provide its citizens with financial
protection; however, the future of the programs such as Social Security and Medicare is
uncertain for future retirees. Therefore, it is imperative that individuals educate
themselves and others on the importance of retirement planning and saving. The price of
goods and services, especially health care, will increase more and more leaving less
money for other basic needs. Near-retirees must plan better for a longer lifespan in
retirement by participating in and contributing in their defined-contribution plans.
Social Security
When Social Security was first enacted in 1935, the retirement age was set to 65.
Life expectancy rates were 12 years for men and 13 years for women. At that time, the
probability of a young man in his 20s actually surviving to age 65 was approximately
60% (women was 67%). Social Security was intended to serve as an income source

13 during the retirement years; however, with an increased population boom entering
retirement soon, the future of Social Security is rather discouraging (Munnell, 2004a).
With longer post-retirement years expected in the near future and millions of
retirees, experts are projecting the Social Security system to be completely extinguished
by 2041 and Medicare gone by 2020 (Rappaport, 2007). With many baby boomers
expecting to retire soon, the likelihood of any Social Security benefits available in the
future is dismal. The decline in Social Security benefits will lead to more poverty stricken
future women retirees. Because women live longer, their retirement savings must last
longer in order to sustain them through their life; however, the amount of retirement
money saved is low in comparison to men.
Older people receive retirement income from several different sources including
labor earnings, benefits from government and employer-sponsored pension programs,
their own personal accumulated savings (bonds, stocks, savings accounts, and real
estate), and Social Security. Approximately 86% of people aged 65 through 69 receive
Social Security benefits as an income source, while 93% of those 85 and older rely on
Social Security benefits as an income source. An additional important fact to note is that
in the poorest 40% of older people, Social Security provides over 80% of all their money
income (Clark et al., 2004).
Social Security is an overwhelming important money source for many retired
individuals. If experts are correct in their projections regarding the exhaustion of Social
Security funds (Rappaport, 2007) and retirees are depending on Social Security benefits
so heavily, many future retirees will be left without any benefits to meet their financial

14 obligations during retirement years. Personal savings through 401(k)’s and other
investments will need to be the focus of potential retirees and financial planners.
Medicare
Medicare is a medical insurance program for elderly citizens who may no longer
have employer-sponsored insurance coverage. Medicare pays for inpatient hospital
services, skilled nursing facilities, home health care, hospice care, physician and
outpatient hospital services, and prescription drugs (Munnell, 2007). Without the
Medicare program, many elderly retirees would not receive the medical attention that
they need. Approximately 75% of the costs of Medicare come from the government’s
revenues of withholding taxes. The other 25% comes from monthly premiums paid by
beneficiaries. With rising health care costs, the future of Medicare is very bleak while
some experts project it to be exhausted by 2020 (Munnell).
Medicare costs are projected to increase faster than that of Social Security due to
increased health care costs. In fact, health care costs will continue to grow faster than
income of retirees (Paulson et al., 2007). Medicare will require additional money in the
future from the working population, but is not expected to be enough to cover the added
expenses and the large amount of baby boomers entering retirement.
Additionally, rising Medicare costs would require retirees to face an 18.5%
increase in income tax rates by 2040. Retirees are also facing higher premiums and co-
payments to help recover some of the deficit caused by increased costs (Munnell, 2007).
Both Medicare and Social Security costs are projected to grow significantly faster than
the economy over the next few decades, but the income from taxes for these programs is

15 not projected to increase as quickly (Paulson et al., 2007). As much as retirees may be
dependent on the benefits of Medicare, there simply may not be enough income left over
to cover the basic necessities during retirement.
Pensions – 401(k) Accounts
Over the last two decades, pension coverage has shifted from defined-benefit
plans to defined-contribution plans. In a defined-benefit plan, an employee receives a
pension based on years of service and earnings prior to retirement. The contributions
usually come primarily from the employer. The benefits are paid out over the
employee’s remaining lifetime. Defined-contribution plans, the most common being
401(k) plans, are similar to a savings account. The employee, and often the employer,
will contribute a specific amount or percentage of earnings into the account (Munnell &
Sass, 2005).
An important aspect of the shift to defined-contribution plans is that employees
can take the accumulated money with them when they shift jobs. In a defined-benefit
plan, employees lost all pension benefits when shifting jobs. This could be detrimental to
any near-retiree that shifts jobs just prior to retirement leaving them with no retirement
savings. With a defined-contribution plan, a near-retiree employee can move the benefits
with them from job to job through a roll-over plan and avoid high tax penalties for early
withdrawal (Munnell & Sass, 2005).
In 1981, approximately 60% of employees with pensions relied on defined-benefit
plans, but in 2001, nearly 60% of employees relied solely on defined-contribution plans

16 or 401(k) plans (Munnell & Sass, 2005). With the shift from defined-benefit plans to
defined-contribution plans, it has directed the responsibility to employees to make
contributions to their retirement accounts; therefore, it is critical that near-retirees
participate in retirement plans especially if their employer matches any contributions.
Some major mistakes that employees in defined-contribution plans make are not
fully contributing to the plan, failing to diversify, over investing in their own company
stock, and making wrong decisions by cashing out 401(k) balances instead of rolling over
to an IRA or their new employer’s 401(k) plan. However, the 2004 Survey of Consumer
Finances reported that 21% of eligible workers failed to participate in defined-
contribution plans (Munnell & Sunden, 2006).
Contributions to 401(k) plans are one of the most important forms of retirement
savings (Poterba, Venti, & Wise, 2000). Since 401(k) plans have been introduced in the
early 1980s, their levels of contributions have expanded rapidly and continuously. More
and more employers are offering 401(k) plans to their employees while some companies
even match the employee contribution amounts allowing the savings levels to increase
even quicker.
Some pre-retirees choose to continue to work above age 65 instead of leaving the
labor force. Working longer not only reduces the number of retirement years that
financial support is needed, but it also increases the time for accumulation of retirement
assets. If an employee contributes to a 401(k) retirement plan, longer time in the
workforce creates a larger retirement savings amount. If an employer contributes or
matches the contribution, the amount saved increases even more. The typical

17 contribution rate for an employee is 6% of their salary with an employer match of 3%
(Munnell & Sunden, 2006). Five additional years in the work force can increase
projected retirement benefits noticeably, particularly if employers are matching
contributions. Working five more years can increase a 50-50 stock-bond portfolio
approximately 16% (from $102,800 to $119,300) (Poterba et al., 2000; Munnell &
Sunden, 2006).
In 1980, almost 92% of pension plan contributions were to traditional employer-
provided plans and about 64% were to conventional defined-benefit plans. Today,
approximately 60% of contributions are to personal retirement accounts including 401(k)
accounts, IRA’s, and Keogh plans. Over 76% of contributions are to retirement plans
that are controlled by individuals and their own contributions; therefore, it is crucial that
employees participate in these investment plans (Poterba et al., 2000). It is also crucial
that employees avoid retirement pitfalls of making bad investment decisions such as not
diversifying or over investing in their own company (Munnell & Sunden, 2006).
Gender
Women must be financially educated on the importance of retirement savings
since many of them will be left inadequately prepared to meet their future financial
obligations. Women are more concerned about retirement and less confident about their
money management abilities than men (Phoenix Home Life Mutual Insurance Co., 1997).
Women are less prepared for retirement due to factors such as more time out of the
workforce caring for children, less full-time employment with employer-sponsored

18 benefits, and lower wages. According to Munnell (2004b), near-retiree women are much
more at a disadvantage since their traditional gender roles during their lifetimes have left
them with less income and less accumulated wealth. Many of these women have left the
financial planning to someone else, such as a husband, while their priorities were with the
children or other pressing matters.
A crucial area of interest pertaining to women and retirement is lifetime earning
levels and labor force participation rates. A significant labor market change in recent
decades has been the increasing number of women in the labor force. In 2006, the labor
force participation rate for women aged 16 and over was 56.6%, while that of men was
70.1% (U.S. Department of Labor - Bureau of Labor Statistics, 2007b). Since World War
II, more women are in the labor force than previous generations; however, women’s labor
force participation rate is still low in comparison to men (Clark et al., 2004).
Even though there are more working women today, women still have lower
average earnings when compared to their male counterparts. For every dollar that a man
earns, a woman is only earning 77 cents according to the U.S. Census Bureau (DeNavas-
Walt, Proctor, & Smith, 2007). Also, the median earnings for full-time workers in 2006
were $42,261 for men and $32,515 for women. The economic outlook for working
Americans has improved dramatically as compared to earlier generations; however,
women still have lower lifetime earning rates when compared to males. Women that are
employed full-time earn approximately 25% less than men (Munnell, 2004b).
Women also have fewer years in the workforce as compared to men, 32 and 44
respectively, to care for children and other important matters (Rappaport, 2007). With

19 less labor force participation and less overall earnings but longer life spans, women’s
retirement accounts must be larger than men’s in order to sustain them through retirement
years since women live longer than men.
With the shift from defined-benefit plans to defined-contribution plans, more
women are likely to enter retirement with benefits (Munnell & Sass, 2005). Since
women tend to have more short-tenured jobs as compared to males, defined-contribution
plans can move with them from job to job. In the past, women have relied heavily on
Social Security, but with the ability to participate in defined-contribution plans, women
can better prepare themselves for retirement. However, it is imperative that women
participate in these retirement benefits.
Another factor that hurts all retirees, but especially women, is inflation. Inflation
decreases the purchasing power of the dollar making money worth less in the future than
what it is worth today (Munnell, 2004b). Since women may live up to approximately 20
years after retirement, the dollar value in the future is much less than its current rate. Due
to this natural economic tendency, retirement savings will be worth even less in the
future. For some women, the future may be very financially challenging.
Women typically work more part-time jobs in comparison to males (26% versus
11% respectively) which decreases working wages and amount of hours worked. Since
the inception of the birth control pill in the 1960s, more women have been able to control
when and how many children they have. There are still many women, however, that exit
the work-force temporarily or permanently to care for children while their husbands
remain in the workforce. Due to a temporary leave of absence for child-rearing or other

20 similar situations, the median number of years worked by women in 2000 was 32 as
compared to 44 years worked by men (Munnell, 2004b).
A major concern is the availability of retirement benefits to working women.
Since many women work part-time jobs or occupations unlikely to offer employer-
sponsored retirement benefits, their savings toward retirement is little or non-existent
through a defined-contribution (401(k), Keogh) plan. Women must be forced to invest
on their own through other savings programs. This may be very difficult due to lower
overall earning wages.
Age
Many baby boomers will be entering retirement in the next 10 years; the first
cohort of boomers will be entering retirement in 2010. However, there may be many that
are not financially prepared enough to meet their needs. Many baby boomers do not
know how much they have saved or how to plan to meet their needs (Korczyk, 2001).
Additionally, nearly two-thirds of workers do not know what their goals should be
because they do not know how much to save. Financial planners suggest having at least
70% of current income saved up for every retirement year projected. Many boomers are
expecting to live on a Social Security payment that may not be enough to meet their basic
needs during retirement such as medical expenses (“Boomers Unprepared,” 2003).
Saving for retirement is crucial for all workers, particularly for baby boomers close to
retirement age.
21 Baby boomers grew up in a different era than previous generations. Most of them
were too young, some not even born yet, to remember the Great Depression. Baby
boomers have seen considerable changes in earnings and work patterns, retirement
policy, and the economy. Baby boomers will also retire under different pension plans
than previous generations and face different Social Security retirement policies. Many
baby boomers will not be able to retire with full benefits until age 66 while younger
boomers will have to wait until age 67 causing some workers to remain longer in the
workforce than originally anticipated (Butrica et al., 2003).
Although baby boomers have seen many changes as compared to current retirees,
there is a greater importance to save for retirement due to increased life expectancies,
increased medical expenses, and an anticipated exhaustion of Social Security and
Medicare benefits. Some baby boomers are also taking more debt into retirement than
previous generations requiring an even larger savings amount (Baek & DeVaney, 2004).
While there will be an increased amount of baby boomers entering retirement, there will
also be an increased strain on Social Security, health care, and other social institutions
(DeVaney, 1995). Baby boomers must either continue working longer into retirement or
save more money in order to meet their financial obligations.
A particular area of interest among the baby boomer cohort is the women sector.
According to Baek and DeVaney (2004), female baby boomers that had a low income
level and low education levels were less likely to be financially prepared for retirement
than their male counterparts. Baby boomer women will make up a large portion of the

22 retirement population (one in eight); however, many of them are not adequately prepared
to meet their financial obligations.
Income
Income is a factor that affects the level of savings among near-retiree households.
DeVaney and Chiremba (2005) found several factors that had positive relationships with
retirement savings behavior among near-retirees such as age, education, risk tolerance,
and income. They found that households with more income were more likely to hold
larger amounts of retirement savings than households with lower income levels. As
income levels increased, the levels of retirement savings increased.
Another study by Glass and Kilpatrick (1998) found that there was a positive
relationship between the levels of income and the level of savings for retirement. As the
level of income increased, the level of retirement savings also increased among the near-
retiree households. There was a strong relationship between these two variables. They
found that as income increased the rate of diversification of aggressive assets increased
by 8.9%. Glass and Kilpatrick concluded that women with more income were more
likely to have higher levels of retirement savings.
Households that have lower income levels are more likely to experience financial
risk in addition to lower savings levels for retirement. Butricia et al. (2003) found that
households with lower income levels experienced more economic and financial hardships
than households with higher income levels. Although mean and median income levels
are projected to increase across the near-retiree cohorts, not everyone will be equally well
23 off in the baby boomer cohorts. Higher income levels were found to have a positive
relationship among higher level of savings for retirement. Income is a crucial aspect
toward a sufficient level of savings toward retirement. The higher the income levels, the
more likely there is a retirement savings plan in place for retirement.
Marital Status
Families of today no longer fit the mold of the family of earlier generations. It is
estimated that approximately 50% of couples will separate from their spouse (O’Neill,
1992). Retirement savings affects all women, but has different consequences across the
various categories of women (married, divorced, never-married, and widowed).
Economic situations have improved since earlier years, but it is still a concern for pre-
retiree women, especially for those that are not married. According to Munnell (2004b),
18% of nonmarried women fell below the poverty line in 2000. This is an alarming group
of vulnerable women with a bleak outlook during retirement.
Several studies indicate that today’s population is comprised of a large portion of
elderly people, particularly those over the age of 50 (Administration on Aging, 2006;
Butrica et al., 2003; Munnell, 2004a). Of that population group, 30% of all households
are made up of nonmarried women aged 65 - 69 and 60% aged 85 and over
(Administration on Aging). This summarizes that a large portion of our population will
consist of elderly nonmarried women that are poor or near-poor. This could greatly
impact our economy in the near future.
24 Single women are typically divorced while caring for children with limited
financial assistance from an ex-husband. After divorce, women may suffer a 73%
decrease in their living standard, while men experience an increase of 42% (O’Neill,
1992). Because of limited financial resources, nonmarried women could not save as
much toward retirement as their married women cohort may.
Nonmarried women are much worse off financially than married women who
profit from their husband’s retirement benefits. Compared to the 28% of poverty-stricken
nonmarried women, only 7% of married women aged 65 – 69 were poor or near-poor
(Munnell, 2004b). Non-married women have much less of a financial advantage in
regards to retirement savings.
According to Ozawa and Lee (2006), nonmarried women struggle to even meet
immediate financial obligations; whereas, married couple households find it easier to
save a larger portion of their income toward retirement. While married households tend to
have a higher net worth, nonmarried women were more “asset poor” (those whose net
worth is smaller than three times the poverty-line monthly income; Ozawa & Lee).
Ozawa & Lee noted that as many as 63% of female-headed households were asset poor.
In addition, nonmarried or female-headed households have lower income levels
than married women. Ozawa and Lee (2006) found that the median income of female-
headed households was $22,000, while married couples’ median income was $55,000 –
more than double. Although the total amount of debt held by nonmarried women is
smaller than married women ($27,100 and $79,876 respectively), total debt-to-total assets
for non-married women was higher than married women (23.6% and 18.5%,

25 respectively) (Ozawa & Lee). Income levels are such a crucial measurement in regards
to retirement savings for women; unfortunately, income levels for nonmarried women are
not high enough to sustain a comfortable living standard throughout retirement.
While married women can partially depend on their husband’s Social Security
benefits, there will be a significant cut after his death. Nonmarried women will have no
spousal benefits to rely on after retirement. Thus, it is critical for nonmarried women to
additionally save for retirement or to stay longer in the workforce. Marital status is a
critical factor that determines economic well-being among elderly women.
Other Sociodemographic and Economic Factors
Education
Previous research has indicated that more educated individuals earn more money
and education was positively related to retirement savings behaviors (DeVaney &
Chiremba, 2005; Ozawa & Lee, 2006). In addition, more educated people have more
knowledge regarding investments and retirement accounts (Ozawa & Lee). The
accumulation of net worth increases with levels of income and levels of income increases
due to education attainment. Less education translates into lower earnings resulting in
less accumulated retirement savings (Karamcheva & Munnell, 2007). In fact, Ozawa and
Tseng (2000) found that the net worth of people with at least some college education was
435% greater than the net worth of those people with an elementary school education.
According to Baek and DeVaney (2004), women with a lower level of education were
less likely to be financially prepared for retirement. The risk of living in poverty is lower

26 for workers with more education (U.S. Department of Labor – Bureau of Labor Statistics,
1997).
Education is a huge economic factor for women, but especially Black women.
College education had the greatest impact on the net worth value of Black women. The
net worth value of Black women with some college education was approximately 1024%
greater than the net worth of Black women with an elementary school education (Ozawa
& Tseng, 2000).
By investing in their human capital through education and job-related training,
women would increase their economic condition; therefore, their financial outlook during
retirement will increase substantially (Ozawa & Lum, 1998). For women, what really
counts is education (Ozawa & Tseng, 2000).
Race
Race is a factor that affects savings. Studies show that White households are
more likely to be financially prepared for retirement over non-White people; in particular
women (DeVaney & Chiremba, 2005; Ozawa & Hong, 2006). Non-White women are
not saving enough money toward retirement and will have less earnings and income from
assets (Ozawa & Lee, 2006). Non-White women are less likely to have personal savings
or hold a retirement account in comparison to White women (DeVaney & Chiremeba).
The net worth of Black people is much lower than White people. For example the
median net worth of Black families was $45,000 as compared to Whites at $59,999, a
difference of 42%. It was also reported that in 1992, the median net worth of White men
was $144,214, White women was $85,911, Black men was $18,785, and Black women
27 was $15,452. There was also an obvious decrease in net worth with elderly Black
women (Ozawa & Tseng, 2000).
One factor that could explain the difference in net worth between Blacks and
Whites could be attributed to the amount of inherited wealth from their own parents or
other relatives. Black families also tend to have more liquid assets (bank checking
accounts and saving accounts) than other types of assets (business assets and home
equity) that generate a greater rate of return. With both a decreased net worth and lower
lifetime earnings, which directly affects net worth, Black Americans could have less
money allocated toward retirement savings (Ozawa & Tseng, 2000).
Elderly White women and Black women, alike, have lower lifetime earnings,
more part-time jobs or jobs with fewer retirement benefits, and less time in the labor
force, but Black women have even less Social Security benefits to rely on during
retirement (Hogan & Perrucci, 2006; Ozawa & Tseng, 2000). Black women are at a
disadvantage in both employment and retirement income because they lack the resources
in order to build a suitable retirement nest egg (Hogan & Perrucci).
Taylor and Lockery (1995) noted that through tracking cohorts of Black youth,
working income through the life span could be evaluated. They speculated that Black
youths typically worked in “dead-end” jobs and occupations in the secondary labor
market where few benefits were given. The types of jobs held by Black individuals could
lead to consequences of poor work histories, unemployment and underemployment in
adulthood; therefore, they could face economic difficulties during retirement years.
28 With a lifetime of fewer earnings, part-time jobs or jobs with little or no benefits,
and less time in the work force for Black women, Black women held 90% smaller net
worth levels than did White women (Ozawa & Tseng, 2000). The lack of defined-
contribution plans during the adult years may force many Black elderly women to work
longer into retirement years. There will be many poor or near-poor elderly women, but
many more poor or near-poor Black women struggling to survive.
Health Status
Health status is an important factor that could affect savings behavior. Poor
physical health is often a reason why women leave the work force (Moen, 1996).
Because women are out of the work force due to extended illnesses, they may receive less
retirement benefits. In addition, being in poor or fair health would tend to decrease the
value of market time to the extent that it reduces one’s ability to perform tasks or even
learn new tasks providing more job advancements (Green, 2005). Investing in one’s
health is very important and should be practiced throughout the lifetime (DeVaney &
Chen, 2003).
Poor individuals are more prone to unhealthy lifestyles such as enhanced risk
factors (drugs or alcohol) and less access to health care, including preventative care and
maternity care. Poor individuals also tend to live in less healthy environments and work
in more physically demanding jobs which may result in an unexpected earlier retirement
(Deaton & Paxson, 1998). Those that reported healthier lifestyles typically were
associated with higher productivity which may be rewarded with higher pay. In addition,
women enjoying a healthier lifestyle also increase the probability that she is employed

29 resulting in more time to accumulate retirement savings (Green, 2005). Elderly women
with poor health dissave at high rates. Solda, Hurd, Rodgers, and Wallace (1997)
explained that those with poor health have high medical expenses and may anticipate
dying soon; therefore, may choose to consume their resources quickly.
Conceptual Framework
Life Cycle Savings Theory
The process of aging, from birth to death, can be depicted as an economic model
called the Life Cycle Savings model. Throughout a person’s life of income and
expenditures, decisions are made which ultimately affect retirement. The basis of the
Life Cycle Savings model is that expenditures exceed income in both early adulthood
(before age 20 – 25) and in later years (retirement after age 60 – 65) while income
exceeds expenditures in middle adulthood (Bryant, 1990).
Young individuals expect low incomes due to completing an education and then
beginning a career. Young workers expect their incomes to rise as experience and
responsibility is obtained through employment. During middle adulthood, income
exceeds expenditures due to completed education and a stable career. This is the time
period when it is expected that workers are repaying loans and saving for retirement.
Workers must save enough money so that at the time of retirement, they can live off the
accumulated savings until death (Clark et al., 2004). During the retirement stage of the
life cycle, expenditures exceed income as in the early adulthood stage. Retirees will
consume accumulated income that was saved during middle adulthood.

30
Not only do individuals expect a stream of income in the future, but it is also
expected that the stream of income will vary over the life cycle (Bryant, 1990). Although
individuals expect incomes to vary, there is less variation in consumption patterns over
the life cycle. Individuals continue the need to be fed, clothed, and housed. There is a
need to shift resources from periods of high income to periods of lower income in order
to provide consumption needs. This is done through borrowing from the future through
student loans, mortgage payments, etc. in order to provide for current consumption.
During times of high income, saving for future consumption and paying back past debt is
expected. Households with the same total resources will demand the same goods and
services each year, some may require more while some may require less, but each
household will try to have a constant consumption stream over the life cycle.
This study looks at the savings behaviors and accumulations of individuals in the
near-retirement stage of the life cycle. The life cycle savings model provides a
conceptual framework of this study to what extent individuals in the near-retirement stage
have or don’t have savings that can support their retirement years. Based on findings of
previous studies and the life cycle savings model, the following set of hypotheses can be
developed.
Hypotheses
Gender
Munnell (2004b) reported that in 2006, the median earnings for full-time working
men was $42,261 while women’s earnings were $32,515. In addition, Munnell also

31 indicated that 26% of women work part-time in comparison to 11% of men. Due to more
part-time employment, fewer retirement benefits were available to women. Since women
live longer than men, women must accumulate a higher level of savings; however women
are leaving the work force with 40% less savings than men (Buffa, 1995). Thus, this
study hypothesizes that near-retiree women will have lower levels of savings than near-
retiree men.
Many women are not educated on the various types of investment vehicles that
are available and women are more familiar with certificates of deposit and savings bonds
instead of investing in aggressive assets such as mutual funds, stocks, annuities, and
corporate and municipal bonds. Bajtelsmit and Bernasek (1996) found that women and
men differ in investment decisions and women tend to save less, know less about
investing, and invest more conservatively than men. Alcon (1999) also noted that women
can manage household budgets well; however, they lack the appropriate knowledge with
riskier investments. This study, therefore, hypothesizes that women will be less likely to
invest in aggressive assets than men (H1-a) and that women will have lower level of
savings than men (H1-b).
Age
Many baby boomers will not be able to retire until age 66, while younger
boomers will have to wait until age 67 due to low levels of accumulated retirement
savings (Butricia et al., 2003). More and more baby boomers are taking higher debt loads
into retirement than previous generations (Baek & DeVaney, 2004). Baby boomers will
make up a large portion of the population; however, many of them are not prepared for
32 retirement (Baek & DeVaney). Using the 2000 HRS data, the baby boomers were those
individuals aged 51 – 54 in year 2000 and non-boomers were those aged 55 – 64 in year
2000. Therefore, this study hypothesizes that there will be a negative relationship
between age and the level of savings among near-retiree women. In other words, baby
boomer women (ages 51 – 54) will have lower level of savings than non-boomer women
(ages 55 – 64; H2).
Income
In previous research, it was found that households with higher income levels
were more likely to be financially prepared for retirement than households with lower
income levels (DeVaney & Chiremba, 2005). Glass and Kilpatrick (1998) also found
that the savings levels increased as income increased for near-retiree households. In
particular, Glass and Kilpatrick stated that women with more income were more likely to
have higher levels of retirement savings. Household income among near-retiree women
can have a significant task in the accumulation of retirement savings; therefore, it is
hypothesized that there will be a positive relationship between income and the level of
savings among near-retiree women (H3).
Marital Status Munnell (2004b) reported that single women were not entitled to a portion of their
husband’s benefits that married women will use during retirement; therefore, non-married
women were financially worse off than married women in retirement. Munnell also
reported that 28% of single older women were either poor or near poor. Therefore, this

33 study hypothesizes that non-married women will have a lower level of savings than their
married counterparts (H4).
Education
Previous research has indicated that more educated people had more knowledge
regarding retirement savings and investments (DeVaney & Chiremba, 2005; Ozawa &
Lee, 2006). Baek and DeVaney (2004) found that women with less education had lower
levels of accumulated retirement savings and were less prepared for retirement.
Therefore, this study hypothesizes that education level will be positively related to the
level of savings among near-retiree women (H5).
Race
Based on the literature, White households are more likely to be financially
prepared for retirement than non-White households (DeVaney & Chiremba, 2005; Ozawa
& Hong, 2006). Non-White women had lower net worth levels and lower earnings than
White women (Ozawa & Tseng, 2000). Therefore, this study hypothesizes that non-
White near-retiree women will have a lower level of savings than White near-retiree
women (H6).
Health Status
According to Moen (1996), poor health was often a factor associated with individuals
leaving the work force. Poor health tends to decrease the time in the work force; as a
result, it reduced the ability for job advancement or pay raises (Green, 2005). Green also
reported that healthier individuals worked longer; therefore, they were able to accumulate

34 higher levels of savings. Therefore, this study hypothesizes that near-retiree women with
poor health will have a lower level of savings than near-retiree women with excellent
health (H7).
The hypotheses of this study can be summarized as the following:
H1: (a) Women will be less likely to invest in aggressive assets than men.
(b) Women will have a lower level of savings than men.
H2: Baby boomer women will have a lower level of savings than non boomer
women.
H3: There will be a positive relationship between household income and the level of
savings among near-retiree women.
H4: Non-married women will have a lower level of savings than married women.
H5: There will be a positive relationship between the level of education and the level
of savings among near-retiree women.
H6: Non-Whites will have a lower level of savings than White near-retiree women.
H7: Near-retiree women with poor health will have a lower level of savings than
near- retiree women with excellent health.
35
CHAPTER III
METHODS
Women must accumulate enough retirement savings to last throughout an
extended retirement period in comparison to men but still generate enough income to live
comfortable. This study seeks to answer the questions: how much less do near-retiree
women aged 51 - 64 save than near-retiree men aged 51 - 64 and how do women invest
differently than men? While focusing on gender differences in saving and investment
behavior, this study also investigates how socio-economic characteristics influence the
saving and investment behavior among individuals in the near-retirement stage. This
chapter provides a description of the data and sample, data analysis, and definitions of the
variables for the study.
Data and Sample
Data
Data for the study are drawn from the 2000 Health and Retirement Study (HRS).
The HRS is a nationally representative, longitudinal survey of individuals over 50 years
of age. The main goal of the HRS is to provide data that enable research and analysis in
support of policies on retirement, savings, and economic well-being of older households.
This study utilizes the 2000 Rand HRS data file which is a cleaned version of the Health
and Retirement Study (HRS). The Rand HRS file was developed by the Rand Center for
the Study of Aging with funding from the National Institute on Aging (NIA) and Social
Security Administration (SSA).

36 Sample
Using the 2000 Rand HRS data file, the sample for this study includes households
headed by near-retirees aged 51 - 64. With respect to sample selection, observations for
which there are missing values for one or more of the variables used in the analysis were
dropped. This procedure results in a study sample of 7,922 individuals aged 51 - 64 in
the 2000 Rand HRS data. This study selected individuals aged 51 - 64 as near-retirees
and resulted in near-retiree women (n = 4,525) and near-retiree men (n = 3,397).
Data Analysis
Percentages, means, and medians were calculated for all variables in the analyses
to obtain the descriptive statistics of the study sample. The t tests and chi-square tests
were conducted to understand the differences in the socio-demographic and economic
characteristics between near-retiree women and men aged 51 - 64. The t tests were
performed to present the differences in the average dollar value in stocks, checking and
savings accounts, CDs, savings bonds, and T-bills, bonds, real estate assets, the net value
of the primary home, and net worth between near-retiree women and men aged 51 - 64.
Logistic regression analyses were conducted to identify factors associated with
the likelihood of holding aggressive assets among near-retiree women and men aged 51 -
64. Ordinary least squares (OLS) regression analyses were performed to investigate
socio-economic factors that influence level of savings among near-retiree women and
men aged 51 - 64. SAS software, version 8.2, was used for statistical analyses.
37
Variables
Dependent Variables
In the multivariate logistic regression model, the dependent variable measured the
likelihood of holding aggressive assets (i.e., stocks). In this study, a binary variable (1 if
have dollar amounts in stocks; 0 otherwise) was created in the logistic regression models
for the total sample (N = 7,922), female sample (n = 4,525), and male sample (n = 3,397).
To measure the level of household savings among near-retiree women and men aged 51 -
64, this study included the level of net worth as the dependent variable in the OLS
regression models for the total sample, female sample, and male sample.
Explanatory Variables
The main purpose of this study was to understand how much less do near-retiree
women save than men for retirement and how do women invest differently than near-
retiree men. To identify the effects of gender on the likelihood of holding stocks and the
level of net worth, dummy categorical variables for gender (females and males) were
included in both the logistic and OLS regression models. Variables reflecting the socio-
economic characteristics of near-retiree women and near-retiree men consisted of
household income, age, marital status, education, race, and self-reported health. The
measurements of the explanatory variables in the multivariate analyses are presented in
Table 1.
More specifically, as for the gender variable, male was the reference category and
female was included in both the Logistic and OLS regression models. Income was a

38
Table 1
Variable Measurements (N=7,922) Variables Measurement Dependent Variables
Stock ownership 1 if have dollar amounts in stocks, 0 if otherwise
Net worth Total of all assets - all debts Explanatory Variables
Gender:
(Male) 1 if male, 0 if otherwise
Female 1 if female, 0 if otherwise
Income Continuous, total household income
Age:
Boomer 1 if ages 51 - 54, 0 if otherwise
(Non-boomer) 1 if ages 55 - 64, 0 if otherwise
Marital Status:
(Married) 1 if married, 0 if otherwise
Divorced 1 if divorced/separated, 0 if otherwise
Widowed 1 if widowed, 0 if otherwise
Never-married 1 if never-married, 0 if otherwise
Education:
(Less than high school) 1 if less than high school, 0 if otherwise
High school 1 if high school graduates, 0 if otherwise
Some college 1 if some college education, 0 if otherwise
College education 1 if college graduates or advanced, 0 if otherwise
Race:
(White) 1 if Whites, 0 if otherwise
Non-White 1 if Blacks, Hispanics, Asians, others, 0 if otherwise
Self-reported health:
Fair/poor 1 if fair/poor, 0 if otherwise
Good 1 if good, 0 if otherwise
Very good 1 if very good, 0 if otherwise
(Excellent) 1 if excellent, 0 if otherwise
Note. Reference categories in the multivariate analyses are presented in parentheses.
39 continuous variable which was the dollar value of total household income. Age was a
categorical variable: baby boomer (ages 51 - 54 = reference category) and non-boomer
(ages 55 - 64). Other socio-demographic characteristics included marital status [(married
= reference category), divorced/separated, widowed, and never-married]; education [(less
than high school = reference category), high school graduate, some college education,
and college graduate or advanced degree]; race [(Whites = reference category), non-
Whites including Blacks, Hispanics, and Asians/others]; and health status [(excellent =
reference category), fair/poor, good, and very good].

40
CHAPTER IV
RESULTS
The first purpose of this study is to examine what types of assets near-retiree
women hold and to what extent near-retiree women have accumulated savings as
compared to their male counterparts. The second purpose of this study is to investigate
what socioeconomic factors (income, age, marital status, race, education, and health) are
associated with the holdings of aggressive assets and level of savings among near-retiree
women and men aged 51 - 64. This chapter reports the results of t tests, chi-square tests,
logistic regression analyses, and OLS regression analyses.
Socioeconomic Profiles of Near-Retiree Women and Men
Table 2 profiles the socio-economic characteristics of near-retiree women and
men in this study. Except for self-reported health, there were significant differences in all
socio-economic characteristics (income, age, marital status, education, and race) between
near-retiree women and men. The average household income of the male group
($74,697) was much higher than for the female group ($60,641). Both the female and
male samples of this study included a higher proportion of older households (non-
boomers aged 55 - 64) than younger households (boomers aged 51 - 54).
Table 2 reports the marital status of the female and male sample in the study.
Overall, the samples of this study include a higher proportion of married individuals than
divorced, widowed, and never-married individuals. As for education, there was a higher
proportion of men than women in the category of college education. There were slightly

41
Table 2
Socio-Economic Profiles of Women and Men Aged 51-64
Women Men
Variables (n = 4,525) (n = 3,397) Test Statistics
Income $60,641a $74,697 t = 5.90***
$41,160b $53,200
Age:
Boomer (51 - 54) 20.4% 15.3% χ2=34.570***
Non-boomer (55 - 64) 79.6% 84.7%
Marital Status:
Married 72.3% 84.5% χ2=237.221***
Divorced 14.3% 10.4%
Widowed 10.5% 2.5%
Never-married 2.9% 2.6%
Education:
Less than high school 24.6% 24.3% χ2=77.039***
High school 34.8% 28.9%
Some college 22.8% 21.3%
College education 17.8% 25.5%
Race:
White 80.3% 83.3% χ2=11.645***
Non-White 19.7% 16.7%
Self-reported health:
Fair/poor 22.3% 21.4% χ2=7.046
Good 27.9% 30.6%
Very good 33.0% 32.1%
Excellent 16.8% 15.9%
a Mean Level, b Median Level
*p < .05. **
p < .01. ***p < .001.
42 more women than men with a high school education (34.8% women and 28.9% men).
Table 2 shows that 80.3% of the females were White, while 83.3% of the male sample
was White. Overall, the majority of the study sample consisted of White women and men
versus non-White women and men.
Based on the results of the t tests and chi-square tests in Table 2, it can be
summarized that men had higher levels of mean income than women; there was a higher
proportion of non-boomer women and men (those aged 55 - 64) than boomer women and
men (those aged 51 - 54); there was a higher proportion of married women and men than
divorced, widowed, or never married women and men; there was a higher proportion of
women and men at the high school education level than any other level in the education
category; and there was a higher proportion of White women and men than non-White
women and men.
Financial Profiles of Near-Retiree Women and Men
Levels of Assets for Near-Retirees
Table 3 compares dollar holdings for near-retiree women and men. The results of
the t tests report that there was statistical significance in the differences in the average
dollar value in IRAs, transportation assets, business equity, and net worth between near-
retiree women and men. However, there was no statistical significance in the difference
of the average dollar value in stocks, checking and savings accounts, CDs, savings bonds,
and T-bills, bonds, other savings, other real estate, and the net value of the primary home
between near-retiree women and men in this study.

43 Table 3 shows that the average level of dollar amounts in stocks for the female
group was $56,456, while that in checking and savings accounts was $17,562. The
average level of dollar amounts in CDs, savings bonds, and T-bills was $9,024 among
near-retiree women, while that in bonds was $5,371. The average level of dollar holdings
in IRA accounts was $59,803. The level of dollar holdings in other savings was $10,084.
The average level of dollar holdings in transportation was $15,243. The level of dollar
holdings in business assets was $31,186 for near-retiree women. The average level of
dollar holdings in other real estate for near-retiree women was $42,328. Near-retiree
women reported that the average level of dollar holdings in the primary home was
$98,911. The average value of net worth for near-retiree women was $341,961.
Table 3 reports that the average level of dollar amounts in stocks for men in this
study was $72,440, while that in checking and savings accounts was $19,415. The
average level of dollar amounts in CDs, savings bonds, and T-bills was $7,546. However,
the average level of dollar holdings in bonds was only $5,576. The dollar holdings in
IRA accounts show a relatively higher level with an average of $68,158. Table 3
indicates that an average level of dollar holdings in other savings was $11,925 and the
level of dollar holdings in transportation was $19,076. The average level of dollar
holdings in business assets was $45,129 and that in other real estate was $53,536. The
males report that the average level of dollar holdings in the primary home was $106,002
and the average value of net worth was $404,227.

44
Table 3
Financial Profiles of Women and Men Aged 51-64 (N = 7,922) Women Men
Variables (n = 4,525) (n = 3,397) Test Statistics
Stocks $56,456 $72,440 t = 1.41
Checking/Saving accounts $17,562 $19,415 t = 1.56
CD/Savings bonds/T-bills $9,024 $7,546 t = 1.27
Bonds $5,371 $5,576 t = .17
Total IRA $59,803 $68,158 t = 2.07*
Other savings $10,084 $11,925 t = 1.02
Transportation $15,243 $19,076 t = 3.03***
Business assets $31,186 $45,129 t = 1.89*
Other real estate $42,328 $53,536 t = 1.23
Home equity: net value $98,911 $106,002 t = .92
of primary home
Net worth $341,961 $404,227 t = 2.22*
*
p < .05. **p < .01. ***
p < .001.

45 Types of Assets Owned by Near-Retirees
Table 3-1 compares types of assets owned by near-retiree women and men. Table
3-1 indicates the percent of women and men who reported dollar amounts for each asset
category. It can be seen that 33.4% of near-retiree women held stocks and 86.7% of them
had holdings in checking and savings accounts. It shows that 22.8% of near-retiree
women had holdings in CDs, savings bonds, and T-bills. Only 6.9% of them had
holdings in bonds. There were 44.4% of near-retiree women that had holdings in IRA
accounts. Only 17.7% of the women sample reported dollar holdings in other savings.
There were 89.7% of near-retiree women that had transportation. Only 10.8% of the
female sample had holdings in business assets. There were 20.6% of near-retiree women
households that had holdings in other real estate in this study. There were 84.2% of near-
retiree female households that reported home ownership. Most of the females (95.8%)
reported a positive net worth value.
Table 3-1 indicates that only 36.2% of males had dollar holdings in stocks and
86.6% of them had holdings in checking and savings accounts. It shows that 22.7% of
males had holdings in CDs, savings bonds, and T-bills. However, only 7.0% of them had
holdings in bonds. There were 46.7% of males that indicated they had holdings in IRA
accounts and 18.1% of them reported that they had holdings in other savings. There were
93.2% of near-retiree men that had transportation. Thirteen percent of males indicated
that they had holdings in business assets. There were 23.1% of males that reported
holdings in other real estate. There were 85.2% of males that reported home ownership.
Most of the males (96.7%) reported a positive net worth value.
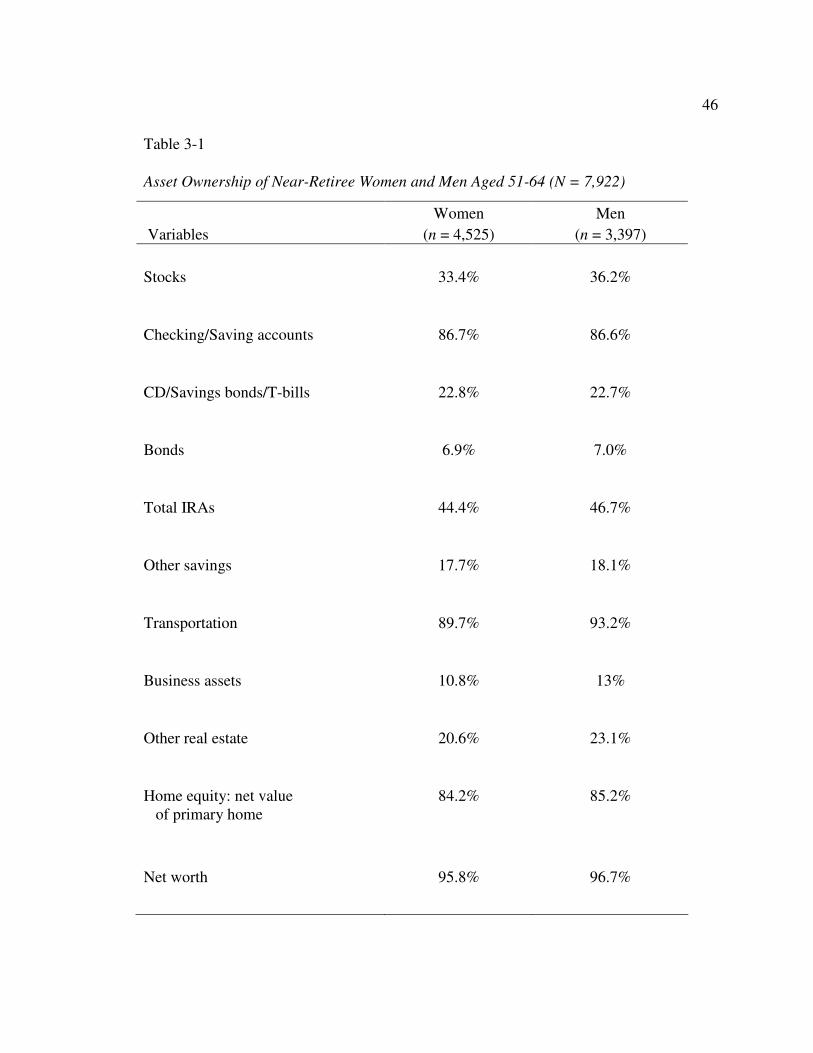
46
Table 3-1
Asset Ownership of Near-Retiree Women and Men Aged 51-64 (N = 7,922)
Women Men
Variables (n = 4,525) (n = 3,397)
Stocks 33.4% 36.2%
Checking/Saving accounts 86.7% 86.6%
CD/Savings bonds/T-bills 22.8% 22.7%
Bonds 6.9% 7.0%
Total IRAs 44.4% 46.7%
Other savings 17.7% 18.1%
Transportation 89.7% 93.2%
Business assets 10.8% 13%
Other real estate 20.6% 23.1%
Home equity: net value 84.2% 85.2% of primary home
Net worth 95.8% 96.7%

47 A Comparison of Financial Assets
Between Near-Retiree Women and Men
Table 3 shows the results of the t tests, indicating that the average level of dollar
amounts in stocks for the female group was $56,456, while that for the male group was
$72,440. Table 3-1 shows that a relatively higher portion of the male group than the
female group owned stocks. However, based on the results of the t tests, the average
dollar value of stocks was not statistically significant between women and men.
Table 3 indicates that the average levels of all asset categories for the men group
where much greater than they were for the women group except CDs, savings bonds, and
T-bills. The average levels of CDs, savings bonds, and T-bills were $9,024 and $7,546
for female and male groups, respectively. The average level of dollar amounts in
checking and savings accounts for males was $19,415 and the average level of dollar
amounts was $17,562 for females.
The average levels of dollar amounts in bonds were $5,576 for males and $5,371
for females. The average levels of dollar amounts in IRA accounts were $68,158 for
males and $59,803 for females. The average level of dollar amounts in other savings was
$11,925 for males, whereas that of females was $10,084. The average levels of dollar
amounts in transportation were $19,076 for males and $15,243 for females.
The average levels of dollar amounts in business assets were $45,129 for males
and $31,186 for females. The average levels of dollars amounts in other real estate were
$53,536 for males and $42,328 for females. The average levels of net value in the
primary home were $106,002 for males and $98,911 for females. The average level of

48 net worth for males was $404,227, while females reported an average level of net worth
as $341,961.
According to Table 3-1, the percentages of both groups that had asset holdings in
the various financial asset categories were greater for males in all areas except for
checking and savings accounts and CDs, savings bonds, and T-bills. It was reported that
36.2% of males owned stocks and 33.4% of females owned stocks. Bonds were the
lowest asset category for both males and females. The mean values of bonds for both
groups were also similar at about $5,400. It was reported that 46.7% of males and 44.4%
of females had dollar holdings in IRA accounts. It was reported that 23.1% of males had
dollar holdings in real estate and 20.6% of females had holdings in real estate.
It can be summarized that the majority of the study sample had dollar values in
checking and savings accounts; however, less than half of both the female and male
groups had dollar amounts in IRAs. A small portion of both the female and male groups
had dollar amounts in bonds in their asset holdings. Approximately 7% of both the
female and male groups reported dollar amounts in bonds. Most of the female and male
groups were homeowners.
Logit Results of the Likelihood of Owning Aggressive Assets
Total Sample
Table 4 presents factors affecting the likelihood of owning aggressive assets for
near-retirees aged 51 - 64. This study hypothesized that women were less likely to invest
in aggressive assets than men (Hypothesis 1-a). However, there was no statistical
49 significant difference in the coefficient associated with gender; thus, Hypothesis 1-a was
not supported. On the other hand, the results of the logistic regression analysis indicated
that income, income squared, age, marital status, education, race, and self-reported health
were all statistically significant predictors of the likelihood of owning aggressive assets
for near-retirees aged 51 - 64.
The relationship between household income and the likelihood of having
aggressive assets among near retirees was significant and positive. The likelihood of
owning aggressive assets increased as the level of household income increased. Since the
coefficient associated with the income squared term was significant and negative, it can
be said that there is a curvilinear relationship between income and the likelihood of
holding aggressive assets among near-retirees.
The results of the logistic regression analysis indicated that near-retirees aged 51 -
54 (boomers) were less likely to own aggressive assets than were near-retirees aged 55 -
64 (non-boomers). In fact, boomers were 21% less likely to own aggressive assets than
were non-boomers. Table 4 reports that marital status was a predictor of the likelihood of
having aggressive assets. Divorced, widowed, and never married near-retirees were less
likely to own aggressive assets than were married near-retirees. Specifically, the odds
ratio showed that compared to married near-retirees, divorced, widowed, and never
married near-retirees were 47%, 27%, and 30% less likely to own aggressive assets,
respectively.
The findings from Table 4 also indicate that as compared to near-retirees with less
than a high school education, near-retirees with at least a high school diploma were 152%

50
Table 4
Logistic Regression Results for Aggressive Asset Ownership
Among Near-Retirees (N = 7,922)
Parameter Odds
Variable Estimate p-value Ratio
Income 7.3 E - 6 0.0001 *** 1.000
Income squared -1.3 E - 4 0.0001 *** 1.000 Gender: (Male)
Female 0.0711 0.1895 1.074 Age: (Non-boomer, aged 55 - 64)
Boomer, aged 51 - 54 -0.2414 0.0004 *** 0.786 Marital Status: (Married)
Divorced -0.6367 0.0001 *** 0.529
Widowed -0.3136 0.0070 ** 0.731
Never married -0.3539 0.0402 * 0.702 Education: (Less than high)
High school 0.9243 0.0001 *** 2.520
Some college 1.2021 0.0001 *** 3.327
College education 1.5320 0.0001 *** 4.627 Race: (White)
Non-White -0.7680 0.0001 *** 0.464 Self-reported health: (Excellent)
Fair/poor -0.7229 0.0001 *** 0.485
Good -0.3873 0.0001 *** 0.679
Very good -0.0412 0.5791 0.960 Intercept -1.5955 .0001 ***
Log Likelihood
χ2
8625.335 1593.0035***
Note. Reference categories are presented in parentheses. *p < .05. **
p < .01. ***p < .001.

51 more likely to have aggressive asset ownership, while near-retirees with some college
education or a college education were 233% and 363% more likely to have aggressive
assets, respectively. The higher level of education near-retirees obtained, the more likely
they were to own aggressive assets.
As compared to White near-retirees, non-White near-retirees were less likely to
have aggressive asset ownership. The odds ratio shows that non-White near-retirees were
54% less likely to own aggressive assets than were White near-retirees. The results also
show that as compared to near-retirees in excellent health, those who reported fair/poor or
good health were 51% and 32%, respectively, less likely to have aggressive assets. The
poorer they reported their health status, the less likely they were to own aggressive assets.
Female Sample
This study examined the likelihood of women in the retirement stage owning
aggressive assets and emphasized how they have saved for retirement. Table 4-1 presents
factors affecting the likelihood of owning aggressive assets for near-retiree women aged
51 - 64. The results of the logistic regression analysis indicated that income, income
squared, age, marital status, education, race, and self-reported health were all statistically
significant predictors of the likelihood of owning aggressive assets among near-retiree
women.
The relationship between household income and the likelihood of having
aggressive assets among near-retiree women was significant and positive. That is, the
likelihood of owning aggressive assets increased as the level of household income
increased. The coefficient associated with the income squared term was significant and

52 negative. Thus, it can be said that as the level of income continued to increase, the
likelihood of holding aggressive assets decreased at a certain point.
The results of the logistic regression analysis indicated that near-retiree women
aged 51 - 54 (boomers) were less likely to own aggressive assets than were near-retiree
women aged 55 - 64 (non-boomers). The odds ratio showed that boomer women were
23% less likely to own aggressive assets than were older non-boomer women.
Table 4-1 indicated that marital status was a predictor of aggressive asset
ownership. Divorced near-retiree women were less likely to own aggressive assets than
were their married counterparts. The odds ratio showed that compared to married near-
retiree women, divorced near-retiree women were 45% less likely to own aggressive
assets than their married counterparts. The results of the logistic regression analysis
indicated that compared to married near-retiree women, widowed and never married
near-retiree women were less likely to own aggressive assets than married near-retiree
women; however, the results were not statistically significant.
The findings from Table 4-1 also suggest that as compared to near-retiree women
with less than a high school education, near-retiree women with at least a high school
diploma were 150% more likely to own aggressive assets, while near-retiree women with
some college education or a college education were 214% and 315% more likely to have
aggressive assets, respectively. The higher the education levels among near-retiree
women, the more likely women in the near retirement stage were to own aggressive
assets.
Table 4-1 shows that compared to White near-retiree women, non-White near-

53
Table 4–1
Logistic Regression Results for Aggressive Asset Ownership
Among Near-Retiree Women (n = 4,525)
Parameter Odds
Variable estimate p-value ratio
Income 1.1 E - 5 0.0001 *** 1.000
Income squared -8.7 E - 4 0.0001 *** 0.999
Age: (Non-boomer, aged 55 - 64)
Boomer, aged 51 - 54 -0.2638 0.0030 *** 0.768
Marital Status: (Married)
Divorced -0.5944 0.0001 *** 0.552
Widowed -0.2054 0.1154 0.814
Never married -0.3014 0.1930 0.740
Education: (Less than high)
High school 0.9162 0.0001 *** 2.500
Some college 1.1449 0.0001 *** 3.142
College education 1.4222 0.0001 *** 4.146
Race: (White)
Non-White -0.8128 0.0001 *** 0.444
Self-reported health: (Excellent)
Fair/poor -0.8237 0.0001 *** 0.439
Good -0.4485 0.0001 *** 0.639
Very good -0.0166 0.8664 0.984
Intercept -1.6732 .0001 ***
Log Likelihood
χ2
4761.766 1003.7573***
Note. Reference categories are presented in parentheses. *p < .05. **
p < .01. ***p < .001.

54 retiree women were less likely to own aggressive assets. The odds ratio showed that non-
White near-retiree women were 56% less likely to own aggressive assets than were White
near-retiree women aged 51 - 64. The results also indicated that as compared to near-
retiree women in excellent health, those who reported fair/poor and good health were
56% and 36%, respectively, less likely to own aggressive assets. The poorer the self-
reported health among near-retiree women, the less likely they owned aggressive assets.
Male Sample Table 4-2 presents factors affecting the likelihood of owning aggressive assets
among near-retiree men aged 51 - 64. Similar to the results of the logistic regression
analysis for near-retiree women, the results of the logistic regression analysis for near-
retiree men indicated that income, income squared, age, marital status, education, race,
and self-reported health, were all statistically significant predictors of the likelihood of
near-retiree men owning aggressive assets. Based on the findings of the logistic
regression analysis, the significant socioeconomic factors affecting the likelihood of
having aggressive assets were similar between near-retiree women and men.
Similar to the results of the female sample, the likelihood of owning aggressive
assets increased as the level of household income increased among near-retiree men. The
coefficient associated with the income squared term was significant and negative. Thus, it
can be said that there is a curvilinear relationship between income and the likelihood of
holding aggressive assets among near-retiree men.
The age of near-retiree men was also statistically significant in predicting
aggressive asset ownership. Table 4-2 shows that near-retiree men aged 51 - 54

55 (boomers) were less likely to own aggressive assets then were near-retiree men aged 55 -
64 (non-boomers). Boomer men were 21% less likely to own aggressive assets than were
older non-boomer men.
Table 4-2 reported that marital status was a significant predictor of owning
aggressive assets among near-retiree men. Similar to the results of the female sample,
only the coefficient associated with divorce was statistically significant, indicating that
divorced near-retiree men were less likely to own aggressive assets than were married
near-retiree men. The odds ratio reported that compared to near-retiree married men,
divorced near-retiree men were 41% less likely to own aggressive assets.
The findings from Table 4-2 also indicated that as compared to near-retiree men
with less than a high school education, near-retiree men with at least a high school
diploma were 143% more likely to own aggressive assets, while near-retiree men with
some college education or a college education were 240% and 375% more likely to have
aggressive assets, respectively. The higher the level of education that near-retiree men
obtained, the more likely they were to own aggressive assets.
The race of near-retiree men was a significant predictor of having aggressive
assets. Table 4-2 indicated that compared to White near-retiree men, non-White near-
retiree men were less likely to own aggressive assets. The odds ratio indicated that non-
White near-retiree men were 49% less likely to own aggressive assets than were White
near-retiree men. The findings also indicated that as compared to near-retiree men in
excellent health, those who reported fair/poor or good health were 41% and 24% less
likely to own aggressive assets. The poorer near-retiree men reported their health status,

56
Table 4-2
Logistic Regression Results for Aggressive Asset Ownership
Among Near-Retiree Men (n = 3,397)
Parameter Odds
Variable estimate p-value ratio
Income 6.8 E - 6 0.0001 *** 1.000
Income squared -1.2 E - 4 0.0001 *** 1.000
Age: (Non-boomer, aged 55 - 64)
Boomer, aged 51 - 54 -0.2372 0.0311 * 0.789
Marital Status: (Married)
Divorced -0.5340 0.0002 *** 0.586
Widowed -0.3373 0.2365 0.714
Never married -0.2676 0.3080 0.765
Education: (Less than high)
High school 0.8894 0.0001 *** 2.434
Some college 1.2222 0.0001 *** 3.395
College education 1.5575 0.0001 *** 4.747
Race: (White)
Non-White -0.6735 0.0001 *** 0.510
Self-reported health: (Excellent)
Fair/poor -0.5229 0.0002 *** 0.593
Good -0.2814 0.0183 * 0.755
Very good -0.0623 0.5874 0.940
Intercept -1.6472 .0001 ***
Log Likelihood
χ2
3805.643 640.6295***
Note. Reference categories are presented in parentheses. *p < .05. **
p < .01. ***p < .001.

57 the less likely they were to own aggressive assets.
OLS Results of Net Worth
Total Sample
This study attempted to understand how near-retiree women saved; how the levels
of savings were different between near-retiree women and men; and what factors were
associated with the levels of savings among near-retiree women and men. Table 5
reports the OLS results of net worth to measure the level of savings among near-retirees
aged 51 - 64, and the results show significant factors that determine the levels of net
worth for individuals in the near-retirement stage. The adjusted R squared is .36,
indicating that the independent variables in the model (income, income squared, gender,
age, marital status, education, race, and self-reported health) explained about 36% of the
variance in net worth. The F-statistics indicated that the model of independent variables
is appropriate for understanding the level of net worth. Among the socioeconomic
characteristics, household income, boomers aged 51 - 54, divorced, high school, some
college, college education, non-White, fair/poor health, and good health were the
significant factors that affected the levels of net worth for near-retirees aged 51 - 64.
This study hypothesized that women would have lower levels of savings than did
men (Hypothesis 1-b). However, the coefficient associated with females was not
statistically significant, indicating that there was no significant difference between near-
retiree women and near-retiree men in the level of net worth. Therefore, Hypothesis 1-b
was not supported.
58
The OLS results reported that the effects of income on the level of net worth show
significant and positive effects. It shows that net worth increased as household income
increased. For every one dollar in income increase, there was an increase of three dollars
in net worth. The coefficient associated with the income squared term was significant
and positive. Thus, it can be said that as household income continued to increase, near-
retirees increased their level of savings. It is evident that boomer near-retirees (aged 51 -
54) had significantly lower amounts of net worth than did non-boomer near-retirees (aged
55 - 64). Boomer near-retirees had approximately $129,399 less in net worth than did
non-boomer near-retirees.
Marital status could be an important factor in predicting the level of savings
among near-retirees. Table 5 shows that the coefficient associated with the dummy
variable of the divorced in the model was statistically significant, indicating that all else
being equal, divorced near-retirees held significantly $101,144 less in net worth than did
married near-retirees.
Education shows a significant and positive impact on the level of savings among
near-retirees. It can be said that all else being equal, near-retirees with a college
education or post high school education held higher levels of net worth compared to near-
retirees with no high school diploma. Race of the retirees was significant, indicating that
all else being equal, non-White near-retirees had $137,850 less in net worth than did
White near-retirees. Table 5 shows the significant effect of self-reported health status on
the level of net worth among near-retirees. It can be said that compared to near-retirees
with excellent health, near-retirees with poorer health had lower levels of net worth.

59
Table 5
OLS Results of Net Worth Among Near-Retirees (N = 7,922)
Parameter Standard
Variable estimate error p-value
Income 3.013 0.160 0.000***
Income squared 121.128 4.696 0.000***
Gender: (Male)
Female 18,343 21,861 0.401
Age: (Non-boomer, aged 55 - 64)
Boomer, aged 51 - 54 -129,399 27,708 0.000***
Marital Status: (Married)
Divorced -101,144 32,923 0.002***
Widowed -25,141 42,825 0.557
Never married -90,279 65,420 0.167
Education: (Less than high)
High school 86,151 29,107 0.003**
Some college 133,749 32,254 0.000***
College education 204,052 34,741 0.000***
Race: (White)
Non-White -137,850 28,086 0.000***
Self-reported health: (Excellent)
Fair/poor -106,348 36,528 0.003**
Good -87,069 33,379 0.009**
Very Good -23,341 32,080 0.466 Intercept 160,317 39,218 0.000***
F-Value
Adjusted R2 315.68***
0.36 Note. Reference categories are presented in parentheses. *p < .05. **
p < .01. ***p < .001.

60 Near-retirees with fair/poor health or good health had $106,348 and $87,069 less dollars
in net worth than near-retirees with excellent health.
Female Sample
Table 5-1 reports the OLS results of net worth and shows significant factors
affecting the levels of net worth for women in the near-retirement stage. The adjusted R
squared is .15, indicating that the independent variables in the model (income, income
squared, age, marital status, education, race, and self-reported health) explained
approximately 15% of the variance in net worth for near-retiree women. The F-statistics
indicated that the model of independent variables is appropriate for understanding the
level of net worth among near-retiree women. Among the socioeconomic characteristics,
household income, income squared, female heads aged 51 - 54 boomers), some college,
college education, and non-White were the significant factors that affected the levels of
net worth for near-retiree women.
This study hypothesized that there would be a positive relationship between age
and the level of savings among near-retiree women (H2). The OLS results reported that
boomer near-retiree women (aged 51 - 54) had significantly lower amounts of net worth
than did non-boomer women (aged 55 - 64). Boomer near-retiree women had
approximately $118,595 less dollars of net worth than did non-boomer near-retiree
women; therefore, Hypothesis 2 was supported.
It was hypothesized that there would be a positive relationship between income
and the level of savings among near-retiree women (H3). The results of the OLS
regression analysis reported that the effects of income on the level of net worth show a

61
Table 5-1
OLS Results of Net Worth Among Near-Retiree Women (n = 4,525)
Parameter Standard
Variable estimate error p-value
Income 4.81 0.31 0.000***
Income squared -116.39 30.21 0.000***
Age: (Non-boomer, aged 55 - 64)
Boomer, aged 51 - 54 -118,595 32,603 0.000***
Marital Status: (Married)
Divorced -74,195 39,415 0.059
Widowed 18,032 44,549 0.685
Never married -85,321 78,992 0.280
Education: (Less than high)
High school 48,842 35,417 0.167
Some college 108,142 39,577 0.006**
College education 123,438 45,201 0.006**
Race: (White)
Non-White -122,182 33,961 0.000***
Self-reported health: (Excellent)
Fair/poor -62,836 44,860 0.161
Good -60,096 41,296 0.145
Very Good 4,354.34 39,167 0.911
Intercept 87,921 47,290 0.063
F-Value 63.51***
Adjusted R2 0.15
Note. Reference categories are presented in parentheses.
*p < .05. **
p < .01. ***p < .001.

62 significant and positive, indicating that net worth increased as household income
increased. It was reported that for every one dollar increase in income, there was an
increase of $4.81 in net worth among near-retiree women; therefore, Hypothesis 3 was
supported. The coefficient associated with the income squared term was significant, but
an opposite direction. This result indicated that the relationship between household
income and the level of savings is non-linear among near-retiree women. In other words,
it can be said that as the household income continued to increase, the level of savings
decreased at a certain point.
It was hypothesized that never-married women would have lower level of
savings than married women (H4). However the results of the OLS regression analysis
report no statistical significant differences among divorced, widowed, and never married
near-retiree women. Therefore, Hypothesis 4 was not supported.
It was hypothesized that there would be a positive relationship between education
and the level of savings (H5). The results of the OLS regression analysis indicated that
the effect of education on the level of savings was significant and positive among near-
retiree women. From Table 5-1, it can be said that all else being equal, near-retiree
women with a college education or post high school education reported higher levels of
net worth compared to near-retiree women with no high school education. Therefore,
Hypothesis 5 was supported.
It was hypothesized that non-Whites would have lower level of savings than
White near-retiree women (H6). The OLS results indicated that race of near-retiree
women was significant, indicating that all else being equal, non-White near-retiree

63 women held $122,182 less in net worth than did White near-retiree women. Therefore,
Hypothesis 6 was supported.
It was hypothesized that near-retiree women with poor health would have lower
level of savings than near-retiree women with excellent health (H7). Table 5-1 shows
that as the level of self-reported health increased, the level of savings increased among
near-retiree women; however, the coefficients associated with dummy variables for self-
reported health status were not statistically significant. Therefore, Hypothesis 7 was not
supported.
Male Sample
This study explored how the levels of savings were different between near-retiree
women and men. Table 5-2 reports the OLS results of net worth and shows significant
factors that determine the levels of net worth for men in the near-retirement stage. The
adjusted R squared is .49, indicating that the independent variables in the model (income,
income squared, age, marital status, education, race, and self-reported health) explained
approximately 49% of the variance in net worth among near-retiree men. The F-statistics
indicated that the model of independent variables is appropriate for understanding the
level of net worth among near-retiree men. Among the socio-economic characteristics,
household income, male heads aged 51 - 54 (boomers), high school, some college,
college education, non-White, fair/poor health, and good health were the significant
factors that affected the level of net worth for near-retiree men aged 51 - 64.
The OLS results from Table 5-2 reported that the effect of household income on
the level of net worth was significant and positive, indicating that net worth increased as
64 household income increased among near-retiree men. For every one dollar in income
increase, there was an increase of three dollars in net worth among near-retiree men.
Unlike the female sample, the coefficient associated with the income squared term was
significant and positive indicating that the relationship between household income and
the level of savings is linear for near-retiree men. It can be said that as household income
increased, the level of savings continued to increase.
Table 5-2 reported that boomer near-retiree men (aged 51 - 54) had significantly
lower amounts of net worth than did non-boomer near-retiree men (aged 55 - 64).
Boomer near-retiree men had $162,000 less in net worth than did their non-boomer
counterparts. While comparing the results of the age impact on the level of
savings, it can be said that both boomer near-retiree women and men had significantly
lower amounts of net worth than did their non-boomer counterparts.
Marital status was considered as important factor in predicting the level of net
worth among near-retiree men. Similar to the results from the female sample, the results
of the OLS regression analysis indicated that there was no statistical significance among
divorced, widowed, or never married near-retiree men as compared to married near-
retiree men in predicting net worth.
Education shows a significant and positive impact on the level of savings among
near-retiree men. Table 5-2 reported that all else being equal, near-retiree men with a
high school education, post high school education, and a college education reported
higher levels of net worth as compared to near-retiree men with no high school diploma.
The results of the OLS regression analyses for both the female and male samples

65
Table 5–2
OLS Results of Net Worth Among Near-Retiree Men (n = 3,397)
Parameter Standard
Variable estimate error p-value
Income 3.04 0.25 0.000***
Income squared 123.02 6.09 0.000***
Age: (Non-boomer, aged 55 - 64)
Boomer, aged 51 - 54 -162,000 48,990 0.001***
Marital Status: (Married)
Divorced -64,314 58,122 0.268
Widowed -25,154 112,496 0.823
Never married -25,958 111,758 0.816
Education: (Less than high)
High school 114,028 48,974 0.020*
Some college 131,996 53,733 0.014**
College education 224,190 54,965 0.000***
Race: (White)
Non-White -140,328 47,816 0.003**
Self-reported health: (Excellent)
Fair/poor -123,983 60,861 0.041*
Good -106,673 54,954 0.052*
Very Good -55,728 53,599 0.298
Intercept 164,758 61,527 0.007**
F-Value 247.48***
Adjusted R2 0.49
Note. Reference categories are presented in parentheses.
*p < .05. **
p < .01. ***p < .001.
66 indicated that those with higher levels of education reported higher levels of net worth
than did their less educated counterparts.
Race of near-retiree men was significant for males. Table 5-2 showed that all else
being equal, non-White near-retiree men had $140,328 less in net worth than their White
male near-retiree counterparts. While comparing the results of the female sample, it can
be said that both near-retiree non-White women and men had significantly lower levels of
savings than their White counterparts. The OLS regression analysis also showed the
significant effect of self-reported health status on the level of net worth among near-
retiree men. It reported that compared to near-retiree men with excellent health, near-
retiree men with fair/poor health and good health had lower levels of net worth. Near-
retiree men with fair/poor health and good health, respectively, had $123,983 and
$106,673 less in net worth than near-retiree men with excellent health. However, among
near-retiree women, there was no statistical significance in self-reported health.
67
CHAPTER V
SUMMARY, IMPLICATIONS, AND CONCLUSIONS
This study examined the types of assets and level of savings among near-retiree
women, while comparing the types of assets and level of savings with those of near-
retiree men. This study also examined the effects of gender on the likelihood of holding
aggressive assets and the levels of savings among near-retirees in the multivariate
analyses. This study further investigated the factors associated with the likelihood of
holding aggressive assets and the levels of savings among near-retiree women aged 51-
64. This section provides summary, implications, limitations of the current study,
suggestions for future study, and conclusions of this study.
Summary
The descriptive statistics indicated that overall, average levels of all asset
categories for the female group were lower than they were for the male group among
near-retirees. According to the findings of this study, women tended to invest in safer
assets such as CDs, savings bonds, and T-bills than in more aggressive assets such as
stocks, business assets, and real estate assets.
The results of the logistic regression analysis indicated that gender had no
statistically significant impact on the likelihood of owning aggressive assets among near-
retirees aged 51 - 64. Based on the OLS results, this study also found that gender had no
statistically significant impact on the level of net worth among near-retirees aged 51 - 64.
Thus, the findings of this study do not support both Hypothesis 1-a (Women will be less

68 likely to invest in aggressive assets than men) and Hypothesis 1-b (Women will have
lower level of savings than men). It can be said that there were no differences in the
likelihood of holding aggressive assets and levels of savings between women and men.
This study explored factors associated with the likelihood of owning aggressive
assets among near-retiree women aged 51 - 64. Based on the logistic regression analysis,
this study found that boomer women (aged 51 - 54) were less likely to own aggressive
assets; divorced women were less likely to own aggressive assets; less educated women
were less likely to own aggressive assets; Black, Hispanic, Asian women were less likely
to have aggressive assets; and women with poor health were less likely to own aggressive
assets than other near-retiree women.
This study investigated what factors were associated with the level of savings
among near-retiree women aged 51 - 64. The findings of this study suggested that
income, age, education, and race were significant determinants of the level of savings
among near-retiree women aged 51 - 64. Thus, the results of this study support
Hypothesis 2 (There will be a positive relationship between age and the level of savings
among near-retiree women); Hypothesis 3 (There will be a positive relationship between
income and the level of savings among near-retiree women); Hypothesis 5 (There will be
a positive relationship between level of education and the level of savings among near-
retiree women); and Hypothesis 6 (Non-Whites will have lower level of savings than
White near-retiree women).
Based on the results of the OLS regression analysis, this study found that near-
retiree women with higher income, older women, highly educated women, and women
69 with good health reported higher levels of savings. For example, as income increased,
the level of net worth increased for near-retiree women; boomer women aged 51 - 54 had
lower levels of net worth compared to older non-boomer women aged 55 - 64; the higher
the levels of education near-retiree women obtained, the higher the levels of net worth
were reported; and non-White near-retiree women had lower dollars in net worth as
compared to Whites. However, marital status and self-reported health status were not
found to be significant factors that determined the levels of net worth among near-retiree
women.
Implications of the Study
According to this study, higher income levels of near-retiree women reported a
higher likelihood of owning aggressive assets and having higher levels of net worth.
Higher income resulted in higher levels of net worth that could produce an adequate
retirement nest egg; therefore, it is important that women earn as much as possible
throughout the working years in order to sustain them through retirement. It is also
important that women work in career fields where there is the potential for employers to
contribute to 401(k) accounts and offer benefits such as health insurance.
The findings of this study may benefit professionals, financial educators, and
planners in assisting women to make better investment decisions, particularly with their
401(k) accounts, stocks, and IRAs. These investment vehicles may be unfamiliar to some
women; therefore, educators and planners must provide more knowledge about stocks or
other investment vehicles that may generate higher returns in the future. Financial

70 educators need to help women invest their money more appropriately since women have
longer life spans.
The findings of this study may assist policy makers in making important
retirement policy decisions. This study indicated that women with some college
education or a college education were significantly more likely to have a higher level of
net worth; therefore, obtaining higher levels of education is critical to women’s financial
situations. The government may offer additional financial assistance to women to help
encourage furthering their education levels since this may increase net worth values.
Since women with some college or a college education were more likely to have
higher levels of retirement savings, it is important for the government to develop or
emphasize women’s education in general; therefore, there may be less women living on
government subsidies such as welfare and Medicare. It is also important to educate
young women in high school or those beginning college on the importance of an
education, along with basic financial knowledge.
This study found that women with good health conditions had higher levels of net
worth. Women with little or no health insurance may be more likely to have a negative
net worth; therefore, they may need additional government assistance in order to meet
their financial and medical obligations. The government may offer additional health care
benefits to underinsured women or women completely without insurance to help ensure
better health conditions.
This study may offer some insight as to what socioeconomic factors are related to
retirement savings among near-retiree women. This study found women with lower

71 income levels, divorced women, those with lower levels of education, Black, Hispanic,
Asian, and other women, and women with poorer health reported lower levels of
retirement savings. Researchers interested in women and personal financial issues might
be interested in the findings of this study.
Limitations of the Study
There were some limitations in this study. This study examined the financial
portfolios of near-retiree women as compared to those of near-retiree men. However,
while comparing the financial assets between males and females among near-retirees, this
study was not able to measure the pure investment behavior of women since some of the
women from the study were married and their investment decisions may reflect their
husbands’ investment decisions. This could lead to limitations because it was not a pure
comparison of women’s and men’s savings or investment behaviors. Therefore, it was
difficult for one to understand married women’s financial behavior since it could be
influenced by a husband’s financial knowledge.
Another limitation of this study could be attributed to using information from the
HRS 2000 data. It may be beneficial for one to use a most recent data set to understand
savings or investment behavior among near-retiree women in a future study.
Nonetheless, information from the 2000 HRS data could still be useful in evaluating and
interpreting what financial assets near-retiree women held and what socioeconomic
factors affected the level of savings for near-retiree women. The findings of the 2000
HRS data could be used as a baseline for future research with similar research topics.
72
Recommendations for Future Research
Since there are many baby boomer women entering the retirement stage or
beginning to enter the retirement stage, further research should be done in baby boomer
women’s retirement and savings behavior. This study utilized the 2000 HRS data that
included baby boomer women, those aged 51 - 54. However, using more recent data
such as the 2006 HRS data, a future study would analyze how baby boomer women are
continuing to build a retirement nest egg to sustain them throughout their lifetime.
This study investigated how near-retiree women saved for retirement, while
measuring the level of net worth and aggressive assets; however, it could be useful for
researchers to continuously study how women invest in different retirement saving
vehicles such as IRAs, 401(k) accounts, mutual funds, and others. Therefore, to better
understand how women utilize different types of investment tools, future research might
need to measure other investment tools such as IRAs, 401(k) accounts, mutual funds, and
bonds since these are popular retirement saving tools.
This study has limitations in interpreting the financial behavior of near-retiree
women. It is unclear for one to understand investment behavior of women in married
households which might not be their own decisions. Therefore, future research could
design a study that measures the pure investment behavior of women while analyzing a
sample of women who are the financial managers in the married-couple household. By
comparing nonmarried women with married women who are the financial manager of the
household, there may be a more accurate indication as to how near-retiree women are
prepared for retirement.

73
Conclusions
Many Americans are not saving appropriate funds toward their retirement years,
particularly women. Some women may be entering retirement without enough money to
last throughout the retirement years. Further education of women on the importance of
saving appropriately for retirement is an issue. This study may help to educate women on
the importance of saving for retirement, but also educate women to allocate the
appropriate funds in investments that create higher returns such as stocks. According to
the findings of this study, women tended to invest in safer assets such as CDs, savings
bonds, and T-bills than in more aggressive assets such as stocks and mutual funds.
Therefore, it is important to educate women on the importance of appropriate allocation
of financial resources toward retirement that will generate a higher return to last
throughout the longevity of the retirement years.
It is crucial that less educated women are taught about the importance of saving
for retirement since this study found that women with no college education had lower
levels of net worth and were less likely to own aggressive assets as compared to women
with a college education. It was also reported that non-Whites such as Black, Hispanic,
Asian, and other near-retiree women had lower levels of net worth and were less likely to
own aggressive assets as compared to White women. Therefore, it is important to
educate non-White women about the importance of saving for retirement years and
investing in aggressive assets such as stocks and mutual funds. It was also found that
women with poor health conditions were less likely to own aggressive assets; therefore, it
74 is important to educate women with poor health to invest appropriately for retirement
even if their finances may be primarily focused toward current medical bills.
There are positive things happening in the financial world on educating both
women and men on various investment vehicles such as government sponsored financial
workshops, better tax incentives for retirement savings, and more awareness on the
importance of retirement savings. However, there is still much work to be done to fully
educate women on retirement savings particularly those with lower education levels, non-
White women, and women with poor health conditions. The retirement stage is a period
in time when many Americans hope to enjoy life and their posterity, but if people,
particularly women, are not fully prepared; the retirement years may be dismal and
financially challenging.

75
REFERENCES Administration on Aging. (2006). A profile of older Americans. Retrieved October 1,
2007, from http://www.aoa.gov/PROF/statistics/profile/2006/2006profile.pdf Alcon, A. (1999, February). Financial planning and the mature women. Journal of
Financial Planning, 12, 82-88. American Academy of Actuaries. (2002). Is America unprepared for retirement? New
survey released on retirement risks. Retrieved September 15, 2007, from http://www.actuary.org/newsroom/retire_survey.htm
Asche, K. (2007). A longer life span – where are we headed? Hutchinson Leader.
Retrieved October 1, 2007 from http://www.hutchinsonleader.com/node/2192 Baek, E., & DeVaney S. A. (2004). Assessing the baby boomer’s financial wellness
using financial ratios and a subjective measure. Family and Consumer Sciences
Research Journal, 32(4), 321-348. Bajtelsmith, V. L., & Bernasek, A. (1996). Why do women invest differently than men?
Financial Counseling and Planning, 7, 1-10. Bajtelsmit, V., Rappaport, A. M., Hounsell, M. C., d’Ambrosio, M., Merrick, G. W., &
Kaufmanis, K. (2005). Women and pensions. Risk Management and Insurance
Review, 8(1), 9-29. Block, S. (2006, July 14). Ready, set, catch up on retirement savings. USA Today.
Retrieved September 18, 2007, from http://web.ebscohost.com/ehost/detail?vid =4&hid=9&sid=355a4827-4783-45b8-aa50-72bddf636f10%40SRCSM2
Boomers unprepared for retirement. (2003, October 17). CBSNews.com. Retrieved
September 10, 2007 from http://www.cbsnews.com/stories/2003/10/17/ sunday/main578669.shtml
Bryant, W. K. (1990). The Economic organization of the household. New York:
Cambridge University Press. Buffa, L. (1995, November/December). Saving pennies for retirement. Women in
Business, 47(6), 6. Butricia, B. A., Iams, H. M., & Smith, K. E. (2003). It’s all relative: Understanding the
retirement prospects of baby boomers. Center for Retirement Research at Boston
College, Working Paper #2003-21. Executive Summary.

76 Center for Disease Control (CDC). (2005, February 28). Life expectancy hits record
high. Retrieved September 14, 2007, from hppt://www.cdc/gov/od/oc/media/ pressrel/fs050228.htm
Clark, R. L., Burkhauser, R. V., Moon, M., Quinn, J. F., & Smeeding, T. M. (2004). The
economics of an aging society. Malden, MA: Blackwell. Deaton, A. S., & Paxson, C. H. (1998, May). Aging and inequality in income and health.
AEA Papers and Proceedings, 88(2), 248-253. DeNavas-Walt, C., Proctor, B. D., & Smith, J. (2007, August). Income, poverty, and
health insurance coverage in the United States: 2006. U.S. Census Bureau. P60-233.
DeVaney, S. A. (1995). Retirement preparation of older and younger baby boomers.
Association for Financial Counseling and Planning Education, 6, 25-33. DeVaney, S. A., & Chen, Z. (2003). The accumulation of net worth as workers approach
retirement. Journal of Personal Finance, 2(1), 54-79. DeVaney, S. A., & Chiremba, S. T. (2005). Comparing the retirement savings of the
baby boomers and other cohorts. Retrieved September 14, 2007, from http://www.bls.gov/opub/cwc/pring/cm20050114ar01pl.htm
Dollemore, D. (2006, June). Aging under the microscope. National Institutes of Health
– National Institute on Aging. NIH Publication No. 02-2756. Retrieved October 1, 2007, from http://www.nia.nih.gov
Employee Benefit Research Institute, & Greenwald, M. & Associates. (2007). 2007 RCS
Fact Sheet - Saving for retirement in America. Retrieved September 15, 2007, from http://www.ebri.org/rcs
Glass, J. J., & Kilpatrick, B. B. (1998, December). Gender comparisons of baby boomers
and financial preparation for retirement. Educational Gerontology, 24(8), 719-745.
Green, C. A. (2005, July). Race, ethnicity, and social security retirement age in the US.
Feminist Economics, 11(2), 117-143. Helman, R., Greenwald, M., VanDerhei, J., & Copeland, C. (2007, April). The
retirement system in transition: The 2007 retirement confidence survey. Employee Benefit Research Institute. Issue Brief No. 304.

77 Hodes, R. J. (2001). FY 2002 Hearing on lifespan. National Institute on Aging.
Retrieved October 1, 2007, from www.nia.nih.gov/AboutNIA/ BudgetRequests/Lifespan2001April14.htm
Hogan, R., & Perrucci, C. (2006). Black women: Truly disadvantaged in the transition
from employment to retirement income. Social Science Research, 36(3), 1184-1199.
Karamcheva, N., & Munnell, A. (2007, July). Why are widows so poor? Center for
Retirement Research at Boston College, 7(9), 1-5. Korczyk, S. M. (2001, March). Baby boomers head for retirement. Journal of Financial
Planning, 14(3), 116-123. Merrill Lynch & Co., Inc. (2004, May 11). Merrill Lynch announces results of annual
retirement preparedness survey. Retrieved October 31, 2007, from http://www.ml.com/cms/templates/so/print.asp?id-7695-7696-8149-6261-13715-13739.
Moen, P. (1996). A life course perspective on retirement, gender, and well-being.
Journal of Occupational Health Psychology, 1(2), 131-144. Munnell, A. H. (2004a). Population aging: It’s not just the baby boom. Center for
Retirement Research at Boston College, 16, 1-7. Munnell, A. H. (2004b). Why are so many older women poor - Just the facts? Center for
Retirement Research at Boston College, 10, 1-7. Munnell, A. H. (2007). Medicare costs and retirement security. Center for Retirement
Research at Boston College, 7(14), 1-5. Munnell, A. H., & Sass, S. (2005). 401(k) plans and women: A “good news/bad news”
story – Just the facts. Center for Retirement Research at Boston College, 13, 1-5. Munnell, A. H., & Soto, M. (2005). How do pensions affect replacement rates? Center
for Retirement Research at Boston College, 37, 1-5. Munnell, A. H., & Sunden, A. (2006). 401(k) plans are still coming up short. Center for
Retirement Research at Boston College, 43, 1-9. National Institute of Aging. (2007, March 5). Why population aging matters: A global
perspective. Retrieved October 1, 2007, from http://www.nia.nih.gov/NR/ rdonlyres/C13CE0FA-59E4-49CA-BAC2-10E35297BDFD/6580/WPAM.txt
78 O’ Neill, B. M. (1992). Till debt do us part: Financial consequences of divorce. Journal
of Financial Planning, 4, 159-165. Ozawa, M. N., & Hong, B. (2006). Postretirement earnings relative to preretirement
earnings: Gender and racial differences. Journal of Gerontological Social Work, 47(3/4), 63-82.
Ozawa, M. N., & Lee, Y. (2006, January). The net worth of female-headed households:
A comparison to other types of households. Family Relations, 55, 132-145. Ozawa, M. N., & Lum, Y. (1998, June). Marital status and change in income status 10
years after retirement. Social Work Research, 22(2), 116-128. Ozawa, M., & Tseng, H. (2000). Differences in net worth between elderly Black people
and elderly White people. Social Work Research, 24(2), 96-108. Paulson, H. M., Chao E. L., Leavitt, M. O., Astrue, M. J., Palmer, J. L., & Saving, T. R.
(2007). Status of the Social Security and Medicare Programs: A Summary of the
2007 Annual Reports – Social Security and Medicare Boards of Trustees, A
Message to the Public. Retrieved September 14, 2007, from http://www.ssa.gov/OACT/TRSUM/trsummary.html
Phoenix Home Life Mutual Insurance Co. (1997). Hopes and fears and dreams. Journal
of Financial Planning, 10(5), 17. Poterba, J. M., Venti, S. F., & Wise, D. A. (2000). Saver behavior and 401(k) retirement
wealth [Electronic Version). AEA Papers and Proceedings, 90(2), 297-302. Rappaport, A. M. (2007, First Quarter). Improving the financial status of elderly women:
Issues in savings, pension plans and social security. Benefits Quarterly, 1, 34-45. Solda, B. J., Hurd, M. D., Rodgers, W. L., & Wallace, R. B. (1997). Asset and health
dynamics among the oldest old: An overview of the AHEAD study. The Journal
of Gerontology, 52B (special issue), 1-20. Taylor, R. J., & Lockery, S. A. (1995, Spring). Socio-economic status of older Black
Americans: Education, income, poverty, political participation, and religious involvement. Retrieved September 20, 2007, from http://www.rcgd.isr. umich.edu/prba/perspectives/spring1995/rtaylor.pdf
U. S. Census Bureau. (2007). Historical poverty tables. Retrieved September 21, 2007,
from http://www.census.gov/hhes/www/poverty/histpov/hstpov13.html

79 U. S. Department of Labor – Bureau of Labor Statistics. (1997). A profile of the working
poor, 1997. Retrieved September 20, 2007, from http://www.bls.gov/cps/ cpswp97.htm
U. S. Department of Labor - Bureau of Labor Statistics. (2007a). Labor force statistics
from the current population survey. Retrieved September 21, 2007, from http://www.bls.gov/cps/prev_yrs.htm and http://www.bls.gov/PDQ/servlet/ SurveyOutputServlet
U. S. Department of Labor - Bureau of Labor Statistics. (2007b). Women in the labor
force: A databook (2007 Edition). Retrieved November 27, 2007, from http://www.bls.gov/cps/wlf-databook2007.htm