Retirement Income Planning - Benefits|Caterpillar · 15 Retirement Income Planning Retirement Risk...
34
Retirement Income Planning Retirement Income Planning Retirement Income Planning
Transcript of Retirement Income Planning - Benefits|Caterpillar · 15 Retirement Income Planning Retirement Risk...
Retirement Income PlanningRetirement Income Planning
Retirement Income Planning

Retirement Income Planning
Making the Most of What You Have
2
Retirement Income Planning
Today’s Agenda
3
Retirement Risks
Longevity
Overspending
Inflation
Market Timing
Healthcare and Unexpected Expenses
Retirement Income Planning Process

Retirement Income Planning
Today’s Agenda
4
What would you like to get out of today’s session?
Retirement Income Planning5
Retirement RiskWhat is the greatest risk retirees face today?
Retirement Income Planning
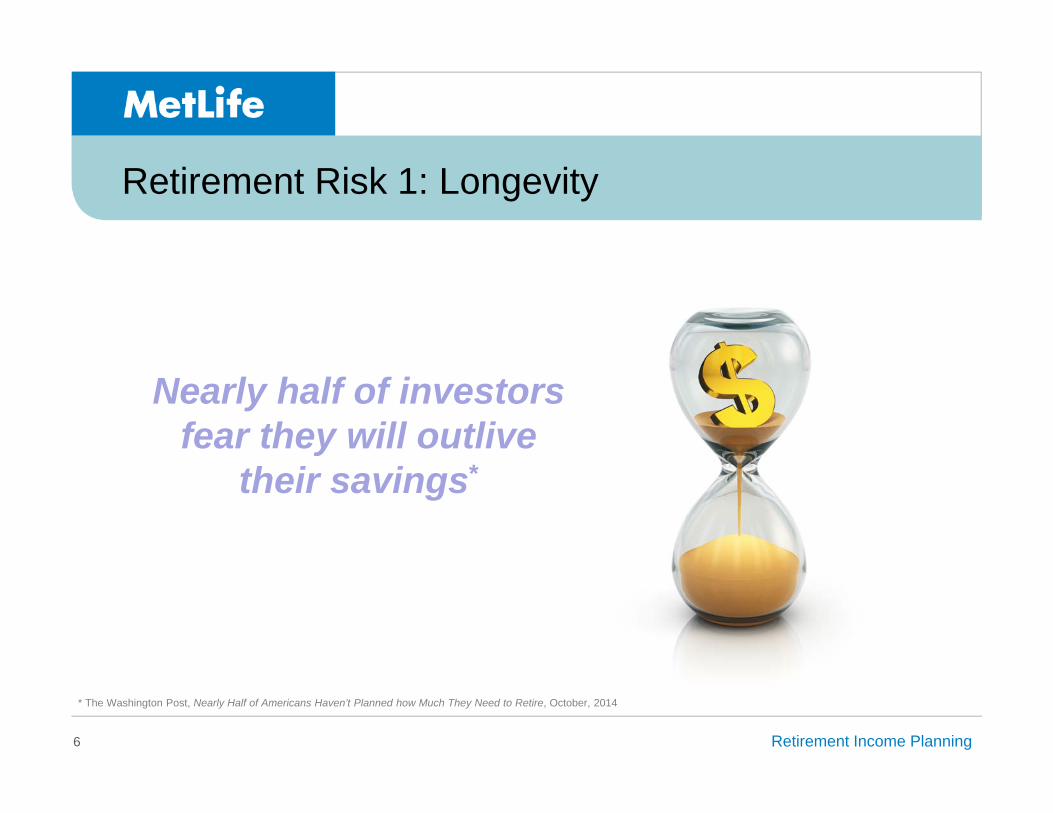
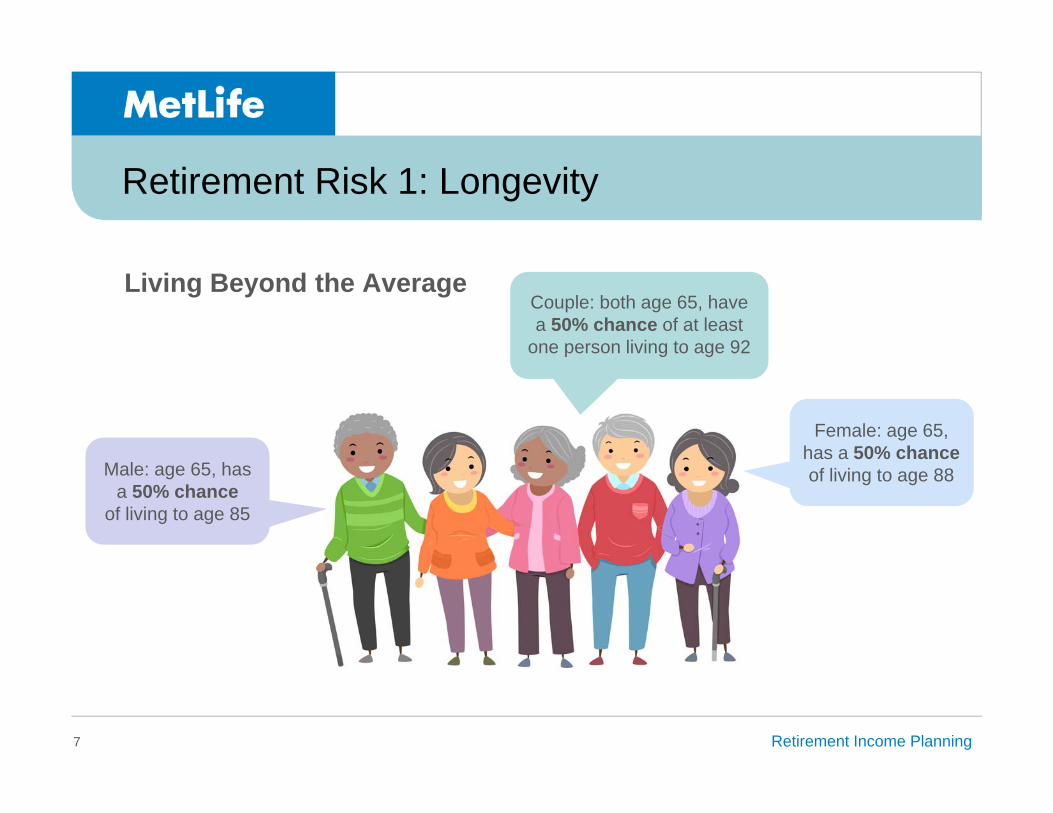
Retirement Risk 1: Longevity
6
* The Washington Post, Nearly Half of Americans Haven’t Planned how Much They Need to Retire, October, 2014
Nearly half of investors fear they will outlive
their savings*
Retirement Income Planning
Retirement Risk 1: Longevity
7
Living Beyond the Average
Male: age 65, has a 50% chance
of living to age 85
Couple: both age 65, have a 50% chance of at least
one person living to age 92
Female: age 65, has a 50% chance of living to age 88
Retirement Income Planning
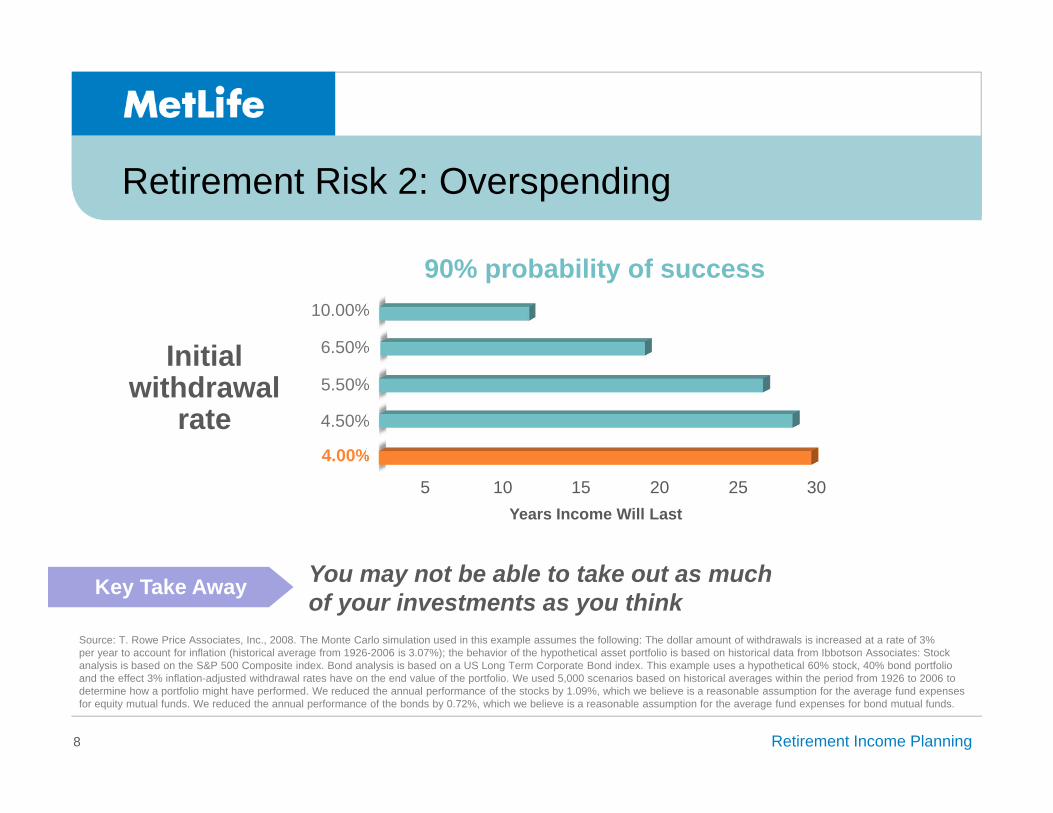
Retirement Risk 2: Overspending
8
Initial withdrawal
rate
90% probability of success
5 10 15 20 25 30Years Income Will Last
You may not be able to take out as much of your investments as you thinkKey Take Away
4.50%
5.50%
6.50%
10.00%
4.00%
Source: T. Rowe Price Associates, Inc., 2008. The Monte Carlo simulation used in this example assumes the following: The dollar amount of withdrawals is increased at a rate of 3% per year to account for inflation (historical average from 1926-2006 is 3.07%); the behavior of the hypothetical asset portfolio is based on historical data from Ibbotson Associates: Stock analysis is based on the S&P 500 Composite index. Bond analysis is based on a US Long Term Corporate Bond index. This example uses a hypothetical 60% stock, 40% bond portfolio and the effect 3% inflation-adjusted withdrawal rates have on the end value of the portfolio. We used 5,000 scenarios based on historical averages within the period from 1926 to 2006 to determine how a portfolio might have performed. We reduced the annual performance of the stocks by 1.09%, which we believe is a reasonable assumption for the average fund expenses for equity mutual funds. We reduced the annual performance of the bonds by 0.72%, which we believe is a reasonable assumption for the average fund expenses for bond mutual funds.
Retirement Income Planning
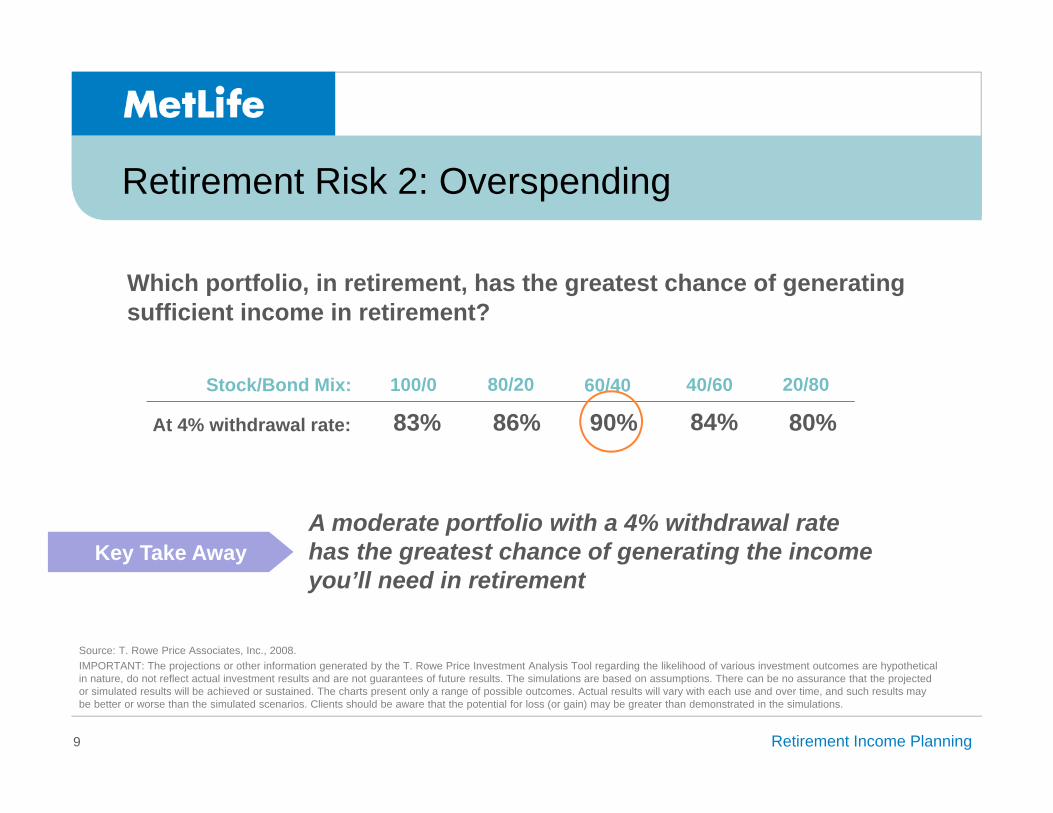
Retirement Risk 2: Overspending
9
A moderate portfolio with a 4% withdrawal rate has the greatest chance of generating the income you’ll need in retirement
Key Take Away
Stock/Bond Mix:
At 4% withdrawal rate: 83% 86% 90% 84% 80%100/0 80/20 60/40 40/60 20/80
Source: T. Rowe Price Associates, Inc., 2008. IMPORTANT: The projections or other information generated by the T. Rowe Price Investment Analysis Tool regarding the likelihood of various investment outcomes are hypothetical in nature, do not reflect actual investment results and are not guarantees of future results. The simulations are based on assumptions. There can be no assurance that the projected or simulated results will be achieved or sustained. The charts present only a range of possible outcomes. Actual results will vary with each use and over time, and such results may be better or worse than the simulated scenarios. Clients should be aware that the potential for loss (or gain) may be greater than demonstrated in the simulations.
Which portfolio, in retirement, has the greatest chance of generating sufficient income in retirement?
Retirement Income Planning
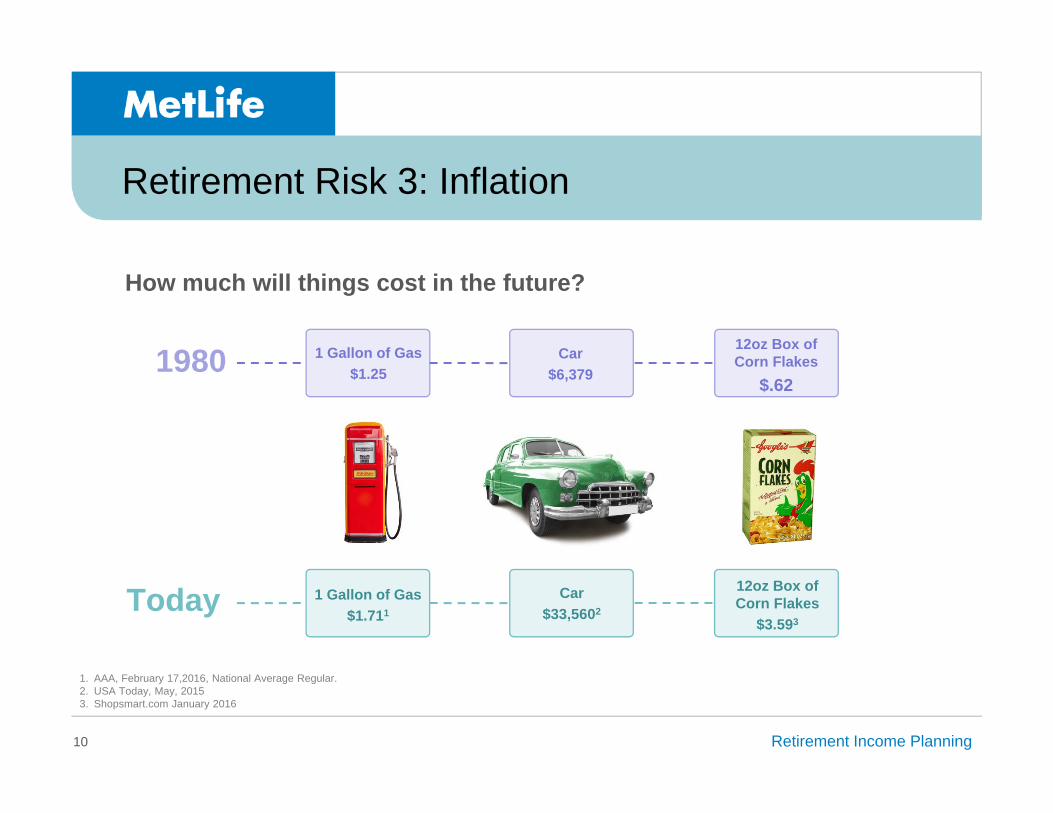
Retirement Risk 3: Inflation
10
12oz Box of Corn Flakes
$.62
12oz Box of Corn Flakes
$3.593
1 Gallon of Gas$1.25
1 Gallon of Gas$1.711
Car$6,379
Car$33,5602
How much will things cost in the future?
1. AAA, February 17,2016, National Average Regular.2. USA Today, May, 20153. Shopsmart.com January 2016
1980
Today

Retirement Income Planning
$826.11=
Retirement Risk 3: Inflation
11
today in 25 years*
* Assumes a 3.6% inflation rate
$2,000
Retirement Income Planning
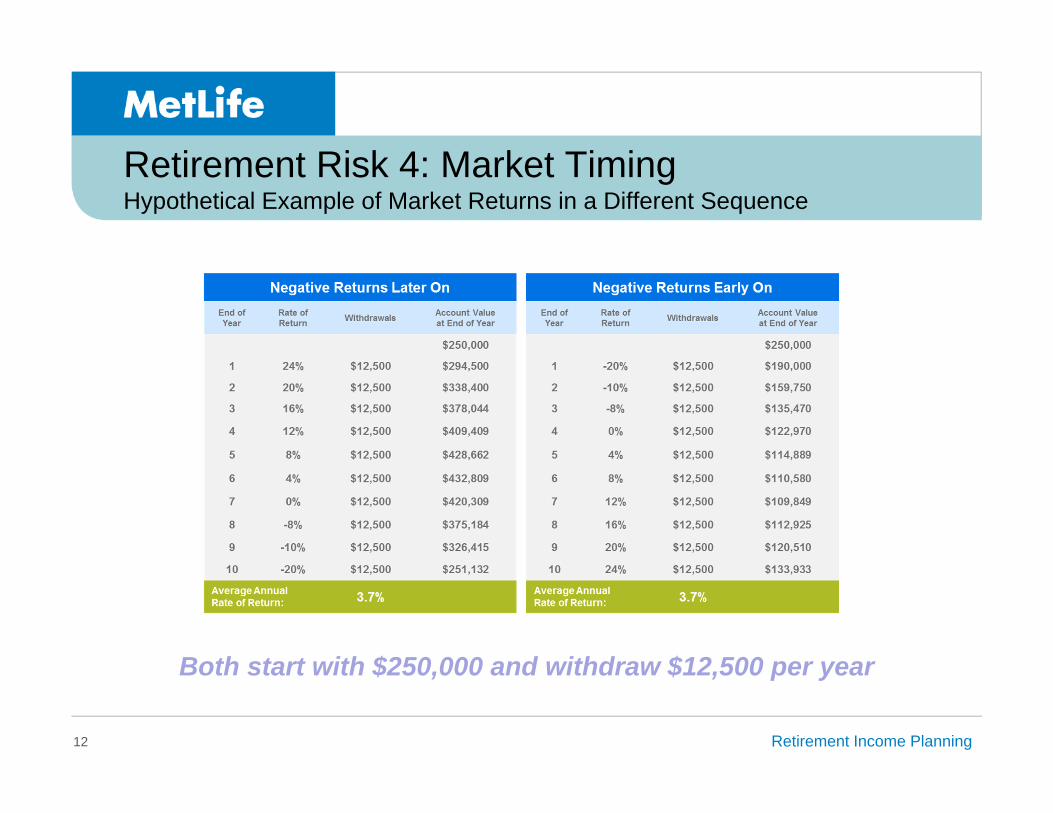
Retirement Risk 4: Market TimingHypothetical Example of Market Returns in a Different Sequence
12
Both start with $250,000 and withdraw $12,500 per year
Retirement Income Planning
Retirement Risk 4: Market Timing
13
Retiring in a bear or down market can have a major
impact on your assets and income sustainability
Retirement Income Planning
Retirement Risk 5
14
What is likely to be one of your largest and most unpredictableretirement expenses?
Retirement Income Planning15
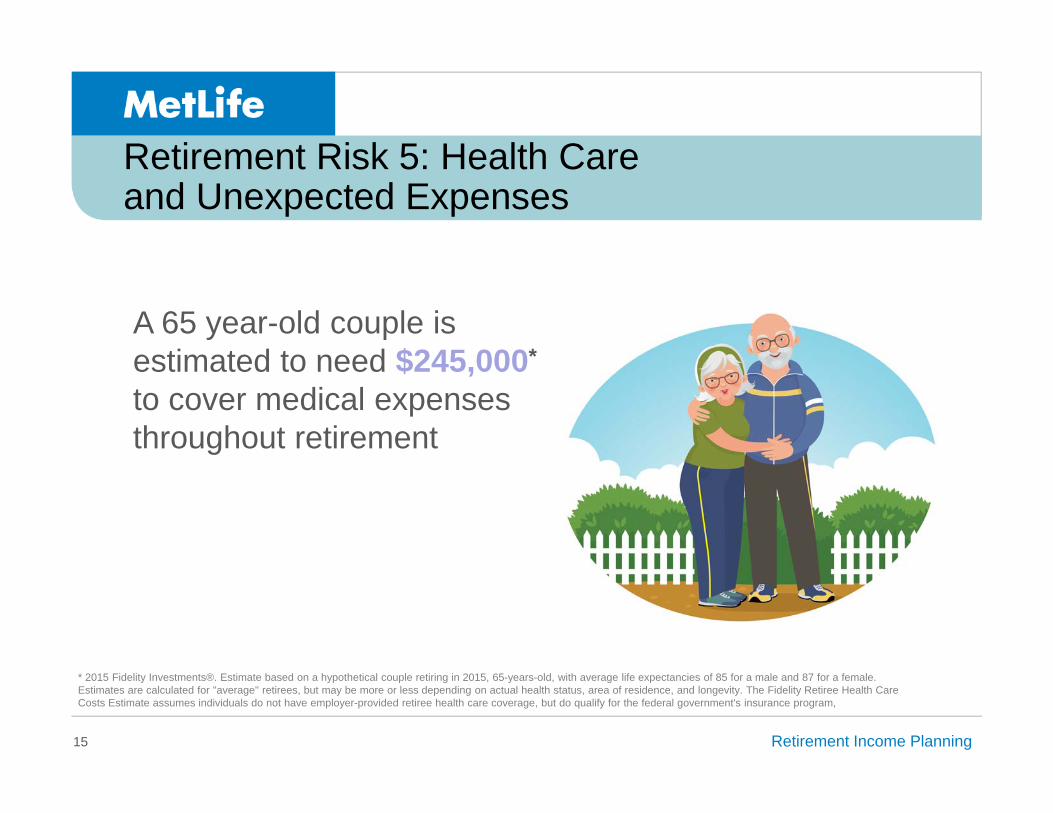
Retirement Risk 5: Health Care and Unexpected Expenses
* 2015 Fidelity Investments®. Estimate based on a hypothetical couple retiring in 2015, 65-years-old, with average life expectancies of 85 for a male and 87 for a female. Estimates are calculated for "average" retirees, but may be more or less depending on actual health status, area of residence, and longevity. The Fidelity Retiree Health Care Costs Estimate assumes individuals do not have employer-provided retiree health care coverage, but do qualify for the federal government's insurance program,
A 65 year-old couple is estimated to need $245,000*
to cover medical expenses throughout retirement

Retirement Income Planning16
Retirement Risk 5: Health Care and Unexpected Expenses
Without appropriate planning long term care services can potentially deplete your income and savings, even before you retire

Retirement Income Planning
Retirement Income Planning Process
17
Retirement Income Planning ProcessHow do you create a retirement income strategy that will pay for the retirement lifestyle you want to live?
Retirement Income Planning
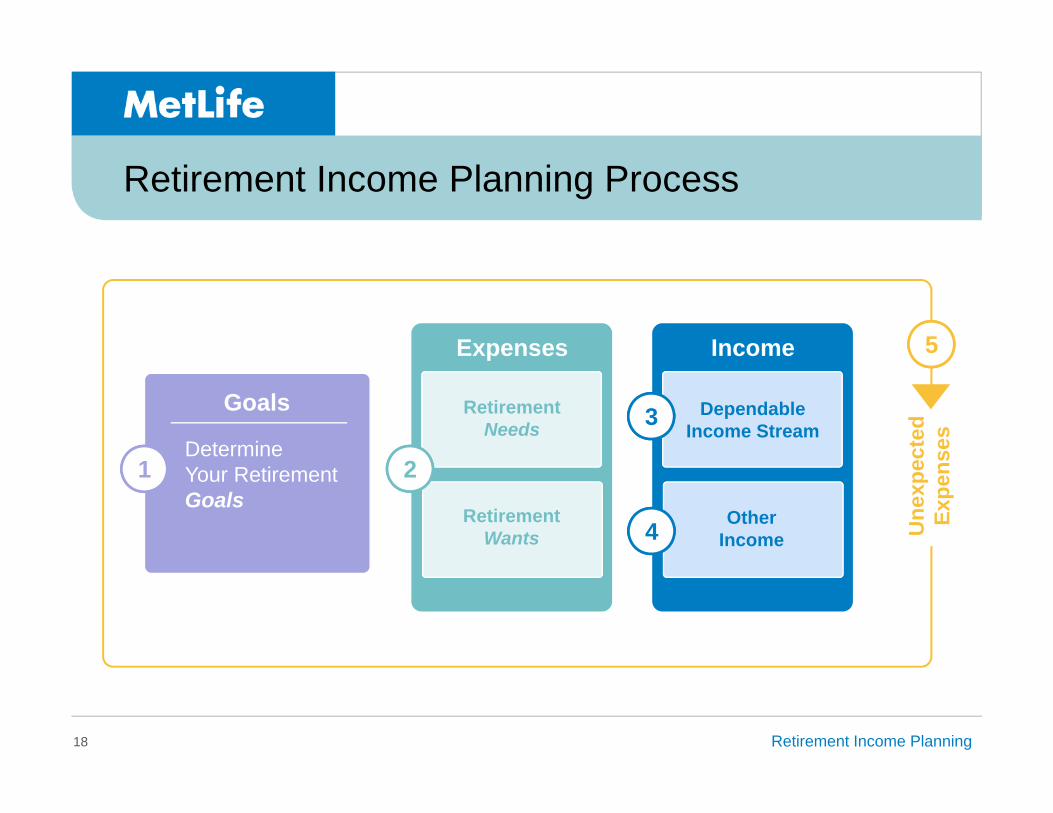
Retirement Income Planning Process
18
1
Goals
Determine Your Retirement Goals
2
Expenses
Retirement Needs
Retirement Wants
Income
DependableIncome Stream
Other Income
3
4 Une
xpec
ted
Expe
nses
5
Retirement Income Planning
Retirement Income Planning Process
19
1. What’s your vision of retirement?
Retirement Income Planning
Retirement Income Planning Process
20
2. How much will your retirement actually cost you?
Retirement Income Planning21
Retirement Income Planning Process
3. Where will the income to pay these expenses come from?
Retirement Income Planning
Retirement Income Planning Process
22
Where will the income to pay these expenses come from?
Dependable income sources:
Social Security
Defined benefit or pension plan
Creating additional dependable income sources:
CD/Bond ladders
Annuities
Retirement Income Planning
Retirement Income Planning Process
23
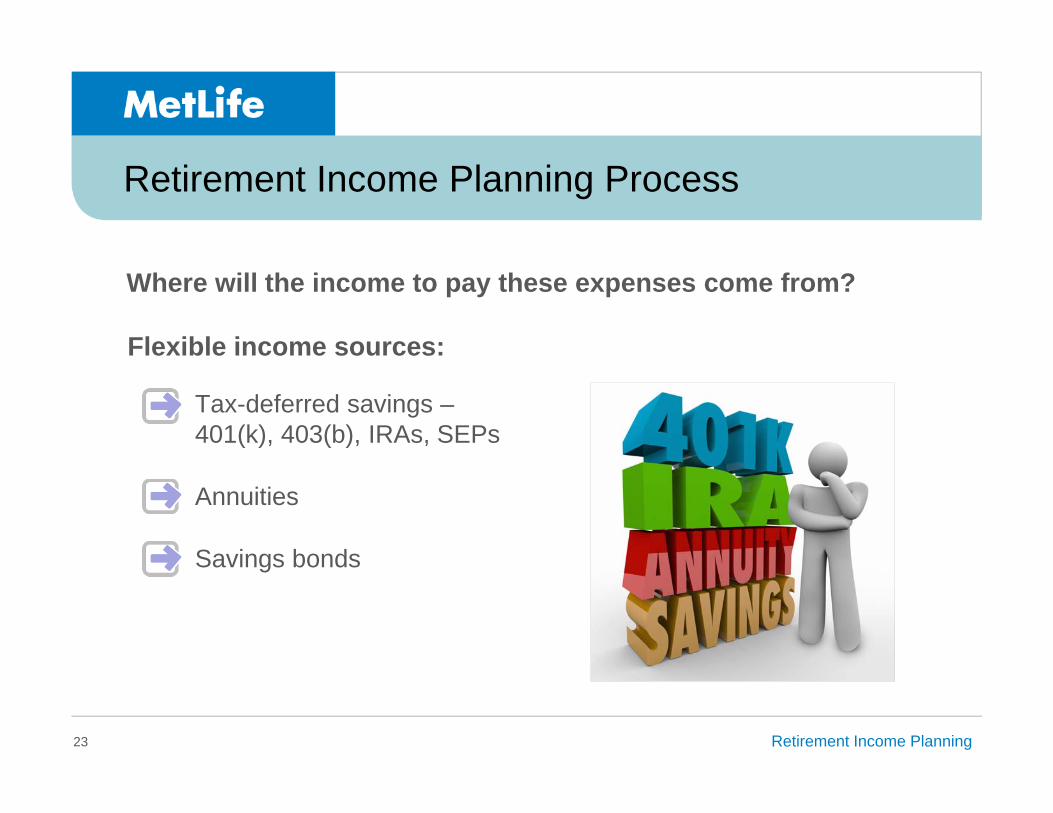
Flexible income sources:
Tax-deferred savings –401(k), 403(b), IRAs, SEPs
Annuities
Savings bonds
Where will the income to pay these expenses come from?
Retirement Income Planning
Retirement Income Planning Process
24
4. How do your sources of income and projected expenses match up?
Retirement Income Planning
Retirement Income Planning Process
25
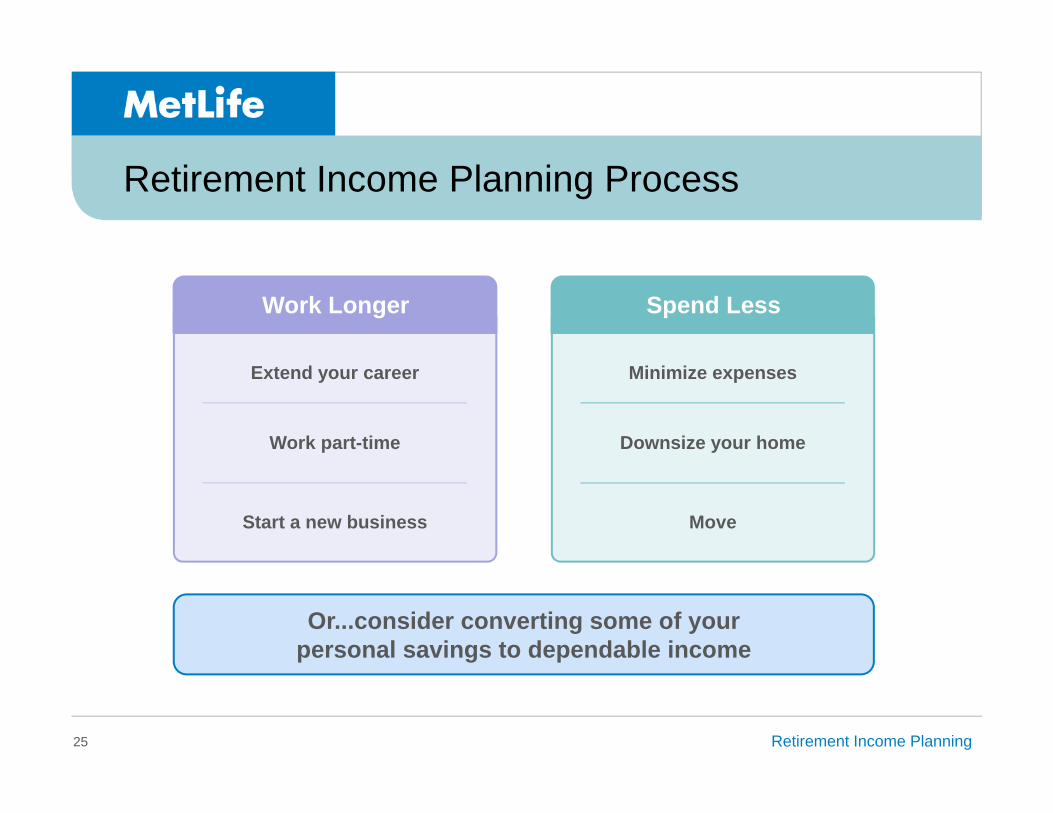
Extend your career
Work part-time
Start a new business
Work Longer
Minimize expenses
Downsize your home
Move
Spend Less
Or...consider converting some of your personal savings to dependable income
Retirement Income Planning
Retirement Income Planning Process
26
Turn personal savings into income
Systematic withdrawals
Annuitization
Retirement Income Planning
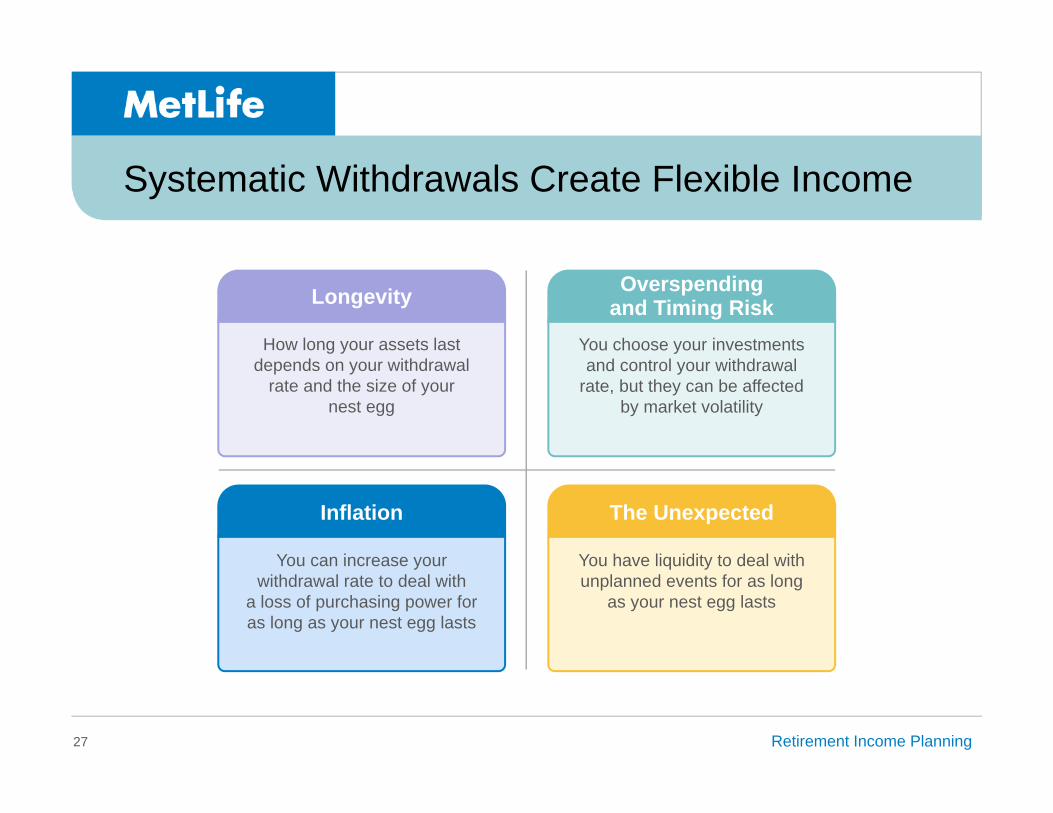
Systematic Withdrawals Create Flexible Income
27
Longevity
How long your assets last depends on your withdrawal
rate and the size of your nest egg
Overspending and Timing Risk
You choose your investments and control your withdrawal
rate, but they can be affected by market volatility
Inflation
You can increase your withdrawal rate to deal with
a loss of purchasing power for as long as your nest egg lasts
The Unexpected
You have liquidity to deal with unplanned events for as long
as your nest egg lasts
Retirement Income Planning
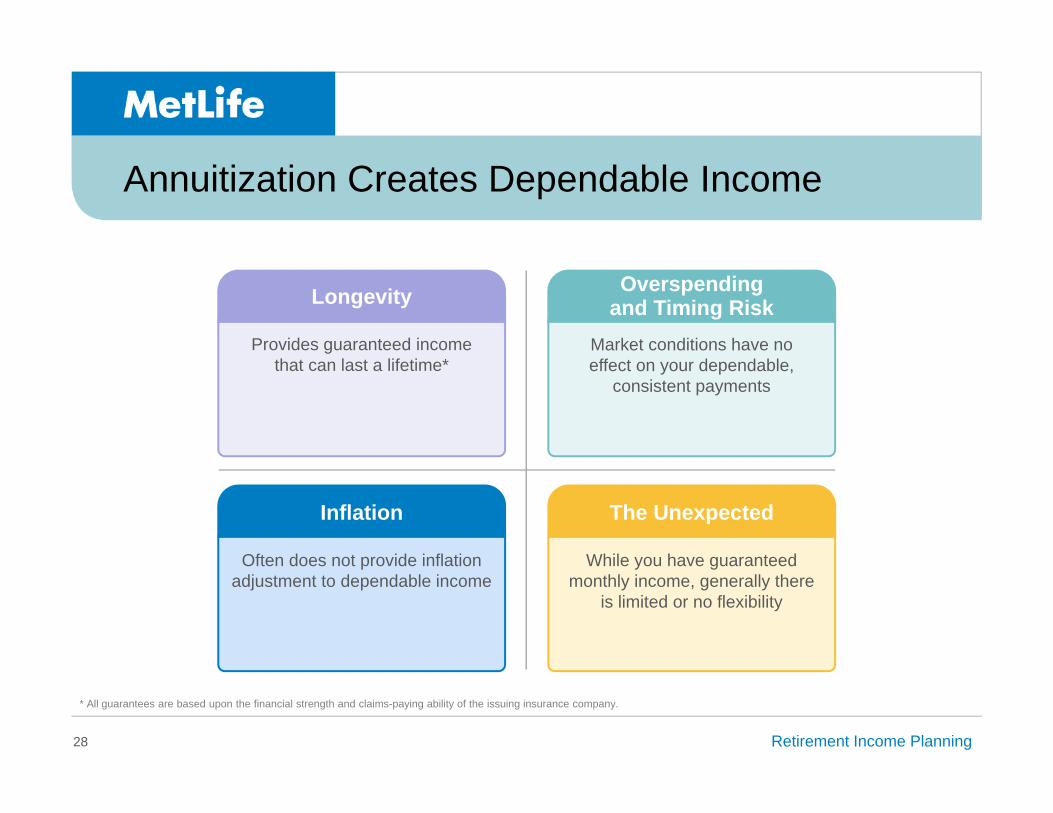
Annuitization Creates Dependable Income
28
Longevity
Provides guaranteed income that can last a lifetime*
Overspending and Timing Risk
Market conditions have no effect on your dependable,
consistent payments
Inflation
Often does not provide inflation adjustment to dependable income
The Unexpected
While you have guaranteed monthly income, generally there
is limited or no flexibility
* All guarantees are based upon the financial strength and claims-paying ability of the issuing insurance company.
Retirement Income Planning
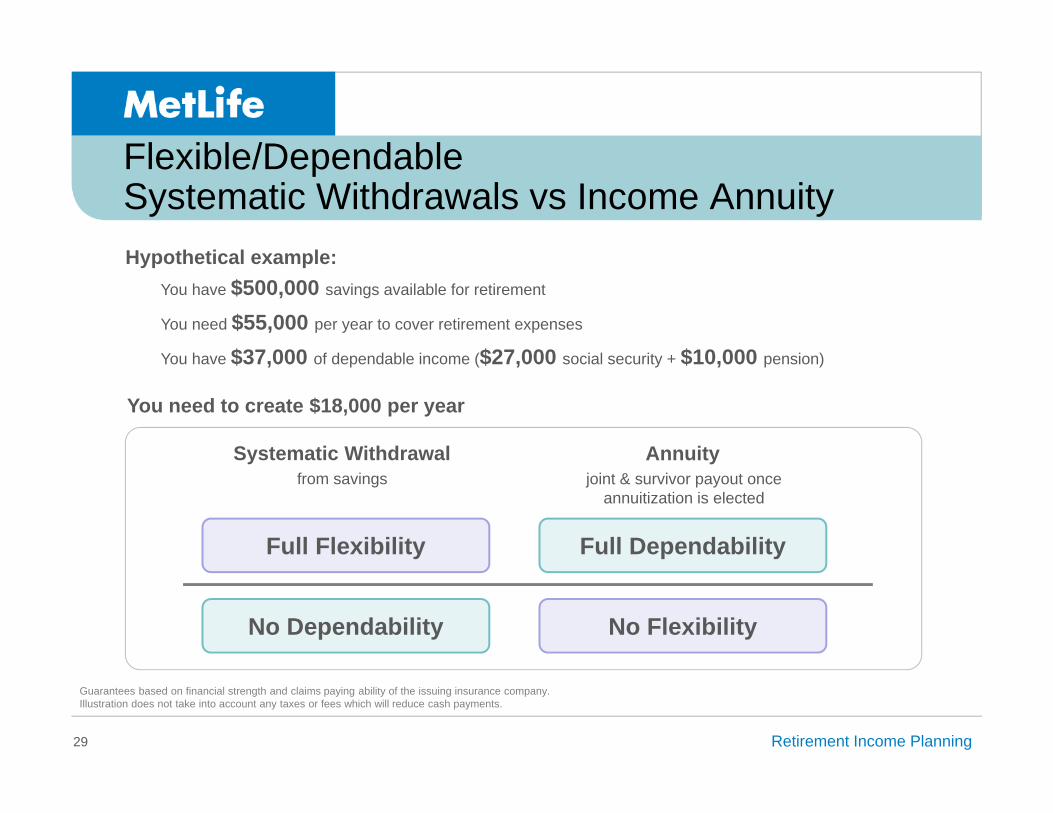
Flexible/Dependable Systematic Withdrawals vs Income Annuity
29
Hypothetical example:You have $500,000 savings available for retirement
You need $55,000 per year to cover retirement expenses
You have $37,000 of dependable income ($27,000 social security + $10,000 pension)
You need to create $18,000 per year
Guarantees based on financial strength and claims paying ability of the issuing insurance company. Illustration does not take into account any taxes or fees which will reduce cash payments.
Systematic Withdrawal Annuityfrom savings joint & survivor payout once
annuitization is elected
Full FlexibilityFull Flexibility
No Dependability
Full Dependability
No Flexibility
Retirement Income Planning
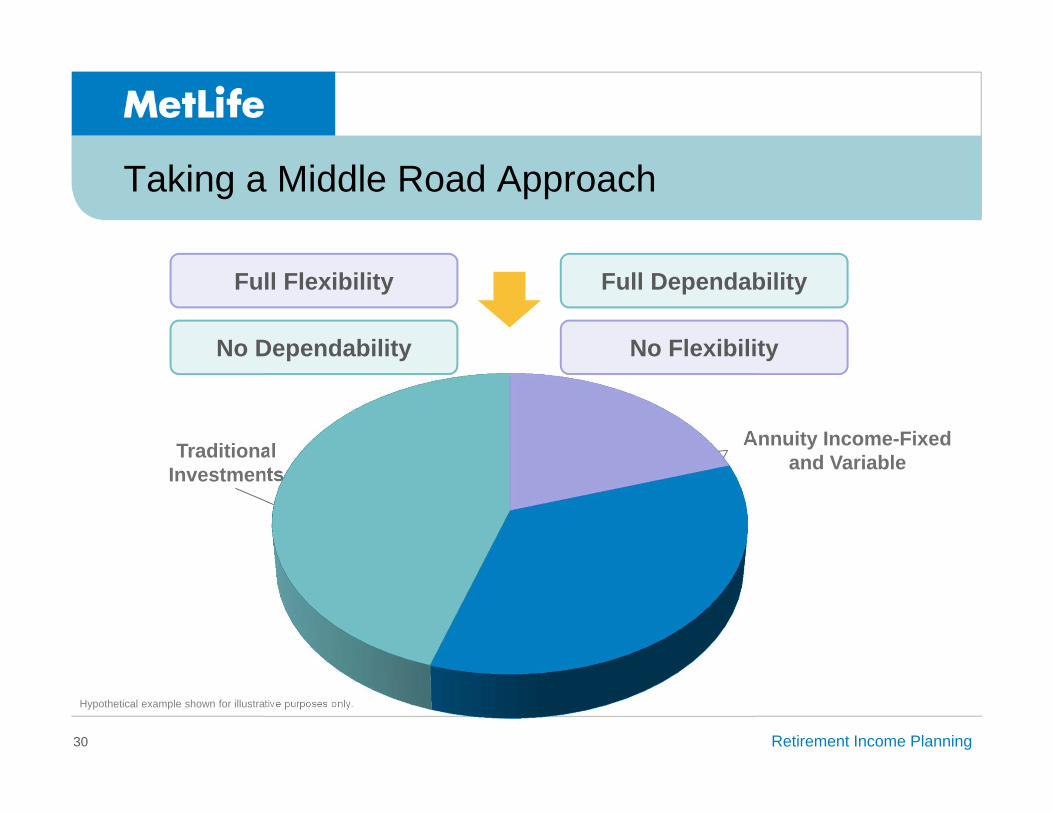
Taking a Middle Road Approach
30
Traditional Investments
Annuity Income-Fixed and Variable
Hypothetical example shown for illustrative purposes only.
Full Flexibility
No Dependability
Full Dependability
No Flexibility
Retirement Income Planning
Today’s Takeaways!
31
Your “needs” in retirement should be covered by income sources that last a lifetime
Determining the income allocation that’s best for you will help you cover both your “wants” and “needs”
Retirement income planning is no easy feat, however, there is a process to help get you there

Retirement Income Planning
Today’s Agenda
32
What would you like to get out of today’s session?

Retirement Income Planning33
Retirement Income Planning
Retirement Income Planning34
MetLife does not provide tax or legal advice. Please consult your tax advisor or attorney for such guidance.
Any discussion of taxes is for general informational purposes only, does not purport to be complete or cover every situation, and should not be construed as legal, tax or accounting advice. Clients should confer with their qualified legal, tax and accounting advisors as appropriate.
Metropolitan Life Insurance Company (MLIC), New York, NY 10166. Securities products offered by MetLife Securities, Inc. (MSI) (member FINRA/SIPC), 1095 Avenue of the Americas, New York, NY 10036. MLIC and MSI are MetLife companies.
L0316459412[exp0517][All States][DC,PR]