Retention of mechanical performance of polymer...
12
Retention of mechanical performance of polymer matrix composites above the glass transition temperature by vascular cooling Anthony M. Coppola a,c , Anthony S. Griffin b,c , Nancy R. Sottos b,c , Scott R. White a,c,⇑ a Department of Aerospace Engineering, University of Illinois at Urbana-Champaign, Urbana, IL 61801, USA b Department of Material Science and Engineering, University of Illinois at Urbana-Champaign, Urbana, IL 61801, USA c Beckman Institute for Advanced Science and Technology, University of Illinois at Urbana-Champaign, Urbana, IL 61801, USA article info Article history: Received 16 March 2015 Received in revised form 14 July 2015 Accepted 18 July 2015 Available online xxxx Keywords: B. Thermomechanical B. High-temperature properties Vascular cooling abstract An actively cooled vascular polymer matrix composite containing 3.0% channel volume fraction retains greater than 90% flexural stiffness when exposed continuously to 325 °C environmental temperature. Non-cooled controls suffered complete structural failure through thermal degradation under the same conditions. Glass–epoxy composites (T g = 152 °C) manufactured by vacuum assisted resin transfer mold- ing contain microchannel networks of two different architectures optimized for thermal and mechanical performance. Microchannels are fabricated by vaporization of poly(lactide) fibers treated with tin(II) oxa- late catalyst that are incorporated into the fiber preform prior to resin infiltration. Flexural modulus, material temperature, and heat removal rates are measured during four-point bending testing as a func- tion of environmental temperature and coolant flow rate. Simulations validate experimental measure- ments and provide insight into the thermal behavior. Vascular specimens with only 1.5% channel volume fraction centered at the neutral bending axis also retained over 80% flexural stiffness at 325 °C environmental temperature. Ó 2015 Elsevier Ltd. All rights reserved. 1. Introduction Polymer matrix composites (PMCs) are susceptible to reduced structural performance at elevated temperatures, such as those experienced during high speed flight [1–3], vehicle transportation [4–6], and during cycling of batteries, fuel cells, and other electron- ics [7–9]. Typical polymer matrices, such as epoxy, polyester, and vinyl-ester, have glass transition temperatures (T g ) at or below 200 °C, forcing the use of alternative materials such as metals and ceramics at service temperatures [3]. Subjecting a composite to high temperature, even for short time periods, can cause perma- nent damage, including delamination, matrix cracking, plastic deformation, and ultimately combustion and fire [10–13]. As an alternative, circulation of coolant through microvascular channels embedded directly into the PMC can regulate temperature by removing heat [14–16], potentially enabling safe structural perfor- mance under high thermomechanical loading. In PMCs, vascular networks have been fabricated by solder removal [17,18], manual extraction of a solid wire [19–21], integration of hollow tubules or fibers [22–28], and Va porization of S acrificial C omponents (VaSC) [29–31]. Unlike most other meth- ods which are restricted to straight channels with one-dimensional connectivity, VaSC using sacrificial fibers (SF) allows for three-dimensional, interconnected vascular architectures. To cre- ate a hollow channel poly(lactic acid) (PLA) SFs are integrated into textile weaving or braiding operations, survive standard composite manufacturing processing, and then are subsequently removed during a 200 °C post-cure [30]. When manufactured to minimize distortions to the structural fiber architecture, channels had mini- mal effect on tensile and compressive strength and modulus [21,26,31], interlaminar fracture toughness [19,25,27], and impact resistance [17,18,24,28]. Kozola et al. [14] studied active cooling in a vascularized epoxy fin heated at the base and reported up to a 53-fold increase in the effective heat transfer coefficient compared to an uncooled fin, while reducing the mean field temperature from 60 °C to 30 °C. Soghrati et al. [15,16] computationally modeled active cooling in 3D woven microvascular composites subjected to constant heat flux on one surface. Design charts related the maximum allowable temperature to the coolant flow rate and delivered heat flux. Phillips et al. [25] evaluated thermal transport in an actively heated carbon/epoxy fin subject to free convective cooling using http://dx.doi.org/10.1016/j.compositesa.2015.07.012 1359-835X/Ó 2015 Elsevier Ltd. All rights reserved. ⇑ Corresponding author at: 306 Talbot Laboratory, 104 South Wright Street, Urbana, IL 61801, USA. Tel.: +1 217 333 1077. E-mail address: [email protected] (S.R. White). Composites: Part A xxx (2015) xxx–xxx Contents lists available at ScienceDirect Composites: Part A journal homepage: www.elsevier.com/locate/compositesa Please cite this article in press as: Coppola AM et al. Retention of mechanical performance of polymer matrix composites above the glass transition tem- perature by vascular cooling. Composites: Part A (2015), http://dx.doi.org/10.1016/j.compositesa.2015.07.012
Transcript of Retention of mechanical performance of polymer...

Composites: Part A xxx (2015) xxx–xxx
Contents lists available at ScienceDirect
Composites: Part A
journal homepage: www.elsevier .com/locate /composi tesa
Retention of mechanical performance of polymer matrix compositesabove the glass transition temperature by vascular cooling
http://dx.doi.org/10.1016/j.compositesa.2015.07.0121359-835X/� 2015 Elsevier Ltd. All rights reserved.
⇑ Corresponding author at: 306 Talbot Laboratory, 104 South Wright Street,Urbana, IL 61801, USA. Tel.: +1 217 333 1077.
E-mail address: [email protected] (S.R. White).
Please cite this article in press as: Coppola AM et al. Retention of mechanical performance of polymer matrix composites above the glass transitioperature by vascular cooling. Composites: Part A (2015), http://dx.doi.org/10.1016/j.compositesa.2015.07.012
Anthony M. Coppola a,c, Anthony S. Griffin b,c, Nancy R. Sottos b,c, Scott R. White a,c,⇑a Department of Aerospace Engineering, University of Illinois at Urbana-Champaign, Urbana, IL 61801, USAb Department of Material Science and Engineering, University of Illinois at Urbana-Champaign, Urbana, IL 61801, USAc Beckman Institute for Advanced Science and Technology, University of Illinois at Urbana-Champaign, Urbana, IL 61801, USA
a r t i c l e i n f o a b s t r a c t
Article history:Received 16 March 2015Received in revised form 14 July 2015Accepted 18 July 2015Available online xxxx
Keywords:B. ThermomechanicalB. High-temperature propertiesVascular cooling
An actively cooled vascular polymer matrix composite containing 3.0% channel volume fraction retainsgreater than 90% flexural stiffness when exposed continuously to 325 �C environmental temperature.Non-cooled controls suffered complete structural failure through thermal degradation under the sameconditions. Glass–epoxy composites (Tg = 152 �C) manufactured by vacuum assisted resin transfer mold-ing contain microchannel networks of two different architectures optimized for thermal and mechanicalperformance. Microchannels are fabricated by vaporization of poly(lactide) fibers treated with tin(II) oxa-late catalyst that are incorporated into the fiber preform prior to resin infiltration. Flexural modulus,material temperature, and heat removal rates are measured during four-point bending testing as a func-tion of environmental temperature and coolant flow rate. Simulations validate experimental measure-ments and provide insight into the thermal behavior. Vascular specimens with only 1.5% channelvolume fraction centered at the neutral bending axis also retained over 80% flexural stiffness at 325 �Cenvironmental temperature.
� 2015 Elsevier Ltd. All rights reserved.
1. Introduction
Polymer matrix composites (PMCs) are susceptible to reducedstructural performance at elevated temperatures, such as thoseexperienced during high speed flight [1–3], vehicle transportation[4–6], and during cycling of batteries, fuel cells, and other electron-ics [7–9]. Typical polymer matrices, such as epoxy, polyester, andvinyl-ester, have glass transition temperatures (Tg) at or below200 �C, forcing the use of alternative materials such as metalsand ceramics at service temperatures [3]. Subjecting a compositeto high temperature, even for short time periods, can cause perma-nent damage, including delamination, matrix cracking, plasticdeformation, and ultimately combustion and fire [10–13]. As analternative, circulation of coolant through microvascular channelsembedded directly into the PMC can regulate temperature byremoving heat [14–16], potentially enabling safe structural perfor-mance under high thermomechanical loading.
In PMCs, vascular networks have been fabricated by solderremoval [17,18], manual extraction of a solid wire [19–21],
integration of hollow tubules or fibers [22–28], and Vaporization
of Sacrificial Components (VaSC) [29–31]. Unlike most other meth-ods which are restricted to straight channels with one-dimensionalconnectivity, VaSC using sacrificial fibers (SF) allows forthree-dimensional, interconnected vascular architectures. To cre-ate a hollow channel poly(lactic acid) (PLA) SFs are integrated intotextile weaving or braiding operations, survive standard compositemanufacturing processing, and then are subsequently removedduring a 200 �C post-cure [30]. When manufactured to minimizedistortions to the structural fiber architecture, channels had mini-mal effect on tensile and compressive strength and modulus[21,26,31], interlaminar fracture toughness [19,25,27], and impactresistance [17,18,24,28].
Kozola et al. [14] studied active cooling in a vascularized epoxyfin heated at the base and reported up to a 53-fold increase in theeffective heat transfer coefficient compared to an uncooled fin,while reducing the mean field temperature from 60 �C to 30 �C.Soghrati et al. [15,16] computationally modeled active cooling in3D woven microvascular composites subjected to constant heatflux on one surface. Design charts related the maximum allowabletemperature to the coolant flow rate and delivered heat flux.Phillips et al. [25] evaluated thermal transport in an activelyheated carbon/epoxy fin subject to free convective cooling using
n tem-

Fig. 1. Vascular composite specimens and channel architectures. The textile is composed of 3 warp layers and 4 weft layers, which are held together by the z-fibers. The arealdensity of the fabric is 4.07 kg/m2 (120 oz/yard2). In the warp layers there are 3.0 tows/cm and in the weft layers there are 2.7 tows/cm. The fiber content in the x and ydirections are nearly equivalent as a result of the difference in tow density. (a) Mid-plane channel (MPC) architecture contains four channels located at the mid-plane of thesample yielding a total channel volume fraction of Vc = 1.5%. (b) Surface channel (SC) architecture contains four channels located at each surface of the sample yielding a totalchannel volume fraction of Vc = 3.0%. (For interpretation of the references to color in this figure legend, the reader is referred to the web version of this article.)
Fig. 2. Active cooling test set-up. (a) Schematic of active cooling test concept. Heat is removed by coolant pumped through the channels at a constant rate, reducing thetemperature of the composite and improving mechanical properties. Heat is supplied convectively by the environmental chamber and conductively by the test fixtures. Acoordinate axis is included for reference, with the origin centered on the inlet face. (b) Photograph of the test setup inside the environmental chamber showing the placementof the specimen, test fixture, and the coolant delivery system. (For interpretation of the references to color in this figure legend, the reader is referred to the web version of thisarticle.)
Fig. 3. Thermocouple locations in actively cooled composites. Top surface thermo-couples (T1-5) were placed at (x, y, z) = (0, y, 1.75) where y = 5, 40, 50, 60, and 95.One each was placed on the front (F) and rear (R) edge of the specimen at (x, y,z) = (±8, 50, 0). One thermocouple was placed inside (I) of the specimen at (x, y,z) = (0, 60, 0) to measure the internal temperature and one on the bottom (B)surface at (x, y, z) = (0, 40, �1.75). Dashed lines indicate thermocouples that are notlocated on the visible surface in the given view. Dimensions are in mm.
2 A.M. Coppola et al. / Composites: Part A xxx (2015) xxx–xxx
Please cite this article in press as: Coppola AM et al. Retention of mechanical pperature by vascular cooling. Composites: Part A (2015), http://dx.doi.org/10.1
thermography to measure surface temperature. In a related study,Phillips and Baur [32] studied activation and deactivation of ashape memory polymer using microvascular heating and cooling,respectively. The authors developed a non-dimensional analyticalmodel to analyze and predict the heat transfer and temperaturefields. None of these prior studies have examined thermomechan-ical performance during active cooling.
In this study we demonstrate the effectiveness of active coolingthrough a vascularized composite to reduce temperature andmaintain structural performance while subject to a convectiveenvironment at temperatures greater than Tg. Flexural testing ofvascular specimens in an environmentally controlled chamberwas carried out. The vascular composite is composed of athree-dimensional orthogonally woven glass fiber textile infusedwith epoxy and vascularized using VaSC. Composites containingchannels at the mid-plane (i.e. mid-plane channels – ‘‘MPC’’) andthose containing channels at the surfaces (i.e. surface channels –‘‘SC’’) are compared. Both architectures were tested with activecooling using water for a variety of flow rates in the laminar regime
erformance of polymer matrix composites above the glass transition tem-016/j.compositesa.2015.07.012
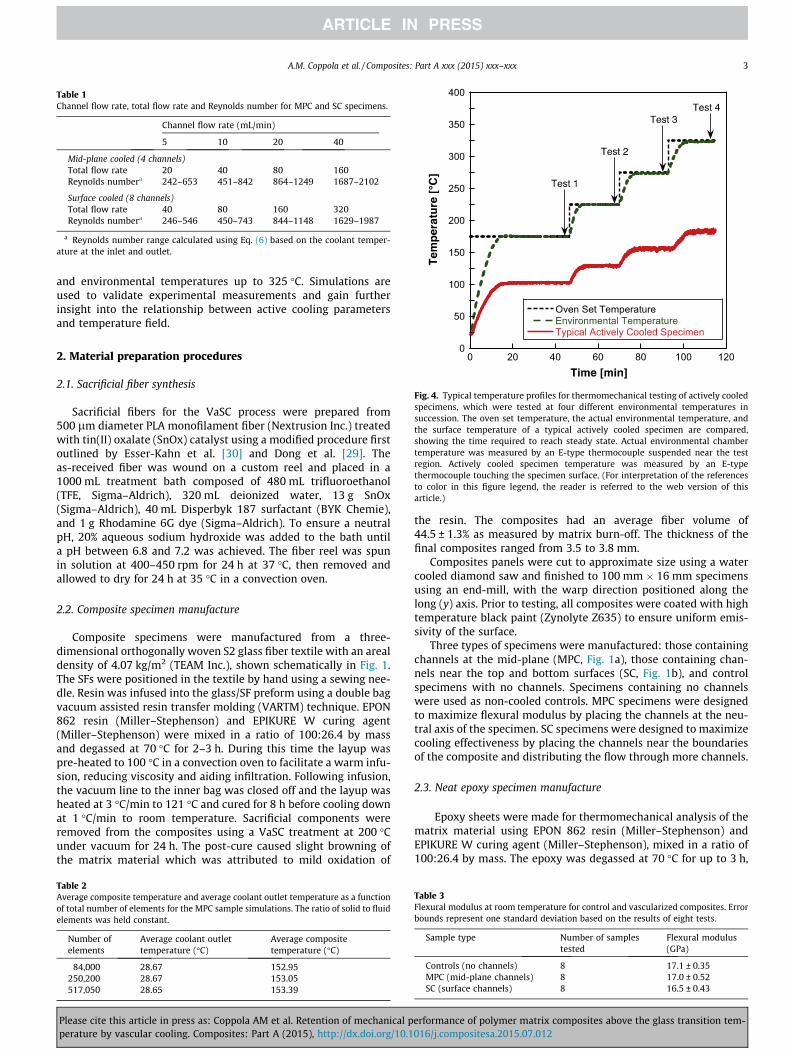
Table 1Channel flow rate, total flow rate and Reynolds number for MPC and SC specimens.
Channel flow rate (mL/min)
5 10 20 40
Mid-plane cooled (4 channels)Total flow rate 20 40 80 160Reynolds numbera 242–653 451–842 864–1249 1687–2102
Surface cooled (8 channels)Total flow rate 40 80 160 320Reynolds numbera 246–546 450–743 844–1148 1629–1987
a Reynolds number range calculated using Eq. (6) based on the coolant temper-ature at the inlet and outlet.
A.M. Coppola et al. / Composites: Part A xxx (2015) xxx–xxx 3
and environmental temperatures up to 325 �C. Simulations areused to validate experimental measurements and gain furtherinsight into the relationship between active cooling parametersand temperature field.
Fig. 4. Typical temperature profiles for thermomechanical testing of actively cooledspecimens, which were tested at four different environmental temperatures insuccession. The oven set temperature, the actual environmental temperature, andthe surface temperature of a typical actively cooled specimen are compared,showing the time required to reach steady state. Actual environmental chambertemperature was measured by an E-type thermocouple suspended near the testregion. Actively cooled specimen temperature was measured by an E-typethermocouple touching the specimen surface. (For interpretation of the referencesto color in this figure legend, the reader is referred to the web version of thisarticle.)
2. Material preparation procedures
2.1. Sacrificial fiber synthesis
Sacrificial fibers for the VaSC process were prepared from500 lm diameter PLA monofilament fiber (Nextrusion Inc.) treatedwith tin(II) oxalate (SnOx) catalyst using a modified procedure firstoutlined by Esser-Kahn et al. [30] and Dong et al. [29]. Theas-received fiber was wound on a custom reel and placed in a1000 mL treatment bath composed of 480 mL trifluoroethanol(TFE, Sigma–Aldrich), 320 mL deionized water, 13 g SnOx(Sigma–Aldrich), 40 mL Disperbyk 187 surfactant (BYK Chemie),and 1 g Rhodamine 6G dye (Sigma–Aldrich). To ensure a neutralpH, 20% aqueous sodium hydroxide was added to the bath untila pH between 6.8 and 7.2 was achieved. The fiber reel was spunin solution at 400–450 rpm for 24 h at 37 �C, then removed andallowed to dry for 24 h at 35 �C in a convection oven.
2.2. Composite specimen manufacture
Composite specimens were manufactured from a three-dimensional orthogonally woven S2 glass fiber textile with an arealdensity of 4.07 kg/m2 (TEAM Inc.), shown schematically in Fig. 1.The SFs were positioned in the textile by hand using a sewing nee-dle. Resin was infused into the glass/SF preform using a double bagvacuum assisted resin transfer molding (VARTM) technique. EPON862 resin (Miller–Stephenson) and EPIKURE W curing agent(Miller–Stephenson) were mixed in a ratio of 100:26.4 by massand degassed at 70 �C for 2–3 h. During this time the layup waspre-heated to 100 �C in a convection oven to facilitate a warm infu-sion, reducing viscosity and aiding infiltration. Following infusion,the vacuum line to the inner bag was closed off and the layup washeated at 3 �C/min to 121 �C and cured for 8 h before cooling downat 1 �C/min to room temperature. Sacrificial components wereremoved from the composites using a VaSC treatment at 200 �Cunder vacuum for 24 h. The post-cure caused slight browning ofthe matrix material which was attributed to mild oxidation of
Table 2Average composite temperature and average coolant outlet temperature as a functionof total number of elements for the MPC sample simulations. The ratio of solid to fluidelements was held constant.
Number ofelements
Average coolant outlettemperature (�C)
Average compositetemperature (�C)
84,000 28.67 152.95250,200 28.67 153.05517,050 28.65 153.39
Please cite this article in press as: Coppola AM et al. Retention of mechanical pperature by vascular cooling. Composites: Part A (2015), http://dx.doi.org/10.1
the resin. The composites had an average fiber volume of44.5 ± 1.3% as measured by matrix burn-off. The thickness of thefinal composites ranged from 3.5 to 3.8 mm.
Composites panels were cut to approximate size using a watercooled diamond saw and finished to 100 mm � 16 mm specimensusing an end-mill, with the warp direction positioned along thelong (y) axis. Prior to testing, all composites were coated with hightemperature black paint (Zynolyte Z635) to ensure uniform emis-sivity of the surface.
Three types of specimens were manufactured: those containingchannels at the mid-plane (MPC, Fig. 1a), those containing chan-nels near the top and bottom surfaces (SC, Fig. 1b), and controlspecimens with no channels. Specimens containing no channelswere used as non-cooled controls. MPC specimens were designedto maximize flexural modulus by placing the channels at the neu-tral axis of the specimen. SC specimens were designed to maximizecooling effectiveness by placing the channels near the boundariesof the composite and distributing the flow through more channels.
2.3. Neat epoxy specimen manufacture
Epoxy sheets were made for thermomechanical analysis of thematrix material using EPON 862 resin (Miller–Stephenson) andEPIKURE W curing agent (Miller–Stephenson), mixed in a ratio of100:26.4 by mass. The epoxy was degassed at 70 �C for up to 3 h,
Table 3Flexural modulus at room temperature for control and vascularized composites. Errorbounds represent one standard deviation based on the results of eight tests.
Sample type Number of samplestested
Flexural modulus(GPa)
Controls (no channels) 8 17.1 ± 0.35MPC (mid-plane channels) 8 17.0 ± 0.52SC (surface channels) 8 16.5 ± 0.43
erformance of polymer matrix composites above the glass transition tem-016/j.compositesa.2015.07.012

Fig. 5. Thermal and mechanical characterization of the epoxy matrix. (a) DMA testing results showing the storage modulus (E0), the loss modulus (E00) and tan(d). (b) TGAtesting results in an air/nitrogen environment (flow rates of 35 mL/min for each). (For interpretation of the references to color in this figure legend, the reader is referred tothe web version of this article.)
4 A.M. Coppola et al. / Composites: Part A xxx (2015) xxx–xxx
then poured into a 2 mm thick closed mold and cured at 121 �C for8 h with 3 �C/min heating and cooling rates. To replicate the pro-cessing conditions for the vascularized composites, the epoxywas then placed in a vacuum oven for 24 h at 200 �C.
3. Testing and analysis procedures
3.1. Characterization of actively cooled composites
3.1.1. Test setupMechanical performance of the active cooled specimens was
evaluated using a four-point bend test inside an environmentalchamber while coolant was circulated through the specimen
Fig. 6. Retained flexural modulus (RFM) as a function of environmental temper-ature. Control specimens (no microchannels) were thermally degraded at 325 �Cand retained no flexural capacity. Vascular specimens were tested with a coolantflow rate of 160 mL/min. Error bars represent one standard deviation. (Forinterpretation of the references to color in this figure legend, the reader is referredto the web version of this article.)
Please cite this article in press as: Coppola AM et al. Retention of mechanical pperature by vascular cooling. Composites: Part A (2015), http://dx.doi.org/10.1
(Fig. 2). A flexural test was chosen primarily because it allowedfor simple attachment of the coolant delivery system to the speci-men. All testing was performed on an electromechanical testingframe (Instron, Model 5984) equipped with a four-point bendingfixture (Instron, Model 2810-400). Load was measured using a5 kN load cell (Instron, Model 2580), and strain was measured fromcenter point deflection using a video extensometer (Instron, Model2663-821) with a 60 mm field of view. Heat was delivered by anenvironmental chamber (Instron, Model 3119-410), which pro-vided convectively heated airflow, as well as conduction from con-tact with the bending fixture.
Coolant was pumped through each channel independently inactively cooled specimens using a peristaltic pump (Cole–Parmer,Model EW-07551-00), ensuring equal flow in each channel. Tapwater stored at room temperature was used as coolant and wasnot recirculated to ensure constant supply temperature. Fluidwas delivered via 1/4 in. OD, 1/8 in. ID silicone rubber tubing con-nected to the channels using 21 gage stainless steel syringe tipslinked by low contraction, high temperature heat shrink tubing(fluorinated ethylene propylene). One syringe tip was connectedto the silicone tubing, while the other was inserted 2–3 mm intoa hole drilled in the end of the channel and sealed with epoxyadhesive (J-B Weld epoxy). The heat shrink tubing was sufficientlyflexible to prevent mechanically constraining the specimen motionduring testing. The delivery setup was insulated with glass woolwrapped in aluminum foil to minimize heating of the fluid priorto delivery into the specimen.
The fluid temperature was measured near the inlet and outlet ofthe specimen using type T thermocouples (Omega Engineering,Model TMQSS-020U) inserted into 4 of the 8 tubing connections.All four channels were monitored for the MPC specimens and thetop four in the SC specimens (which were independently verifiedto provide similar data to the bottom four channels).Thermocouples were inserted into a hole drilled in a 1/800 straightbarbed polycarbonate fitting and positioned in the middle of theflow path then sealed with epoxy adhesive. Thermocouple datawas collected using several four-input temperature sensors(Phidgets, Model 1048) and recorded using a custom LabVIEWcode (National Instruments) at 1 Hz continuously.
Specimen temperature was measured using type E thermocou-ples (Omega Engineering, Model EMQSS-020U) placed as shown in
erformance of polymer matrix composites above the glass transition tem-016/j.compositesa.2015.07.012

Table 4Flexural modulus results for all test conditions. Control specimens do not contain microchannels. Active cooling results are arranged by total flow rate. Error bounds represent onestandard deviation.
Flexural modulus (GPa)
T (Environment) (�C) Control Mid-plane cooled (MPC) Surface cooled (SC)Total flow rate (mL/min) Total flow rate (mL/min)
20 40 80 160 40 80 160 320
25 17.2 ± 0.4 17.2 ± 0.3 17.4 ± 0.4 17.2 ± 0.4 17.3 ± 0.3 17.3 ± 0.2 17.4 ± 0.2 17.1 ± 0.2 17.3 ± 0.275 16.2 ± 0.3 – – – – – – – –
125 15.2 ± 0.4 – – – – – – – –137 13.4 ± 0.4 – – – – – – – –150 10.1 ± 0.3 – – – – – – – –162 7.70 ± 0.40 – – – – – – – –175 7.67 ± 0.17 16.1 ± 0.1 16.2 ± 0.4 16.3 ± 0.2 16.3 ± 0.2 16.3 ± 0.3 16.6 ± 0.1 16.4 ± 0.2 16.6 ± 0.2225 7.25 ± 0.12 15.2 ± 0.2 15.6 ± 0.3 15.6 ± 0.2 15.7 ± 0.2 15.9 ± 0.6 16.0 ± 0.1 16.1 ± 0.3 16.2 ± 0.2275 6.94 ± 0.27 13.8 ± 0.5 14.5 ± 0.2 14.8 ± 0.2 14.9 ± 0.3 15.0 ± 0.5 15.5 ± 0.1 15.7 ± 0.2 15.8 ± 0.1325 0a 11.5 ± 0.3 13.0 ± 0.1 13.5 ± 0.3 13.9 ± 0.2 14.2 ± 0.6 14.8 ± 0.1 15.1 ± 0.2 15.4 ± 0.1
a Thermal degradation of epoxy occurred.
Fig. 7. RFM as a function of the total coolant flow rate in a 325 �C environment.Error bars represent one standard deviation. (For interpretation of the references tocolor in this figure legend, the reader is referred to the web version of this article.)
A.M. Coppola et al. / Composites: Part A xxx (2015) xxx–xxx 5
Fig. 3. Surface thermocouples were held in place using a smallamount of epoxy adhesive (J-B Weld). The internal thermocouplewas inserted into a small hole of the same diameter drilled intothe specimen and sealed in place with epoxy. Temperature wascollected using the same data acquisition method used to recordfluid temperature.
3.1.2. Test procedureActively cooled test conditions are summarized in Table 1. MPC
specimens containing 4 channels and SC specimens containing 8channels were evaluated at flow rates of 5, 10, 20 and 40 mL/minper channel. Total flow rate for each architecture differed basedon the total number of channels. The Reynolds number was<2300 for all flow rates, indicating laminar flow (seeSection 3.1.3 for calculation of Reynolds number).
For thermomechanical testing, samples were evaluated infour-point bending according to ASTM D7264. The outer spanwas 80 mm and the inner span was 40 mm. Tests were performed
Please cite this article in press as: Coppola AM et al. Retention of mechanical pperature by vascular cooling. Composites: Part A (2015), http://dx.doi.org/10.1
at a constant displacement rate of 1 mm/min to a maximum strainof 0.21% to avoiding damage to the specimen and allow for multi-ple tests of the same specimen at different temperatures and flowrates. Tests were conducted at four elevated temperature condi-tions in succession (175 �C, 225 �C, 275 �C, and 325 �C) accordingto the protocol shown in Fig. 4 in order to achieve steady state con-ditions. Following a complete round of testing (to 325 �C) the ovenwas cooled naturally to room temperature and the process wasrepeated at the next flow rate. No deformation or changes in roomtemperature flexural modulus were observed in the specimensafter each testing cycle. Three specimens were tested for both vas-cular architectures.
Separate tests were conducted for thermal characterization ofthe specimens using embedded thermocouples as specified inFig. 3. The environmental temperature was again increasedsequentially (175 �C, 225 �C, 275 �C, and 325 �C), but at each tem-perature all flow rates (5–40 mL/min) were tested to expedite test-ing. Results using this protocol were compared to results from theprotocol used for mechanical testing, and no differences in speci-men temperature were found. Again, three tests were performedfor each vascular architecture.
3.1.3. Data analysisFlexural modulus was calculated as the secant modulus from
0.1 to 0.2% maximum flexural strain. The retained flexural modulus(RFM) was calculated as
RFM ¼ E T�ð ÞE TRTð Þ ; ð1Þ
where EðTRTÞ is the room temperature flexural modulus and EðT�Þ isthe flexural modulus at T* = environmental temperature of thechamber. Both temperatures are in �C. The total heat removal ratewas calculated as
q ¼X
n¼4 or 8
ðQqcpDTÞn; ð2Þ
where Q is the volumetric flow rate of the coolant in each channel, qis the density of the fluid, cp is the specific heat capacity of the fluid,and DT is the change in fluid temperature from inlet to outlet foreach channel. n is the number of channels and is equal to 4 forthe MPC specimens and 8 for the SC specimens. Density and specificheat capacity were taken from tabulated data using average fluidtemperature based on inlet and outlet fluid temperature. The totalpumping power is equal to
P ¼X
n¼4 or 8
QDpð Þn; ð3Þ
erformance of polymer matrix composites above the glass transition tem-016/j.compositesa.2015.07.012

Fig. 8. Average surface temperature (Tavgsurface) for vascular specimens for all testing conditions. (a) Top surface temperature as a function of environmental temperature for a
fixed total flow rate of 160 mL/min. (b) Top surface temperature as a function of total coolant flow rate for a fixed environmental temperature of 325 �C. Error bars representone standard deviation. (For interpretation of the references to color in this figure legend, the reader is referred to the web version of this article.)
Table 5Average top surface temperature for actively cooled specimens as a function of total flow rate. Error bounds represent one standard deviation.
Average top surface temperature (�C)
T (Environment) (�C) Mid-plane cooled (MPC) Surface cooled (SC)Total flow rate (mL/min) Total flow rate (mL/min)
20 40 80 160 40 80 160 320
175 110 ± 3 105 ± 3 102 ± 3 100 ± 3 93 ± 2 88 ± 2 85 ± 2 83 ± 2225 140 ± 4 134 ± 4 130 ± 4 127 ± 4 117 ± 3 111 ± 3 107 ± 3 105 ± 3275 171 ± 5 163 ± 5 158 ± 5 155 ± 5 142 ± 3 135 ± 3 130 ± 3 127 ± 3325 203 ± 6 194 ± 7 188 ± 7 183 ± 7 169 ± 3 160 ± 3 154 ± 3 151 ± 4
Fig. 9. Temperature distribution for actively cooled specimens. Temperature (a) along the x = 0 plane and (b) along the y = 50 mm plane for actively cooled composites in a325 �C environment at a total flow rate of 160 mL/min. See Fig. 3 for detailed description of thermocouple location. Error bars represent one standard deviation. (Forinterpretation of the references to color in this figure legend, the reader is referred to the web version of this article.)
6 A.M. Coppola et al. / Composites: Part A xxx (2015) xxx–xxx
Please cite this article in press as: Coppola AM et al. Retention of mechanical performance of polymer matrix composites above the glass transition tem-perature by vascular cooling. Composites: Part A (2015), http://dx.doi.org/10.1016/j.compositesa.2015.07.012

Table 6Heat removal rate results for high temperature testing of MPC and SC specimens. Error bounds represent one standard deviation.
Heat removal rate (W)
T (Environment) (�C) Mid-plane cooled (MPC) Surface cooled (SC)Total flow rate (mL/min) Total flow rate (mL/min)
20 40 80 160 40 80 160 320
175 34.5 ± 1.2 36.5 ± 1.7 38.2 ± 3.7 42.8 ± 4.5 47.1 ± 1.5 50.0 ± 2.0 54.7 ± 1.4 62.2 ± 4.1225 46.7 ± 2.3 48.5 ± 2.4 50.6 ± 4.0 56.3 ± 5.7 62.8 ± 2.4 66.7 ± 2.7 73.2 ± 1.8 80.7 ± 6.5275 59.3 ± 2.4 61.5 ± 3.3 64.1 ± 3.8 71.0 ± 6.9 82.3 ± 2.2 85.9 ± 3.9 92.6 ± 2.8 101.3 ± 8.1325 73.8 ± 3.7 77.5 ± 6.3 81.0 ± 7.9 91.1 ± 9.0 101.4 ± 2.7 106.3 ± 3.9 113.4 ± 1.8 123.8 ± 7.8
Fig. 10. Heat removal rate (q) for vascular specimens for all testing conditions. (a) Heat removal rate as a function of environmental temperature for a fixed total flow rate of160 mL/min. (b) Heat removal rate as a function of total coolant flow rate for a fixed environmental temperature of 325 �C. Error bars represent one standard deviation. (Forinterpretation of the references to color in this figure legend, the reader is referred to the web version of this article.)
Fig. 11. Coolant temperature (Tcoolant) at the inlet and outlet of the SC specimens asa function of total flow rate in a 325 �C environment. Error bar represent onestandard deviation.
Fig. 12. RFM of actively cooled composites in a 325 �C environment as a function oftotal pumping power to circulate the fluid. Error bars represent one standarddeviation. (For interpretation of the references to color in this figure legend, thereader is referred to the web version of this article.)
A.M. Coppola et al. / Composites: Part A xxx (2015) xxx–xxx 7
Please cite this article in press as: Coppola AM et al. Retention of mechanical performance of polymer matrix composites above the glass transition tem-perature by vascular cooling. Composites: Part A (2015), http://dx.doi.org/10.1016/j.compositesa.2015.07.012

Fig. 13. Average top surface temperature (Tavgsurface) and heat removal rate (q) as a
function of total flow rate compared for the model and experimental results at anenvironmental temperature of 325 �C. Results are shown for the MPC specimens.Error bars for experimental data represent one standard deviation. (For interpre-tation of the references to color in this figure legend, the reader is referred to theweb version of this article.)
8 A.M. Coppola et al. / Composites: Part A xxx (2015) xxx–xxx
where Dp is the pressure drop through each channel. The pressuredrop for each channel was evaluated from the Hagen–Poiseuillerelation for laminar flow as
Dp ¼ 128lLQ
pD4 ; ð4Þ
where L and D are the channel’s length and diameter, respectively,and l is the dynamic viscosity of the coolant. The temperaturedependence of dynamic viscosity of water is approximated usingthe Seeton relation [33].
l ¼ 0:02414� 10247:8
Tf �140; ð5Þ
Fig. 14. Temperature distribution in actively cooled specimens compared for the modey = 50 mm plane for actively cooled composites in a 325 �C environment at a total flow rabars for experimental data represent one standard deviation. (For interpretation of the refarticle.)
Please cite this article in press as: Coppola AM et al. Retention of mechanical pperature by vascular cooling. Composites: Part A (2015), http://dx.doi.org/10.1
where the viscosity is measured in centipoise and Tf (K) is the tem-perature of the coolant. Again, the average value of the inlet andoutlet temperature was used. The Reynolds number was calculatedbased on channel diameter as
ReD ¼qQDlA
; ð6Þ
where A is the channel’s cross sectional area.
3.2. Characterization of control and non-cooled vascular composites
3.2.1. Room temperature testingControl and vascular composites were tested without coolant in
four-point bending according to ASTM D7264 at room temperatureand flexural modulus was recorded. Eight specimens of each typewere tested. Analysis of variance (ANOVA) was conducted to testfor statistically significant differences and a 5% significance (criticalp-value = 0.05) level was chosen for evaluation.
3.2.2. High temperature testingControls samples (no channels) were also tested at tempera-
tures up to 325 �C for comparison to actively cooled vascular com-posites. Five specimens were tested at each temperature, exceptfor the 325 �C test, where only one specimen was tested. A mini-mum of 10 min was allowed at each testing temperature for equi-libration before beginning mechanical testing.
3.3. Characterization of neat epoxy
Dynamic mechanical analysis (DMA) was conducted accordingto ASTM D7028 to measure the thermomechanical behavior ofthe neat epoxy matrix. Specimens were cut from a neat epoxysheet using a diamond blade wet saw. Epoxy bars measuring2 mm � 6 mm � 35 mm were tested in three-point bending on aDMA (TA Instruments, Model RSAIII) at 1 Hz to a maximum strainof 0.1% on a 25 mm span. The temperature was ramped at 5 �C/minfrom 25 to 200 �C in a nitrogen environment. A nitrogen environ-ment was selected to minimize oxidation, helping to ensure thatthe changes in moduli measured were due to changes in
l and experimental results. Temperature (a) along the x = 0 plane and (b) along thete of 160 mL/min. See Fig. 3 for detailed description of thermocouple location. Errorerences to color in this figure legend, the reader is referred to the web version of this
erformance of polymer matrix composites above the glass transition tem-016/j.compositesa.2015.07.012

Fig. 15. Temperature profiles along the y = 50 mm plane from simulation results for the MPC and SC samples in a 325 �C environment at each value of total flow rate testedduring experiments. Tg is marked on the temperature map. The edge of each channel is marked by black circles. (For interpretation of the references to color in this figurelegend, the reader is referred to the web version of this article.)
A.M. Coppola et al. / Composites: Part A xxx (2015) xxx–xxx 9
temperature and not time-dependent chemical changes in theepoxy. Tg was recorded using a step transition analysis of the stor-age modulus (E0). Thermogravimetric analysis (TGA) was also con-ducted to measure thermal stability of the epoxy. Small samples ofepoxy (5–10 mg) were tested by TGA (Mettler Toledo, ModelTGA/DSC 1) from 25 to 600 �C at a heating rate of 10 �C/min.Tests were conducted in a mixed air/nitrogen environment, withflow rates of 35 mL/min for each. Air was included to simulatethe environment experienced by the composite specimens in theenvironmental chamber and allow for oxidation in the degradationprocess. Two tests were run for both DMA and TGA to confirmrepeatability.
3.4. Simulation of heat transfer and temperature fields
The thermal performance of the actively cooled composite atsteady-state was simulated using a commercial computationalfluid dynamics software package, ANSYS Fluent v15.0. The modelincluded the entire microvascular composite sample, but not thecoolant delivery system or the flexure fixture. Two versions ofthe model were created to include both the MPC and SC samples.Sample geometry was based on the experimental setup shown inFig. 2 and the dimensions given in Section 2.2. A sample thicknessof 3.5 mm was modeled. Fluid properties matched those used inthe experimental analysis. Thermal conductivity of the compositewas calculated using the procedure explained in Appendix A andmaking use of existing conductivity models for woven textiles[34,35]. The thermal conductivities of the composite were calcu-lated both in-plane kx = ky = 0.609 W/m K and out-of-planekz = 0.450 W/m K. The thermal conductivity of the water was takenas kw = 0.600 W/m K.
As in the experiment, water was distributed evenly througheach of the channels along the y-direction. Fluid flow rate and envi-ronmental temperature were chosen to match the values used forthe experiment. Inlet water temperature was set to the value mea-sured during the experiment to eliminate the need to model theheating of the fluid in the coolant delivery system. Heat was pro-vided to the specimens by a combined uniform convection andradiative heating on all surfaces of the sample. The convectioncoefficient was chosen to best fit both the heat removal rate andtemperature field measured during the experiment. In this way,the convection coefficient took into account both sample heating
Please cite this article in press as: Coppola AM et al. Retention of mechanical pperature by vascular cooling. Composites: Part A (2015), http://dx.doi.org/10.1
from the air and from contact with the fixture. A value ofh = 130 W/m2 K was used for all tests. The emissivity of the samplesurface was set to 0.95, based on the emissivity of the black paintapplied to all samples.
A conforming, hexahedral finite volume mesh was generated tosimulate the MPC and SC samples using ANSYS Meshing v15.0. TheMPC mesh contained 91,200 fluid elements and 159,000 solid ele-ments and the SC mesh contained 182,550 fluid elements and229,950 solid elements. More elements were used in the SC meshto provide sufficient resolution of the mesh around the additionalchannels. Temperature at steady state was not appreciably chan-ged by using meshes with either more and less elements (seeTable 2 for the MPC model). Simulations were performed inANSYS Fluent using the SIMPLE pressure–velocity couplingscheme, Green-Gauss node-based gradient discretization,second-order pressure discretization, third-order MUSCL momen-tum discretization, and third-order MUSCL energy discretization.The model solved for the conversation of mass, momentum andenergy for an incompressible Newtonian fluid with laminar flow.The convergence criteria were for velocity and continuity residualsto reach 10�4 and energy residuals to reach 10�8.
4. Results and discussion
4.1. Effect of vascularization on flexural modulus at room temperature
Room temperature flexural test results are presented in Table 3.No statistically significant difference in flexural modulus wasfound (p-value = 0.0503 from ANOVA). No appreciable differencein average modulus was measured between the non-vascular con-trols and MPC specimens, as expected. A slight reduction isreported for SC specimens although it is well within experimentalscatter.
4.2. Thermomechanical behavior of neat epoxy
DMA testing reveals a gradual reduction in storage modulusbelow the Tg of 152 �C followed by a drop of almost two orders ofmagnitude above Tg (Fig. 5a). The peak in tan(d) is 160 �C. Mass losswas detected by TGA as early as 200 �C and reached 3 wt% by 325 �C(Fig. 5b). A sharp drop in mass is noted at roughly 360 �C.
erformance of polymer matrix composites above the glass transition tem-016/j.compositesa.2015.07.012

10 A.M. Coppola et al. / Composites: Part A xxx (2015) xxx–xxx
4.3. Thermomechanical behavior of actively cooled composites
Active cooling of composites leads to vastly improved mechan-ical performance at high temperature (Fig. 6 and Table 4). For SCspecimens nearly 90% RFM is achieved at 325 �C environmentaltemperature with a total coolant flow rate of 160 mL/min. In starkcontrast, control specimens possess no structural capacity at thesame temperature and show a sharp drop in flexural moduluswhen the environmental temperature approaches the Tg of thematrix. Actively cooled composites have a small change in proper-ties near Tg and only a modest decrease in flexural modulus overthe entire range of temperatures tested.
The effect of vascular architecture on RFM is also revealed inFig. 6. SC specimens retained higher flexural modulus than MPCspecimens at the same total coolant flow rate. Given that the SCarchitecture distributed the coolant closer to the surface, this con-figuration is more effective at cooling the specimen (see Fig. 8) andresults in higher retention of flexural modulus.
The effect of flow rate on RFM is presented in Fig. 7. In both SCand MPC architectures increasing total coolant flow rate leads tohigher retained modulus. Importantly, the SC architecture is moreeffective compared to MPC at all flow rates tested. Even the lowestflow rate tested for the SC architecture (40 mL/min) outperformsthe MPC architecture at the highest flow rate (160 mL/min).These results emphasize the crucial role that the vascular architec-ture plays in maximizing cooling effectiveness. Increasing flow rateeventually becomes less effective in either architecture as the cool-ant traverses the channels too quickly to extract additional heat(see Fig. 11).
4.4. Temperature of actively cooled composites
Temperature of the actively cooled composites is influenced bychannel architecture, coolant flow rate, and environmental tem-perature. The average top surface temperature for all test condi-tions is reported in Table 5 and plotted in Fig. 8. Undermaximum cooling (SC at 320 mL/min), the top surface temperaturewas reduced to 151 �C (ca. 40% of environmental temperature) inthe 325 �C environment. The SC architecture cooled more effec-tively than the MPC architecture at all environmental tempera-tures and for all flow rates. For both architectures, the relationbetween surface temperature and flow rate is non-linear, withthe surface temperature gradually leveling off as flow rate isincreased.
Fig. 9 shows the temperature distribution in a 325 �C environ-ment for both MPC and SC specimens at 160 mL/min flow rate.The top surface temperature (T1-5) shows no evidence of theincrease in coolant temperature along the y-direction (ca. 10 �Crise, see Fig. 11). Non-uniform heating from variations in the air-flow currents and contact with the fixtures may have obscuredthe effect of increasing coolant temperature on surface tempera-ture. The bottom thermocouple (B) measured temperatures nearlyidentical to the corresponding top thermocouple (T2) for both MPCand SC specimens. The internal thermocouple (I) measured a lowertemperature than the corresponding top surface thermocouple(T4), indicating non-uniform temperature through the thickness.Interestingly, the surface temperature of both MPC and SC speci-mens was at or above Tg in the 325 �C environment. However,internal temperature of the SC specimens was reduced to just96 ± 7 �C in the 325 �C environment under 160 mL/min total flowrate. The temperature of the MPC specimens in the same locationwas only reduced to 130 ± 7 �C, much closer to Tg. The highest tem-peratures for both architectures were observed at the front andrear edges of the specimen due to limited cooling at these bound-aries. The airflow direction (front to back) led to a higher temper-ature on the front edge (x = �8 mm) than the rear edge (x = 8 mm).
Please cite this article in press as: Coppola AM et al. Retention of mechanical pperature by vascular cooling. Composites: Part A (2015), http://dx.doi.org/10.1
4.5. Heat removal rate by the active cooling network
The total heat removal rates for all experiments are given inTable 6. Active cooling at maximum flow rate for SC specimensremoved 120 W of heat in a 325 �C environment. In general, heatremoval rates increased linearly as a function of environmentaltemperature and flow rate (Fig. 10). SC specimens removed moreheat than MPC specimens for all flow rates tested and environmen-tal temperatures. Heat removal rate depended explicitly on thetemperature differential of the coolant from inlet to outlet.Fig. 11 shows the temperature of the coolant at the inlet and theoutlet as a function of the total flow rate in a SC specimen in a325 �C environment. Both inlet and outlet temperatures convergedat higher flow rates, although heat removal rate continued toincrease linearly for the flow rate range tested (Fig. 10b).
4.6. Pumping power considerations on active cooling
Active cooling effectiveness was shown to depend on botharchitecture and flow rate. Increasing the total flow rate and dis-persing the flow through more channels placed near the surfaceimproved active cooling effectiveness, but with the penalty ofincreased pumping power. Fig. 12 shows the RFM as a functionof total pumping power. While increased pumping power providedmodest benefits initially, RFM was nearly constant at high pump-ing powers. This trend was more dramatic than when comparingRFM to flow rate because pumping power increases with thesquare of the flow rate. Selection of an appropriate flow rate basedon the total heat load and target temperature is important for min-imizing wasted energy as a result of excessive pumping power. SCspecimens had higher RFM than MPC specimens with respect topumping power, indicating that dispersing the flow through morechannels placed near the surface was more energy efficient.
4.7. Experimental results vs. simulation
Simulation results are compared to experimental data inFigs. 13 and 14, showing good agreement. Fig. 13 compares theaverage top surface temperature and heat removal rate as a func-tion of total flow rate through the mid-plane cooled specimen.All simulation results fall within the error bars for the experiment.Similar trends were found for the SC simulation. Fig. 14 comparesthe point-by-point temperature distribution throughout the MPCcomposite at an environmental temperature of 325 �C and totalflow rate of 160 mL/min. Along the x = 0 plane, most points fallwithin the experimental error. The simulation results show thatthe temperature should steadily increase along the top surfacefrom inlet to outlet as the coolant temperature increases. Thistrend was not observed during the experiment however and weattribute this to variations in air currents within the convectiveoven and contact with the sample loading fixture. Along they = 50 mm plane, good agreement occurs for the top surface, butthe front side shows significant differences. Again, this is likelydue to differences in convection over the sample surface withinthe oven. These results indicate that the convective coefficient issignificantly higher on the front edge of the sample.Nevertheless, the overall thermomechanical behavior and mainconclusions are unaffected.
4.8. Through-thickness temperature profiles
The cross-sectional temperature profiles from simulation areshown in Fig. 15 for the MPC and SC samples for an environmentaltemperature of 325 �C and at each value of total flow rate. Local toeach channel the temperature is reduced significantly and the
erformance of polymer matrix composites above the glass transition tem-016/j.compositesa.2015.07.012

A.M. Coppola et al. / Composites: Part A xxx (2015) xxx–xxx 11
center of each specimen is significantly cooler than the outer sur-faces. Placement of the channels near the surface in the SC sampleresults in greatly reduced temperature throughout the thicknessrelative to the MPC sample. Increased flow rate decreases temper-ature throughout the cross section and, importantly, reduces theportion of the specimen above Tg. However, even at the lowest flowrate for the MPC case, a significant portion of the specimen is stillbelow Tg, providing material with sufficient modulus to sustain theflexural load.
5. Conclusions
In this study, the thermomechanical behavior of actively cooledvascularized composites was examined during a four-point bend-ing test in a convectively heated chamber. Structural performanceof actively cooled specimens was dramatically improved comparedto non-cooled controls. Actively cooled specimens retained up to90% of their room temperature flexural modulus at 325 �C. In con-trast, non-cooled control specimens showed a sharp reduction inflexural modulus above glass transition temperature and completeloss of structural capability at 325 �C. Improved structural perfor-mance in actively cooled specimens resulted from heat removaland the corresponding decrease in material temperature.Thermal testing indicated non-uniform temperature in activelycooled specimens. Surface temperature rose above Tg for botharchitectures in the 325 �C environment, while the internal tem-perature was maintained below Tg. However, even in these casesonly modest reductions in the structural performance occurred.Flexural modulus increased and composite temperature decreasednon-linearly as a function of flow rate, with the greatest perfor-mance improvement at low flow rates. Heat removal rate alsoincreased with flow rate but showed a more linear trend. Surfacecooled composites outperformed mid-plane cooled compositesthroughout testing, even when pumping power was taken intoaccount, indicating the importance of channel architecture on cool-ing performance.
Simulations of the heat transfer showed good agreement withexperimental measurements for both temperature and heatremoval rates. Temperature profiles of the actively cooled speci-mens from simulation confirmed the presence of a temperaturegradient, with the highest temperatures on the surface andreduced temperature near the channel walls. In all cases, a portionof the actively cooled specimens was maintained below Tg, allow-ing for the specimen to retain mechanical performance (flexuralmodulus) in comparison to samples that were not cooled.
Acknowledgments
The authors would like to acknowledge the financial support bythe Air Force Office of Scientific Research as part of aMultidisciplinary University Research Initiative, Award No.FA9550-09-1-0686, Synthesis, Characterization and PrognosticModeling of Functionally Graded Hybrid Composites for ExtremeEnvironments. Financial support was also provided by theNational Science Foundation Graduate Research Fellowship underGrant No. DGE 11-44245. The authors would also like to thankStephen Pety for his assistance with developing the FluentSimulation and Greg Milner of the UIUC Talbot Lab machine shopfor assistance with sample preparation.
Appendix A
In-plane and transverse thermal conductivities of thethree-dimensional woven glass fiber/epoxy composite were calcu-lated using the following procedure. The textile shown in Fig. 1 is
Please cite this article in press as: Coppola AM et al. Retention of mechanical pperature by vascular cooling. Composites: Part A (2015), http://dx.doi.org/10.1
modeled as a [90/0]s composite, to take into account the differencein tow spacing that leads to nearly equivalent fiber content in thewarp and weft directions. Based on this assumption, the in-planethermal conductivity is
kx ¼ ky ¼ 1=2ð Þkl þ 1=2ð Þkt ; ð7Þ
where kl is the thermal conductivity of a unidirectional compositein the direction longitudinal to the fibers and kt is the thermal con-ductivity transverse to the fibers. The out-of-plane thermal conduc-tivity is
kz ¼ kt : ð8Þ
The longitudinal thermal conductivity is then calculated [34] as
kl ¼ kf Vf þ km 1� Vmð Þ; ð9Þ
and the transverse thermal conductivity is calculated [35] as
kt ¼ kmkm þ kf þ Vf kf � km
� �
km þ kf � Vf kf � km� � : ð10Þ
Here km and kf are the thermal conductivities of the matrix andfiber, respectively. The matrix conductivity is 0.23 W/m K and thefiber conductivity is 1.45 W/m K [16]. Vf is the fiber volume frac-tion, which was assumed uniform throughout the composite andequal to 0.445. The resulting in-plane thermal conductivity iskx = ky = 0.609 W/m K and out-of-plane is kz = 0.450 W/m K.
References
[1] Meese EA, Nørstrud H. Simulation of convective heat flux and heat penetrationfor a spacecraft at re-entry. Aerosp Sci Technol 2002;6(3):185–94.
[2] Hengeveld D, Mathison M, Braun J, Groll E, Williams A. Review of modernspacecraft thermal control technologies. HVACR Res 2010;16(2):189–220.
[3] Meetham GW. High-temperature materials-a general review. J Mater Sci1991;26:853–60.
[4] Sonsino C, Moosbrugger E. Fatigue design of highly loaded short-glass-fibrereinforced polyamide parts in engine compartments. Int J Fatigue2008;30(7):1279–88.
[5] Johnson RW, Evans JL, Jacobsen P, Thompson JRR, Christopher M. The changingautomotive environment: high-temperature electronics. IEEE Trans ElectronPackag Manuf 2004;27(3):164–76.
[6] Boyd J. BMI composites. In: Donaldson SL, Micracle DB, editors. ASM handbookvolume 21: composites. Materials Park, OH: ASM International; 2001. p.100–4.
[7] Park J, Li X. Effect of flow and temperature distribution on the performance of aPEM fuel cell stack. J Power Sources 2006;162(1):444–59.
[8] Rao Z, Wang S. A review of power battery thermal energy management. RenewSustain Energy Rev 2011;15(9):4554–71.
[9] Sabbah R, Kizilel R, Selman JR, Al-Hallaj S. Active (air-cooled) vs. passive (phasechange material) thermal management of high power lithium-ion packs:Limitation of temperature rise and uniformity of temperature distribution. JPower Sources 2008;182(2):630–8.
[10] Mouritz AP, Feih S, Kandare E, Mathys Z, Gibson AG, Des Jardin PE, et al. Reviewof fire structural modelling of polymer composites. Composites Part A2009;40(12):1800–14.
[11] Chowdhury EU, Eedson R, Bisby LA, Green MF, Benichou N. Mechanicalcharacterization of fibre reinforced polymers materials at high temperature.Fire Technol 2009;47(4):1063–80.
[12] Kandare E, Kandola BK, Myler P, Edwards G. Thermo-mechanical responses offiber-reinforced epoxy composites exposed to high temperatureenvironments. Part I: experimental data acquisition. J Compos Mater2010;44(26):3093–114.
[13] Kandola BK, Horrocks AR, Myler P, Blair D. Mechanical performance of heat/firedamaged novel flame retardant glass-reinforced epoxy composites.Composites Part A 2003;34(9):863–73.
[14] Kozola BD, Shipton LA, Natrajan VK, Christensen KT, White SR.Characterization of active cooling and flow distribution in microvascularpolymers. J Intell Mater Syst Struct 2010;21(12):1147–56.
[15] Soghrati S, Thakre PR, White SR, Sottos NR, Geubelle PH. Computationalmodeling and design of actively-cooled microvascular materials. Int J HeatMass Transf 2012;55(19–20):5309–21.
[16] Soghrati S, Najafi AR, Lin JH, Hughes KM, White SR, Sottos NR, et al.Computational analysis of actively-cooled 3D woven microvascularcomposites using a stabilized interface-enriched generalized finite elementmethod. Int J Heat Mass Transf 2013;65:153–64.
[17] Norris CJ, Meadway GJ, O’Sullivan MJ, Bond IP, Trask RS. Self-healing fibrereinforced composites via a bioinspired vasculature. Adv Funct Mater2011;21(19):3624–33.
erformance of polymer matrix composites above the glass transition tem-016/j.compositesa.2015.07.012

12 A.M. Coppola et al. / Composites: Part A xxx (2015) xxx–xxx
[18] Norris CJ, Bond IP, Trask RS. The role of embedded bioinspired vasculature ondamage formation in self-healing carbon fibre reinforced composites.Composites Part A 2011;42(6):639–48.
[19] Norris CJ, Bond IP, Trask RS. Interactions between propagating cracks andbioinspired self-healing vascules embedded in glass fibre reinforcedcomposites. Compos Sci Technol 2011;71(6):847–53.
[20] Wu AS, Coppola AM, Sinnott MJ, Chou T-W, Thostenson ET, Byun J-H, et al.Sensing of damage and healing in three-dimensional braided composites withvascular channels. Compos Sci Technol 2012;72(13):1618–26.
[21] Huang C-Y, Trask RS, Bond IP. Characterization and analysis of carbon fibre-reinforced polymer composite laminates with embedded circular vasculature.J R Soc Interface 2010;7(49):1229–41.
[22] Williams G, Trask R, Bond I. A self-healing carbon fibre reinforced polymer foraerospace applications. Composites Part A 2007;38(6):1525–32.
[23] Bleay S, Loader C, Hawyes V, Humberstone L, Curtis P. A smart repair systemfor polymer matrix composites. Composites Part A 2001;32(12):1767–76.
[24] Pang JWC, Bond IP. A hollow fibre reinforced polymer compositeencompassing self-healing and enhanced damage visibility. Compos SciTechnol 2005;65(11–12):1791–9.
[25] Phillips DM, Ryan Pierce M, Baur JW. Mechanical and thermal analysis ofmicrovascular networks in structural composite panels. Composites Part A2011;42(11):1609–19.
[26] Kousourakis A, Bannister MK, Mouritz AP. Tensile and compressive propertiesof polymer laminates containing internal sensor cavities. Composites Part A2008;39(9):1394–403.
Please cite this article in press as: Coppola AM et al. Retention of mechanical pperature by vascular cooling. Composites: Part A (2015), http://dx.doi.org/10.1
[27] Kousourakis A, Mouritz AP. The effect of self-healing hollow fibres on themechanical properties of polymer composites. Smart Mater Struct2010;19(8):085021.
[28] McCombe GP, Rouse J, Trask RS, Withers PJ, Bond IP. X-ray damagecharacterization in self-healing fibre reinforced polymers. Composites Part A2012;43(4):613–20.
[29] Dong H, Esser-Kahn AP, Thakre PR, Patrick JF, Sottos NR, White SR, et al.Chemical treatment of poly(lactic acid) fibers to enhance the rate of thermaldepolymerization. ACS Appl Mater Interfaces 2012;4(2):503–9.
[30] Esser-Kahn AP, Thakre PR, Dong H, Patrick JF, Vlasko-Vlasov VK, Sottos NR,et al. Three-dimensional microvascular fiber-reinforced composites. AdvMater 2011;23(32):3654–8.
[31] Coppola AM, Thakre PR, Sottos NR, White SR. Tensile properties and damageevolution in vascular 3D woven glass/epoxy composites. Composites Part A2014;59:9–17.
[32] Phillips DM, Baur JW. A microvascular method for thermal activation anddeactivation of shape memory polymers. J Intell Mater Syst Struct2013;24(10):1233–44.
[33] Seeton CJ. Viscosity–temperature correlation for liquids. Tribol Lett2006;22(1):67–78.
[34] Ning Q-G, Chou T-W. Closed-form solutions of the in-plane effective thermalconductivities of woven-fabric composites. Compos Sci Technol 1995;55(1):41–8.
[35] Rolfes R. Transverse thermal conductivity of CFRP laminates: a numerical andexperimental validation of approximation formulae. Compos Sci Technol1995;54(1):45–54.
erformance of polymer matrix composites above the glass transition tem-016/j.compositesa.2015.07.012