
Retention: A New Focus Lee Bowron CAS Ratemaking Seminar March 7 – 8, 2002 Tampa, FL.
46
Retention: A New Focus Lee Bowron CAS Ratemaking Seminar March 7 – 8, 2002 Tampa, FL
-
Upload
julianna-bruce -
Category
Documents
-
view
214 -
download
0
Transcript of Retention: A New Focus Lee Bowron CAS Ratemaking Seminar March 7 – 8, 2002 Tampa, FL.

Retention: A New Focus
Lee Bowron
CAS Ratemaking Seminar
March 7 – 8, 2002
Tampa, FL

Retention: Defining the Problem Retention Data is Not Publicly Available Retention is Not Always a Rating Variable Several Definitions of Retention, including:
– Ratio Method (Percent of Policies-in-Force / Original Policies-in-Force)
– Expected Policy Life

Retention: A Simple Example
Acme Auto Insurance Company writes 2,000 New Business and 8,000 Renewal Polices a Year
Currently, Acme renews 80% of their policies and policies-in-force are steady
Management wants to increase PIF to 10,500 this year
This will require a 25% increase in new business (2,500) or a 6.25% increase in renewals (8,500)

Impact of Retention on Calendar Year Results
Total New Bus RenewalsPolicies 1,000 200 800
Average Premium 500 500 500
Written Premium 500,000 100,000 400,000
Loss Ratio 72.0% 80.0% 70.0%
Expense Ratio 26.0% 30.0% 25.0%
COR 98.0% 110.0% 95.0%
Underwriting Profit 10,000 (10,000) 20,000

Same Example but 50 additional Renewals
Total New Bus RenewalsPolicies 1,050 200 850
Average Premium 500 500 500
Written Premium 525,000 100,000 425,000
Loss Ratio 71.9% 80.0% 70.0%
Expense Ratio 26.0% 30.0% 25.0%
COR 97.9% 110.0% 95.0%
Underwriting Profit 11,250 (10,000) 21,250

Same Example but 50 additional New Business
Total New Bus RenewalsPolicies 1,050 250 800
Average Premium 500 500 500
Written Premium 525,000 125,000 400,000
Loss Ratio 72.4% 80.0% 70.0%
Expense Ratio 26.2% 30.0% 25.0%
COR 98.6% 110.0% 95.0%
Underwriting Profit 7,500 (12,500) 20,000

Factors Impacting Retention
Retention can differ based on many factors, including:– Product Type– Rating Variable– Customer Demographics– Competitive Considerations– Softness of Market

The Real World: Policyholder Personalities Auto Insurance is sold to a wide demographic
market Short-term defectors
– Buy to renew a tag– Low priority of continuous insurance– High propensity to price insurance– Have more violations or accidents, which causes
large price swings– They are transient

The Real World: Policyholder Personalities Loyal Policyholders:
– Personal relationship with agent– Not likely to shop due to price increase– Low cost of auto insurance in relation to budget– Multiple products with the same company or
agency– Long-term residents of community

The Real World: Policyholder Personalities In-Betweeners:
– In the middle ground between the categories above
Each category requires it’s own retention strategy, both operational and pricing.

Operational Strategies to Improve Retention Retention issues may be better addressed
through operational changes than pricing strategies. Such strategies include:– Improved Service– Clearer Correspondence– Payment Options

Pricing Strategies - Renewal Discounts Most companies do not give the full
“indicated” discount– If companies gave the indicated discount, there
would be no difference in loss ratios between new and renewal business
In order to maximize profitability, any discount should “pay for itself” to be justified.

Renewal Discount Strategies
Strategy 1 Strategy 2 Strategy 3Renewal Discount 0% 3% 6%
Policies 800 1000 1150
Average Premium 500 485 470
Written Premium 400,000 485,000 540,500
Loss Ratio 70.0% 72.2% 74.5%
Expense Ratio 25.0% 23.0% 22.0%
COR 95.0% 95.2% 96.4%
Underwriting Profit 20,000 23,450 19,325

A New Product
It is very important that you know the retention characteristics of a new product that you introduce.
Retention characteristics will impact calendar year results until the product “matures.”

Preferred Auto Product – Loss Ratios by Number of Renewals
Percent LossYear of Business Ratio0 20.0% 85.0%1 14.0% 80.0%2 10.0% 75.0%3 7.5% 70.0%4 or more 48.5% 65.0%
72.5%

Accident Year Results for New Preferred Auto Product
LossYear Ratio1 85.0%2 82.9%3 81.1%4 79.5%

Retention is Important!
Retention issues are important in operational and pricing decisions.
Successful firms make retention considerations a part of both existing and new market strategies.

Modeling Retention & Effective Rate Impact
Rob Walling
CAS Ratemaking Seminar
March 8 –9, 2002
Tampa, FL

Objectives
Characteristics of Retention Approach to Modeling Retention Effective Rate Impact (ERI) A Stochastic Approach to ERI Extensions and Considerations

What Characteristics Should a Retention Model Have? Has Flexible Shape Simplified Parameterization Creates Actuarially Intuitive Scenarios
– Decreasing Incremental Changes for larger rate actions
– Asymptotic Behaviors at Extremes Allows Different Retention Behavior for
Different Rating Characteristics

Renewal Rate (R)
Price (P)
100%
0%
Demand Curve
1P
1RR = f(P)
The Flexible Shape of the Retention Demand Curve

Retention Behavior Depends on Characteristics Like … Change in Pricing on Renewal Competitive Positioning Market Conditions (Inflation, U/W Cycle, etc.) Customer Rating Characteristics
– Age– Territory– Policy Size– Years on Risk

Premium Retention can be modeled as:
where: P1 = Proposed Rate Level P0 = Current Rate Level PM = Market Level
ii
m1
01
i
i
PP
PP1
1r
Modeling Retention

Premium Retention using:
where: P1 = 110 = .3 P0 = 100 = 2 r = 69.5% PM = 100 = 2
Modeling Retention - Example
ii
m1
01
i
i
PP
PP1
1r
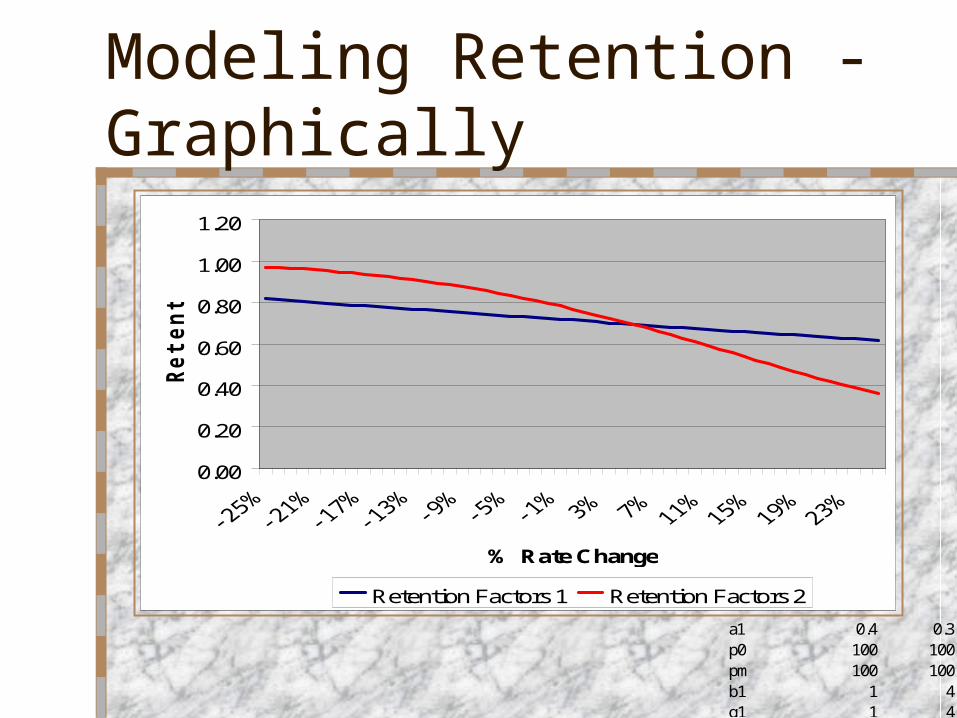
Modeling Retention - Graphically
0.00
0.20
0.40
0.60
0.80
1.00
1.20
% Rate Change
Rete
nti
on
Retention Factors 1 Retention Factors 2
a1 0.4 0.3p0 100 100pm 100 100b1 1 4g1 1 4

Retention Analysis Goal
Based on the characteristics of a particular current policyholder, how likely is it that the policyholder will renew with me?

Factors to Consider in a Retention Analysis
Change Over Last Year’s Premium Market Competitiveness Traditional Rating Factors Age of Youngest Additional Driver Satisfaction with Agent/Service Number of Years Insured Etc.
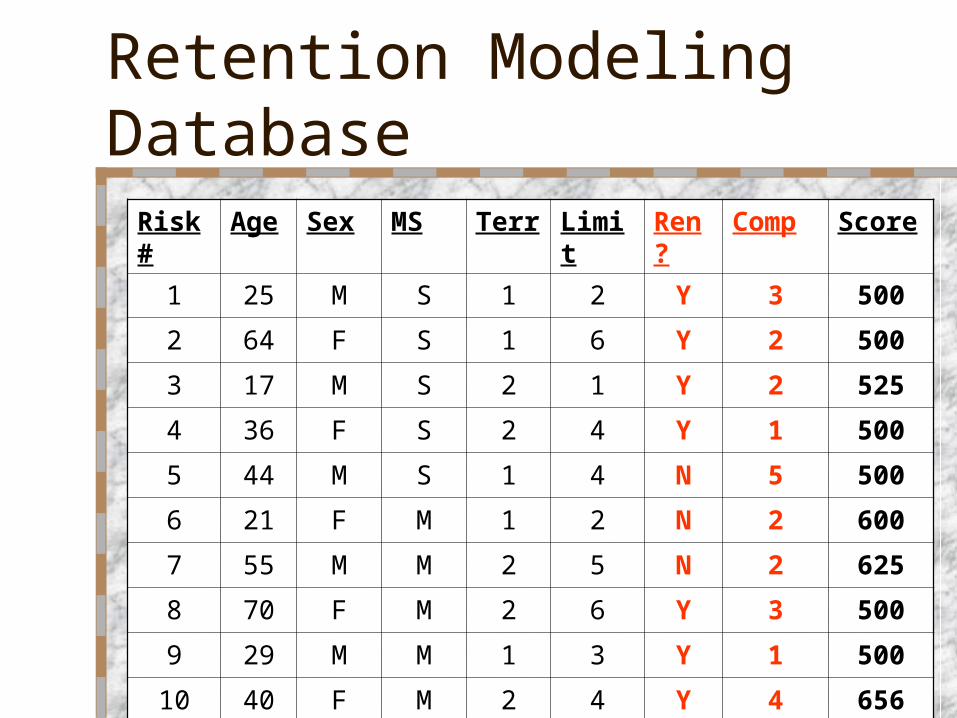
Retention Modeling Database
Risk# Age Sex MS Terr Limit Ren? Comp Score
1 25 M S 1 2 Y 3 500
2 64 F S 1 6 Y 2 500
3 17 M S 2 1 Y 2 525
4 36 F S 2 4 Y 1 500
5 44 M S 1 4 N 5 500
6 21 F M 1 2 N 2 600
7 55 M M 2 5 N 2 625
8 70 F M 2 6 Y 3 500
9 29 M M 1 3 Y 1 500
10 40 F M 2 4 Y 4 656
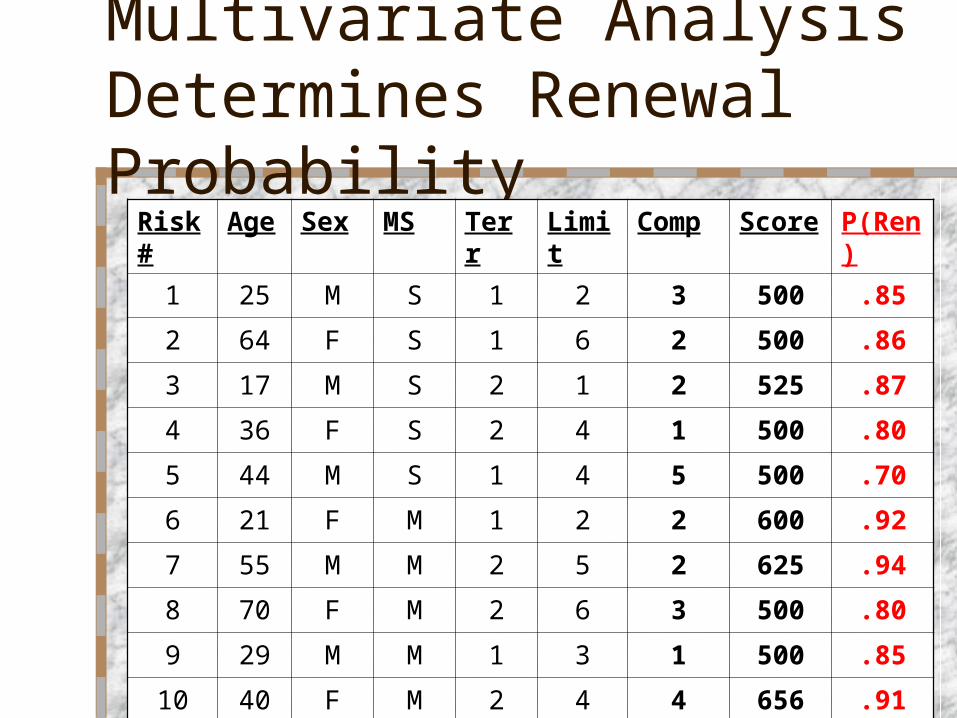
Multivariate Analysis Determines Renewal Probability
Risk# Age Sex MS Terr Limit Comp Score P(Ren)
1 25 M S 1 2 3 500 .85
2 64 F S 1 6 2 500 .86
3 17 M S 2 1 2 525 .87
4 36 F S 2 4 1 500 .80
5 44 M S 1 4 5 500 .70
6 21 F M 1 2 2 600 .92
7 55 M M 2 5 2 625 .94
8 70 F M 2 6 3 500 .80
9 29 M M 1 3 1 500 .85
10 40 F M 2 4 4 656 .91
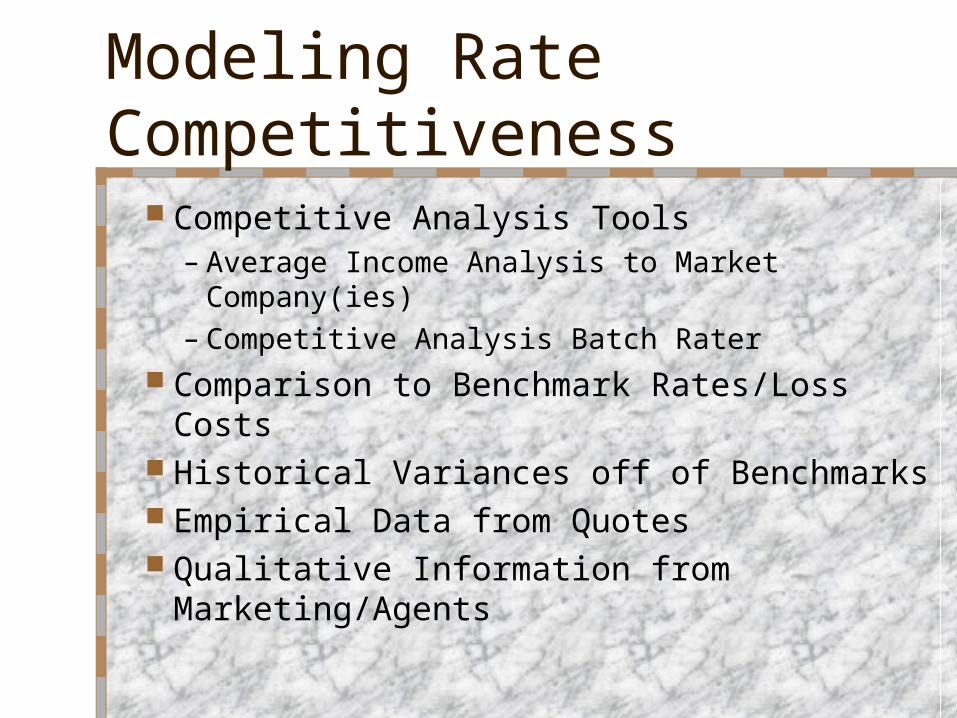
Modeling Rate Competitiveness
Competitive Analysis Tools– Average Income Analysis to Market Company(ies)– Competitive Analysis Batch Rater
Comparison to Benchmark Rates/Loss Costs Historical Variances off of Benchmarks Empirical Data from Quotes Qualitative Information from Marketing/Agents

Rate Impacts: The Current Problem
What’s the impact on loss ratio of a 25% rate increase?
Ignoring inflation momentarily.If Current Loss Ratio = Loss/PremiumProposed Loss Ratio = Loss/(Premium*1.25) = Loss/Premium*(1/1.25) = Loss/Premium*80% = 80% of Current Loss Ratio
The only answer is a 20% reduction in the Loss Ratio!

Editorial Comment

The Absurdity (If a little is good…)
What’s the impact on loss ratio of a 200% rate increase?
Ignoring inflation momentarily.If Current Loss Ratio = Loss/PremiumProposed Loss Ratio = Loss/(Premium*3) = Loss/Premium*(1/3) = Loss/Premium*33.3% = 33% of Current Loss Ratio
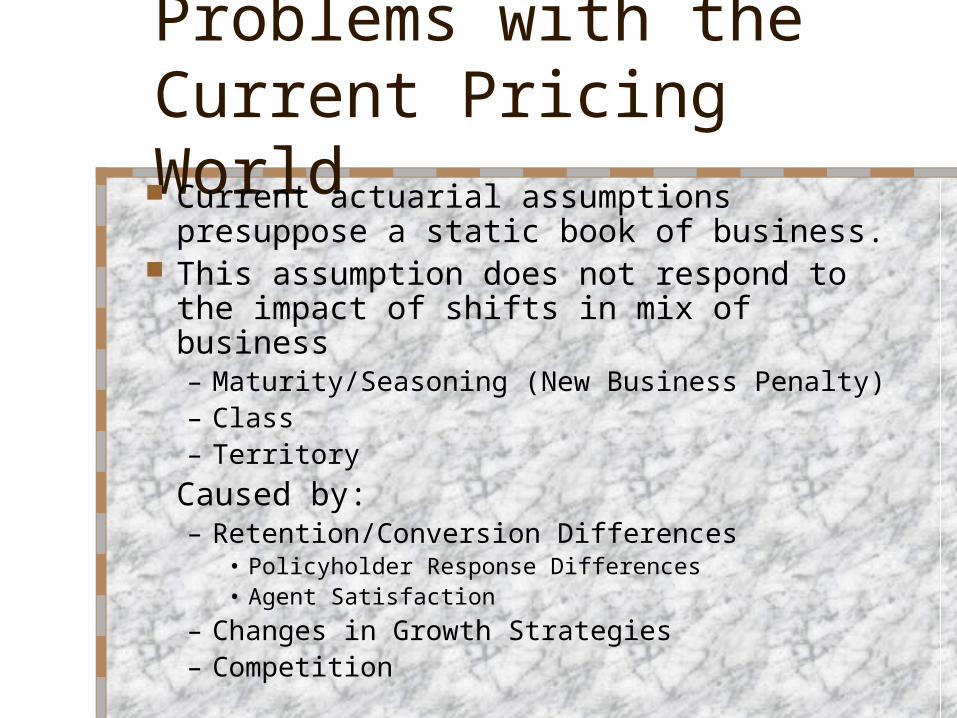
Problems with the Current Pricing World Current actuarial assumptions presuppose a static
book of business. This assumption does not respond to the impact of
shifts in mix of business – Maturity/Seasoning (New Business Penalty)– Class– Territory
Caused by:– Retention/Conversion Differences
• Policyholder Response Differences• Agent Satisfaction
– Changes in Growth Strategies – Competition
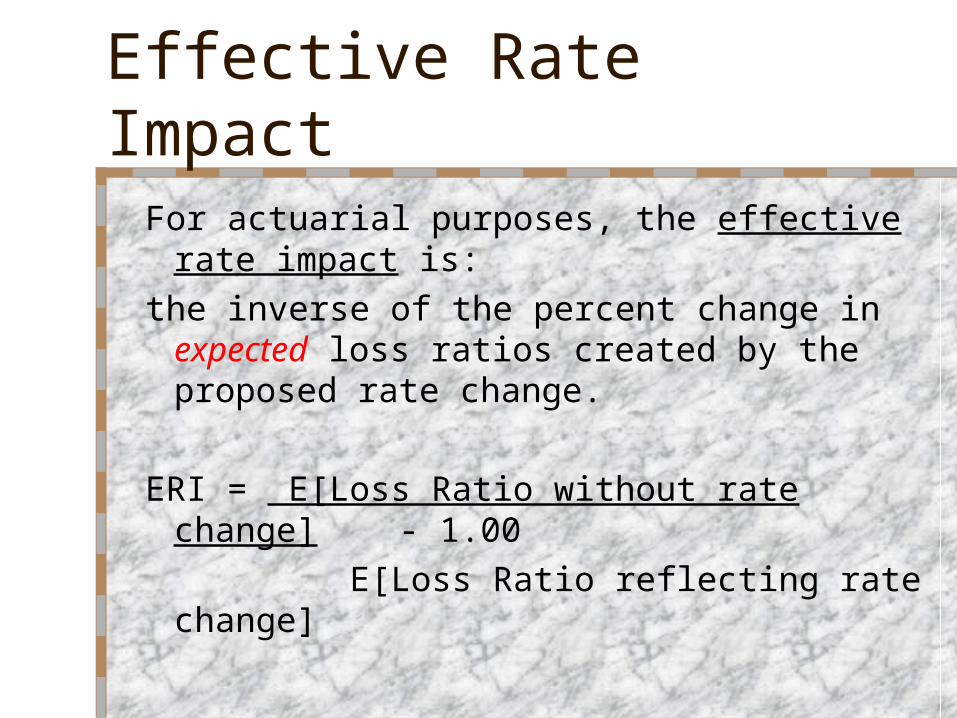
Effective Rate Impact
For actuarial purposes, the effective rate impact is:the inverse of the percent change in expected loss
ratios created by the proposed rate change.
ERI = E[Loss Ratio without rate change] - 1.00 E[Loss Ratio reflecting rate change]

Effective Rate Impact - Example
Suppose current trended expected loss ratio is 60% and a proposed class plan is expected to result in a loss ratio of 54%
ERI = 0.60 - 1.00 = +10% 0.54

Effective Rate Impact
1) Assume:a. Expected Number of Quotesb. Expected Loss Ratio prior to change
- Use rate level indications- Use assumptions underlying loss model- Simulate using same assumptions
2) Model Current Conversion/Retention Parameters3) Model Current Loss Parameters
a. Frequency & Severity or Loss Ratiob. New vs. Renewalc. Some Class Plan Detail is Preferable
Effective Rate Impact
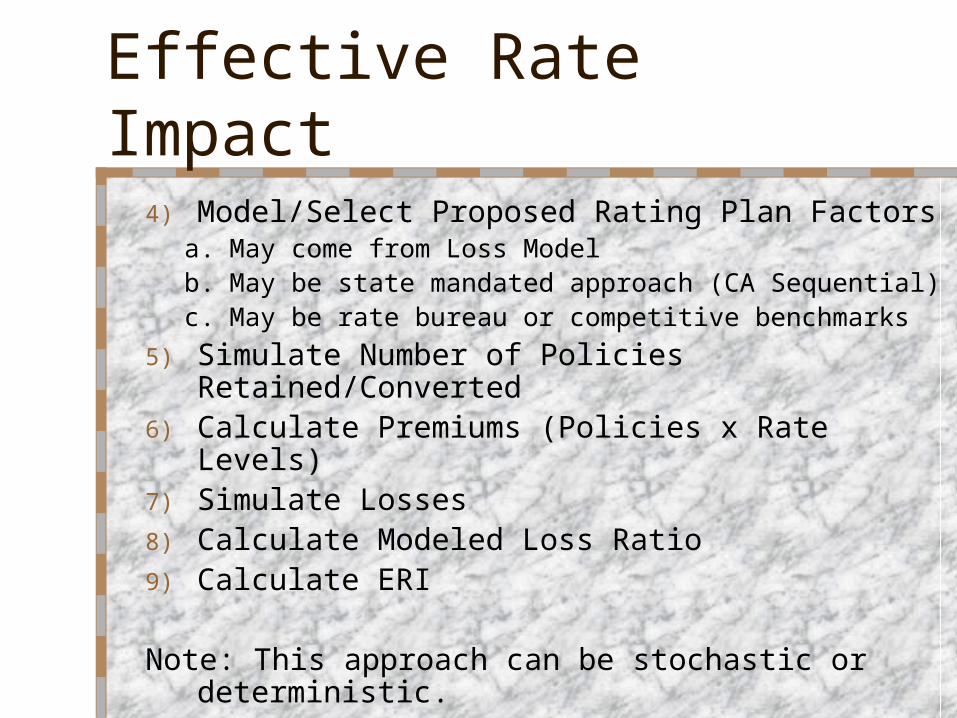
4) Model/Select Proposed Rating Plan Factors a. May come from Loss Modelb. May be state mandated approach (CA Sequential)c. May be rate bureau or competitive benchmarks
5) Simulate Number of Policies Retained/Converted6) Calculate Premiums (Policies x Rate Levels)7) Simulate Losses8) Calculate Modeled Loss Ratio9) Calculate ERI
Note: This approach can be stochastic or deterministic.

Effective Rate Impact - Example
Current Expected Loss Ratio 75.0%Current Average Rate 635
New/ Quotes/ Average Conversion/ Policies Expected LossSegment Renewal Curr. PIF Rate Retention Written Premium Losses Ratio ERIClass 1 New 400 495 20% 80 39,600 31,680 80.0%
Renewal 1000 550 80% 800 440,000 286,000 65.0%Class 2 New 250 900 23% 58 51,750 38,813 75.0%
Renewal 500 1050 70% 350 367,500 257,250 70.0%
Total 698 1,288 898,850 613,743 68.3% 10%10%
New/ Quotes/ Average Conversion/ Policies Expected LossSegment Renewal Curr. PIF Rate Retention Written Premium Losses Ratio ERIClass 1 New 400 405 26% 104 42,120 41,184 97.8%
Renewal 1000 450 88% 880 396,000 314,600 79.4%Class 2 New 250 1065 18% 45 47,925 30,375 63.4%
Renewal 500 1250 64% 320 400,000 235,200 58.8%
Total 705 1,349 886,045 621,359 70.1% 7%11%
Strategy 1
Strategy 2
Why Hasn’t Retention Modeling Been Used for Ratemaking?
Established ratemaking techniques are path of least resistance
Parameterization issues Macro view of pricing
– Micro considerations (class plan, territory, etc.) are typically very simplified
Sensitive to many factors “Black Box” mentality

Why Hasn’t Retention Modeling Been Used for Ratemaking?
New business penalty impact poorly understood
Different Growth Strategies indicate different “indicated” rate changes to achieve the same efffective rate change
“Point Estimate” mentality Have you ever tried convincing 50+ different
regulators about a selection within a range of reasonable estimates?!

Another Way of Looking at Things
Have you ever tried to sell your underwriters, marketing reps and agents on a huge increase that makes no competitive sense?
or dreaded a big decrease presented as capable of doubling retention or hit ratios?
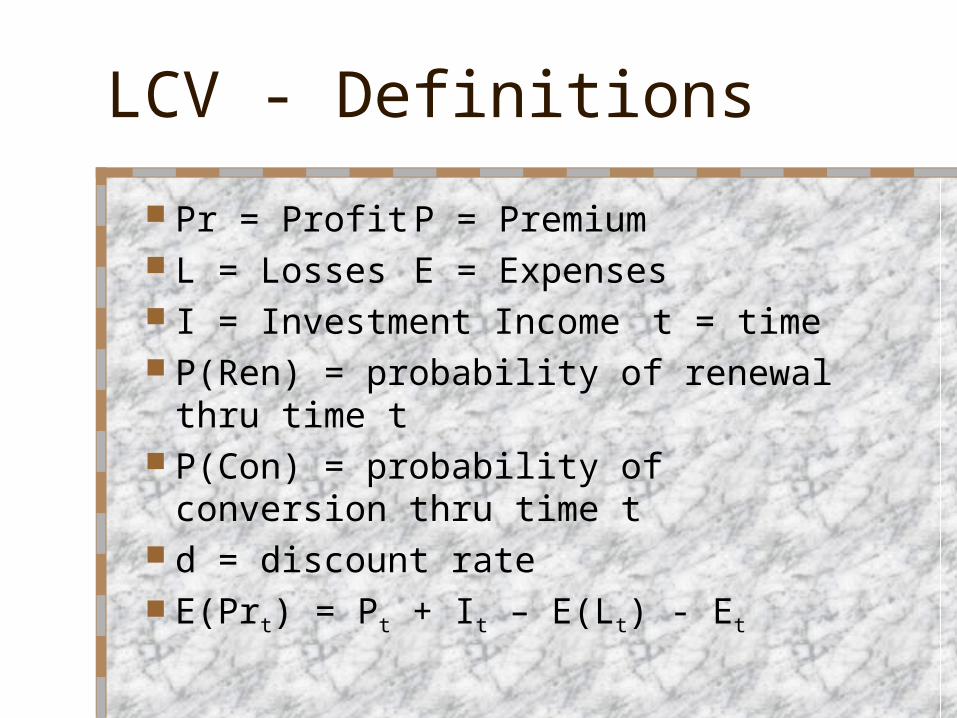
LCV - Definitions
Pr = Profit P = Premium L = Losses E = Expenses I = Investment Income t = time P(Ren) = probability of renewal thru time t P(Con) = probability of conversion thru time t d = discount rate E(Prt) = Pt + It – E(Lt) - Et
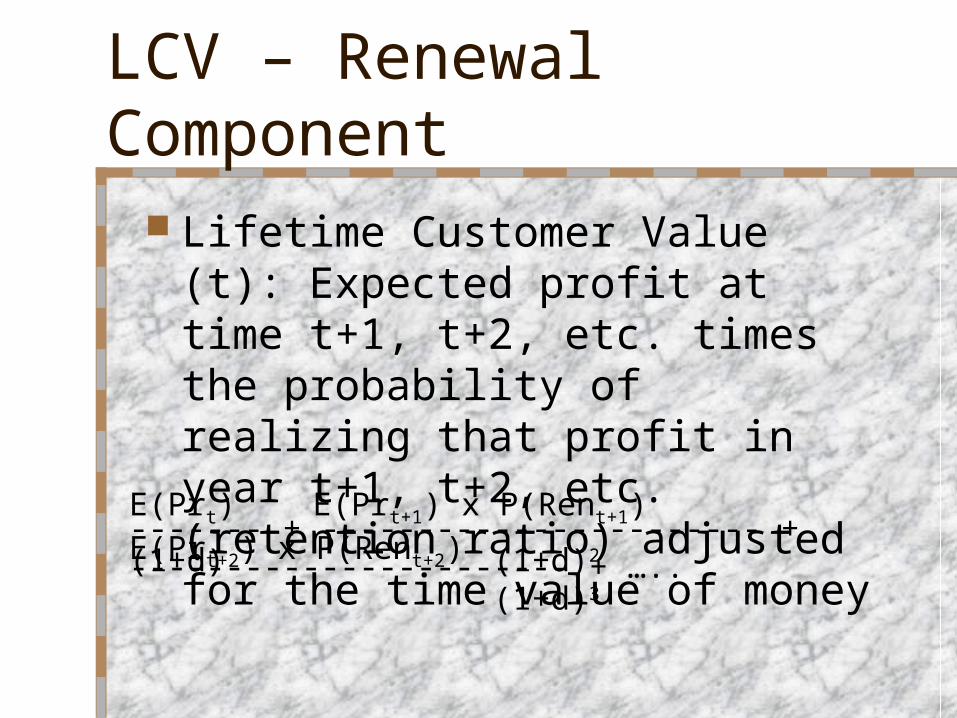
LCV – Renewal Component
Lifetime Customer Value (t): Expected profit at time t+1, t+2, etc. times the probability of realizing that profit in year t+1, t+2, etc. (retention ratio) adjusted for the time value of money
E(Prt) E(Prt+1) x P(Rent+1) E(Prt+2) x P(Rent+2) ------- + ----------------------- + ----------------------- + …..(1+d) (1+d)2 (1+d)3

LCV – New Business Component
Lifetime Customer Value (t): Expected profit at time t+1, t+2, etc. times the probability of realizing that profit in year t+1, t+2, etc. (renewal ratio) adjusted for the time value of money adjusted for the probability of writing the risk (conversion ratio)
)( x P(Cont)E(Prt) E(Prt+1) x P(Rent+1) E(Prt+2) x P(Rent+2) ------- + ----------------------- + ---------------------- +…(1+d) (1+d)2 (1+d)3


![Parker v. Bowron [DISSENT]](https://static.fdocuments.net/doc/165x107/625731521f7c275037465ea9/parker-v-bowron-dissent.jpg)