Retail, Redefined
30
RETAIL, REDEFINED NOVEMBER 2013
description
Retail, Redefined. November 2013. The recession was a wake-up call. 2010-2013. 2009. Zzzz. The Challenge for growth. Cpg STILL SPUTTERING FOR growth IN north America. Canada. United States. + 1.5. +1.6. + 0.2. +0.1. Dollars. Units. Dollars. Units. - PowerPoint PPT Presentation
Transcript of Retail, Redefined
RETAIL,REDEFINED
NOVEMBER 2013
Copy
right
©20
13 T
he N
ielse
n Co
mpa
ny. C
onfid
entia
l and
pro
prie
tary
.
2
THE RECESSION WAS A WAKE-UP CALL
2009
Zzzz
2010-2013
Copy
right
©20
13 T
he N
ielse
n Co
mpa
ny. C
onfid
entia
l and
pro
prie
tary
.
3
THE CHALLENGE FOR GROWTH
Copy
right
©20
12 T
he N
ielse
n Co
mpa
ny. C
onfid
entia
l and
pro
prie
tary
.
4
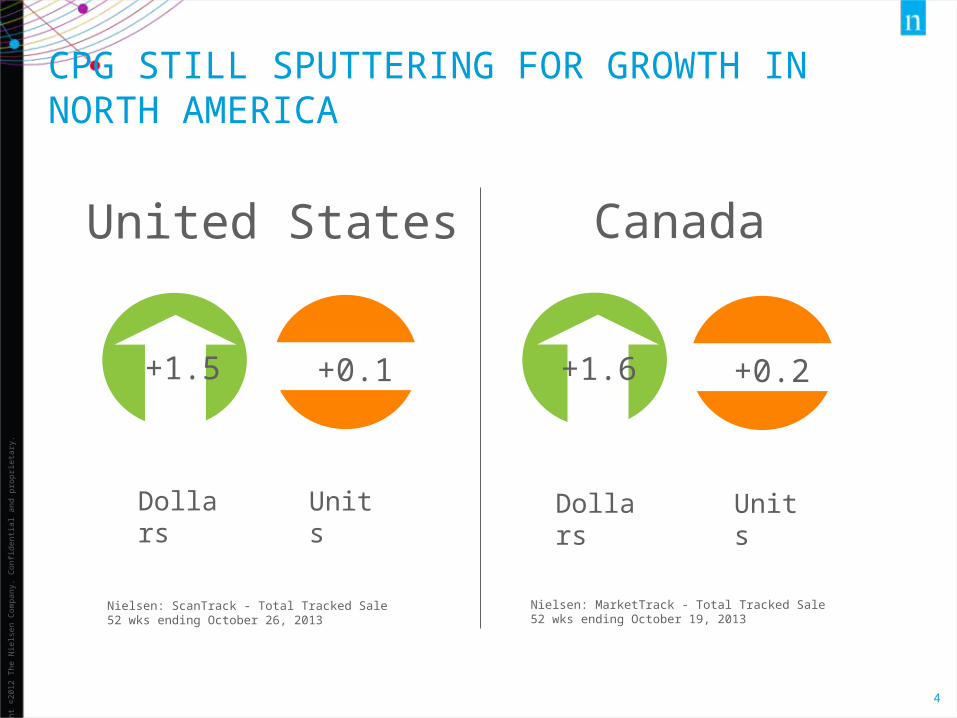
CPG STILL SPUTTERING FOR GROWTH IN NORTH AMERICA
United States
Nielsen: MarketTrack - Total Tracked Sale52 wks ending October 19, 2013
Canada
+1.6 +0.2
Dollars
Nielsen: ScanTrack - Total Tracked Sale52 wks ending October 26, 2013
UnitsDollars Units
+1.5 +0.1
Copy
right
©20
12 T
he N
ielse
n Co
mpa
ny. C
onfid
entia
l and
pro
prie
tary
.
5
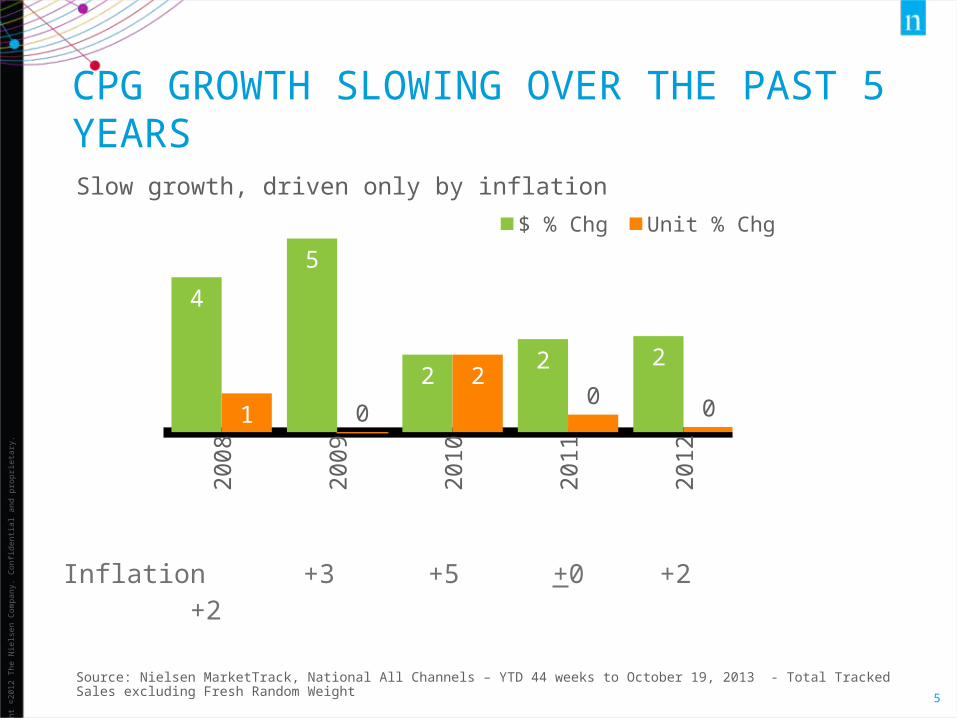
2008
2009
2010
2011
2012
YTD
2013
4
5
22 2
21 0
20 0 0
$ % Chg Unit % Chg
Inflation +3 +5 +0 +2 +2 +2
Source: Nielsen MarketTrack, National All Channels – YTD 44 weeks to October 19, 2013 - Total Tracked Sales excluding Fresh Random Weight
Slow growth, driven only by inflation
CPG GROWTH SLOWING OVER THE PAST 5 YEARS
Copy
right
©20
12 T
he N
ielse
n Co
mpa
ny. C
onfid
entia
l and
pro
prie
tary
.
6
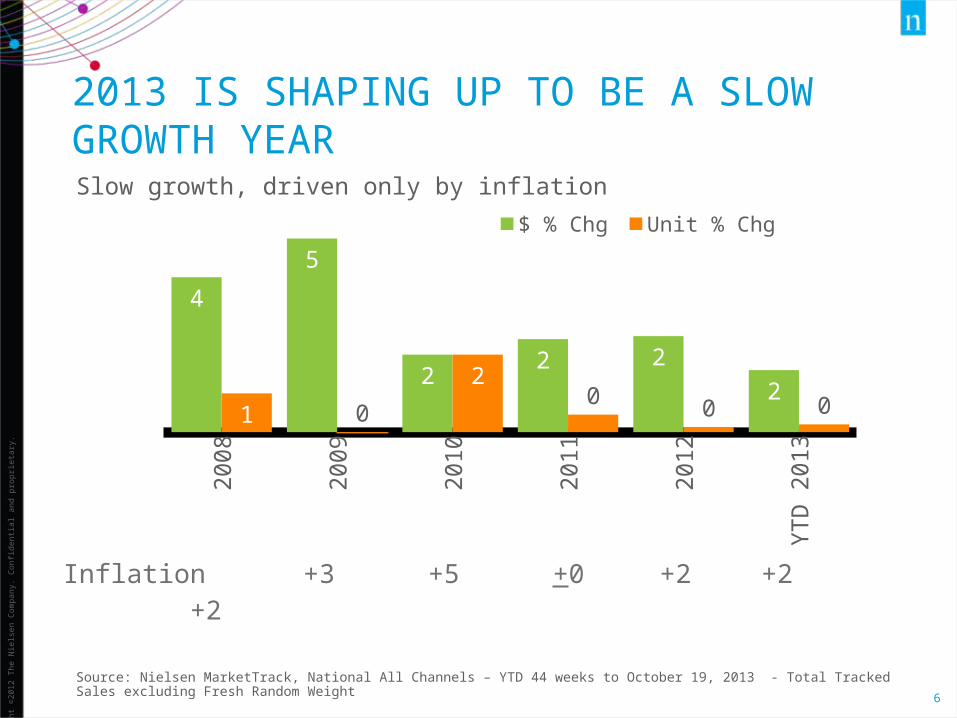
2008
2009
2010
2011
2012
YTD
2013
4
5
22 2
21 0
20 0 0
$ % Chg Unit % Chg
Inflation +3 +5 +0 +2 +2 +2
2013 IS SHAPING UP TO BE A SLOW GROWTH YEAR
Source: Nielsen MarketTrack, National All Channels – YTD 44 weeks to October 19, 2013 - Total Tracked Sales excluding Fresh Random Weight
Slow growth, driven only by inflation
Copy
right
©20
12 T
he N
ielse
n Co
mpa
ny. C
onfid
entia
l and
pro
prie
tary
.
7
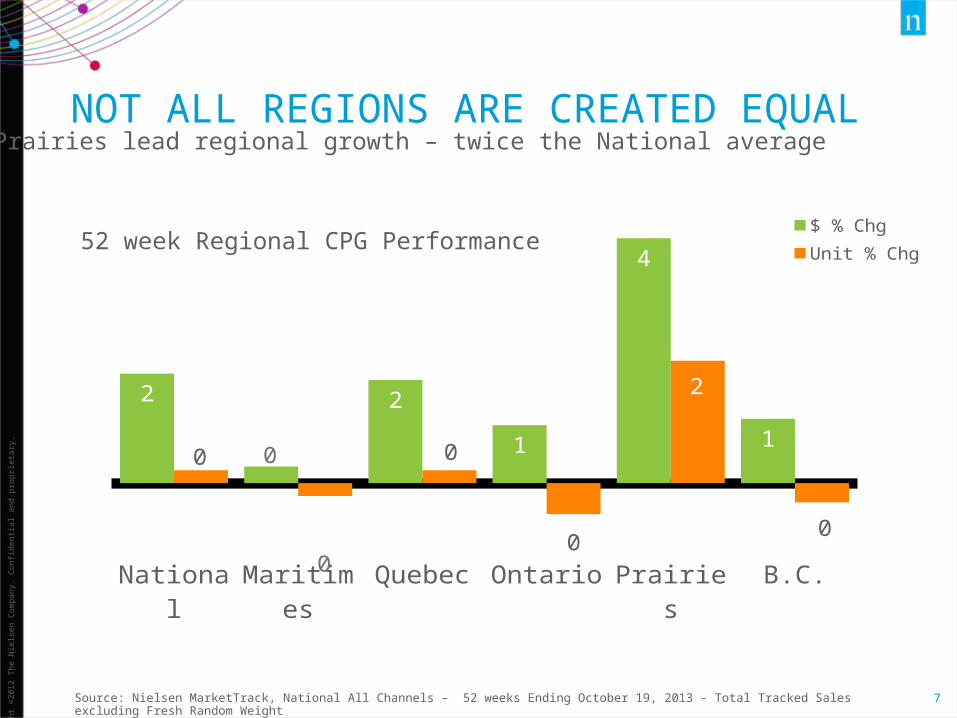
National Maritimes Quebec Ontario Prairies B.C.
2
0
2
1
4
10
0
0
0
2
0
$ % ChgUnit % Chg
NOT ALL REGIONS ARE CREATED EQUAL
52 week Regional CPG Performance
Source: Nielsen MarketTrack, National All Channels – 52 weeks Ending October 19, 2013 - Total Tracked Sales excluding Fresh Random Weight
The Prairies lead regional growth – twice the National average
Copy
right
©20
12 T
he N
ielse
n Co
mpa
ny. C
onfid
entia
l and
pro
prie
tary
.
8
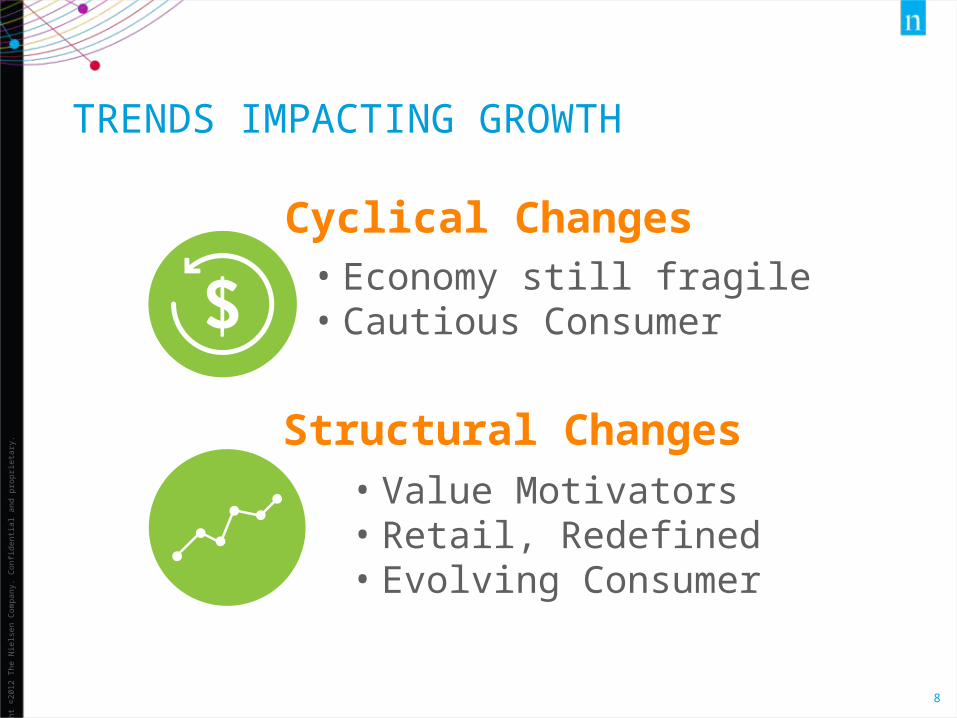
TRENDS IMPACTING GROWTH
• Economy still fragile• Cautious Consumer
Cyclical Changes
• Value Motivators• Retail, Redefined• Evolving Consumer
Structural Changes
Copy
right
©20
12 T
he N
ielse
n Co
mpa
ny. C
onfid
entia
l and
pro
prie
tary
.
9
VALUE REMAINS A KEY DRIVER OF SALES
$$$
Copy
right
©20
12 T
he N
ielse
n Co
mpa
ny. C
onfid
entia
l and
pro
prie
tary
.
10
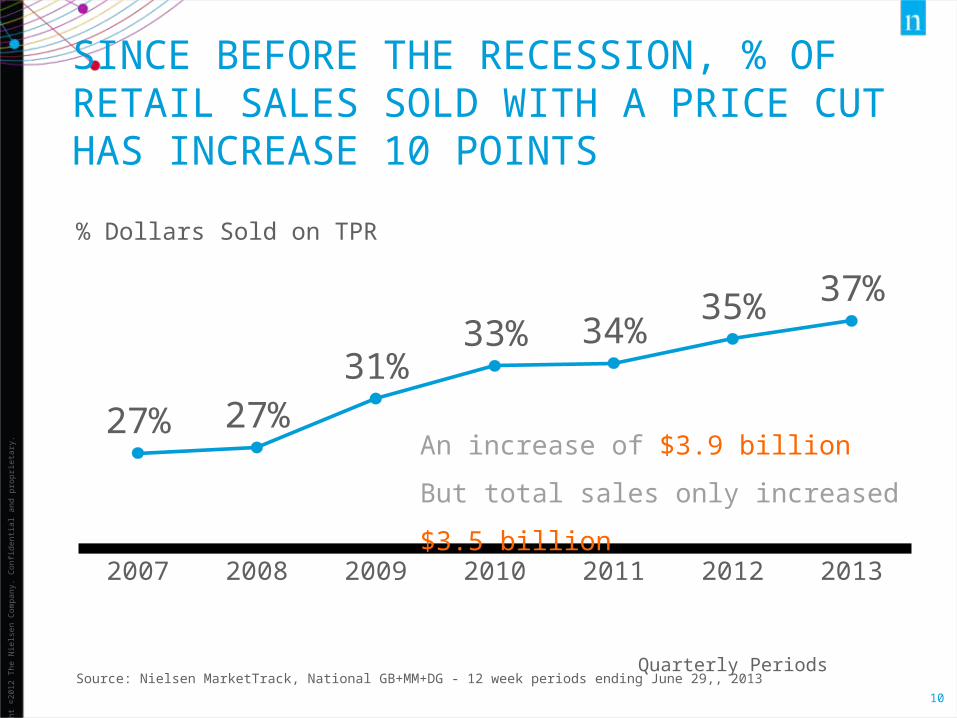
SINCE BEFORE THE RECESSION, % OF RETAIL SALES SOLD WITH A PRICE CUT HAS INCREASE 10 POINTS
% Dollars Sold on TPR
2007 2008 2009 2010 2011 2012 2013
27% 27%31%
33% 34%35% 37%
Quarterly PeriodsSource: Nielsen MarketTrack, National GB+MM+DG - 12 week periods ending June 29,, 2013
An increase of $3.9 billion
But total sales only increased $3.5 billion
Copy
right
©20
12 T
he N
ielse
n Co
mpa
ny. C
onfid
entia
l and
pro
prie
tary
.
11
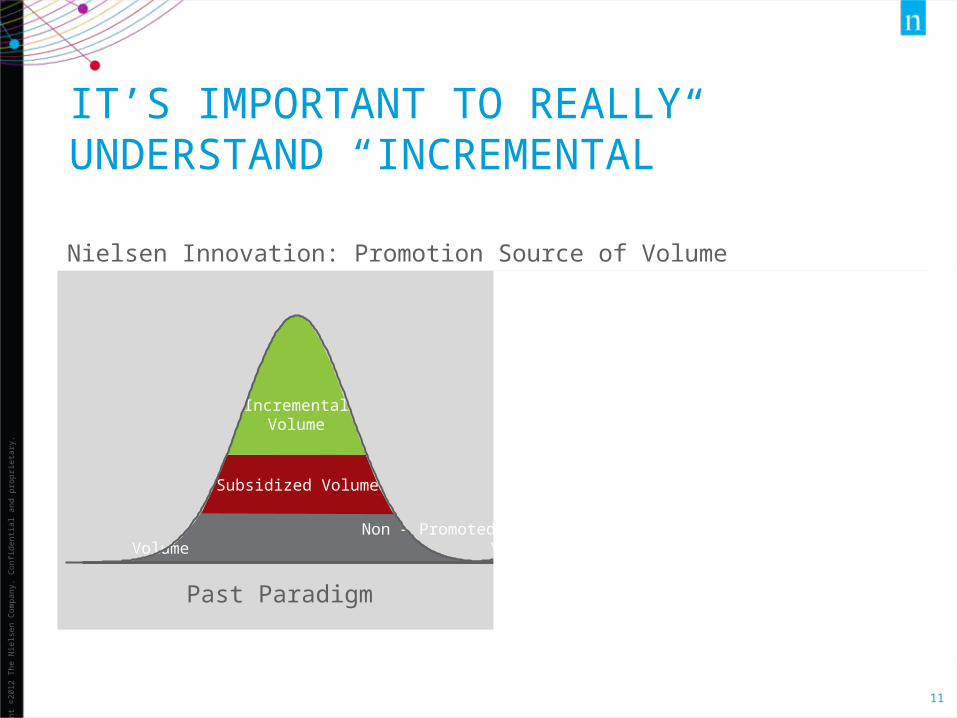
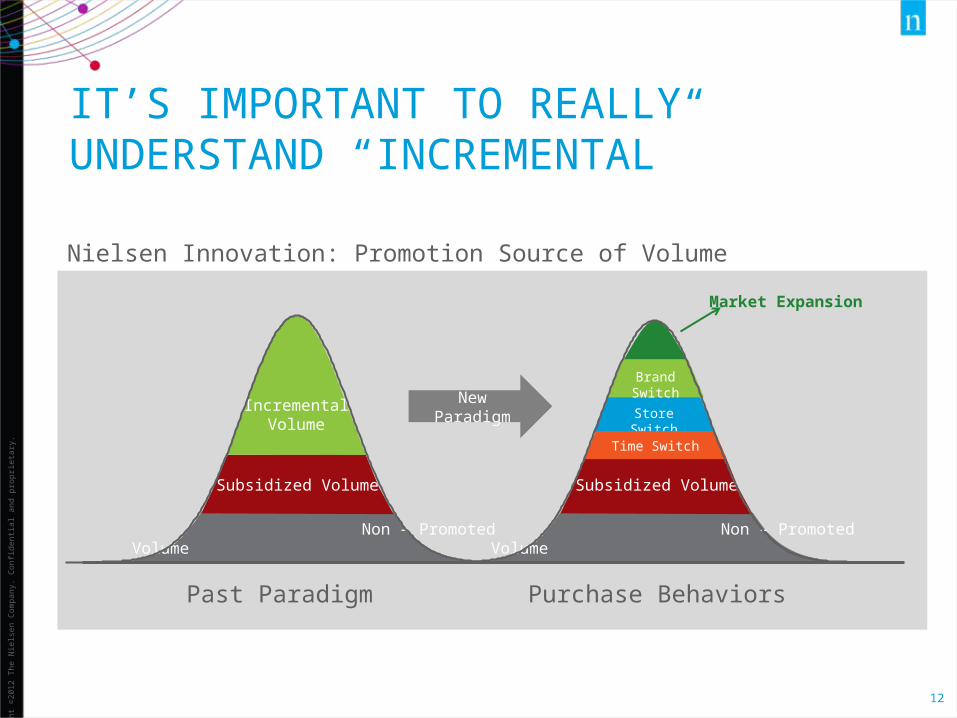
IT’S IMPORTANT TO REALLY UNDERSTAND “INCREMENTAL”
Past Paradigm Purchase Behaviors
Store Switch
Brand Switch
Non – Promoted Volume
Subsidized Volume
IncrementalVolume
Non – Promoted Volume
Subsidized Volume
Time Switch
Market Expansion
Nielsen Innovation: Promotion Source of Volume
Copy
right
©20
12 T
he N
ielse
n Co
mpa
ny. C
onfid
entia
l and
pro
prie
tary
.
12
IT’S IMPORTANT TO REALLY UNDERSTAND “INCREMENTAL”
Past Paradigm Purchase Behaviors
Store Switch
Brand Switch
Non – Promoted Volume
Subsidized Volume
IncrementalVolume
Non – Promoted Volume
Subsidized Volume
Time Switch
Market Expansion
New Paradigm
Nielsen Innovation: Promotion Source of Volume
Copy
right
©20
12 T
he N
ielse
n Co
mpa
ny. C
onfid
entia
l and
pro
prie
tary
.
13
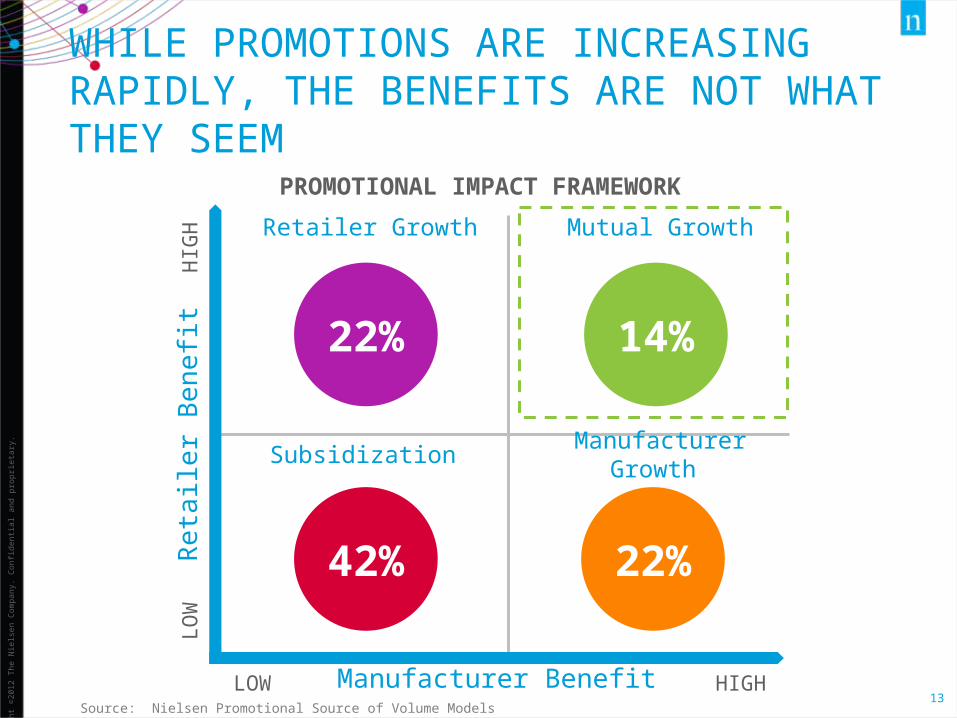
WHILE PROMOTIONS ARE INCREASING RAPIDLY, THE BENEFITS ARE NOT WHAT THEY SEEM
Manufacturer Benefit
Reta
iler B
enefi
t
HIGHLOW
LOW
HIGH
PROMOTIONAL IMPACT FRAMEWORK
Retailer Growth
Subsidization Manufacturer Growth
Mutual Growth
22%
42% 22%
14%
Source: Nielsen Promotional Source of Volume Models
Copy
right
©20
12 T
he N
ielse
n Co
mpa
ny. C
onfid
entia
l and
pro
prie
tary
.
14”
“OUR STRATEGY NEEDS TO CHANGE
It’s not about how low can I go, but how low do I need to go in order to stay profitable and create
win-win scenarios
Copy
right
©20
13 T
he N
ielse
n Co
mpa
ny. C
onfid
entia
l and
pro
prie
tary
.
15
TRADITIONAL RETAIL UNDER ATTACK
Copy
right
©20
12 T
he N
ielse
n Co
mpa
ny. C
onfid
entia
l and
pro
prie
tary
.
16
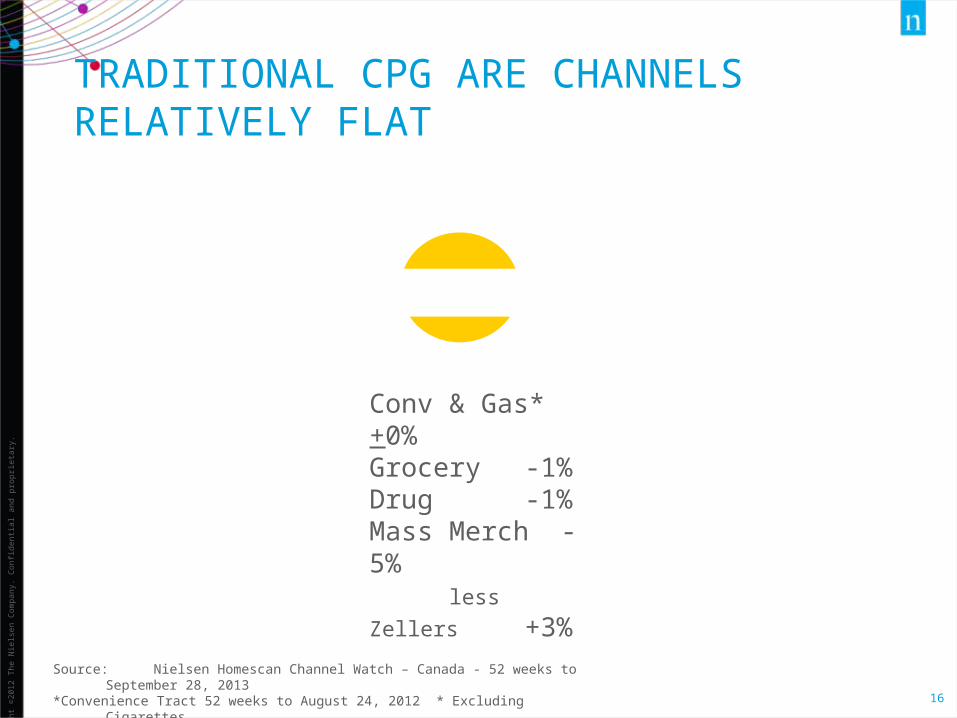
TRADITIONAL CPG ARE CHANNELS RELATIVELY FLAT
Conv & Gas* +0%Grocery -1%Drug -1%Mass Merch -5% less Zellers +3%
Source: Nielsen Homescan Channel Watch – Canada - 52 weeks to September 28, 2013*Convenience Tract 52 weeks to August 24, 2012 * Excluding Cigarettes
Copy
right
©20
12 T
he N
ielse
n Co
mpa
ny. C
onfid
entia
l and
pro
prie
tary
.
17
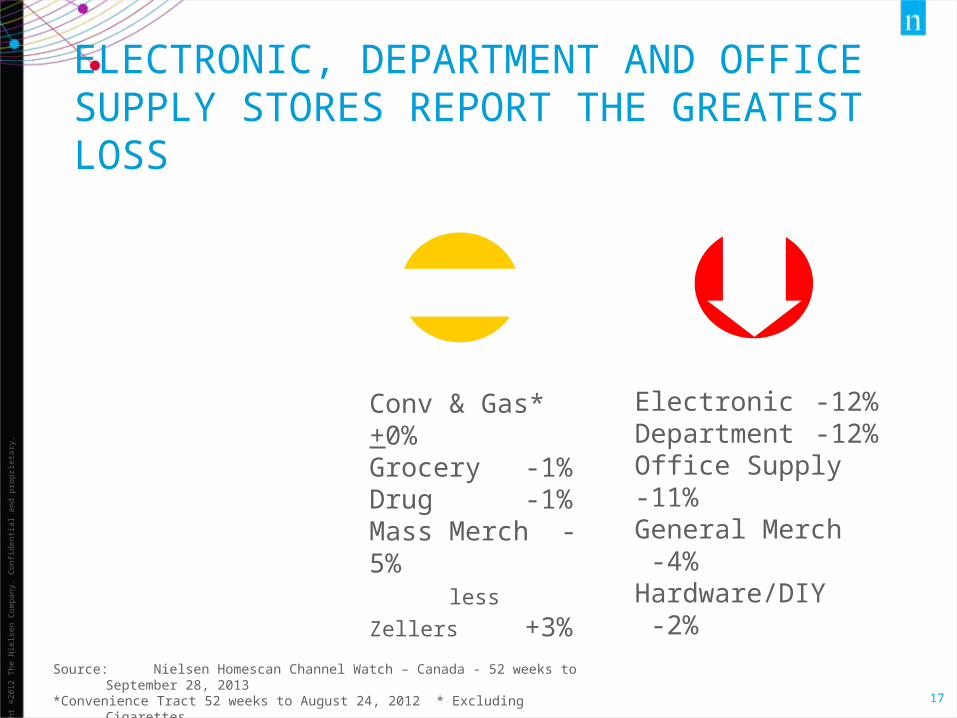
ELECTRONIC, DEPARTMENT AND OFFICE SUPPLY STORES REPORT THE GREATEST LOSS
Conv & Gas* +0%Grocery -1%Drug -1%Mass Merch -5% less Zellers +3%
Electronic -12%Department -12%Office Supply -11%General Merch -4%Hardware/DIY -2%
Source: Nielsen Homescan Channel Watch – Canada - 52 weeks to September 28, 2013*Convenience Tract 52 weeks to August 24, 2012 * Excluding Cigarettes
Copy
right
©20
12 T
he N
ielse
n Co
mpa
ny. C
onfid
entia
l and
pro
prie
tary
.
18
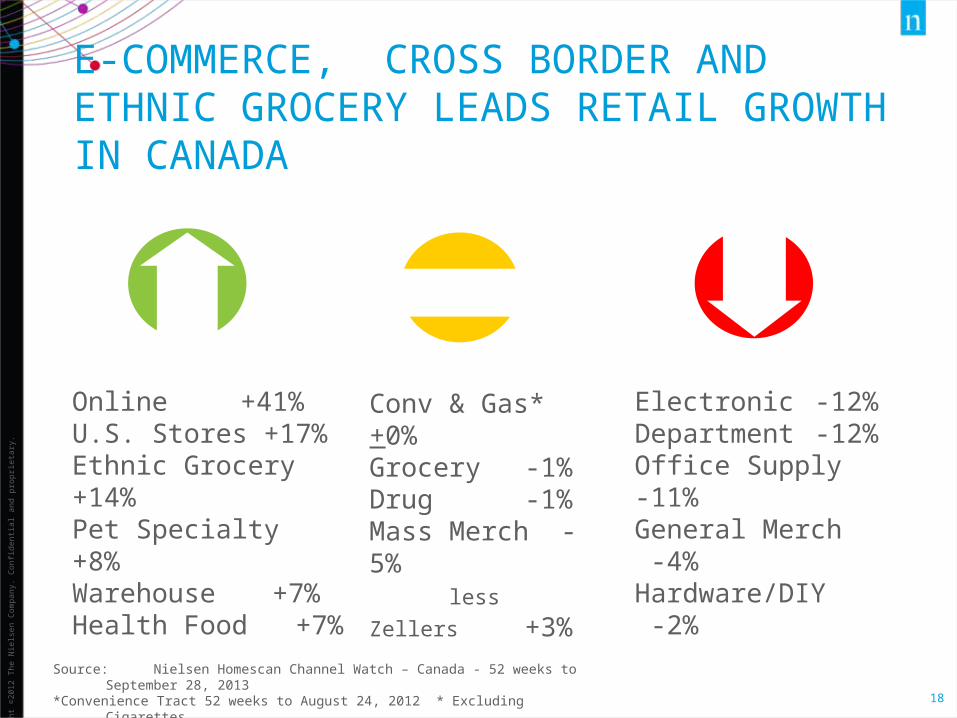
E-COMMERCE, CROSS BORDER AND ETHNIC GROCERY LEADS RETAIL GROWTH IN CANADA
Online +41% U.S. Stores +17%Ethnic Grocery +14%Pet Specialty +8%Warehouse +7%Health Food +7%
Conv & Gas* +0%Grocery -1%Drug -1%Mass Merch -5% less Zellers +3%
Electronic -12%Department -12%Office Supply -11%General Merch -4%Hardware/DIY -2%
Source: Nielsen Homescan Channel Watch – Canada - 52 weeks to September 28, 2013*Convenience Tract 52 weeks to August 24, 2012 * Excluding Cigarettes
Copy
right
©20
13 T
he N
ielse
n Co
mpa
ny. C
onfid
entia
l and
pro
prie
tary
.
19
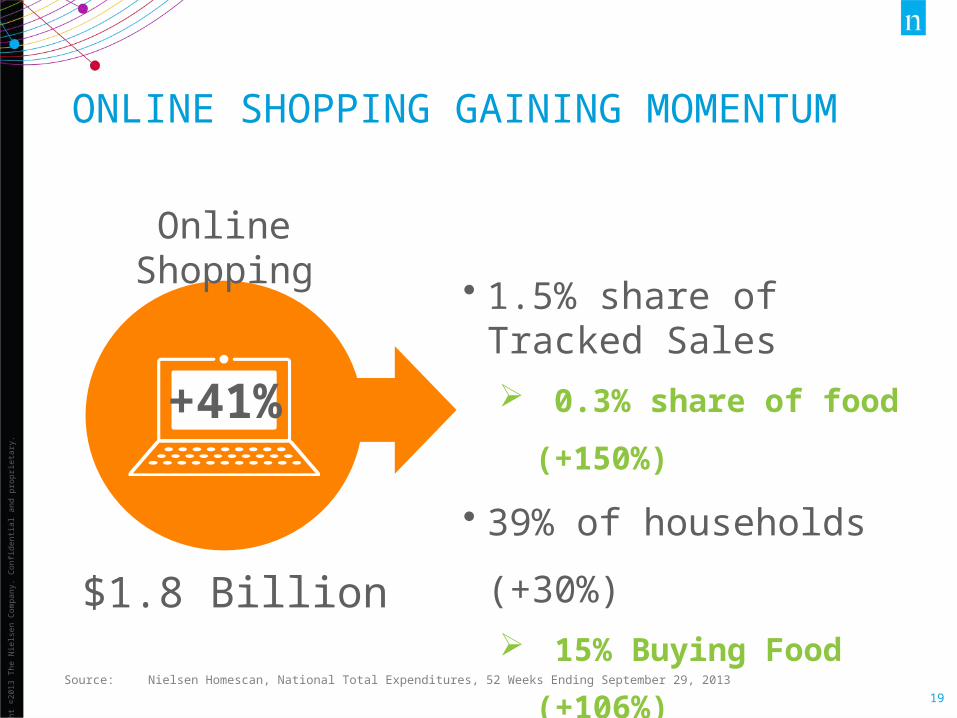
ONLINE SHOPPING GAINING MOMENTUM
Online Shopping
+41%
• 1.5% share of Tracked Sales 0.3% share of food (+150%)
• 39% of households (+30%) 15% Buying Food (+106%)
• Spending $344 per year $111 Food (+21%)$1.8 Billion
Source: Nielsen Homescan, National Total Expenditures, 52 Weeks Ending September 29, 2013
Copy
right
©20
12 T
he N
ielse
n Co
mpa
ny. C
onfid
entia
l and
pro
prie
tary
.
20
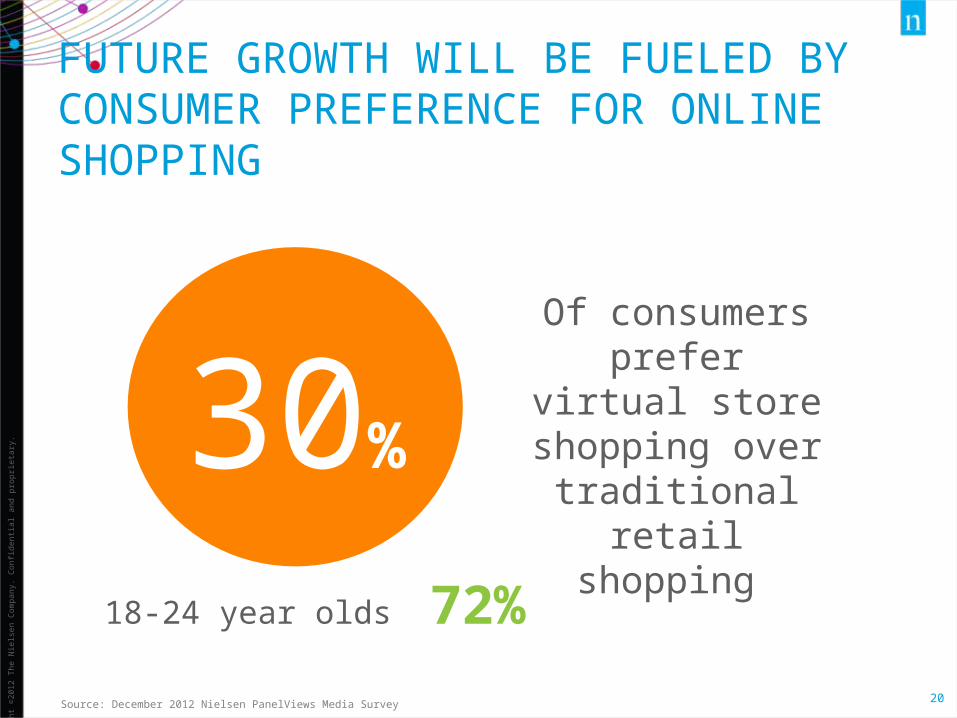
FUTURE GROWTH WILL BE FUELED BY CONSUMER PREFERENCE FOR ONLINE SHOPPING
Source: December 2012 Nielsen PanelViews Media Survey
30%
Of consumers prefer virtual store
shopping over traditional retail
shopping
18-24 year olds 72%
Copy
right
©20
13 T
he N
ielse
n Co
mpa
ny. C
onfid
entia
l and
pro
prie
tary
.
21
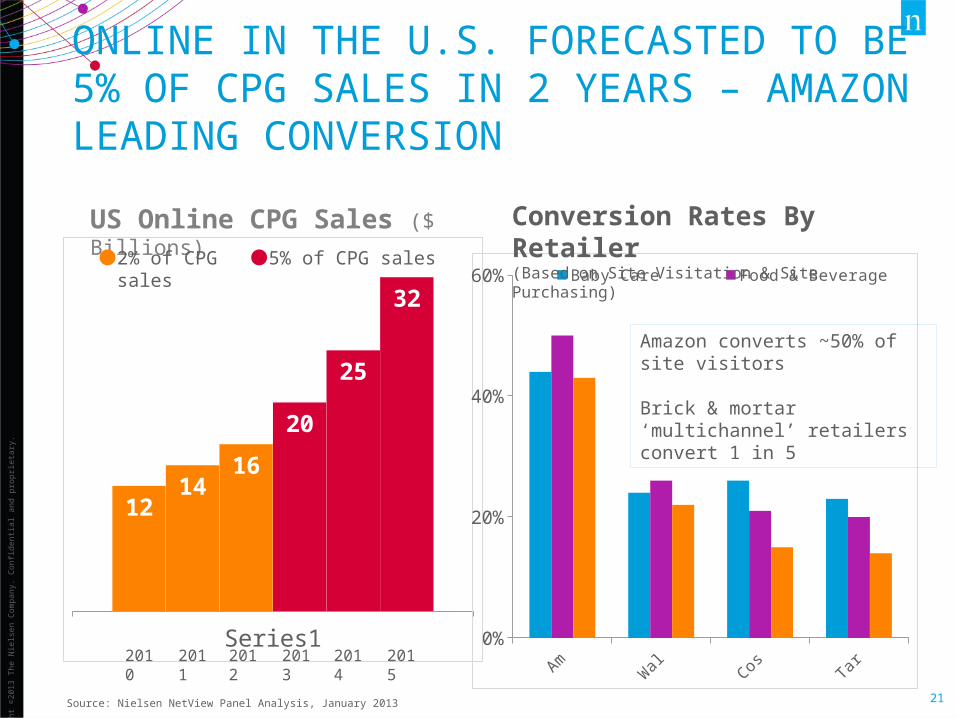
US Online CPG Sales ($ Billions)
Series1
1214
16
20
25
32
2010 2011 2012 2013 2014 2015
2% of CPG sales
ONLINE IN THE U.S. FORECASTED TO BE 5% OF CPG SALES IN 2 YEARS – AMAZON LEADING CONVERSION
5% of CPG sales
Amazon Walmart.com Costco.com Target.com0%
20%
40%
60% Baby Care Food & Beverage Health & Beauty
Conversion Rates By Retailer(Based on Site Visitation & Site Purchasing)
Source: Nielsen NetView Panel Analysis, January 2013
Amazon converts ~50% of site visitors
Brick & mortar ‘multichannel’ retailers convert 1 in 5
Copy
right
© 2
013
The
Niel
sen
Com
pany
. Con
fiden
tial a
nd p
ropr
ieta
ry.
22
ONLINE GROCERY SALES TO DOUBLE IN FIVE KEY EUROPEAN MARKETS BY 2016
Source: Reuters
Britain, France, Germany, Switzerland and the Netherlands
Joanne Denney-Finch, chief executive, IGDReuters (Berlin), Oct. 23, 2013
Online retailing in food and consumer goods is growing at a phenomenal rate across Europe. Technology is empowering people, fundamentally changing the way they buy groceries
Copy
right
©20
12 T
he N
ielse
n Co
mpa
ny. C
onfid
entia
l and
pro
prie
tary
.
23
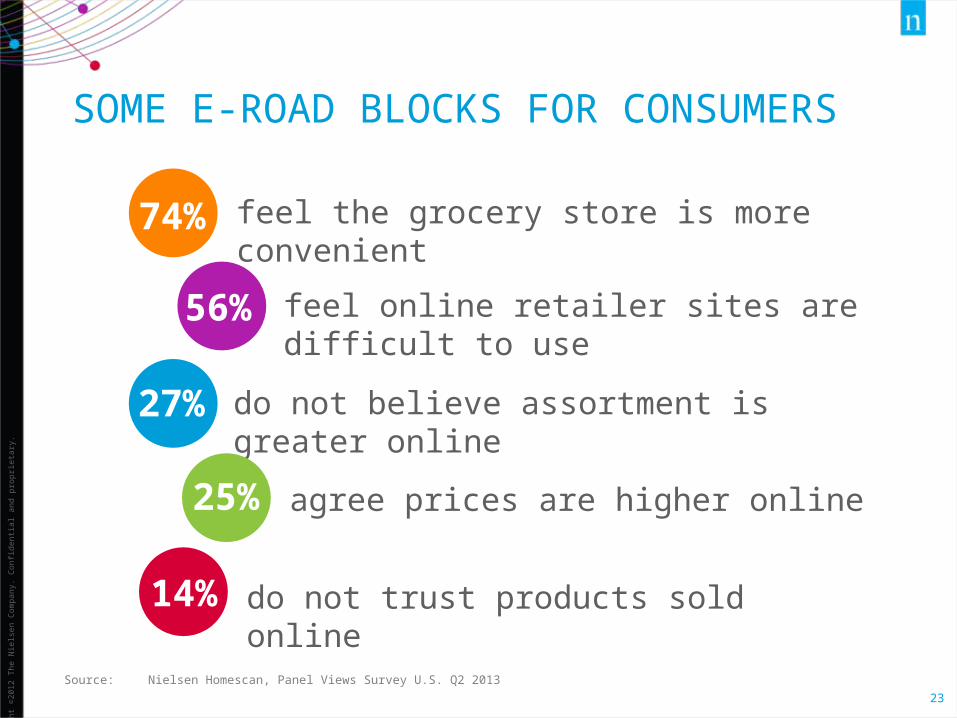
SOME E-ROAD BLOCKS FOR CONSUMERS
do not believe assortment is greater online
Source: Nielsen Homescan, Panel Views Survey U.S. Q2 2013
feel the grocery store is more convenient
feel online retailer sites are difficult to use
agree prices are higher online
do not trust products sold online
74%
56%
27%
25%
14%
Copy
right
©20
13 T
he N
ielse
n Co
mpa
ny. C
onfid
entia
l and
pro
prie
tary
.
24
DECREASING TRIPS BUT INCREASING TOUCH POINTS
SHOP HERE
Copy
right
©20
12 T
he N
ielse
n Co
mpa
ny. C
onfid
entia
l and
pro
prie
tary
.
25
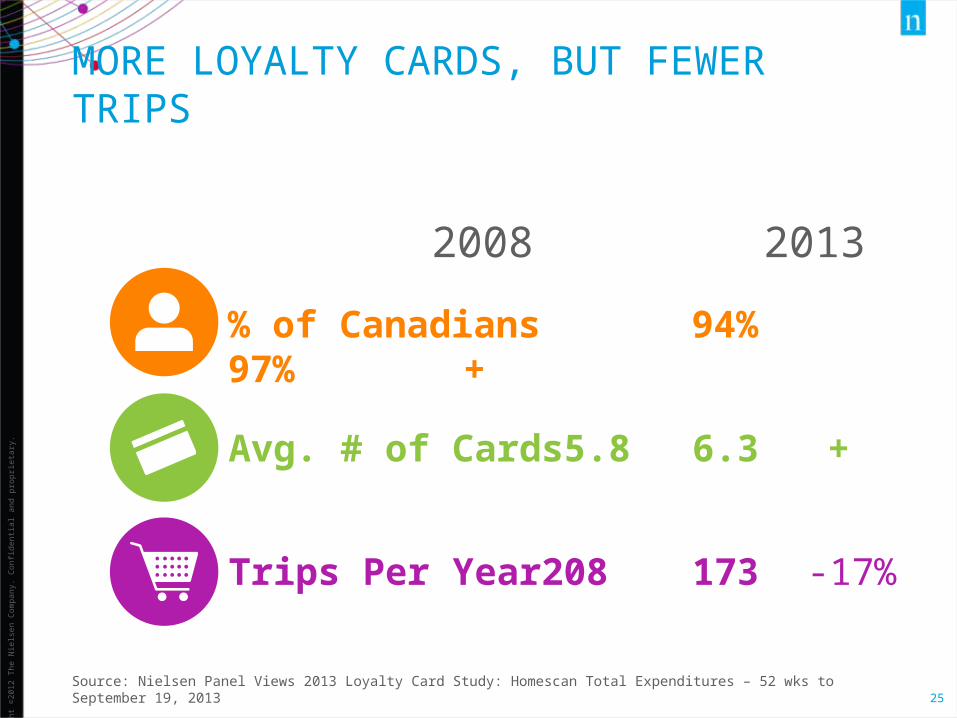
MORE LOYALTY CARDS, BUT FEWER TRIPS
Source: Nielsen Panel Views 2013 Loyalty Card Study: Homescan Total Expenditures – 52 wks to September 19, 2013
2008 2013
% of Canadians 94% 97% +
Avg. # of Cards 5.8 6.3 +
Trips Per Year 208 173 -17%
Copy
right
©20
12 T
he N
ielse
n Co
mpa
ny. C
onfid
entia
l and
pro
prie
tary
.
26
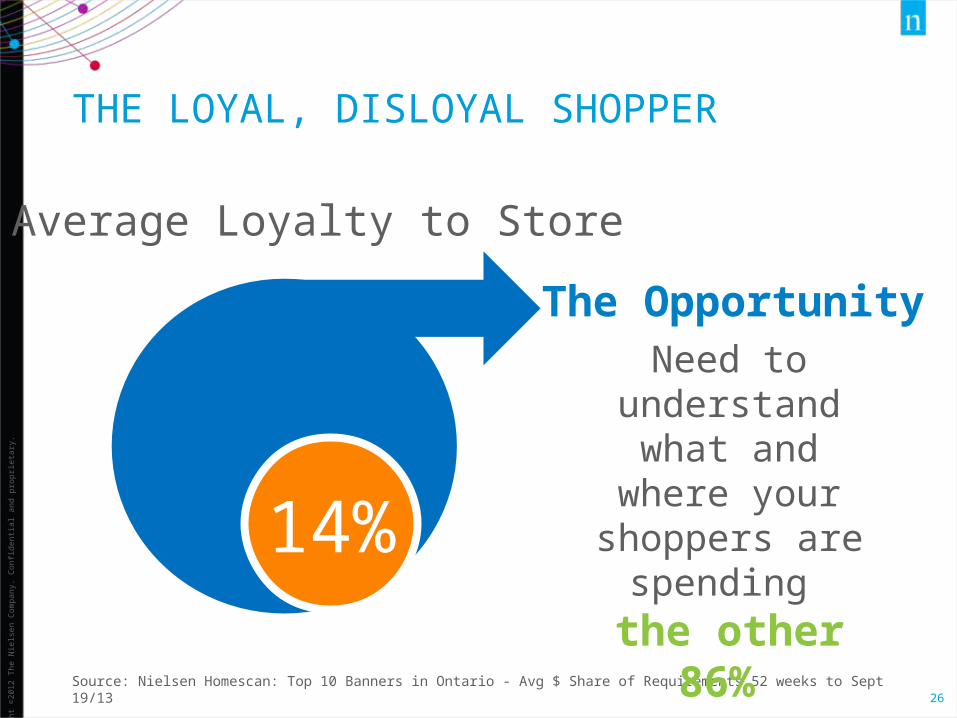
THE LOYAL, DISLOYAL SHOPPER
Source: Nielsen Homescan: Top 10 Banners in Ontario - Avg $ Share of Requirements 52 weeks to Sept 19/13
Average Loyalty to Store
14%
Need to understand what and where
your shoppers are spending
the other 86%
The Opportunity

Copy
right
©20
13 T
he N
ielse
n Co
mpa
ny. C
onfid
entia
l and
pro
prie
tary
.
27
SHOPPING TODAY IS MORE ABOUT THE EXPERIENCE
Source: Nielsen Global Omnibus Survey Q1 2011, Q1 2013
59% Value for Money59% Promotions55% Price
53% Quality Fresh Produce48% Quality Meat Department48% Variety and Selection26% Exclusive Events
Loyalty Programs
Copy
right
©20
13 T
he N
ielse
n Co
mpa
ny. C
onfid
entia
l and
pro
prie
tary
.
2828
KEY TAKEAWAYS• Promote for Win-Wins: It’s not about spending
more, it’s about promoting and pricing smarter for sustainable growth and profitability for both the manufacturer and the retailer
• Mix of Old and New: Online is growing but on a small base. The role of digital needs to be integrated with the overall shopping experience
• Know your shopper: In order to build loyalty, it’s important to understand what consumers are buying outside of the store to meet new unmet needs and demand.
Copy
right
©20
13 T
he N
ielse
n Co
mpa
ny. C
onfid
entia
l and
pro
prie
tary
.
29
THANK YOU!
Stay Connected to Consumer and Media TrendsFor the latest insights, visit nielsen.com
Download our app: Nielsen Top10
Questions regarding the content of this presentation, contact:
Carman Allison, email [email protected]