Retail investors’ attention and momentum strategies ANNUAL MEETINGS...Retail Investors’...
32
Retail investors’ attention and momentum strategies ‐ Evidence from the S&P 500 ‐ Giorgio Ciocca University of St. Gallen Bodanstrasse 6 CH-9000 St.Gallen [email protected] Robert Gutsche University of St. Gallen Bodanstrasse 6 CH-9000 St.Gallen [email protected]
Transcript of Retail investors’ attention and momentum strategies ANNUAL MEETINGS...Retail Investors’...
Retail investors’ attention and momentum
strategies
‐ Evidence from the S&P 500 ‐
Giorgio Ciocca
University of St. Gallen
Bodanstrasse 6
CH-9000 St.Gallen
Robert Gutsche
University of St. Gallen
Bodanstrasse 6
CH-9000 St.Gallen
Retail Investors’ Attention and Momentum Strategies I
Abstract
Relying on Google Trends search data for the S&P 500 stocks between 2004 and 2015, we find that
investing in momentum in a portfolio of stocks with increasing search activity minus a portfolio
of stocks facing a decreasing search activity does not exhibit, ceteris paribus, significant positive
momentum returns. Furthermore, we show that retail investors’ attention creates volatility. For
that reason, investing in stocks with stable retail investors’ attention decreases significantly
momentum volatility. The momentum effect has a negative relationship with the market tone and
does not significantly impact the long‐term reversal effect. For those reasons, while general
investors overreact to information as shown by Hillert et al. (2014), we conclude that retail
investors underreact to information.
Retail Investors’ Attention and Momentum Strategies 1
1 Introduction
Many papers have documented that average stock returns are related to past performance.
Trading strategies that bought past winners and sold past losers realize significant abnormal
returns in the US over the 1965 to 1989 period (Jegadeesh and Titman, 1993) and in Europe
between 1980 and 1995 (Rouwenhorst, 1998). More in detail, Jegadeesh and Titman (1993) show
that stocks in the US that realized the best returns over the past 3 to 12 months continue to
perform well over the subsequent 3 to 12 months. Even if the existence of the momentum effect
has been shown in different time periods, countries, indices, and asset classes, a central issue is
far from being resolved (Hillert, Jacobs, and Sebastian, 2014): what are the underlying causes of
momentum?
The magnitude of momentum profits is about 12% per year in the United States and
Europe, and such an amount is unlikely to be explained by risk‐based theories or rational asset
pricing models. Indeed, most of the focus in the academic research has been on behavioral
explanations for this phenomenon (Chui, Titman, and Wei, 2010). Some studies conclude that the
market underreacts to information, while others find evidence of overreaction. For example,
Daniel, Hirshleifer, and Subrahmanyam (1998) show how the momentum effect can be generated
by investorsʹ overconfidence and self‐attribution bias. Their theory implies that investors
overreact to private information signals and underreact to public information signals.
Media coverage directly affects the way in which investors collect, process, and interpret
information (Engelberg and Parsons, 2011). Hillert, Jacobs, and Müller (2014) argue that investors’
attention and information processing play a crucial role in prominent behavioral finance theories
of momentum. They find that firms specifically covered by the media exhibit, ceteris paribus,
significantly stronger momentum. This effect is higher if the articles have a positive tone or
contain positive content. However, in the long run, they notice the reversal of the momentum
return, which is more pronounced for stocks with high uncertainty and in states with high
investor individualism. They conclude by supporting the overreaction‐based explanation for the
momentum effect.
More recent papers study the number of internet users looking for information about a
company or stock market. The analysis of internet search queries can be interpreted as a measure
of retail investors’ attention to the stock market. In contrast, most professional investors probably
don’t use a search engine to obtain information about the leading stock market index (Da,
Retail Investors’ Attention and Momentum Strategies 2
Engelberg, and Gao, 2011). After searching for the stock market index, some individuals might
be inclined to act and trade immediately or the following day; the overall trading volume of the
stocks comprising the Dow Jones Industrial Average (Dow Jones) rises after an increase in search
queries for the index (Dimpfl and Jank, 2015). A rise in investors’ attention is followed by higher
volatility.
Retail investors are often considered to be uninformed noise traders. Empirical evidence
shows that retail investors lose money with their trading decisions. For example, Grinblatt and
Keloharju (2000) analyze Finland’s unique data set to understand whether differences in investor
sophistications drive the performance of various investor types. They find that foreign investors
outperform domestic households.
In this paper, we study the relationship between the retail investors’ market attention and
the returns of momentum strategies on the S&P 500 in the period from 2004 to 2015. The idea is
to partially replicate the analysis of the media coverage effects on momentum returns conducted
by Hillert, Jacobs, and Müller (2014). However, the main difference is that, instead of using
newspaper articles, we define the media coverage as growth in the residual Google searches for
a single stock. According to Latoeiro, Ramos, and Veiga (2013), Google is a good representative
of web search queries on the Internet due to its leading market share. While Hillert et al. (2014)
study both retail and sophisticated investors, with this study we can contribute to the literature
by focusing on the effect of retail investors’ attention to the momentum returns. The main
assumption of this paper is that most sophisticated investors are not looking for data on Google,
but they do use other information providers, as shown by Da et al. (2011).
Furthermore, we aim to understand if it’s possible to explain the future media‐based
momentum return by analyzing the retail investors’ confidence in the stock markets. One
important disadvantage of Google search queries is that they don’t allow for research on the tone
of the articles. It is not possible to understand if users’ increased attention is due to negative or
positive information. For that reason, we use six Google Trend indicators of the investors’
confidence in the stock markets, following Preis, Moat, & Stanley (2013). Our hypothesis is the
following: if investors search information on a stock in a period in which the confidence indicator
queries are high, they will judge more confidently the information they get.
We show three main results. First, contrary to the results shown by Hillert et al. (2014)
with media coverage, investing in momentum in a portfolio of stocks with increasing search
activity minus a portfolio of stocks facing a decreasing search activity does not exhibit, ceteris
Retail Investors’ Attention and Momentum Strategies 3
paribus, significant positive momentum returns. However, we notice positive but not statistically
significant returns by investing in a portfolio of firms with stable residual Google searches and
selling at the same time stocks that had either high increase or decrease in residual Google search
during the previous six months.
Secondly, we conclude that a momentum strategy which invests in a portfolio of stocks
with high retail investors’ attention and sells a portfolio of stocks with low investors’ attention
has a statistically significant lower volatility than a classical momentum strategy. However, it has
a higher volatility than the strategy which invests in a portfolio of stock with stable Google
searches. The latter result shows that retail investors’ attention creates volatility, as shown by
Dimpfl and Jank (2015).
Thirdly, the analysis of the tone of the market and of the long‐run reversal effect don’t
show that investors overreact to information. For those reasons, while the general investors
overreact to information as shown by Hillert et al. (2014), we conclude that the retail investors
underreact to information.
Section 2 of this paper describes the data sample and the research method. In section 3,
we present the empirical results, and, in section 4, we show the analysis of the market tone and
long‐run reversal effect. Section 5 concludes the research.
2 Data and Empirical Setup
2.1 Data sample
Our initial sample consists of all S&P 500 constituents as of April 2016, which are shown
in Appendix A. The monthly prices for those stocks are retrieved from Thomson Eikon for the
period beginning January 2004 and ending December 2015. We eliminate all constituents without
analyzed prices for the whole period in order to avoid the survivorship bias. After this
adjustment, the sample consists of 435 constituents. We compute monthly continuously‐
compounded returns for the whole period.
The data on search queries are obtained through Google Trends.1 We decide to use Google
Trends for two main reasons. First, according to Latoeiro, ,Ramos and Veiga (2013), Google is a
good representative of web search queries on the Internet due to its leading market share, which
1 Source: Google Trends (www.google.com/trends)

Retail Investors’ Attention and Momentum Strategies 4
is about 88% worldwide.2 For that reason, Google Trends data represent the majority of the US
population searches. Additionally, Google provides free data, collected on a regular basis
beginning in 2004, which is easy to access and to analyze.
One of the main challenges in analyzing Google Trend data is the choice of the search
terms. For example, by searching the term “APPLE,” it is impossible to understand if the internet
user was searching information about “APPLE, Inc” or about fruits. In the previous literature,
two main methods are used (Latoeiro et al., 2013). One possible solution is to look for the complete
name of the firm; in the Apple example, this would be “APPLE INC.” An alternative solution is
to use the ticker of the company; in this example: “AAPL.” Following Da et al. (2011), we decide
to use the ticker of the company as the search term. By searching the ticker of the company,
investors show their intention to look for information on the share price of this company and not,
for example, to find the new products sold by the firm. We interpret the search of the ticker as a
strong signal of investors’ interest and attention to a stock.
We download weekly data on search volume from January 2004 to the end of 2015; Google
provides weekly indexed data for each search term. The index measure is based on the number
of searches within the USA, following Dimpfl and Jank (2015). We define the monthly search
volume as the average of the weekly search index provided by Google for each month. We
calculate the month‐to‐month percentage increase or decrease in the index of Google searches for
each query. However, for 35 search queries, it was not possible to obtain search information. For
that reason, we exclude them from the data set, which, after this correction, is composed of 400
components of the S&P 500. We download data from Google Trends using the gtrendsR package,
as shown in Appendix A.
2.2 Calculation of residual Google searches
The advantage of indexed data is that we don’t have to control for the size of the company,
as suggested by Hillert et al. (2014). They argue that bigger firms could have greater media
coverage than smaller ones; for that reason, they use a two‐step regression model to correct media
coverage data for the size effect. However, we have to account for the effect that high returns for
a stock at month could lead to more Google searches for the same stock at time 1. For that
reason, for the construction of momentum portfolios, we use both the total month‐to‐month
2 According to Netmarketshare.com (www.netmarketshare.com), as of January 2016.
Retail Investors’ Attention and Momentum Strategies 5
percentage change of Google searches and also the month‐to‐month percentage residual change
of Google searches by applying a two‐step regression model.
First of all, we estimate for each stock the constant and the of the simple regression
model (1):
1 % , ∗ ,
After estimating the parameters of the regression model for each stock, we can estimate the
expected Google search for each stock at time , given the actual stock return at 1. Using these
two parameters, we can estimate the expected Google search percentage change as follows (2):
2 % , ∗ ,
The residual Google search percentage change is then defined as follows (3):
3 % ,
% , % ,
2.3 Construction of momentum portfolios
After downloading data, the second important step in this paper is the construction of
momentum portfolios. Consistent with Hillert et al. (2014), returns are given as percentages per
month and are based on overlapping equally‐weighted portfolios, as in Jegadeesh and Titman
(1993). In order to present a clear and transparent methodology for the construction of the
momentum portfolios, we follow the subsequent steps.
Firstly, at the beginning of every month , we rank the 400 stocks based on their
cumulative residual Google search growth over the previous six months. Secondly, we sort the
stocks into five equal‐weighted portfolios. Portfolio 1 contains the 80 stocks with the worst
growth (or higher decrease) in Google search. Portfolio 2 contains the next 80 stocks, and so on,
until the highest searched stocks are included in Portfolio 5. Thirdly, for each of the five portfolios,
we create three sub‐portfolios “Winner,” “Mid,” and “Loser.” In other words, we rank the 80
stocks of each of the five portfolios, based on their cumulative stock returns in the last six months.
The Winner portfolio includes the 24 best performing stocks inside the portfolio. This represents
the best 30% of the 80 stocks included in each of the five main portfolios. The Loser portfolio
includes the worst 24 performing stocks, and the Mid portfolio includes the remaining ones. The
five portfolios (including the three sub‐portfolios for each portfolio) are created at each month .
Returns for each portfolio are calculated monthly for the next six months, or until 6. The
return of each sub‐portfolio at time is the average of the return of the sub‐portfolio at time ,
1, 2, and so on through 5. This is the overlapping portfolio presented by Jegadeesh
Retail Investors’ Attention and Momentum Strategies 6
and Titman (1993). To conclude, the momentum return for each of the five portfolios is the
difference between the Winner and Loser sub‐portfolios.
3 Empirical Results
3.1 Analysis of the momentum returns
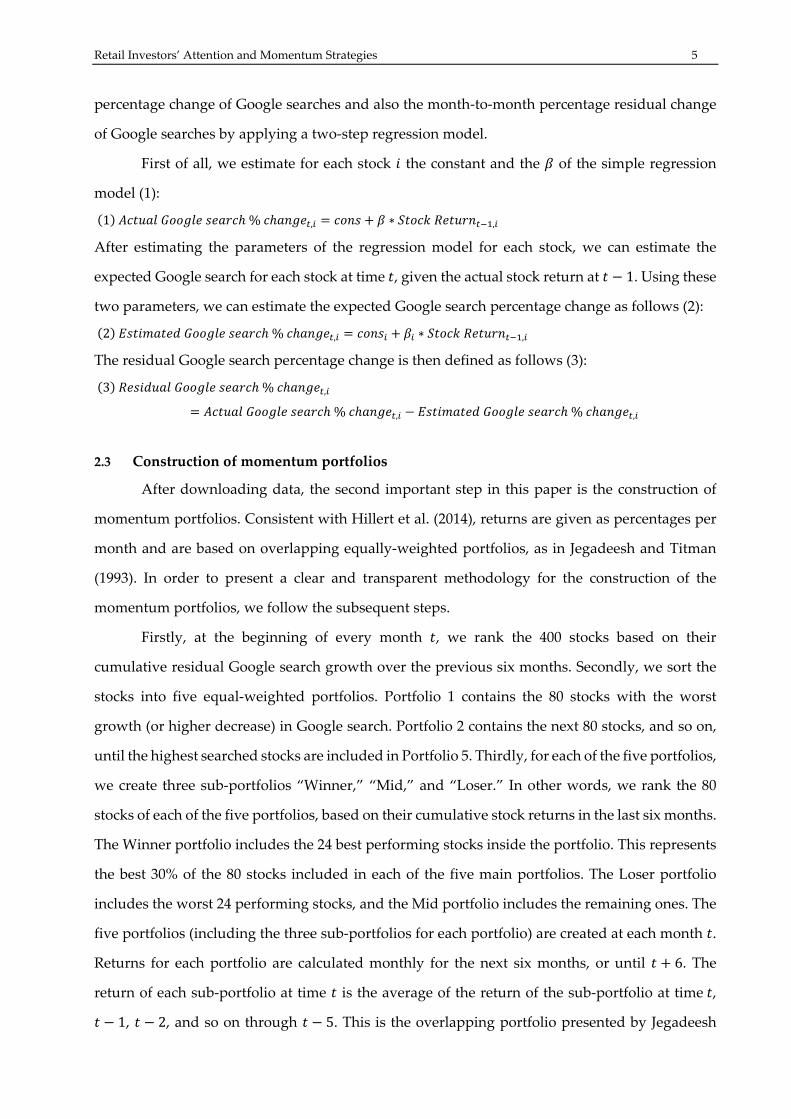
Following the standard in the literature, we construct momentum portfolios using a
formation and holding period of six months, as explained in the previous section. Since we divide
the 400 stocks analyzed by ranking them in five different portfolios of 80 stocks each, we show in
Table 1 the 20th average percentiles for the choice of the stocks. Portfolio 1 has, on average, stocks
with cumulative residual Google searches during the previous six months between ‐78% and
‐ 14%. Portfolio 2 has, on average, constituents with cumulative residual Google searches during
the formation period between ‐14% and ‐3%, and so on through Portfolio 5, which includes the
tickers with the highest growth in Google searches during the formation period.
Table 1. Descriptive statistics. The table shows the average percentiles of the growth in Google searches during the
six‐month formation periods. For that reason, when constructing Portfolio 1, we consider on average changes between
‐78% and ‐14%. Portfolio 2 considers on average changes in Google search between ‐14% and ‐3%, and so on.
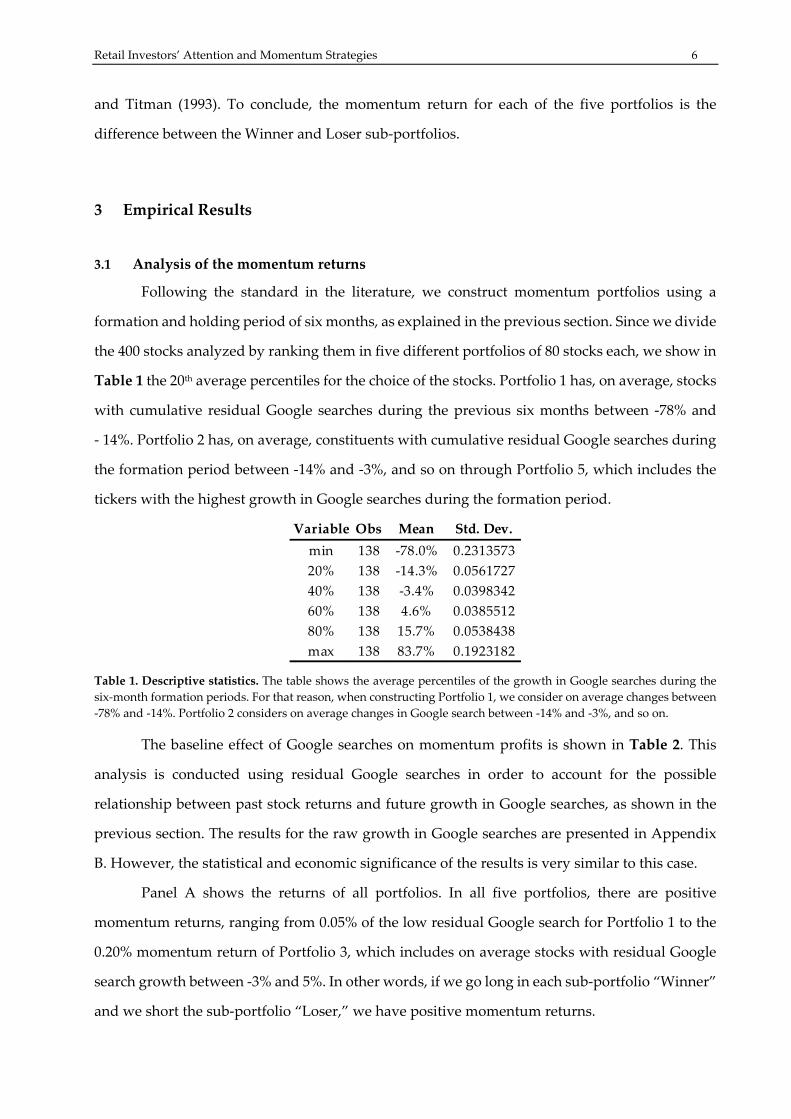
The baseline effect of Google searches on momentum profits is shown in Table 2. This
analysis is conducted using residual Google searches in order to account for the possible
relationship between past stock returns and future growth in Google searches, as shown in the
previous section. The results for the raw growth in Google searches are presented in Appendix
B. However, the statistical and economic significance of the results is very similar to this case.
Panel A shows the returns of all portfolios. In all five portfolios, there are positive
momentum returns, ranging from 0.05% of the low residual Google search for Portfolio 1 to the
0.20% momentum return of Portfolio 3, which includes on average stocks with residual Google
search growth between ‐3% and 5%. In other words, if we go long in each sub‐portfolio “Winner”
and we short the sub‐portfolio “Loser,” we have positive momentum returns.
Variable Obs Mean Std. Dev.
min 138 ‐78.0% 0.2313573
20% 138 ‐14.3% 0.0561727
40% 138 ‐3.4% 0.0398342
60% 138 4.6% 0.0385512
80% 138 15.7% 0.0538438
max 138 83.7% 0.1923182
Retail Investors’ Attention and Momentum Strategies 7
Now we consider the momentum returns between different portfolios. What happens if
we go long in the momentum strategy of Portfolio 5 and we short the momentum strategy of
Portfolio 1? This is shown in the table in the row “Return 5‐1.” The return if we invest in a
momentum strategy constructed in the high cumulative residual Google search growth portfolio
and we sell the low cumulative residual Google search growth one (i.e. Portfolio 5 minus Portfolio
1) equals 0.01%. Even if the results are positive, they are not statistically significant at 10%
confidence level since all t‐values are very low. It is not possible to state that stocks with high
growth in Google searches over the formation period either overperform or underperform stocks
with high search decrease. Furthermore, the returns of the Winner, Mid, and Loser sub‐portfolios
are higher for the low‐growth residual Google search portfolios. In this case, the results are
statistically insignificant.
Table 2. Residual Google search and momentum. This table presents momentum returns for stock portfolios sorted
first by residual Google search growth. We calculate the residual Google search growth with a two‐step regression
model which controls for the correlation between past returns and future Google search growth. We use a formation
and a holding period of six months each. For 138 periods, we rank the 400 constituents of the S&P 500 basing on the
growth of Google searches during the previous six months. In other words, we create at each month, for 138 months,
five portfolios of 80 different stocks each. Furthermore, for each portfolio, we create three sub‐portfolios: “Loser,”
“Mid,” and “Winner.” The Winner (Loser) portfolio consists of all stocks with a formation period return above the 70th
percentile (below the 30th percentile). In each portfolio, the Winner and Loser sub‐portfolios are composed of 24 stocks
(30% of 80 stocks). Momentum returns (reported in % per month) are based on overlapping portfolios that are equally
weighted as in Jegadeesh and Titman (1993) and Hillert et al. (2014). Panel A shows raw returns, while Panels B and C
show risk adjusted returns. 1F is the CAPM model, while 3F is the Fama and French (1993) model. Panel B shows the
risk‐adjusted returns for the difference between the momentum return for the high and the low residual Google search
Panel A: Double sorts and raw returns
Loser Return Mid Return Winner Return Mom Return t‐stat
1 0.64% 0.58% 0.70% 0.05% 0.19
2 0.45% 0.56% 0.52% 0.06% 0.23
3 0.36% 0.52% 0.56% 0.20% 0.67
4 0.38% 0.47% 0.48% 0.10% 0.33
5 0.51% 0.52% 0.57% 0.07% 0.17
Return 3‐1 ‐0.29% ‐0.06% ‐0.14% 0.15% 0.95
Return 4‐1 ‐0.26% ‐0.11% ‐0.21% 0.05% 0.28
Return 3‐5 ‐0.15% 0.00% ‐0.02% 0.14% 0.75
Return 5‐1 ‐0.13% ‐0.06% ‐0.12% 0.01% 0.06
t‐stat ‐0.67 ‐0.79 ‐0.88
Panel B: Risk Adjusted returns for media‐based momentum, Return 5‐1
Factor Model 1F 3F
Intercept 0.0005 0.0002
Intercept t‐stat 0.21 0.09
R^2 0.01 0.15
Panel C: Risk Adjusted returns for media‐based momentum, Return 3‐1
Factor Model 1F 3F
Intercept 0.0018 0.0017
Intercept t‐stat 1.15 1.09
R^2 0.02 0.08
Retail Investors’ Attention and Momentum Strategies 8
growth portfolios (5‐1). Panel C shows the risk‐adjusted returns for the difference between the momentum return for
the third quintile and the low residual Google search growth portfolios (3‐1).
However, interesting results come from the analysis of the momentum returns between Portfolio
3 and the two extreme portfolios, Portfolios 1 and 5. By investing in Portfolio 3 and selling
Portfolio 1 (or 5), it was possible to achieve 0.15% (0.14%) monthly return over the 138 months
analyzed. Those returns are higher compared to the other ones. However, even if the t‐statistics
in this case are higher, both results remain statistically insignificant.
Panels B and C show the risk‐adjusted returns. Also, in this case, both with the CAPM and
the Fama and French (1993) models, it is not possible to identify positive and significant abnormal
returns resulting neither from the 5‐1 momentum portfolio, nor from the 3‐1 momentum
portfolio. However, the significance of the 3‐1 momentum portfolio is higher compared to the 5‐
1 portfolio.
Generally, the results show that the analysis of Google searches does not lead to clear and
statistically significant results in the case of media coverage, as shown by Hillert et al. (2014), who
have not only economically but also statistically significant results. However, a first interesting –
even if not significant – result from this analysis reveals that investing in a strategy which buys a
momentum portfolio on stocks that were stable3 in terms of residual Google searches during the
previous six months and sells a momentum portfolio on stocks that had a high increase [Portfolio
5] or decrease [Portfolio 1] in residual Google searches, leads to higher momentum returns. As
shown in the Appendix, we obtain similar results by analyzing the raw, rather than residual,
Google search growth.
We test now whether the returns obtained from the strategy which buys a momentum
portfolio on stocks that were stable in terms of residual Google searches [Portfolio 3] and sells the
momentum portfolio on extreme search increase or decrease stocks [Portfolio 1 and 5] generate
statistically higher mean returns than investing in the momentum portfolio 5‐1, which invests in
momentum on high attention stocks and sells momentum on low attention ones. For that reason,
we conduct a two‐sample t‐test. The results are shown in Appendix B. Even if Portfolios 3‐5 and
3‐1 have higher mean returns compared to Portfolio 5‐1, those differences are not statistically
significant.
3 Or, to provide more detail, stocks that on average had a residual Google search growth between
‐3% and 5%, as shown in Table 1.
Retail Investors’ Attention and Momentum Strategies 9
3.2 Analysis of the momentum variances
As shown in the introduction of this paper, Dimpfl and Jank (2015) document that the
overall trading volume of the stocks comprising the Dow Jones rises after an increase in search
queries for the index. They argue that a rise in investors’ attention is followed by higher volatility.
Based on this result, we test the variances of the momentum returns shown in Table 1. For this
analysis, we focus on three main momentum strategies.
Firstly, we introduce a classical momentum strategy. Instead of ranking the stocks based
on the past residual Google searches, we simply rank them by their past cumulative returns over
the same time period. Secondly, we analyze the momentum 3‐1 and 3‐5 strategies. Both strategies
buy stocks that were stable in terms of residual Google search during the previous six months,
and they sell stocks with an extreme increase or decrease in residual Google search. On average,
those stocks have a search growth between 16% and 84% (Momentum Portfolio 5) or a search
decrease between ‐78% and ‐14% (Momentum Portfolio 1).4 Thirdly, we analyze the momentum
5‐1 strategy. This strategy buys stocks with an extreme increase in Google searches and sells the
ones with the highest decrease. In other words, this strategy buys stocks with an increased
investors’ attention and sells stocks with a decreased investors’ attention.
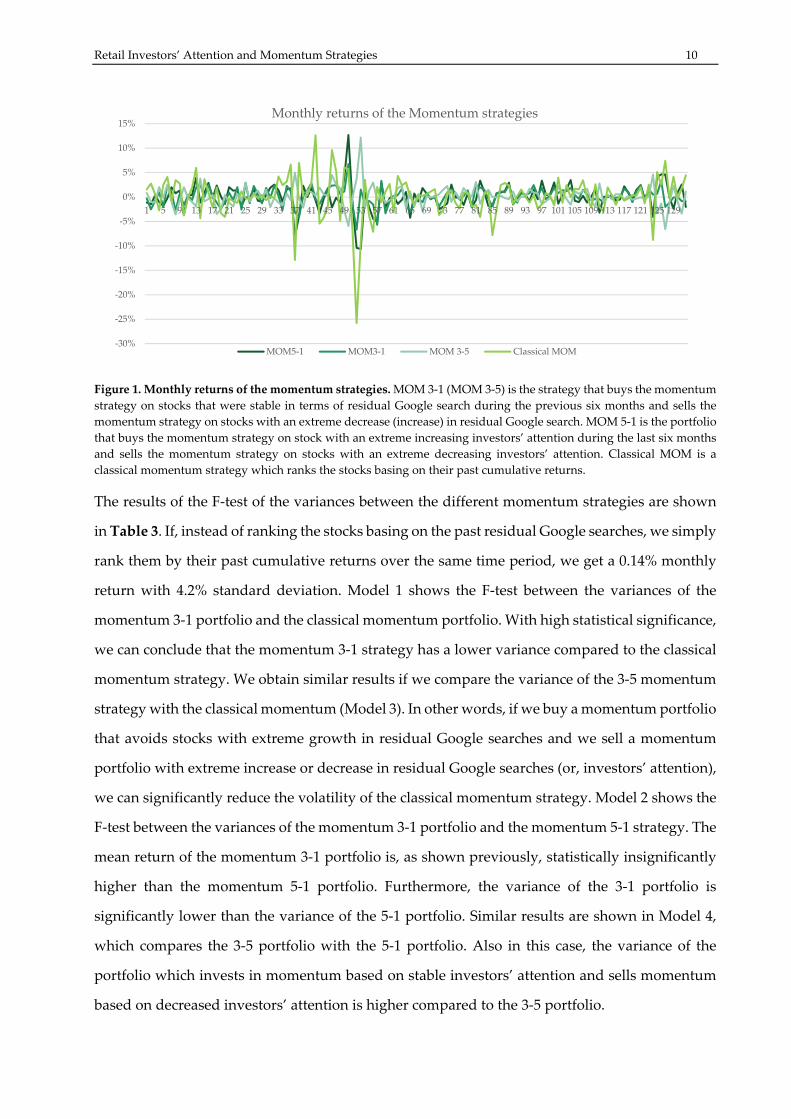
We choose these three strategies to compare portfolios which invest in momentum based
on high investors’ attention, stable investors’ attention, and not caring about investors’ attention
(classical momentum). We show graphically the returns of each of the three5 strategies in Figure
1. Some strategies have higher return volatilities than others. In order to prove statistically those
differences, we conduct a F‐test for the variances of the different momentum strategies.
4 Please refer to Table 1 for further information about average growth in Google search. 5 Please note that we refer to three strategies, even if in fact they are four. The reason is that we
show Portfolios 3‐1 and 3‐5 in the same category, since they both invest in stable investor attention
momentum, and they sell extreme changes in investor attention.
Retail Investors’ Attention and Momentum Strategies 10
Figure 1. Monthly returns of the momentum strategies. MOM 3‐1 (MOM 3‐5) is the strategy that buys the momentum
strategy on stocks that were stable in terms of residual Google search during the previous six months and sells the
momentum strategy on stocks with an extreme decrease (increase) in residual Google search. MOM 5‐1 is the portfolio
that buys the momentum strategy on stock with an extreme increasing investors’ attention during the last six months
and sells the momentum strategy on stocks with an extreme decreasing investors’ attention. Classical MOM is a
classical momentum strategy which ranks the stocks basing on their past cumulative returns.
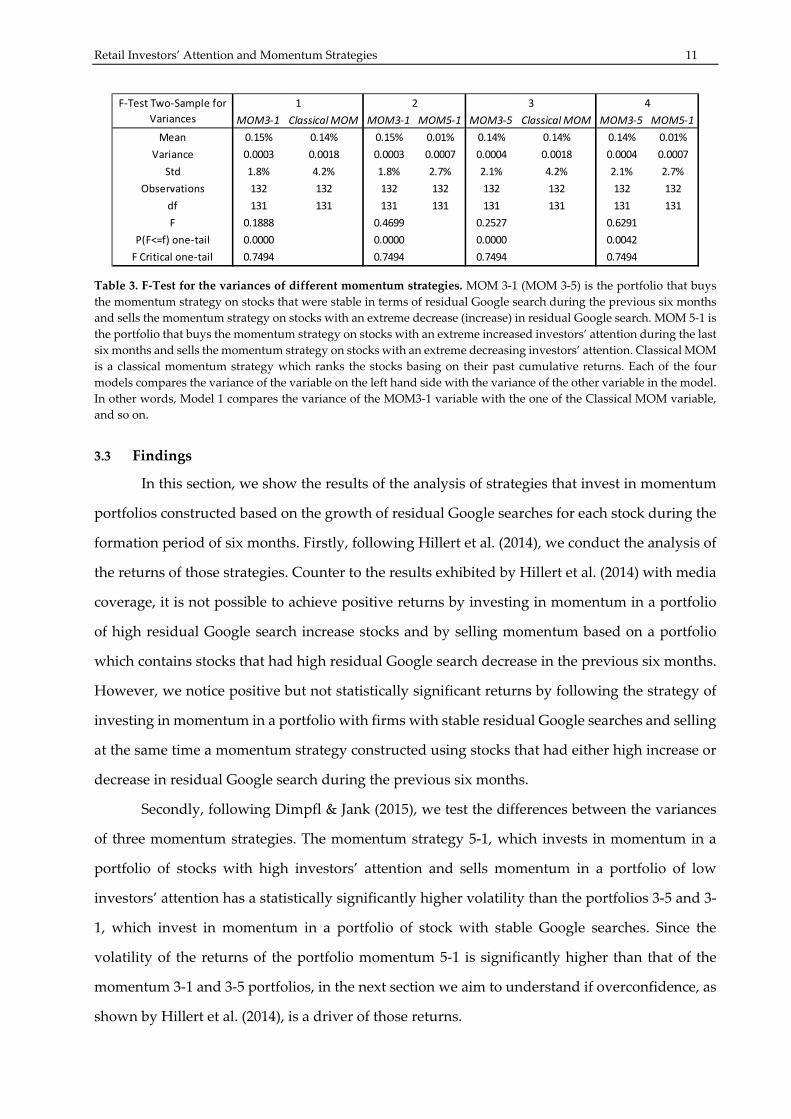
The results of the F‐test of the variances between the different momentum strategies are shown
in Table 3. If, instead of ranking the stocks basing on the past residual Google searches, we simply
rank them by their past cumulative returns over the same time period, we get a 0.14% monthly
return with 4.2% standard deviation. Model 1 shows the F‐test between the variances of the
momentum 3‐1 portfolio and the classical momentum portfolio. With high statistical significance,
we can conclude that the momentum 3‐1 strategy has a lower variance compared to the classical
momentum strategy. We obtain similar results if we compare the variance of the 3‐5 momentum
strategy with the classical momentum (Model 3). In other words, if we buy a momentum portfolio
that avoids stocks with extreme growth in residual Google searches and we sell a momentum
portfolio with extreme increase or decrease in residual Google searches (or, investors’ attention),
we can significantly reduce the volatility of the classical momentum strategy. Model 2 shows the
F‐test between the variances of the momentum 3‐1 portfolio and the momentum 5‐1 strategy. The
mean return of the momentum 3‐1 portfolio is, as shown previously, statistically insignificantly
higher than the momentum 5‐1 portfolio. Furthermore, the variance of the 3‐1 portfolio is
significantly lower than the variance of the 5‐1 portfolio. Similar results are shown in Model 4,
which compares the 3‐5 portfolio with the 5‐1 portfolio. Also in this case, the variance of the
portfolio which invests in momentum based on stable investors’ attention and sells momentum
based on decreased investors’ attention is higher compared to the 3‐5 portfolio.
‐30%
‐25%
‐20%
‐15%
‐10%
‐5%
0%
5%
10%
15%
1 5 9 13 17 21 25 29 33 37 41 45 49 53 57 61 65 69 73 77 81 85 89 93 97 101 105 109 113 117 121 125 129
Monthly returns of the Momentum strategies
MOM5‐1 MOM3‐1 MOM 3‐5 Classical MOM
Retail Investors’ Attention and Momentum Strategies 11
Table 3. F‐Test for the variances of different momentum strategies. MOM 3‐1 (MOM 3‐5) is the portfolio that buys
the momentum strategy on stocks that were stable in terms of residual Google search during the previous six months
and sells the momentum strategy on stocks with an extreme decrease (increase) in residual Google search. MOM 5‐1 is
the portfolio that buys the momentum strategy on stocks with an extreme increased investors’ attention during the last
six months and sells the momentum strategy on stocks with an extreme decreasing investors’ attention. Classical MOM
is a classical momentum strategy which ranks the stocks basing on their past cumulative returns. Each of the four
models compares the variance of the variable on the left hand side with the variance of the other variable in the model.
In other words, Model 1 compares the variance of the MOM3‐1 variable with the one of the Classical MOM variable,
and so on.
3.3 Findings
In this section, we show the results of the analysis of strategies that invest in momentum
portfolios constructed based on the growth of residual Google searches for each stock during the
formation period of six months. Firstly, following Hillert et al. (2014), we conduct the analysis of
the returns of those strategies. Counter to the results exhibited by Hillert et al. (2014) with media
coverage, it is not possible to achieve positive returns by investing in momentum in a portfolio
of high residual Google search increase stocks and by selling momentum based on a portfolio
which contains stocks that had high residual Google search decrease in the previous six months.
However, we notice positive but not statistically significant returns by following the strategy of
investing in momentum in a portfolio with firms with stable residual Google searches and selling
at the same time a momentum strategy constructed using stocks that had either high increase or
decrease in residual Google search during the previous six months.
Secondly, following Dimpfl & Jank (2015), we test the differences between the variances
of three momentum strategies. The momentum strategy 5‐1, which invests in momentum in a
portfolio of stocks with high investors’ attention and sells momentum in a portfolio of low
investors’ attention has a statistically significantly higher volatility than the portfolios 3‐5 and 3‐
1, which invest in momentum in a portfolio of stock with stable Google searches. Since the
volatility of the returns of the portfolio momentum 5‐1 is significantly higher than that of the
momentum 3‐1 and 3‐5 portfolios, in the next section we aim to understand if overconfidence, as
shown by Hillert et al. (2014), is a driver of those returns.
MOM3‐1 Classical MOM MOM3‐1 MOM5‐1 MOM3‐5 Classical MOM MOM3‐5 MOM5‐1
Mean 0.15% 0.14% 0.15% 0.01% 0.14% 0.14% 0.14% 0.01%
Variance 0.0003 0.0018 0.0003 0.0007 0.0004 0.0018 0.0004 0.0007
Std 1.8% 4.2% 1.8% 2.7% 2.1% 4.2% 2.1% 2.7%
Observations 132 132 132 132 132 132 132 132
df 131 131 131 131 131 131 131 131
F 0.1888 0.4699 0.2527 0.6291
P(F<=f) one‐tail 0.0000 0.0000 0.0000 0.0042
F Critical one‐tail 0.7494 0.7494 0.7494 0.7494
1 2F‐Test Two‐Sample for
Variances
3 4
Retail Investors’ Attention and Momentum Strategies 12
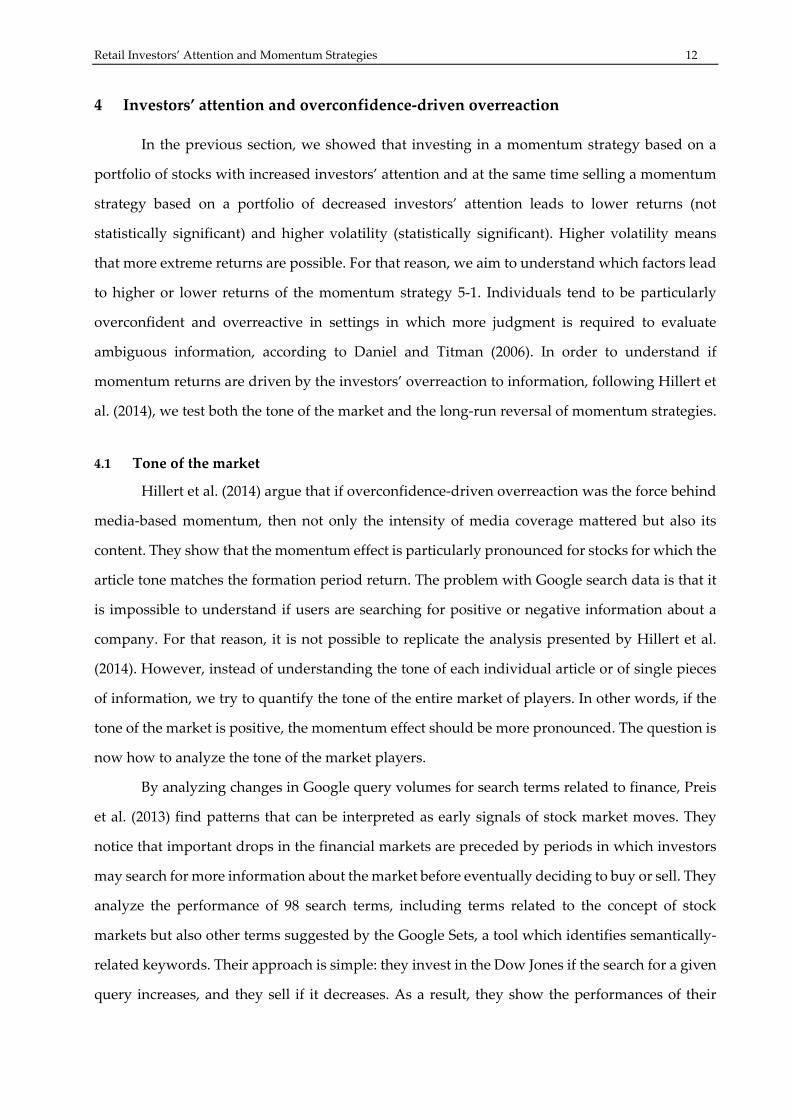
4 Investors’ attention and overconfidence‐driven overreaction
In the previous section, we showed that investing in a momentum strategy based on a
portfolio of stocks with increased investors’ attention and at the same time selling a momentum
strategy based on a portfolio of decreased investors’ attention leads to lower returns (not
statistically significant) and higher volatility (statistically significant). Higher volatility means
that more extreme returns are possible. For that reason, we aim to understand which factors lead
to higher or lower returns of the momentum strategy 5‐1. Individuals tend to be particularly
overconfident and overreactive in settings in which more judgment is required to evaluate
ambiguous information, according to Daniel and Titman (2006). In order to understand if
momentum returns are driven by the investors’ overreaction to information, following Hillert et
al. (2014), we test both the tone of the market and the long‐run reversal of momentum strategies.
4.1 Tone of the market
Hillert et al. (2014) argue that if overconfidence‐driven overreaction was the force behind
media‐based momentum, then not only the intensity of media coverage mattered but also its
content. They show that the momentum effect is particularly pronounced for stocks for which the
article tone matches the formation period return. The problem with Google search data is that it
is impossible to understand if users are searching for positive or negative information about a
company. For that reason, it is not possible to replicate the analysis presented by Hillert et al.
(2014). However, instead of understanding the tone of each individual article or of single pieces
of information, we try to quantify the tone of the entire market of players. In other words, if the
tone of the market is positive, the momentum effect should be more pronounced. The question is
now how to analyze the tone of the market players.
By analyzing changes in Google query volumes for search terms related to finance, Preis
et al. (2013) find patterns that can be interpreted as early signals of stock market moves. They
notice that important drops in the financial markets are preceded by periods in which investors
may search for more information about the market before eventually deciding to buy or sell. They
analyze the performance of 98 search terms, including terms related to the concept of stock
markets but also other terms suggested by the Google Sets, a tool which identifies semantically‐
related keywords. Their approach is simple: they invest in the Dow Jones if the search for a given
query increases, and they sell if it decreases. As a result, they show the performances of their
Retail Investors’ Attention and Momentum Strategies 13
strategies for each search query analyzed, finding that some queries can anticipate the market
better than others.6
In order to understand the tone of the market, we use the search queries analyzed by Preis
et al. (2013). We choose the three variables with the highest (lowest) performances of investment
strategies based on search volume data as indicators of the positive (negative) tone of the market.
Preis et al. (2013) note that if they invest in the market when Google searches increase for the
queries “debt,” “color,” and “stocks,” their strategy achieves high returns. However, they show
the worst performances if they invest in the market when Google searches for the queries “ring,”
“environment,” and “fun” increase. For that reason, we argue that the queries “debt,” “color,”
and “stocks” represent the good tone of the market, while the search terms “ring,”
“environment,” and “fun” represent the negative tone.
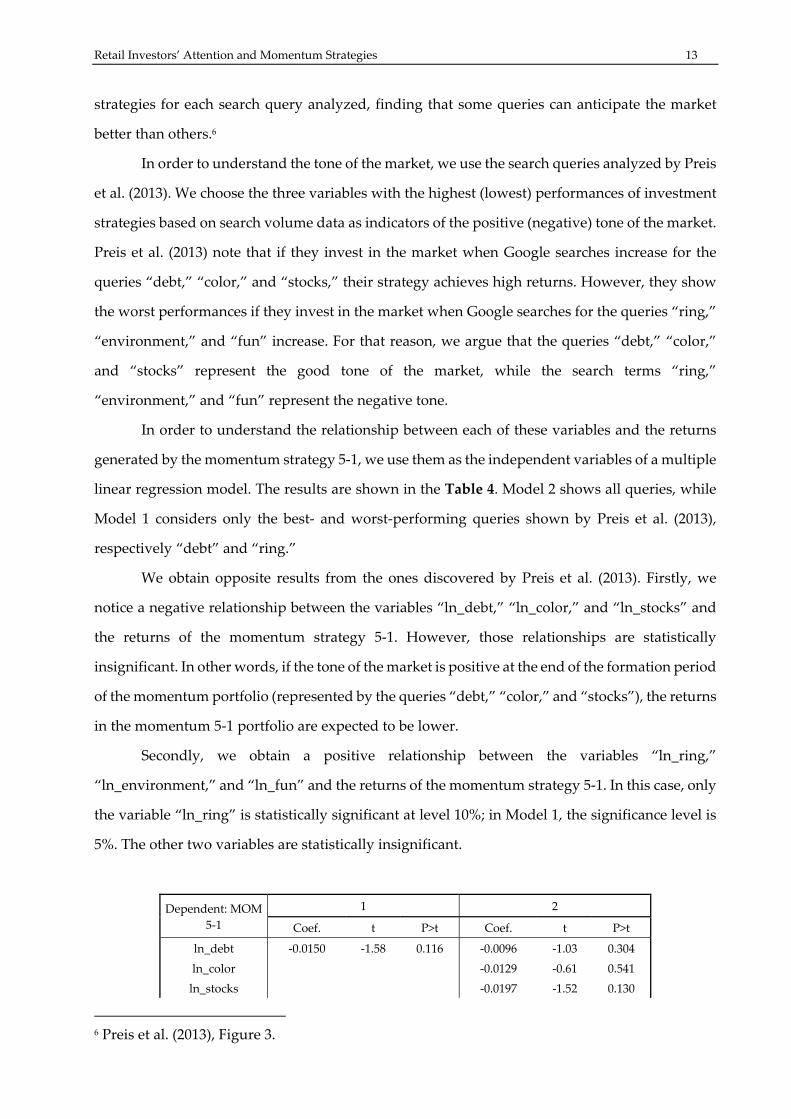
In order to understand the relationship between each of these variables and the returns
generated by the momentum strategy 5‐1, we use them as the independent variables of a multiple
linear regression model. The results are shown in the Table 4. Model 2 shows all queries, while
Model 1 considers only the best‐ and worst‐performing queries shown by Preis et al. (2013),
respectively “debt” and “ring.”
We obtain opposite results from the ones discovered by Preis et al. (2013). Firstly, we
notice a negative relationship between the variables “ln_debt,” “ln_color,” and “ln_stocks” and
the returns of the momentum strategy 5‐1. However, those relationships are statistically
insignificant. In other words, if the tone of the market is positive at the end of the formation period
of the momentum portfolio (represented by the queries “debt,” “color,” and “stocks”), the returns
in the momentum 5‐1 portfolio are expected to be lower.
Secondly, we obtain a positive relationship between the variables “ln_ring,”
“ln_environment,” and “ln_fun” and the returns of the momentum strategy 5‐1. In this case, only
the variable “ln_ring” is statistically significant at level 10%; in Model 1, the significance level is
5%. The other two variables are statistically insignificant.
6 Preis et al. (2013), Figure 3.
Dependent: MOM
5‐1
1 2
Coef. t P>t Coef. t P>t
ln_debt ‐0.0150 ‐1.58 0.116 ‐0.0096 ‐1.03 0.304
ln_color ‐0.0129 ‐0.61 0.541
ln_stocks ‐0.0197 ‐1.52 0.130
Retail Investors’ Attention and Momentum Strategies 14
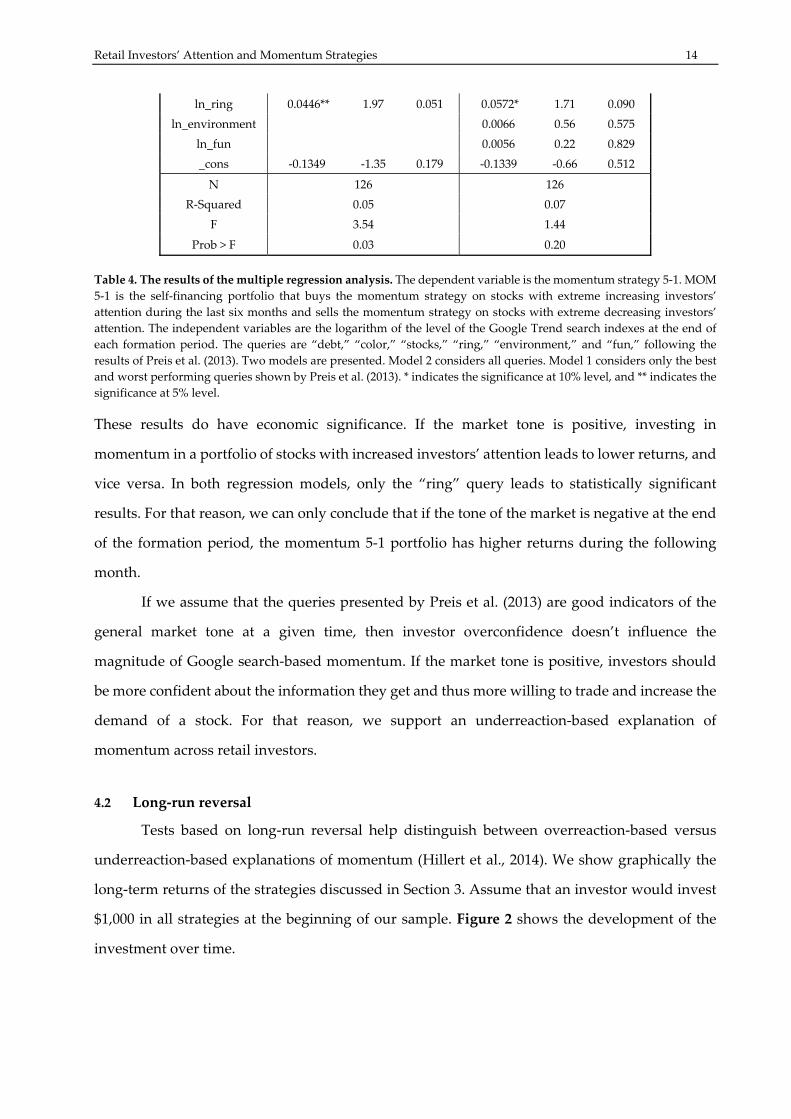
Table 4. The results of the multiple regression analysis. The dependent variable is the momentum strategy 5‐1. MOM
5‐1 is the self‐financing portfolio that buys the momentum strategy on stocks with extreme increasing investors’
attention during the last six months and sells the momentum strategy on stocks with extreme decreasing investors’
attention. The independent variables are the logarithm of the level of the Google Trend search indexes at the end of
each formation period. The queries are “debt,” “color,” “stocks,” “ring,” “environment,” and “fun,” following the
results of Preis et al. (2013). Two models are presented. Model 2 considers all queries. Model 1 considers only the best
and worst performing queries shown by Preis et al. (2013). * indicates the significance at 10% level, and ** indicates the
significance at 5% level.
These results do have economic significance. If the market tone is positive, investing in
momentum in a portfolio of stocks with increased investors’ attention leads to lower returns, and
vice versa. In both regression models, only the “ring” query leads to statistically significant
results. For that reason, we can only conclude that if the tone of the market is negative at the end
of the formation period, the momentum 5‐1 portfolio has higher returns during the following
month.
If we assume that the queries presented by Preis et al. (2013) are good indicators of the
general market tone at a given time, then investor overconfidence doesn’t influence the
magnitude of Google search‐based momentum. If the market tone is positive, investors should
be more confident about the information they get and thus more willing to trade and increase the
demand of a stock. For that reason, we support an underreaction‐based explanation of
momentum across retail investors.
4.2 Long‐run reversal
Tests based on long‐run reversal help distinguish between overreaction‐based versus
underreaction‐based explanations of momentum (Hillert et al., 2014). We show graphically the
long‐term returns of the strategies discussed in Section 3. Assume that an investor would invest
$1,000 in all strategies at the beginning of our sample. Figure 2 shows the development of the
investment over time.
ln_ring 0.0446** 1.97 0.051 0.0572* 1.71 0.090
ln_environment 0.0066 0.56 0.575
ln_fun 0.0056 0.22 0.829
_cons ‐0.1349 ‐1.35 0.179 ‐0.1339 ‐0.66 0.512
N 126 126
R‐Squared 0.05 0.07
F 3.54 1.44
Prob > F 0.03 0.20
Retail Investors’ Attention and Momentum Strategies 15
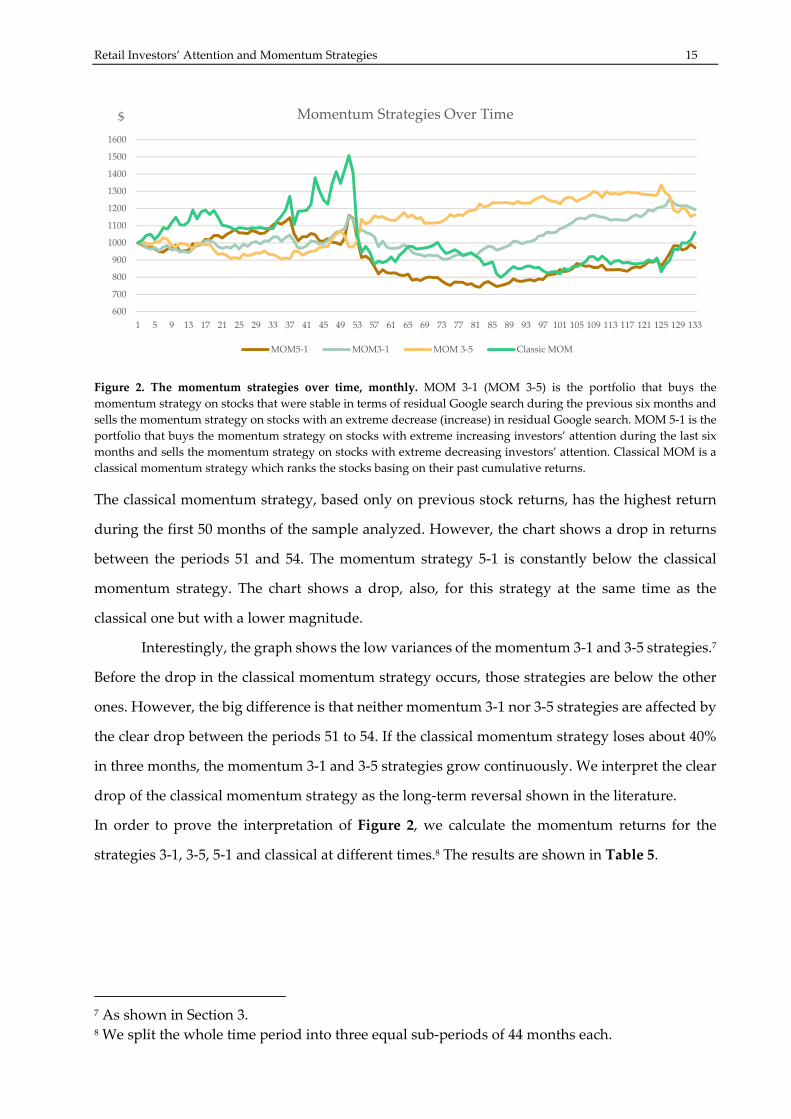
Figure 2. The momentum strategies over time, monthly. MOM 3‐1 (MOM 3‐5) is the portfolio that buys the
momentum strategy on stocks that were stable in terms of residual Google search during the previous six months and
sells the momentum strategy on stocks with an extreme decrease (increase) in residual Google search. MOM 5‐1 is the
portfolio that buys the momentum strategy on stocks with extreme increasing investors’ attention during the last six
months and sells the momentum strategy on stocks with extreme decreasing investors’ attention. Classical MOM is a
classical momentum strategy which ranks the stocks basing on their past cumulative returns.
The classical momentum strategy, based only on previous stock returns, has the highest return
during the first 50 months of the sample analyzed. However, the chart shows a drop in returns
between the periods 51 and 54. The momentum strategy 5‐1 is constantly below the classical
momentum strategy. The chart shows a drop, also, for this strategy at the same time as the
classical one but with a lower magnitude.
Interestingly, the graph shows the low variances of the momentum 3‐1 and 3‐5 strategies.7
Before the drop in the classical momentum strategy occurs, those strategies are below the other
ones. However, the big difference is that neither momentum 3‐1 nor 3‐5 strategies are affected by
the clear drop between the periods 51 to 54. If the classical momentum strategy loses about 40%
in three months, the momentum 3‐1 and 3‐5 strategies grow continuously. We interpret the clear
drop of the classical momentum strategy as the long‐term reversal shown in the literature.
In order to prove the interpretation of Figure 2, we calculate the momentum returns for the
strategies 3‐1, 3‐5, 5‐1 and classical at different times.8 The results are shown in Table 5.
7 As shown in Section 3. 8 We split the whole time period into three equal sub‐periods of 44 months each.
600
700
800
900
1000
1100
1200
1300
1400
1500
1600
1 5 9 13 17 21 25 29 33 37 41 45 49 53 57 61 65 69 73 77 81 85 89 93 97 101 105 109 113 117 121 125 129 133
$ Momentum Strategies Over Time
MOM5‐1 MOM3‐1 MOM 3‐5 Classic MOM
Retail Investors’ Attention and Momentum Strategies 16
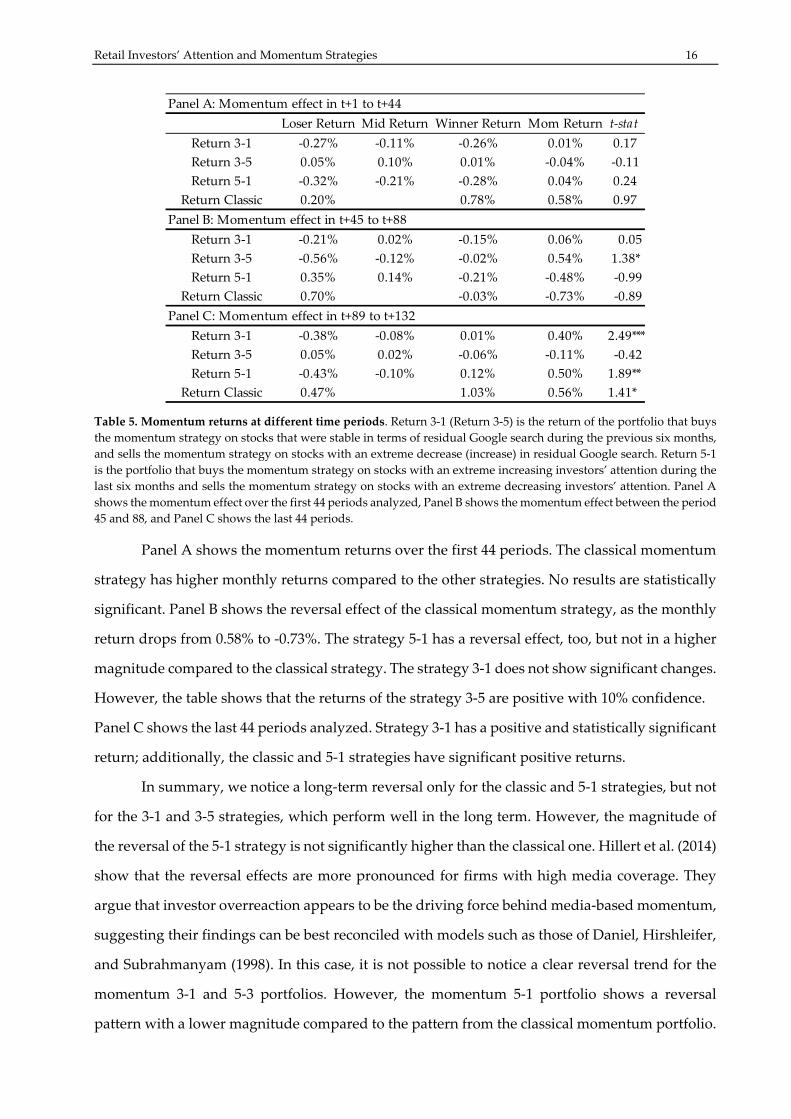
Table 5. Momentum returns at different time periods. Return 3‐1 (Return 3‐5) is the return of the portfolio that buys
the momentum strategy on stocks that were stable in terms of residual Google search during the previous six months,
and sells the momentum strategy on stocks with an extreme decrease (increase) in residual Google search. Return 5‐1
is the portfolio that buys the momentum strategy on stocks with an extreme increasing investors’ attention during the
last six months and sells the momentum strategy on stocks with an extreme decreasing investors’ attention. Panel A
shows the momentum effect over the first 44 periods analyzed, Panel B shows the momentum effect between the period
45 and 88, and Panel C shows the last 44 periods.
Panel A shows the momentum returns over the first 44 periods. The classical momentum
strategy has higher monthly returns compared to the other strategies. No results are statistically
significant. Panel B shows the reversal effect of the classical momentum strategy, as the monthly
return drops from 0.58% to ‐0.73%. The strategy 5‐1 has a reversal effect, too, but not in a higher
magnitude compared to the classical strategy. The strategy 3‐1 does not show significant changes.
However, the table shows that the returns of the strategy 3‐5 are positive with 10% confidence.
Panel C shows the last 44 periods analyzed. Strategy 3‐1 has a positive and statistically significant
return; additionally, the classic and 5‐1 strategies have significant positive returns.
In summary, we notice a long‐term reversal only for the classic and 5‐1 strategies, but not
for the 3‐1 and 3‐5 strategies, which perform well in the long term. However, the magnitude of
the reversal of the 5‐1 strategy is not significantly higher than the classical one. Hillert et al. (2014)
show that the reversal effects are more pronounced for firms with high media coverage. They
argue that investor overreaction appears to be the driving force behind media‐based momentum,
suggesting their findings can be best reconciled with models such as those of Daniel, Hirshleifer,
and Subrahmanyam (1998). In this case, it is not possible to notice a clear reversal trend for the
momentum 3‐1 and 5‐3 portfolios. However, the momentum 5‐1 portfolio shows a reversal
pattern with a lower magnitude compared to the pattern from the classical momentum portfolio.
Panel A: Momentum effect in t+1 to t+44
Loser Return Mid Return Winner Return Mom Return t‐stat
Return 3‐1 ‐0.27% ‐0.11% ‐0.26% 0.01% 0.17
Return 3‐5 0.05% 0.10% 0.01% ‐0.04% ‐0.11
Return 5‐1 ‐0.32% ‐0.21% ‐0.28% 0.04% 0.24
Return Classic 0.20% 0.78% 0.58% 0.97
Panel B: Momentum effect in t+45 to t+88
Return 3‐1 ‐0.21% 0.02% ‐0.15% 0.06% 0.05
Return 3‐5 ‐0.56% ‐0.12% ‐0.02% 0.54% 1.38*
Return 5‐1 0.35% 0.14% ‐0.21% ‐0.48% ‐0.99
Return Classic 0.70% ‐0.03% ‐0.73% ‐0.89
Panel C: Momentum effect in t+89 to t+132
Return 3‐1 ‐0.38% ‐0.08% 0.01% 0.40% 2.49***
Return 3‐5 0.05% 0.02% ‐0.06% ‐0.11% ‐0.42
Return 5‐1 ‐0.43% ‐0.10% 0.12% 0.50% 1.89**
Return Classic 0.47% 1.03% 0.56% 1.41*
Retail Investors’ Attention and Momentum Strategies 17
For that reason, we cannot state that the reversal effects are more pronounced for firms with high
retail investors’ attention. The investors’ overreaction doesn’t appear to be the driving force
behind Google search‐based momentum. For that reason, our results support an underreaction‐
based explanation of momentum.
4.3 Findings
In this section, we analyze the market tone at the end of the formation period by using the
queries suggested by Preis et al. (2013). We notice a negative relationship between the market
tone and the return of the momentum 5‐1 strategy. For that reason, we cannot confirm the result
obtained by Hillert et al. (2014), because, in this case, investor overconfidence doesn’t influence
the magnitude of Google search‐based momentum. Furthermore, we analyze the returns of the
momentum strategies over time. We notice that the magnitude of the long‐term reversal of the
classical momentum strategy is higher than the one of the momentum 5‐1 strategy. This is a
second indicator that shows how investor overreaction doesn’t appear to be the driving force
behind Google‐search based momentum. For that reason, we support the underreaction‐based
explanation of momentum.
However, recall the main assumption of this paper. Following Da et al. (2011), we assume
that the most sophisticated investors are not looking for data on Google but using other
information providers, following Da et al. (2011). For that reason, it is also possible that
sophisticated investors trade on other stocks, leading the investment of retail investors to poor
returns. In order to understand the role of sophisticated investors, it would be crucial to analyze
the information they use to base their investment decisions.
5 Conclusion
Even if the momentum effect is one of the most prominent return anomalies shown in the
empirical evidence, its drivers are far from being understood. In this paper, we study the effect
of Google search growth on the construction of momentum strategies. We analyze the S&P 500
constituents between 2004 and 2015 to produce three relevant results. We assume that the growth
in Google search is a good signal of increasing retail investors’ attention on a stock. Retail
investors are often considered to be uninformed noise traders.
Firstly, we don’t show positive returns by investing in momentum in a portfolio of
increasing minus decreasing residual Google search stocks. This result is consistent with the fact
Retail Investors’ Attention and Momentum Strategies 18
that empirical evidence shows retail investors losing money with their trading decisions.9
However, we notice that the strategy of investing in momentum in a portfolio of firms with stable
residual Google searches and simultaneously selling a momentum strategy constructed using
stocks that had either high growth or a decrease in residual Google searches during the previous
six months has positive but statistically insignificant monthly returns. Those results are
significant in the long term.
Secondly, we conclude that the strategy which invests in momentum in a portfolio of
stocks with high investors’ attention and sells momentum in a portfolio of low investors’ attention
has a statistically significantly lower volatility than a classical momentum strategy. However, it
has higher volatility than the portfolios which invest in momentum in a portfolio of stocks with
stable Google searches. This shows that retail investors’ attention creates volatility, as noted by
Dimpfl and Jank (2015). For that reason, in order to decrease momentum volatility, we suggest
investing in stocks with stable investors’ attention. Thirdly, contrary to the idea that investor
overconfidence should strengthen the momentum effect, we document lower Google search‐
based momentum profits among strategies started when the tone of the market is positive.
Furthermore, we don’t notice a significant increase in the long‐term reversal. For those reasons,
while general investors overreact to information as shown by Hillert et al. (2014), retail investors
underreact to information.
To conclude, we think that three topics should be covered by future research. The analysis
of the internet search growth on channels other than Google may help to better understand the
reactions of professional or sophisticated investors. Transaction costs should be also considered
to understand the real return of momentum strategies. It may also be useful to study an approach
to understand the tone of the internet search, similar to the approach used by Hillert et al. (2014)
for the analysis of newspaper articles.
9 see Grinblatt & Keloharju, 2000

Retail Investors’ Attention and Momentum Strategies 19
6 References
Chui, A., Titman, S., & Wei, K. C. J. (2010). Individualism and Momentum around the World. The Journal
of Finance, 65(1), 361–392. http://doi.org/10.1111/j.1540‐6261.2009.01532.x
Da, Z., Engelberg, J., & Gao, P. (2011). In Search of Attention. The Journal of Finance, 66(5), 1461–1499.
Retrieved from http://www.jstor.org/stable/pdf/41305167.pdf?acceptTC=true
Daniel, K., Hirshleifer, D., & Subrahmanyam, A. (1998). Investor Psychology and Security Market Under‐
and Overreactions. The Journal of Finance, 53(6), 1839–1885. http://doi.org/10.1111/0022‐1082.00077
Daniel, K., & Titman, S. (2006). Market Reactions to Tangible and Intangible Information, 61(4), 1605–
1643. Retrieved from http://www.kentdaniel.net/papers/published/jf_06.pdf
Dimpfl, T., & Jank, S. (2015). Can Internet Search Queries Help to Predict Stock Market Volatility�?
European Financial Management, 9999(9999), 1–22. http://doi.org/10.1111/eufm.12058
Engelberg, J., & Parsons, C. A. (2011). The Causal Impact of Media in Financial Markets. The Journal of
Finance, 66(1), 67–97. Retrieved from http://www.jstor.org/stable/pdf/29789772.pdf
Grinblatt, M., & Keloharju, M. (2000). The investment behavior and performance of various investor
types: a study of Finland ’s unique data set. Journal of Financial Economics, 55(1), 43–67.
http://doi.org/10.1016/S0304‐405X(99)00044‐6
Hillert, A., Jacobs, H., & Sebastian, M. (2014). Media Makes Momentum. Review of Financial Studies, (July).
http://doi.org/10.1093/rfs/hhu061
Jegadeesh, N., & Titman, S. (1993). Returns to Buying Winners and Selling Losers: Implications for Stock
Market Efficiency. The Journal of Finance, 48(1), 65–91. Retrieved from http://www.e‐m‐
h.org/JeTi93.pdf
Latoeiro, P., Ramos, S. B., & Veiga, H. (2013). Predictability of stock market activity using Google search queries
(No. 13‐06). Getafe.
Preis, T., Moat, H. S., & Stanley, H. E. (2013). Quantifying Trading Behavior in Financial Markets Using
Google Trends. Scientific Reports, 3, 1684–1690. http://doi.org/10.1038/srep01684
Rouwenhorst, K. G. (1998). International Momentum Strategies. The Journal of Finance, 53(1), 267–284.
Retrieved from http://www.jstor.org/stable/117441

Retail Investors’ Attention and Momentum Strategies 20
Appendix A.1: S&P 500 constituents
Name RIC Name RIC
Apple Inc AAPL.O Roper Technologies Inc ROP
Alphabet Inc GOOGL.O WEC Energy Group Inc WEC
Alphabet Inc GOOG.O CenturyLink Inc CTL
Microsoft Corp MSFT.O Vornado Realty Trust VNO
Exxon Mobil Corp XOM Amphenol Corp APH
Berkshire Hathaway Inc BRKb Eversource Energy ES
Facebook Inc FB.O International Paper Co IP
Johnson & Johnson JNJ St. Jude Medical Inc STJ
Amazon.com Inc AMZN.O Marriott International Inc MAR.O
General Electric Co GE Royal Caribbean Cruises Ltd RCL
Wells Fargo & Co WFC Willis Towers Watson PLC WLTW.O
AT&T Inc T Ameriprise Financial Inc AMP
JPMorgan Chase & Co JPM Northern Trust Corp NTRS.O
Procter & Gamble Co PG Dr Pepper Snapple Group Inc DPS
Wal Mart Stores Inc WMT Ingersoll‐Rand PLC IR
Verizon Communications Inc VZ Expedia Inc EXPE.O
Pfizer Inc PFE Stanley Black & Decker Inc SWK
Visa Inc V Clorox Co CLX
Coca‐Cola Co KO Newmont Mining Corp NEM
Chevron Corp CVX Nucor Corp NUE
Oracle Corp ORCL.K HCP Inc HCP
Home Depot Inc HD Republic Services Inc RSG
Walt Disney Co DIS Mead Johnson Nutrition Co MJN
Merck & Co Inc MRK DTE Energy Co DTE
Bank of America Corp BAC Tyco International PLC TYC
Philip Morris International Inc PM Freeport‐McMoRan Inc FCX
Intel Corp INTC.O Realty Income Corp O
Comcast Corp CMCSA.O DaVita HealthCare Partners Inc DVA
PepsiCo Inc PEP J M Smucker Co SJM
Cisco Systems Inc CSCO.O SanDisk Corp SNDK.O
International Business Machines Corp IBM Parker‐Hannifin Corp PH
Citigroup Inc C C R Bard Inc BCR
Gilead Sciences Inc GILD.O Rockwell Automation Inc ROK
UnitedHealth Group Inc UNH Noble Energy Inc NBL
Amgen Inc AMGN.O Viacom Inc VIAB.O
Altria Group Inc MO Mohawk Industries Inc MHK
Bristol‐Myers Squibb Co BMY FirstEnergy Corp FE
McDonaldʹs Corp MCD Concho Resources Inc CXO
Schlumberger NV SLB Essex Property Trust Inc ESS
CVS Health Corp CVS Whirlpool Corp WHR
Medtronic PLC MDT Vulcan Materials Co VMC
MasterCard Inc MA Genuine Parts Co GPC
3M Co MMM Dentsply Sirona Inc XRAY.O
Nike Inc NKE Fifth Third Bancorp FITB.O
AbbVie Inc ABBV.K Hershey Co HSY
Kraft Heinz Co KHC.O Williams Companies Inc WMB
United Parcel Service Inc UPS Henry Schein Inc HSIC.O
Allergan plc AGN W W Grainger Inc GWW
Starbucks Corp SBUX.O Equifax Inc EFX
United Technologies Corp UTX Alcoa Inc AA

Retail Investors’ Attention and Momentum Strategies 21
Honeywell International Inc HON Red Hat Inc RHT
Walgreens Boots Alliance Inc WBA.O Skyworks Solutions Inc SWKS.O
Eli Lilly and Co LLY Agilent Technologies Inc A
Boeing Co BA Loews Corp L
Celgene Corp CELG.O Chipotle Mexican Grill Inc CMG
Qualcomm Inc QCOM.O Starwood Hotels & Resorts Worldwide Inc HOT
Accenture PLC ACN Invesco Ltd IVZ
U.S. Bancorp USB Entergy Corp ETR
Union Pacific Corp UNP Autodesk Inc ADSK.O
Reynolds American Inc RAI Fastenal Co FAST.O
Goldman Sachs Group Inc GS Motorola Solutions Inc MSI
Lockheed Martin Corp LMT Verisk Analytics Inc VRSK.O
Loweʹs Companies Inc LOW Lam Research Corp LRCX.O
Mondelez International Inc MDLZ.O Alliance Data Systems Corp ADS
Costco Wholesale Corp COST.O Macys Inc M
Priceline Group Inc PCLN.O Ulta Salon Cosmetics and Fragrance Inc ULTA.O
Danaher Corp DHR American Water Works Company Inc AWK
Abbott Laboratories ABT CA Inc CA.O
American International Group Inc AIG Principal Financial Group Inc PFG
Simon Property Group Inc SPG Universal Health Services Inc UHS
Colgate‐Palmolive Co CL Citrix Systems Inc CTXS.O
American Express Co AXP Rockwell Collins Inc COL
BlackRock Inc BLK Citizens Financial Group Inc CFG
Broadcom Ltd AVGO.O Laboratory Corporation of America Holdings LH
Texas Instruments Inc TXN.O Coca‐Cola Enterprises Inc CCE
Time Warner Inc TWX Tractor Supply Co TSCO.O
ConocoPhillips COP Church & Dwight Co Inc CHD
Dow Chemical Co DOW Newell Brands Inc NWL
Biogen Inc BIIB.O Ametek Inc AME
Thermo Fisher Scientific Inc TMO McCormick & Company Inc MKC
Twenty‐First Century Fox Inc FOXA.O Marathon Oil Corp MRO
Twenty‐First Century Fox Inc FOX.O Xilinx Inc XLNX.O
Occidental Petroleum Corp OXY Symantec Corp SYMC.O
Time Warner Cable Inc TWC Kimco Realty Corp KIM
Chubb Ltd CB Regions Financial Corp RF
E we du Pont de Nemours and Co DD Macerich Co MAC
Ford Motor Co F Advance Auto Parts Inc AAP
Duke Energy Corp DUK D.R. Horton Inc DHI
NextEra Energy Inc NEE Host Hotels & Resorts Inc HST
Morgan Stanley MS Ameren Corp AEE
EMC Corp EMC Discovery Communications Inc DISCA.O
TJX Companies Inc TJX Discovery Communications Inc DISCK.O
Salesforce.com Inc CRM Eastman Chemical Co EMN
Metlife Inc MET KLA‐Tencor Corp KLAC.O
Target Corp TGT Xerox Corp XRX
General Motors Co GM Mattel Inc MAT.O
Kimberly‐Clark Corp KMB Coach Inc COH
PayPal Holdings Inc PYPL.O CMS Energy Corp CMS
Adobe Systems Inc ADBE.O Cabot Oil & Gas Corp COG
Caterpillar Inc CAT Micron Technology Inc MU.O
Express Scripts Holding Co ESRX.O Waters Corp WAT
Southern Co SO Linear Technology Corp LLTC.O
Phillips 66 PSX Extra Space Storage Inc EXR
Public Storage PSA HanesBrands Inc HBI

Retail Investors’ Attention and Momentum Strategies 22
FedEx Corp FDX EQT Corp EQT
American Tower Corp AMT Martin Marietta Materials Inc MLM
PNC Financial Services Group Inc PNC C.H. Robinson Worldwide Inc CHRW.O
Dominion Resources Inc D Masco Corp MAS
EOG Resources Inc EOG Federal Realty Investment Trust FRT
Bank of New York Mellon Corp BK National Oilwell Varco Inc NOV
Kinder Morgan Inc KMI Hasbro Inc HAS.O
General Dynamics Corp GD Cincinnati Financial Corp CINF.O
Regeneron Pharmaceuticals Inc REGN.O Textron Inc TXT
Netflix Inc NFLX.O XL Group PLC XL
Stryker Corp SYK Best Buy Co Inc BBY
Automatic Data Processing Inc ADP.O Ball Corp BLL
Monsanto Co MON Stericycle Inc SRCL.O
McKesson Corp MCK Quest Diagnostics Inc DGX
Aetna Inc AET Hologic Inc HOLX.O
Capital One Financial Corp COF Carmax Inc KMX
LyondellBasell Industries NV LYB Dover Corp DOV
Charles Schwab Corp SCHW.K Nasdaq Inc NDAQ.O
Anthem Inc ANTM.K Kansas City Southern KSU
Carnival Corp CCL Cimarex Energy Co XEC
Raytheon Co RTN Lincoln National Corp LNC
Illinois Tool Works Inc ITW Airgas Inc ARG
General Mills Inc GIS CBRE Group Inc CBG
Cognizant Technology Solutions Corp CTSH.O SL Green Realty Corp SLG
Northrop Grumman Corp NOC Columbia Pipeline Group Inc CPGX.K
Cigna Corp CI Pentair plc PNR
Delta Air Lines Inc DAL Sealed Air Corp SEE
Yahoo! Inc YHOO.O Wynn Resorts Ltd WYNN.O
Estee Lauder Companies Inc EL Microchip Technology Inc MCHP.O
The Kroger Co KR Western Digital Corp WDC.O
Emerson Electric Co EMR KeyCorp KEY
Alexion Pharmaceuticals Inc ALXN.O WestRock Co WRK
Prudential Financial Inc PRU J B Hunt Transport Services Inc JBHT.O
Halliburton Co HAL Tesoro Corp TSO
Praxair Inc PX Western Union Co WU
Ecolab Inc ECL Mosaic Co MOS
Travelers Companies Inc TRV Whole Foods Market Inc WFM.O
Becton Dickinson and Co BDX Lennar Corp LEN
Yum! Brands Inc YUM Harris Corp HRS
Marsh & McLennan Companies Inc MMC Verisign Inc VRSN.O
Air Products and Chemicals Inc APD SCANA Corp SCG
HCA Holdings Inc HCA Cintas Corp CTAS.O
CME Group Inc CME.O L‐3 Communications Holdings Inc LLL
American Electric Power Company Inc AEP Gap Inc GPS
Exelon Corp EXC UDR Inc UDR
Constellation Brands Inc STZ International Flavors & Fragrances Inc IFF
PPG Industries Inc PPG Under Armour Inc UA
Southwest Airlines Co LUV Under Armour Inc UAc
Hewlett Packard Enterprise Co HPE Affiliated Managers Group Inc AMG
Crown Castle International Corp CCI Total System Services Inc TSS
PG&E Corp PCG Interpublic Group of Companies Inc IPG
Intercontinental Exchange Inc ICE Snap‐On Inc SNA
Cardinal Health Inc CAH TripAdvisor Inc TRIP.O
BB&T Corp BBT Michael Kors Holdings Ltd KORS.K
Retail Investors’ Attention and Momentum Strategies 23
Aflac Inc AFL Cablevision Systems Corp CVC
Eaton Corporation PLC ETN Nordstrom Inc JWN
Valero Energy Corp VLO Tiffany & Co TIF
Aon PLC AON Akamai Technologies Inc AKAM.O
eBay Inc EBAY.O Expeditors International of Washington Inc EXPD.O
Baxalta Inc BXLT.K Juniper Networks Inc JNPR.K
Sherwin‐Williams Co SHW Garmin Ltd GRMN.O
McGraw Hill Financial Inc MHFI.K CenterPoint Energy Inc CNP
VF Corp VFC Signet Jewelers Ltd SIG
Kellogg Co K Wyndham Worldwide Corp WYN
Intuit Inc INTU.O Goodyear Tire & Rubber Co GT.O
Boston Scientific Corp BSX Harley‐Davidson Inc HOG
Deere & Co DE Kohls Corp KSS
OʹReilly Automotive Inc ORLY.O BorgWarner Inc BWA
Sysco Corp SYY Foot Locker Inc FL
Anadarko Petroleum Corp APC Huntington Bancshares Inc HBAN.O
Humana Inc HUM Varian Medical Systems Inc VAR
Activision Blizzard Inc ATVI.O Scripps Networks Interactive Inc SNI.O
Johnson Controls Inc JCI CF Industries Holdings Inc CF
Monster Beverage Corp MNST.O Pinnacle West Capital Corp PNW
Equity Residential EQR Unum Group UNM
Synchrony Financial SYF Darden Restaurants Inc DRI
Sempra Energy SRE Ralph Lauren Corp RL
General Growth Properties Inc GGP Bed Bath & Beyond Inc BBBY.O
CSX Corp CSX.O AGL Resources Inc GAS
Pioneer Natural Resources Co PXD PVH Corp PVH
Waste Management Inc WM Seagate Technology PLC STX.O
CBS Corp CBS Xylem Inc XYL
Allstate Corp ALL AES Corp AES
PPL Corp PPL Iron Mountain Inc IRM
American Airlines Group Inc AAL.O Comerica Inc CMA
Norfolk Southern Corp NSC NiSource Inc NI
State Street Corp STT Fluor Corp FLR
AvalonBay Communities Inc AVB News Corp NWSA.O
Welltower Inc HCN News Corp NWS.O
Intuitive Surgical Inc ISRG.O ONEOK Inc OKE
Weyerhaeuser Co WY Newfield Exploration Co NFX
Franklin Resources Inc BEN Centene Corp CNC
Zoetis Inc ZTS Staples Inc SPLS.O
Applied Materials Inc AMAT.O E*TRADE Financial Corp ETFC.O
Baxter International Inc BAX NetApp Inc NTAP.O
Dollar General Corp DG ADT Corp ADT
Prologis Inc PLD Mallinckrodt Plc MNK
Discover Financial Services DFS Torchmark Corp TMK
Mylan NV MYL.O Helmerich and Payne Inc HP
Public Service Enterprise Group Inc PEG F5 Networks Inc FFIV.O
Autozone Inc AZO FMC Technologies Inc FTI
Tyson Foods Inc TSN PulteGroup Inc PHM
Corning Inc GLW Frontier Communications Corp FTR.O
Ross Stores Inc ROST.O TECO Energy Inc TE
Edwards Lifesciences Corp EW Avery Dennison Corp AVY
Zimmer Biomet Holdings Inc ZBH Range Resources Corp RRC
Archer Daniels Midland Co ADM Leggett & Platt Inc LEG
TE Connectivity Ltd TEL Endo International PLC ENDP.O

Retail Investors’ Attention and Momentum Strategies 24
Edison International EIX First Solar Inc FSLR.O
Equinix Inc EQIX.O Qorvo Inc QRVO.O
L Brands Inc LB Apartment Investment and Management Co AIV
Fiserv Inc FISV.O Leucadia National Corp LUK
HP Inc HPQ Allegion PLC ALLE.K
Fidelity National Information Services Inc FIS Harman International Industries Inc HAR
Consolidated Edison Inc ED Flowserve Corp FLS
Spectra Energy Corp SE Robert Half International Inc RHI
Delphi Automotive PLC DLPH.K FMC Corp FMC
United Continental Holdings Inc UAL PerkinElmer Inc PKI
Ventas Inc VTR Zions Bancorporation ZION.O
Marathon Petroleum Corp MPC United Rentals Inc URI
Molson Coors Brewing Co TAP Murphy Oil Corp MUR
Vertex Pharmaceuticals Inc VRTX.O H & R Block Inc HRB
AmerisourceBergen Corp ABC Jacobs Engineering Group Inc JEC
Apache Corp APA Tegna Inc TGNA.K
Baker Hughes Inc BHI Assurant Inc AIZ
Illumina Inc ILMN.O Peopleʹs United Financial Inc PBCT.O
Hormel Foods Corp HRL AutoNation Inc AN
Electronic Arts Inc EA.O FLIR Systems Inc FLIR.O
Xcel Energy Inc XEL Patterson Companies Inc PDCO.O
Brown‐Forman Corp BFb NRG Energy Inc NRG
SunTrust Banks Inc STI Navient Corp NAVI.O
Omnicom Group Inc OMC Chesapeake Energy Corp CHK
Cummins Inc CMI CSRA Inc CSRA.K
NVIDIA Corp NVDA.O Southwestern Energy Co SWN
Cerner Corp CERN.O Pitney Bowes Inc PBI
PACCAR Inc PCAR.O Dun & Bradstreet Corp DNB
ConAgra Foods Inc CAG Transocean Ltd RIG
Boston Properties Inc BXP Legg Mason Inc LM
Moodyʹs Corp MCO Quanta Services Inc PWR
Progressive Corp PGR Urban Outfitters Inc URBN.O
T. Rowe Price Group Inc TROW.O Ryder System Inc R
Hess Corp HES GameStop Corp GME
Level 3 Communications Inc LVLT.K Teradata Corp TDC
Dollar Tree Inc DLTR.O Diamond Offshore Drilling Inc DO
Paychex Inc PAYX.O Owens‐Illinois Inc OI
M&T Bank Corp MTB Devon Energy Corp DVN
Nielsen Holdings PLC NLSN.K
Campbell Soup Co CPB
Hartford Financial Services Group Inc HIG
Perrigo Company PLC PRGO.K
Analog Devices Inc ADI.O

Retail Investors’ Attention and Momentum Strategies 25
Appendix A.2: R code for downloading data from Google Trends
#GOOGLE TRENDS CONNECTION
library(gtrendsR)
library(foreign)
usr <‐ ʺ[email protected]ʺ
psw <‐ ʺPasswordʺ
gconnect(usr, psw)
#GOOGLE TRENDS DATA
#Vector with all tickers of the S&P500
tickers<‐c(ʺAAPLʺ, ʺMSFTʺ, ʺXOMʺ, ʺBRK.Bʺ, ʺJNJʺ, ʺAMZNʺ, ʺGEʺ, ʺWFCʺ, ʺTʺ, ʺJPMʺ, ʺPGʺ, ʺWMTʺ,
ʺVZʺ, ʺPFEʺ, ʺKOʺ, ʺCVXʺ, ʺORCLʺ, ʺHDʺ, ʺDISʺ, ʺMRKʺ, ʺBACʺ, ʺINTCʺ, ʺCMCSAʺ, ʺPEPʺ,
ʺCSCOʺ, ʺIBMʺ, ʺCʺ, ʺGILDʺ, ʺUNHʺ, ʺAMGNʺ, ʺMOʺ, ʺBMYʺ, ʺMCDʺ, ʺSLBʺ, ʺCVSʺ, ʺMDTʺ,
ʺMMMʺ, ʺNKEʺ, ʺUPSʺ, ʺAGNʺ, ʺSBUXʺ, ʺUTXʺ, ʺHONʺ, ʺWBAʺ, ʺLLYʺ, ʺBAʺ, ʺCELGʺ, ʺQCOMʺ,
ʺACNʺ, ʺUSBʺ, ʺUNPʺ, ʺRAIʺ, ʺGSʺ, ʺLMTʺ, ʺLOWʺ, ʺMDLZʺ, ʺCOSTʺ, ʺPCLNʺ, ʺDHRʺ, ʺABTʺ,
ʺAIGʺ, ʺSPGʺ, ʺCLʺ, ʺAXPʺ, ʺBLKʺ, ʺTXNʺ, ʺTWXʺ, ʺCOPʺ, ʺDOWʺ, ʺBIIBʺ, ʺTMOʺ, ʺFOXAʺ,
ʺFOXʺ, ʺOXYʺ, ʺCBʺ, ʺDDʺ, ʺFʺ, ʺDUKʺ, ʺNEEʺ, ʺMSʺ, ʺEMCʺ, ʺTJXʺ, ʺMETʺ, ʺTGTʺ,
ʺKMBʺ, ʺADBEʺ, ʺCATʺ, ʺESRXʺ, ʺSOʺ, ʺPSAʺ, ʺFDXʺ, ʺAMTʺ, ʺPNCʺ, ʺDʺ, ʺEOGʺ, ʺBKʺ,
ʺGDʺ, ʺREGNʺ, ʺNFLXʺ, ʺSYKʺ, ʺADPʺ, ʺMONʺ, ʺMCKʺ, ʺAETʺ, ʺCOFʺ, ʺSCHWʺ, ʺANTMʺ, ʺCCLʺ,
ʺRTNʺ, ʺITWʺ, ʺGISʺ, ʺCTSHʺ, ʺNOCʺ, ʺCIʺ, ʺYHOOʺ, ʺELʺ, ʺKRʺ, ʺEMRʺ, ʺALXNʺ, ʺPRUʺ,
ʺHALʺ, ʺPXʺ, ʺECLʺ, ʺTRVʺ, ʺBDXʺ, ʺYUMʺ, ʺMMCʺ, ʺAPDʺ, ʺCMEʺ, ʺAEPʺ, ʺEXCʺ, ʺSTZʺ,
ʺPPGʺ, ʺLUVʺ, ʺCCIʺ, ʺPCGʺ, ʺCAHʺ, ʺBBTʺ, ʺAFLʺ, ʺETNʺ, ʺVLOʺ, ʺAONʺ, ʺEBAYʺ, ʺSHWʺ,
ʺMHFIʺ, ʺVFCʺ, ʺKʺ, ʺINTUʺ, ʺBSXʺ, ʺDEʺ, ʺORLYʺ, ʺSYYʺ, ʺAPCʺ, ʺHUMʺ, ʺATVIʺ, ʺJCIʺ,
ʺMNSTʺ, ʺEQRʺ, ʺSREʺ, ʺGGPʺ, ʺCSXʺ, ʺPXDʺ, ʺWMʺ, ʺCBSʺ, ʺALLʺ, ʺPPLʺ, ʺNSCʺ, ʺSTTʺ,
ʺAVBʺ, ʺHCNʺ, ʺISRGʺ, ʺWYʺ, ʺBENʺ, ʺAMATʺ, ʺBAXʺ, ʺPLDʺ, ʺMYLʺ, ʺPEGʺ, ʺAZOʺ, ʺTSNʺ,
ʺGLWʺ, ʺROSTʺ, ʺEWʺ, ʺZBHʺ, ʺADMʺ, ʺEIXʺ, ʺEQIXʺ, ʺLBʺ, ʺFISVʺ, ʺHPQʺ, ʺFISʺ, ʺEDʺ,
ʺVTRʺ, ʺTAPʺ, ʺVRTXʺ, ʺABCʺ, ʺAPAʺ, ʺBHIʺ, ʺILMNʺ, ʺHRLʺ, ʺEAʺ, ʺXELʺ, ʺBF.Bʺ, ʺSTIʺ,
ʺOMCʺ, ʺCMIʺ, ʺNVDAʺ, ʺCERNʺ, ʺPCARʺ, ʺCAGʺ, ʺBXPʺ, ʺMCOʺ, ʺPGRʺ, ʺTROWʺ, ʺHESʺ, ʺLVLTʺ,
ʺDLTRʺ, ʺPAYXʺ, ʺMTBʺ, ʺCPBʺ, ʺHIGʺ, ʺPRGOʺ, ʺADIʺ, ʺDVNʺ, ʺROPʺ, ʺWECʺ, ʺCTLʺ, ʺVNOʺ,
ʺAPHʺ, ʺESʺ, ʺIPʺ, ʺSTJʺ, ʺMARʺ, ʺRCLʺ, ʺWLTWʺ, ʺNTRSʺ, ʺIRʺ, ʺSWKʺ, ʺCLXʺ, ʺNEMʺ,
ʺNUEʺ, ʺHCPʺ, ʺRSGʺ, ʺDTEʺ, ʺTYCʺ, ʺFCXʺ, ʺOʺ, ʺDVAʺ, ʺSJMʺ, ʺSNDKʺ, ʺPHʺ, ʺBCRʺ,
ʺROKʺ, ʺNBLʺ, ʺMHKʺ, ʺFEʺ, ʺESSʺ, ʺWHRʺ, ʺVMCʺ, ʺGPCʺ, ʺXRAYʺ, ʺFITBʺ, ʺHSYʺ, ʺWMBʺ,
ʺHSICʺ, ʺGWWʺ, ʺEFXʺ, ʺAAʺ, ʺRHTʺ, ʺSWKSʺ, ʺAʺ, ʺLʺ, ʺHOTʺ, ʺIVZʺ, ʺETRʺ, ʺADSKʺ,
ʺFASTʺ, ʺMSIʺ, ʺLRCXʺ, ʺADSʺ, ʺMʺ, ʺCAʺ, ʺPFGʺ, ʺUHSʺ, ʺCTXSʺ, ʺCOLʺ, ʺLHʺ, ʺCCEʺ,
ʺTSCOʺ, ʺCHDʺ, ʺNWLʺ, ʺAMEʺ, ʺMKCʺ, ʺMROʺ, ʺXLNXʺ, ʺSYMCʺ, ʺKIMʺ, ʺRFʺ, ʺMACʺ, ʺAAPʺ,
ʺDHIʺ, ʺHSTʺ, ʺAEEʺ, ʺEMNʺ, ʺKLACʺ, ʺXRXʺ, ʺMATʺ, ʺCOHʺ, ʺCMSʺ, ʺCOGʺ, ʺMUʺ, ʺWATʺ,
ʺLLTCʺ, ʺEQTʺ, ʺMLMʺ, ʺCHRWʺ, ʺMASʺ, ʺFRTʺ, ʺNOVʺ, ʺHASʺ, ʺCINFʺ, ʺTXTʺ, ʺXLʺ, ʺBBYʺ,
ʺBLLʺ, ʺSRCLʺ, ʺDGXʺ, ʺHOLXʺ, ʺKMXʺ, ʺDOVʺ, ʺNDAQʺ, ʺKSUʺ, ʺXECʺ, ʺLNCʺ, ʺARGʺ, ʺSLGʺ,
ʺPNRʺ, ʺSEEʺ, ʺWYNNʺ, ʺMCHPʺ, ʺWDCʺ, ʺKEYʺ, ʺJBHTʺ, ʺTSOʺ, ʺWFMʺ, ʺLENʺ, ʺHRSʺ, ʺVRSNʺ,
ʺSCGʺ, ʺCTASʺ, ʺLLLʺ, ʺGPSʺ, ʺUDRʺ, ʺIFFʺ, ʺAMGʺ, ʺTSSʺ, ʺIPGʺ, ʺSNAʺ, ʺCVCʺ, ʺJWNʺ,
ʺTIFʺ, ʺAKAMʺ, ʺEXPDʺ, ʺJNPRʺ, ʺGRMNʺ, ʺCNPʺ, ʺSIGʺ, ʺGTʺ, ʺHOGʺ, ʺKSSʺ, ʺBWAʺ, ʺFLʺ,
ʺHBANʺ, ʺVARʺ, ʺPNWʺ, ʺUNMʺ, ʺDRIʺ, ʺRLʺ, ʺBBBYʺ, ʺGASʺ, ʺPVHʺ, ʺSTXʺ, ʺAESʺ, ʺIRMʺ,
ʺCMAʺ, ʺNIʺ, ʺFLRʺ, ʺOKEʺ, ʺNFXʺ, ʺCNCʺ, ʺSPLSʺ, ʺETFCʺ, ʺNTAPʺ, ʺTMKʺ, ʺHPʺ, ʺFFIVʺ,
ʺFTIʺ, ʺPHMʺ, ʺFTRʺ, ʺTEʺ, ʺAVYʺ, ʺRRCʺ, ʺLEGʺ, ʺENDPʺ, ʺQRVOʺ, ʺAIVʺ, ʺLUKʺ, ʺHARʺ,
ʺFLSʺ, ʺRHIʺ, ʺFMCʺ, ʺPKIʺ, ʺZIONʺ, ʺURIʺ, ʺMURʺ, ʺHRBʺ, ʺJECʺ, ʺTGNAʺ, ʺPBCTʺ, ʺANʺ,
ʺFLIRʺ, ʺPDCOʺ, ʺNRGʺ, ʺCHKʺ, ʺSWNʺ, ʺPBIʺ, ʺDNBʺ, ʺRIGʺ, ʺLMʺ, ʺPWRʺ, ʺURBNʺ, ʺRʺ,
ʺGMEʺ, ʺDOʺ, ʺOIʺ)
data<‐matrix(0,642,length(tickers))
for (j in 1:length(tickers)) {
stock <‐ gtrends(tickers[j],geo=c(ʺUSʺ))$trend[3]
data[,j]<‐stock[,1]
}
library(xlsx)
write.xlsx(data, ʺgoogle.xlsx”) #export data to excel

Retail Investors’ Attention and Momentum Strategies 26
Appendix A.3: R code for the construction of the momentum portfolios
#LOAD DATA
library(XLConnect)
library(xlsx)
stock_r<‐ read.xlsx(ʺ2016_RS_Data_R.xlsxʺ,
sheetIndex = 1,
startRow=1)
google_r<‐ read.xlsx(ʺ2016_RS_Data_R.xlsxʺ,
sheetIndex = 2)
n<‐dim(stock_r)[1]
tickers <‐c(ʺAAPLʺ, ʺMSFTʺ, ʺXOMʺ, ʺJNJʺ, ʺAMZNʺ, ʺGEʺ, ʺWFCʺ, ʺTʺ, ʺJPMʺ, ʺPGʺ, ʺWMTʺ, ʺVZʺ,
ʺPFEʺ, ʺKOʺ, ʺCVXʺ, ʺORCLʺ, ʺHDʺ, ʺDISʺ, ʺMRKʺ, ʺBACʺ, ʺINTCʺ, ʺCMCSAʺ, ʺPEPʺ, ʺCSCOʺ,
ʺIBMʺ, ʺCʺ, ʺGILDʺ, ʺUNHʺ, ʺAMGNʺ, ʺMOʺ, ʺBMYʺ, ʺMCDʺ, ʺSLBʺ, ʺCVSʺ, ʺMDTʺ, ʺMMMʺ,
ʺNKEʺ, ʺUPSʺ, ʺAGNʺ, ʺSBUXʺ, ʺUTXʺ, ʺHONʺ, ʺWBAʺ, ʺLLYʺ, ʺBAʺ, ʺCELGʺ, ʺQCOMʺ, ʺACNʺ,
ʺUSBʺ, ʺUNPʺ, ʺRAIʺ, ʺGSʺ, ʺLMTʺ, ʺLOWʺ, ʺCOSTʺ, ʺPCLNʺ, ʺDHRʺ, ʺABTʺ, ʺAIGʺ, ʺSPGʺ,
ʺCLʺ, ʺAXPʺ, ʺBLKʺ, ʺTXNʺ, ʺTWXʺ, ʺCOPʺ, ʺDOWʺ, ʺBIIBʺ, ʺTMOʺ, ʺFOXʺ, ʺOXYʺ, ʺCBʺ,
ʺDDʺ, ʺFʺ, ʺDUKʺ, ʺNEEʺ, ʺMSʺ, ʺEMCʺ, ʺTJXʺ, ʺMETʺ, ʺTGTʺ, ʺKMBʺ, ʺADBEʺ, ʺCATʺ,
ʺSOʺ, ʺPSAʺ, ʺFDXʺ, ʺAMTʺ, ʺPNCʺ, ʺDʺ, ʺEOGʺ, ʺBKʺ, ʺGDʺ, ʺNFLXʺ, ʺSYKʺ, ʺADPʺ,
ʺMONʺ, ʺMCKʺ, ʺAETʺ, ʺCOFʺ, ʺSCHWʺ, ʺANTMʺ, ʺCCLʺ, ʺRTNʺ, ʺITWʺ, ʺGISʺ, ʺCTSHʺ, ʺNOCʺ,
ʺCIʺ, ʺYHOOʺ, ʺELʺ, ʺKRʺ, ʺEMRʺ, ʺPRUʺ, ʺHALʺ, ʺPXʺ, ʺECLʺ, ʺTRVʺ, ʺBDXʺ, ʺYUMʺ,
ʺMMCʺ, ʺAPDʺ, ʺCMEʺ, ʺAEPʺ, ʺEXCʺ, ʺSTZʺ, ʺPPGʺ, ʺLUVʺ, ʺCCIʺ, ʺPCGʺ, ʺCAHʺ, ʺBBTʺ,
ʺAFLʺ, ʺETNʺ, ʺVLOʺ, ʺAONʺ, ʺEBAYʺ, ʺSHWʺ, ʺVFCʺ, ʺKʺ, ʺINTUʺ, ʺBSXʺ, ʺDEʺ, ʺORLYʺ,
ʺSYYʺ, ʺAPCʺ, ʺHUMʺ, ʺATVIʺ, ʺJCIʺ, ʺMNSTʺ, ʺEQRʺ, ʺSREʺ, ʺGGPʺ, ʺCSXʺ, ʺPXDʺ, ʺWMʺ,
ʺCBSʺ, ʺALLʺ, ʺPPLʺ, ʺNSCʺ, ʺSTTʺ, ʺAVBʺ, ʺHCNʺ, ʺWYʺ, ʺBENʺ, ʺAMATʺ, ʺBAXʺ, ʺPLDʺ,
ʺMYLʺ, ʺPEGʺ, ʺAZOʺ, ʺTSNʺ, ʺGLWʺ, ʺROSTʺ, ʺEWʺ, ʺADMʺ, ʺEQIXʺ, ʺLBʺ, ʺHPQʺ, ʺFISʺ,
ʺEDʺ, ʺVTRʺ, ʺTAPʺ, ʺVRTXʺ, ʺABCʺ, ʺAPAʺ, ʺBHIʺ, ʺHRLʺ, ʺEAʺ, ʺXELʺ, ʺSTIʺ, ʺOMCʺ,
ʺCMIʺ, ʺNVDAʺ, ʺCERNʺ, ʺPCARʺ, ʺCAGʺ, ʺBXPʺ, ʺMCOʺ, ʺPGRʺ, ʺTROWʺ, ʺHESʺ, ʺLVLTʺ, ʺPAYXʺ,
ʺMTBʺ, ʺCPBʺ, ʺHIGʺ, ʺADIʺ, ʺDVNʺ, ʺROPʺ, ʺWECʺ, ʺCTLʺ, ʺVNOʺ, ʺAPHʺ, ʺESʺ, ʺIPʺ,
ʺSTJʺ, ʺMARʺ, ʺRCLʺ, ʺWLTWʺ, ʺNTRSʺ, ʺIRʺ, ʺSWKʺ, ʺCLXʺ, ʺNEMʺ, ʺNUEʺ, ʺHCPʺ, ʺRSGʺ,
ʺDTEʺ, ʺTYCʺ, ʺFCXʺ, ʺOʺ, ʺDVAʺ, ʺSJMʺ, ʺSNDKʺ, ʺPHʺ, ʺBCRʺ, ʺROKʺ, ʺNBLʺ, ʺFEʺ,
ʺESSʺ, ʺWHRʺ, ʺVMCʺ, ʺGPCʺ, ʺXRAYʺ, ʺFITBʺ, ʺHSYʺ, ʺWMBʺ, ʺGWWʺ, ʺEFXʺ, ʺAAʺ, ʺRHTʺ,
ʺAʺ, ʺLʺ, ʺHOTʺ, ʺETRʺ, ʺADSKʺ, ʺFASTʺ, ʺMSIʺ, ʺADSʺ, ʺMʺ, ʺCAʺ, ʺPFGʺ, ʺUHSʺ,
ʺCTXSʺ, ʺCOLʺ, ʺLHʺ, ʺCCEʺ, ʺTSCOʺ, ʺCHDʺ, ʺNWLʺ, ʺAMEʺ, ʺMKCʺ, ʺMROʺ, ʺXLNXʺ, ʺSYMCʺ,
ʺKIMʺ, ʺRFʺ, ʺMACʺ, ʺAAPʺ, ʺDHIʺ, ʺHSTʺ, ʺAEEʺ, ʺEMNʺ, ʺKLACʺ, ʺXRXʺ, ʺMATʺ, ʺCOHʺ,
ʺCMSʺ, ʺCOGʺ, ʺMUʺ, ʺWATʺ, ʺLLTCʺ, ʺEQTʺ, ʺMLMʺ, ʺCHRWʺ, ʺMASʺ, ʺFRTʺ, ʺNOVʺ, ʺHASʺ,
ʺTXTʺ, ʺXLʺ, ʺBBYʺ, ʺBLLʺ, ʺDGXʺ, ʺKMXʺ, ʺDOVʺ, ʺKSUʺ, ʺLNCʺ, ʺARGʺ, ʺSLGʺ, ʺPNRʺ,
ʺSEEʺ, ʺWYNNʺ, ʺMCHPʺ, ʺWDCʺ, ʺKEYʺ, ʺTSOʺ, ʺWFMʺ, ʺLENʺ, ʺHRSʺ, ʺVRSNʺ, ʺSCGʺ, ʺCTASʺ,
ʺLLLʺ, ʺGPSʺ, ʺUDRʺ, ʺIFFʺ, ʺAMGʺ, ʺTSSʺ, ʺIPGʺ, ʺSNAʺ, ʺCVCʺ, ʺJWNʺ, ʺTIFʺ, ʺAKAMʺ,
ʺJNPRʺ, ʺGRMNʺ, ʺCNPʺ, ʺSIGʺ, ʺGTʺ, ʺHOGʺ, ʺKSSʺ, ʺBWAʺ, ʺFLʺ, ʺVARʺ, ʺPNWʺ, ʺUNMʺ,
ʺDRIʺ, ʺRLʺ, ʺBBBYʺ, ʺGASʺ, ʺPVHʺ, ʺSTXʺ, ʺAESʺ, ʺIRMʺ, ʺCMAʺ, ʺNIʺ, ʺFLRʺ, ʺOKEʺ,
ʺNFXʺ, ʺCNCʺ, ʺNTAPʺ, ʺTMKʺ, ʺHPʺ, ʺFFIVʺ, ʺFTIʺ, ʺPHMʺ, ʺFTRʺ, ʺTEʺ, ʺAVYʺ, ʺRRCʺ,
ʺLEGʺ, ʺAIVʺ, ʺLUKʺ, ʺHARʺ, ʺFLSʺ, ʺRHIʺ, ʺFMCʺ, ʺPKIʺ, ʺZIONʺ, ʺURIʺ, ʺMURʺ, ʺHRBʺ,
ʺJECʺ, ʺANʺ, ʺFLIRʺ, ʺNRGʺ, ʺCHKʺ, ʺSWNʺ, ʺPBIʺ, ʺDNBʺ, ʺRIGʺ, ʺLMʺ, ʺPWRʺ, ʺURBNʺ,
ʺRʺ, ʺGMEʺ, ʺDOʺ, ʺOIʺ)
colnames(stock_r)<‐tickers
colnames(google_r) <‐tickers
lag<‐6
past_returns_stock<‐matrix(0,144,400)
past_returns_google<‐matrix(0,144,400)
colnames(past_returns_stock) <‐tickers
colnames(past_returns_google) <‐tickers
winners_stock<‐matrix(0,n,6)
loosers_stock<‐matrix(0,n,6)
google_returns_1<‐matrix(0,n,18)
colnames(google_returns_1)<‐
c(ʺW1ʺ,ʺW2ʺ,ʺW3ʺ,ʺW4ʺ,ʺW5ʺ,ʺW6ʺ,ʺM1ʺ,ʺM2ʺ,ʺM3ʺ,ʺM4ʺ,ʺM5ʺ,ʺM6ʺ,ʺL1ʺ,ʺL2ʺ,ʺL3ʺ,ʺL4ʺ,ʺL5ʺ,ʺL6ʺ)
google_returns_2<‐matrix(0,n,18)
colnames(google_returns_2)<‐
c(ʺW1ʺ,ʺW2ʺ,ʺW3ʺ,ʺW4ʺ,ʺW5ʺ,ʺW6ʺ,ʺM1ʺ,ʺM2ʺ,ʺM3ʺ,ʺM4ʺ,ʺM5ʺ,ʺM6ʺ,ʺL1ʺ,ʺL2ʺ,ʺL3ʺ,ʺL4ʺ,ʺL5ʺ,ʺL6ʺ)
google_returns_3<‐matrix(0,n,18)
colnames(google_returns_3)<‐
c(ʺW1ʺ,ʺW2ʺ,ʺW3ʺ,ʺW4ʺ,ʺW5ʺ,ʺW6ʺ,ʺM1ʺ,ʺM2ʺ,ʺM3ʺ,ʺM4ʺ,ʺM5ʺ,ʺM6ʺ,ʺL1ʺ,ʺL2ʺ,ʺL3ʺ,ʺL4ʺ,ʺL5ʺ,ʺL6ʺ)
google_returns_4<‐matrix(0,n,18)

Retail Investors’ Attention and Momentum Strategies 27
colnames(google_returns_4)<‐
c(ʺW1ʺ,ʺW2ʺ,ʺW3ʺ,ʺW4ʺ,ʺW5ʺ,ʺW6ʺ,ʺM1ʺ,ʺM2ʺ,ʺM3ʺ,ʺM4ʺ,ʺM5ʺ,ʺM6ʺ,ʺL1ʺ,ʺL2ʺ,ʺL3ʺ,ʺL4ʺ,ʺL5ʺ,ʺL6ʺ)
google_returns_5<‐matrix(0,n,18)
colnames(google_returns_5)<‐
c(ʺW1ʺ,ʺW2ʺ,ʺW3ʺ,ʺW4ʺ,ʺW5ʺ,ʺW6ʺ,ʺM1ʺ,ʺM2ʺ,ʺM3ʺ,ʺM4ʺ,ʺM5ʺ,ʺM6ʺ,ʺL1ʺ,ʺL2ʺ,ʺL3ʺ,ʺL4ʺ,ʺL5ʺ,ʺL6ʺ)
for(k in 1:400) {
for(j in 1:n) {
past_returns_stock[j,k]<‐sum(stock_r[j:(j+lag‐1),k])
past_returns_google[j,k]<‐sum(google_r[j:(j+lag‐1),k])
}
}
for(i in 1:138) {
#1) Momentum without considering google
w_names<‐names(sort(past_returns_stock[i,], decreasing = TRUE, na.last = NA))
l_names<‐names(sort(past_returns_stock[i,], decreasing = FALSE, na.last = NA))
winners_stock[i,1]<‐sum(1/80*(stock_r[i+lag,w_names[1:80]]))
winners_stock[i,2]<‐sum(1/80*(stock_r[i+lag+1,w_names[1:80]]))
winners_stock[i,3]<‐sum(1/80*(stock_r[i+lag+2,w_names[1:80]]))
winners_stock[i,4]<‐sum(1/80*(stock_r[i+lag+3,w_names[1:80]]))
winners_stock[i,5]<‐sum(1/80*(stock_r[i+lag+4,w_names[1:80]]))
winners_stock[i,6]<‐sum(1/80*(stock_r[i+lag+5,w_names[1:80]]))
loosers_stock[i,1]<‐sum(1/80*(stock_r[i+lag,l_names[1:80]]))
loosers_stock[i,2]<‐sum(1/80*(stock_r[i+lag+1,l_names[1:80]]))
loosers_stock[i,3]<‐sum(1/80*(stock_r[i+lag+2,l_names[1:80]]))
loosers_stock[i,4]<‐sum(1/80*(stock_r[i+lag+3,l_names[1:80]]))
loosers_stock[i,5]<‐sum(1/80*(stock_r[i+lag+4,l_names[1:80]]))
loosers_stock[i,6]<‐sum(1/80*(stock_r[i+lag+5,l_names[1:80]]))
#2) Momentum considering google
google_names<‐names(sort(past_returns_google[i,], decreasing = FALSE, na.last = NA))
winners_google_1<‐names(sort(past_returns_stock[i,google_names[1:80]], decreasing = TRUE, na.last = NA))
winners_google_2<‐names(sort(past_returns_stock[i,google_names[81:160]], decreasing = TRUE, na.last = NA))
winners_google_3<‐names(sort(past_returns_stock[i,google_names[161:240]], decreasing = TRUE, na.last = NA))
winners_google_4<‐names(sort(past_returns_stock[i,google_names[241:320]], decreasing = TRUE, na.last = NA))
winners_google_5<‐names(sort(past_returns_stock[i,google_names[321:400]], decreasing = TRUE, na.last = NA))
for (x in 1:6) {
#Portfolio 1
google_returns_1[i,x]<‐sum(1/24*(stock_r[i+lag+x‐1,winners_google_1[1:24]]))
google_returns_1[i,x+6]<‐sum(1/32*(stock_r[i+lag+x‐1,winners_google_1[25:56]]))
google_returns_1[i,x+12]<‐sum(1/24*(stock_r[i+lag+x‐1,winners_google_1[57:80]]))

Retail Investors’ Attention and Momentum Strategies 28
#Portfolio 2
google_returns_2[i,x]<‐sum(1/24*(stock_r[i+lag+x‐1,winners_google_2[1:24]]))
google_returns_2[i,x+6]<‐sum(1/32*(stock_r[i+lag+x‐1,winners_google_2[25:56]]))
google_returns_2[i,x+12]<‐sum(1/24*(stock_r[i+lag+x‐1,winners_google_2[57:80]]))
#Portfolio 3
google_returns_3[i,x]<‐sum(1/24*(stock_r[i+lag+x‐1,winners_google_3[1:24]]))
google_returns_3[i,x+6]<‐sum(1/32*(stock_r[i+lag+x‐1,winners_google_3[25:56]]))
google_returns_3[i,x+12]<‐sum(1/24*(stock_r[i+lag+x‐1,winners_google_3[57:80]]))
#Portfolio 4
google_returns_4[i,x]<‐sum(1/24*(stock_r[i+lag+x‐1,winners_google_4[1:24]]))
google_returns_4[i,x+6]<‐sum(1/32*(stock_r[i+lag+x‐1,winners_google_4[25:56]]))
google_returns_4[i,x+12]<‐sum(1/24*(stock_r[i+lag+x‐1,winners_google_4[57:80]]))
#Portfolio 5
google_returns_5[i,x]<‐sum(1/24*(stock_r[i+lag+x‐1,winners_google_5[1:24]]))
google_returns_5[i,x+6]<‐sum(1/32*(stock_r[i+lag+x‐1,winners_google_5[25:56]]))
google_returns_5[i,x+12]<‐sum(1/24*(stock_r[i+lag+x‐1,winners_google_5[57:80]]))
}
}
write.xlsx(google_returns_1, ʺG12.xlsxʺ)
write.xlsx(google_returns_2, ʺG22.xlsxʺ)
write.xlsx(google_returns_3, ʺG32.xlsxʺ)
write.xlsx(google_returns_4, ʺG42.xlsxʺ)
write.xlsx(google_returns_5, ʺG52.xlsxʺ)
write.xlsx(past_returns_google, ʺGOOGLE PAST.xlsxʺ)
write.xlsx(winners_stock, ʺNOGOW.xlsxʺ)
write.xlsx(loosers_stock, ʺNOGOL.xlsxʺ)
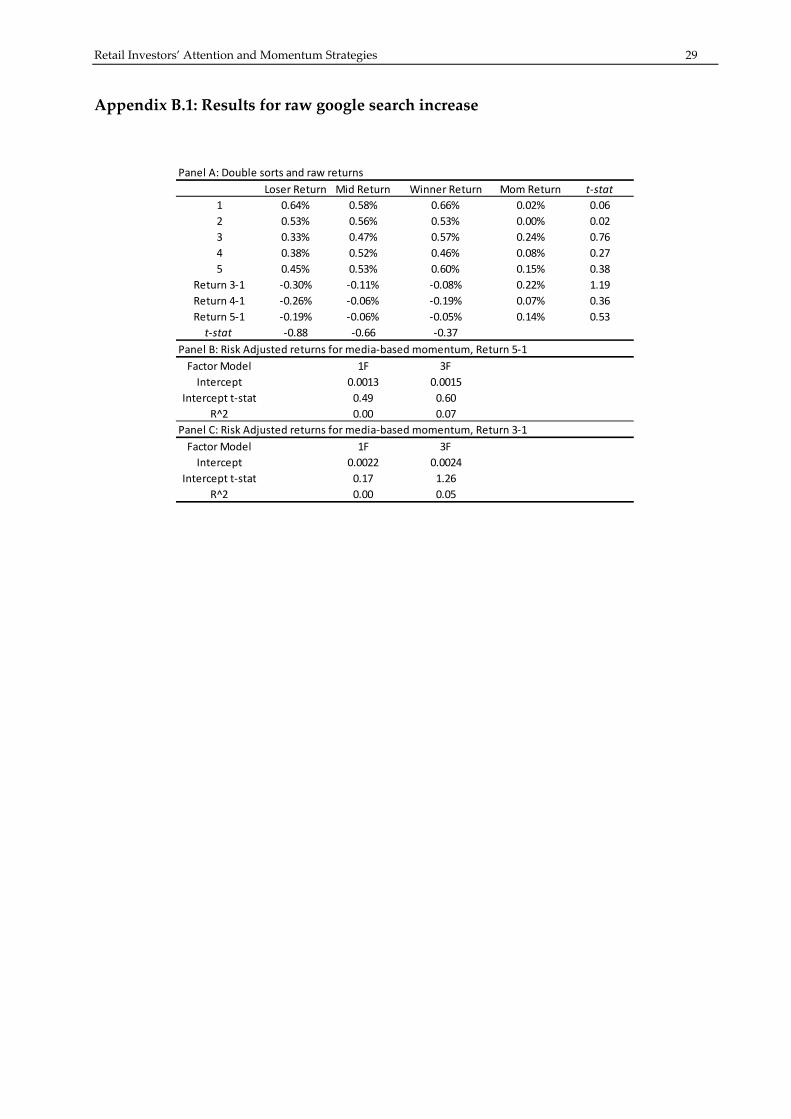
Retail Investors’ Attention and Momentum Strategies 29
Appendix B.1: Results for raw google search increase
Panel A: Double sorts and raw returns
Loser Return Mid Return Winner Return Mom Return t‐stat
1 0.64% 0.58% 0.66% 0.02% 0.06
2 0.53% 0.56% 0.53% 0.00% 0.02
3 0.33% 0.47% 0.57% 0.24% 0.76
4 0.38% 0.52% 0.46% 0.08% 0.27
5 0.45% 0.53% 0.60% 0.15% 0.38
Return 3‐1 ‐0.30% ‐0.11% ‐0.08% 0.22% 1.19
Return 4‐1 ‐0.26% ‐0.06% ‐0.19% 0.07% 0.36
Return 5‐1 ‐0.19% ‐0.06% ‐0.05% 0.14% 0.53
t‐stat ‐0.88 ‐0.66 ‐0.37
Panel B: Risk Adjusted returns for media‐based momentum, Return 5‐1
Factor Model 1F 3F
Intercept 0.0013 0.0015
Intercept t‐stat 0.49 0.60
R^2 0.00 0.07
Panel C: Risk Adjusted returns for media‐based momentum, Return 3‐1
Factor Model 1F 3F
Intercept 0.0022 0.0024
Intercept t‐stat 0.17 1.26
R^2 0.00 0.05

Retail Investors’ Attention and Momentum Strategies 30
Appendix B.2: Test of the mean between different momentum strategies
Mean return test between Momentum 3‐1 and Momentum 3‐5
Mean return test between Momentum 3‐1 and Momentum 5‐1
Mean return test between Momentum 3‐5 and Momentum 5‐1