Retail Food Sector Report Retail Foods Canada - USDA GAIN Publications/Retail Foods... · Retail...
47
THIS REPORT CONTAINS ASSESSMENTS OF COMMODITY AND TRADE ISSUES MADE BY USDA STAFF AND NOT NECESSARILY STATEMENTS OF OFFICIAL U.S. GOVERNMENT POLICY Date: GAIN Report Number: Approved By: Prepared By: Report Highlights: In 2012, Canada’s 34.4 million consumers were estimated to have generated C$ 470 billion (US$ 469 billion) in retail sales, representing a three percent increase from 2011. Food sales in Canada contributed close to 19 percent of the retail landscape. At the end of 2012, projected food sales were C$ 87 billion (excluding alcoholic beverages and liquor store sales). From 2006 to 2011, sales increased by 17 percent and are forecasted to grow at a constant compound annual growth rate (CAGR) of 2 % through 2016. This report provides an overview of the Canadian retail food sector for U.S. food producers that are exploring opportunities to export their products to Canada. This report does not include information on alcoholic beverages. This subject is addressed in the GAIN Report on Exporting Alcoholic Beverages into the Canadian Market. Post: Ottawa Maria Arbulu Scott Reynolds Retail Food Sector Report Retail Foods Canada CA13001 1/23/2013 Required Report - public distribution
Transcript of Retail Food Sector Report Retail Foods Canada - USDA GAIN Publications/Retail Foods... · Retail...
THIS REPORT CONTAINS ASSESSMENTS OF COMMODITY AND TRADE ISSUES MADE BY
USDA STAFF AND NOT NECESSARILY STATEMENTS OF OFFICIAL U.S. GOVERNMENT
POLICY
Date:
GAIN Report Number:
Approved By:
Prepared By:
Report Highlights:
In 2012, Canada’s 34.4 million consumers were estimated to have generated C$ 470 billion (US$
469 billion) in retail sales, representing a three percent increase from 2011. Food sales in Canada
contributed close to 19 percent of the retail landscape. At the end of 2012, projected food sales were
C$ 87 billion (excluding alcoholic beverages and liquor store sales). From 2006 to 2011, sales
increased by 17 percent and are forecasted to grow at a constant compound annual growth rate
(CAGR) of 2 % through 2016. This report provides an overview of the Canadian retail food sector
for U.S. food producers that are exploring opportunities to export their products to Canada. This
report does not include information on alcoholic beverages. This subject is addressed in the GAIN
Report on Exporting Alcoholic Beverages into the Canadian Market.
Post:
Ottawa
Maria Arbulu
Scott Reynolds
Retail Food Sector Report
Retail Foods
Canada
CA13001
1/23/2013
Required Report - public distribution
2
Table of Contents
Overview of U.S. Agricultural Products in Canada ..................................................................................... 3
Section 1: Market Summary .................................................................................................................... 3
1A. The Food Sector in Canada’s Retail Landscape .......................................................................... 3
1B. Imported Foods in Canada ........................................................................................................... 7
1C. The Canadian Shopper ................................................................................................................. 9
1D. Trends Driving Grocery Purchases............................................................................................. 10
Section 2: Road Map for Market Entry ................................................................................................. 14
2A. Overview ................................................................................................................................... 14
2B. Market Structure and Retail Food Distribution Channel ............................................................ 20
i. Retail Sub Sectors ....................................................................................................................... 21
ii. Convenience Stores, Mini Marts, and Gas Stations ................................................................... 23
iii. Drug Chains ................................................................................................................................ 24
iv. On-Line Shopping ....................................................................................................................... 30
Section 3: Leading U.S. Products and the Competition ............................................................................ 31
Section 4: Best Product Prospects ......................................................................................................... 38
4A. Food Products with Good Sales Potential .................................................................................... 38
4B. Products Facing Significant Barriers and Regulatory Challenges ................................................ 39
Section 5: Further Canadian Contacts and FAS/Canada Contacts ........................................................ 42
5A. Government Organizations ......................................................................................................... 42
5B. Industry Associations ................................................................................................................ 43
5C. Publications ............................................................................................................................... 44
5D. FAS/Canada Contacts ................................................................................................................. 45
5E. Summary of Key Resources ....................................................................................................... 47
Overview of U.S. Agricultural Products in Canada
In 2012, U.S. agricultural exports to Canada exceeded $ 20 billion, reflecting an increase of 8% over
2011. U.S. agricultural exports to Canada account for about 15 per cent of the total U.S. food and
agricultural exports. Consumer-oriented agricultural products comprise 77 % of the total U.S. food and
agricultural product sales to Canada, with fresh fruits and vegetables, snack foods, processed fruits and
vegetables and red meat products as the category leaders. American products account for about 60% of
Canada's total agricultural imports.
In 2012, the majority of US consumer-oriented agricultural categories such as fresh fruits, red meats,
snack foods, fresh vegetables, breakfast cereals, pet foods, wine and beer, tree nuts, posted record annual
sales in Canada. The top five categories were red meat ($2.2 billion), fresh fruits ($1.8 billion), snack
foods ($1.7 billion), fresh vegetables ($1.6 billion), and processed fruits and vegetables ($1.3 billion).
Canada is also an important market for U.S. fishery products. Canada is the second largest export
market for U.S. fish and seafood products, with sales exceeding $900 million in 2012. Furthermore,
U.S. fish and seafood products dominate Canadian imports and represent more than one-third of the
country’s total imports.
Under the tariff elimination provision of the North American Free Trade Agreement (NAFTA), the
majority of U.S. agricultural products have entered Canada duty-free since January 1, 1998. On
December 4, 1998 the United State and Canada signed a Record of Understanding, an agreement to
further open Canadian markets to U.S. farm and ranch products. Since that time, U.S. agricultural
exports have tripled in value.1
Trade with Canada is facilitated by proximity, similar culture & language, common lifestyle pursuits,
and the ease of travel among citizens for business or pleasure. Many American products have gained an
increased competitive edge over goods from other countries as the result of NAFTA. Canada's grocery
product and food service trades have been quick to seize opportunities under NAFTA, which permitted
them to expand their geographical sourcing area to include the United States. Declining import duties
under the trade agreements and an easing of Canadian packaging requirements for processed
horticultural products for the food service sector have resulted in significant gains in the Canadian
market for U.S. consumer-ready foods and food service products.
Section 1: Market Summary
1A. The Food Sector in Canada’s Retail Landscape
In 2012, Canada’s 34.4 million consumers were projected to have generated C$ 470 billion (US$ 469
billion) in retail sales, representing a three percent increase from 2011. A modest growth of 2.7% is
expected for 2013. Although, sales in Canada are smaller than those in the U.S., retail spending per
capita in Canada equals that of the United States.
1 1998 U.S. agricultural exports to Canada were valued at $ 6.8 billion.
4
The Office of Consumer Affairs of Canada reports the retail landscape has changed considerably as
there has been a shift from the independent to chain stores. The strong presence of U.S. franchises and
their chain stores have resulted in a high receptivity to American products and services. Also, most
consumers recognize and are familiar with U.S. products and services due to the geographical proximity
and cultural similarities.
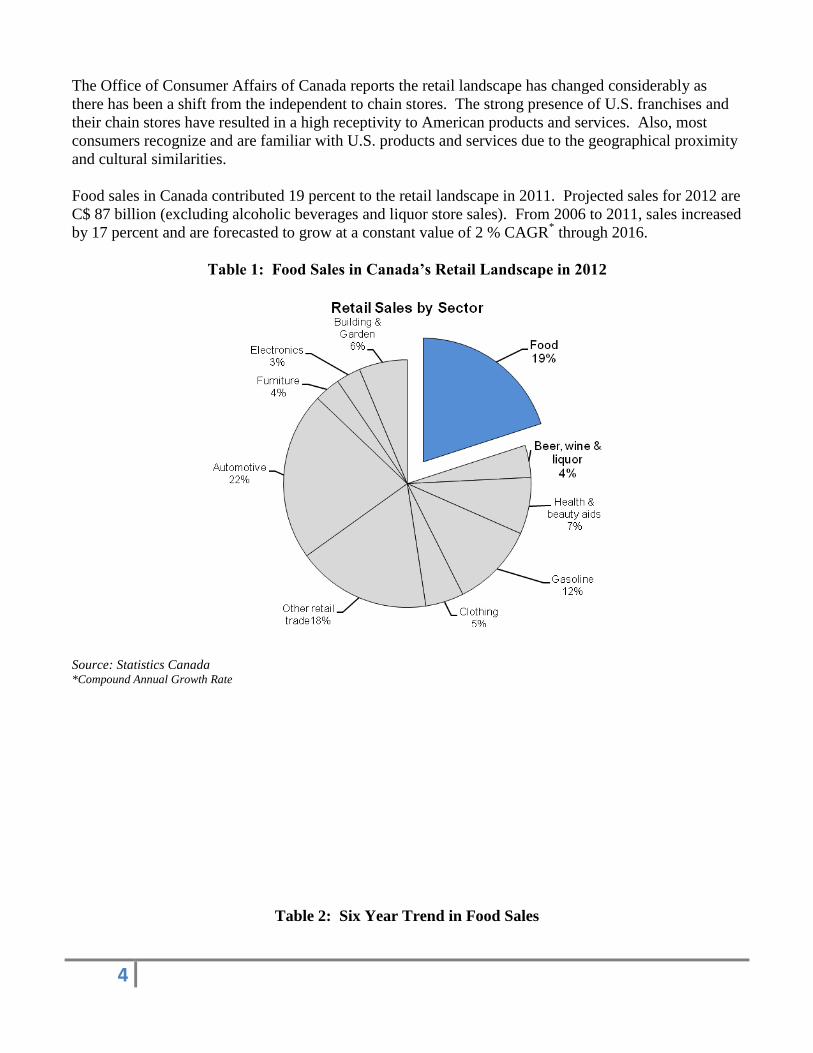
Food sales in Canada contributed 19 percent to the retail landscape in 2011. Projected sales for 2012 are
C$ 87 billion (excluding alcoholic beverages and liquor store sales). From 2006 to 2011, sales increased
by 17 percent and are forecasted to grow at a constant value of 2 % CAGR* through 2016.
Table 1: Food Sales in Canada’s Retail Landscape in 2012
Source: Statistics Canada *Compound Annual Growth Rate
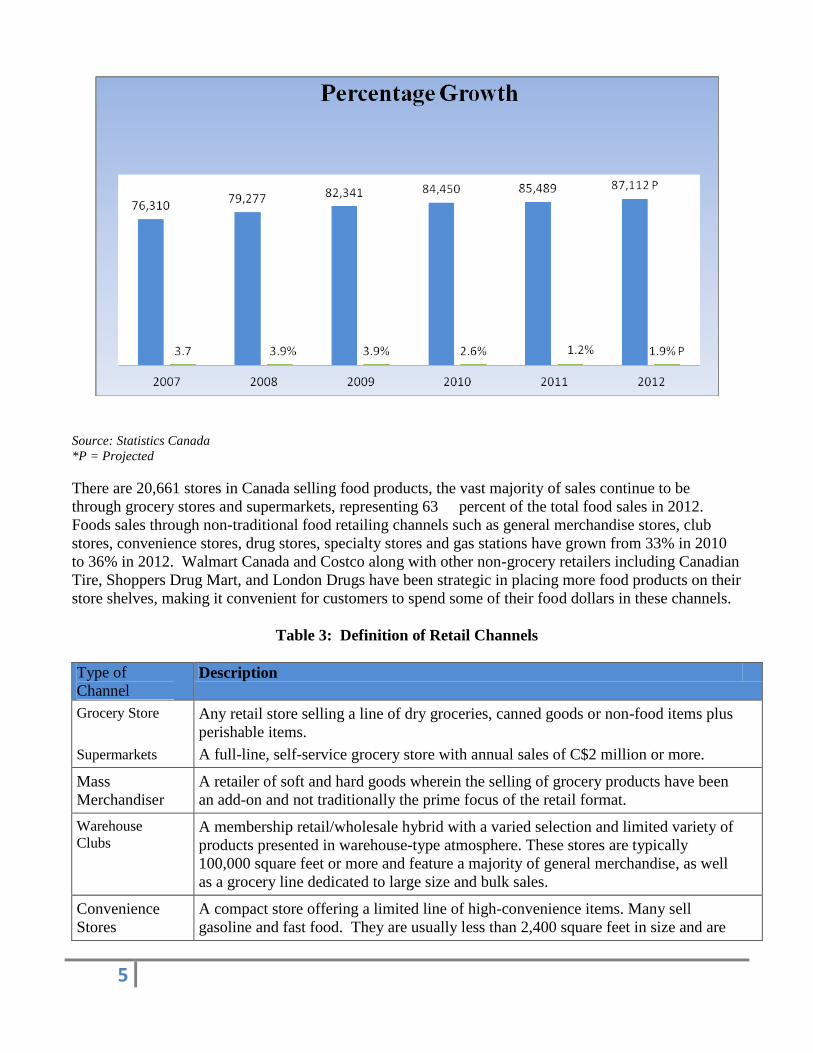
Table 2: Six Year Trend in Food Sales
5
Source: Statistics Canada
*P = Projected
There are 20,661 stores in Canada selling food products, the vast majority of sales continue to be
through grocery stores and supermarkets, representing 63 percent of the total food sales in 2012.
Foods sales through non-traditional food retailing channels such as general merchandise stores, club
stores, convenience stores, drug stores, specialty stores and gas stations have grown from 33% in 2010
to 36% in 2012. Walmart Canada and Costco along with other non-grocery retailers including Canadian
Tire, Shoppers Drug Mart, and London Drugs have been strategic in placing more food products on their
store shelves, making it convenient for customers to spend some of their food dollars in these channels.
Table 3: Definition of Retail Channels
Type of
Channel Description
Grocery Store
Supermarkets
Any retail store selling a line of dry groceries, canned goods or non-food items plus
perishable items.
A full-line, self-service grocery store with annual sales of C$2 million or more.
Mass
Merchandiser
A retailer of soft and hard goods wherein the selling of grocery products have been
an add-on and not traditionally the prime focus of the retail format.
Warehouse
Clubs A membership retail/wholesale hybrid with a varied selection and limited variety of
products presented in warehouse-type atmosphere. These stores are typically
100,000 square feet or more and feature a majority of general merchandise, as well
as a grocery line dedicated to large size and bulk sales.
Convenience
Stores
A compact store offering a limited line of high-convenience items. Many sell
gasoline and fast food. They are usually less than 2,400 square feet in size and are
6
open long hours.
Drug Stores Stores (often chain) with retail pharmacies and specializing in Over-the-Counter
(OTC) medications and selling health and beauty aid products. Offering a limited
range of convenient groceries.
Specialty
Stores
Small specialized stores, often approximately 3,000 square feet specializing in a
specific food market sector, such as meats or health foods.
Gas Stations
Convenience stores operating under or in conjunction with a gasoline banner.
Source: Canadian Grocer 2012
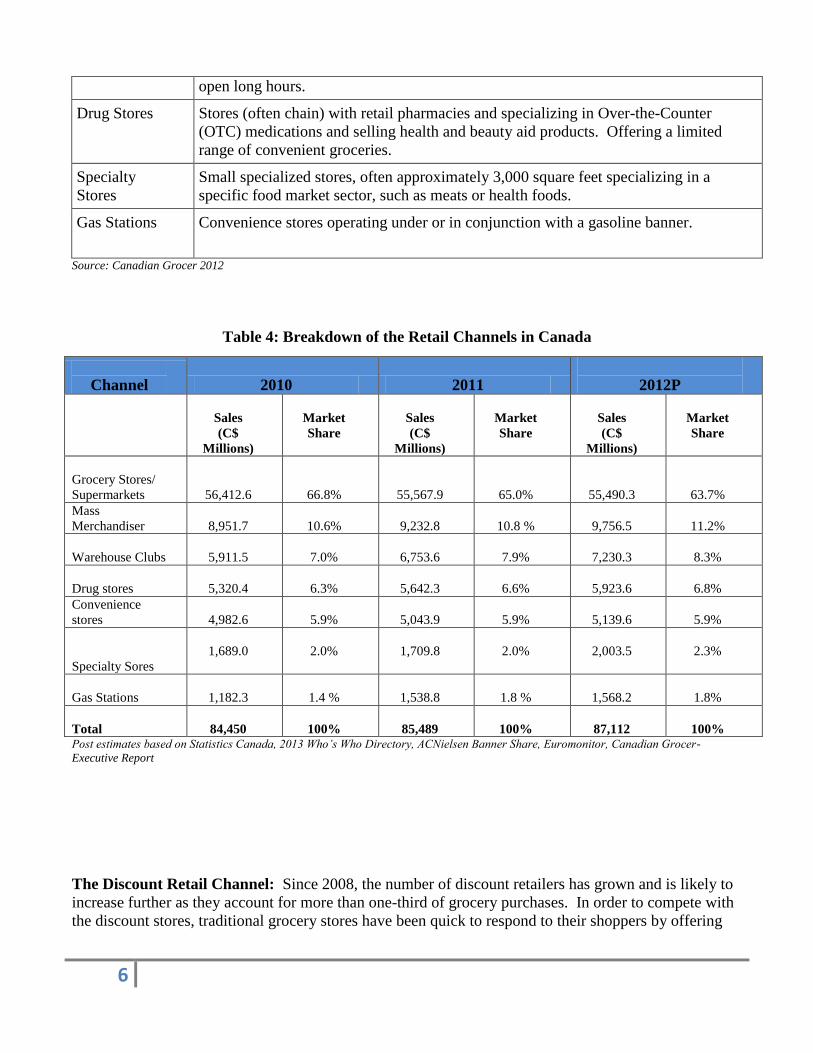
Table 4: Breakdown of the Retail Channels in Canada
Post estimates based on Statistics Canada, 2013 Who’s Who Directory, ACNielsen Banner Share, Euromonitor, Canadian Grocer-
Executive Report
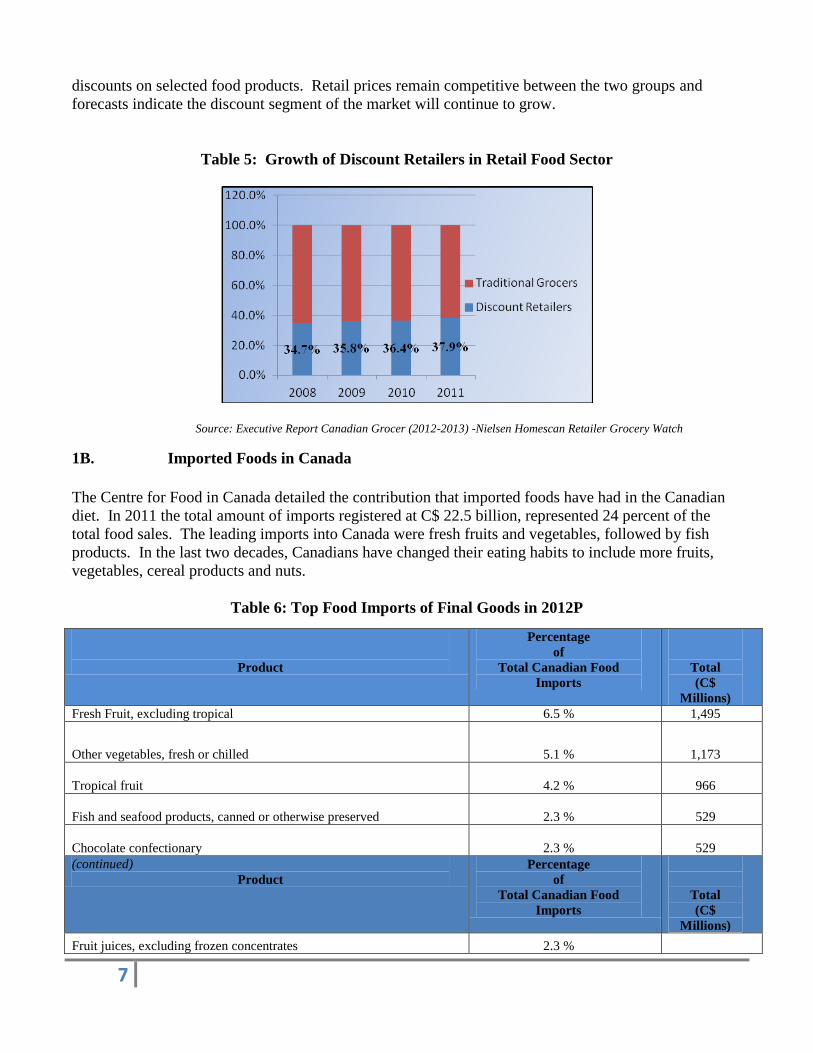
The Discount Retail Channel: Since 2008, the number of discount retailers has grown and is likely to
increase further as they account for more than one-third of grocery purchases. In order to compete with
the discount stores, traditional grocery stores have been quick to respond to their shoppers by offering
Channel 2010 2011
2012P
Sales
(C$
Millions)
Market
Share
Sales
(C$
Millions)
Market
Share
Sales
(C$
Millions)
Market
Share
Grocery Stores/
Supermarkets 56,412.6 66.8% 55,567.9 65.0%
55,490.3
63.7%
Mass
Merchandiser 8,951.7 10.6% 9,232.8 10.8 %
9,756.5
11.2%
Warehouse Clubs 5,911.5 7.0%
6,753.6 7.9%
7,230.3
8.3%
Drug stores
5,320.4 6.3%
5,642.3 6.6%
5,923.6
6.8%
Convenience
stores 4,982.6 5.9% 5,043.9 5.9%
5,139.6
5.9%
Specialty Sores
1,689.0 2.0% 1,709.8 2.0% 2,003.5
2.3%
Gas Stations 1,182.3 1.4 %
1,538.8 1.8 %
1,568.2
1.8%
Total 84,450
100% 85,489 100%
87,112
100%
7
discounts on selected food products. Retail prices remain competitive between the two groups and
forecasts indicate the discount segment of the market will continue to grow.
Table 5: Growth of Discount Retailers in Retail Food Sector
Source: Executive Report Canadian Grocer (2012-2013) -Nielsen Homescan Retailer Grocery Watch
1B. Imported Foods in Canada
The Centre for Food in Canada detailed the contribution that imported foods have had in the Canadian
diet. In 2011 the total amount of imports registered at C$ 22.5 billion, represented 24 percent of the
total food sales. The leading imports into Canada were fresh fruits and vegetables, followed by fish
products. In the last two decades, Canadians have changed their eating habits to include more fruits,
vegetables, cereal products and nuts.
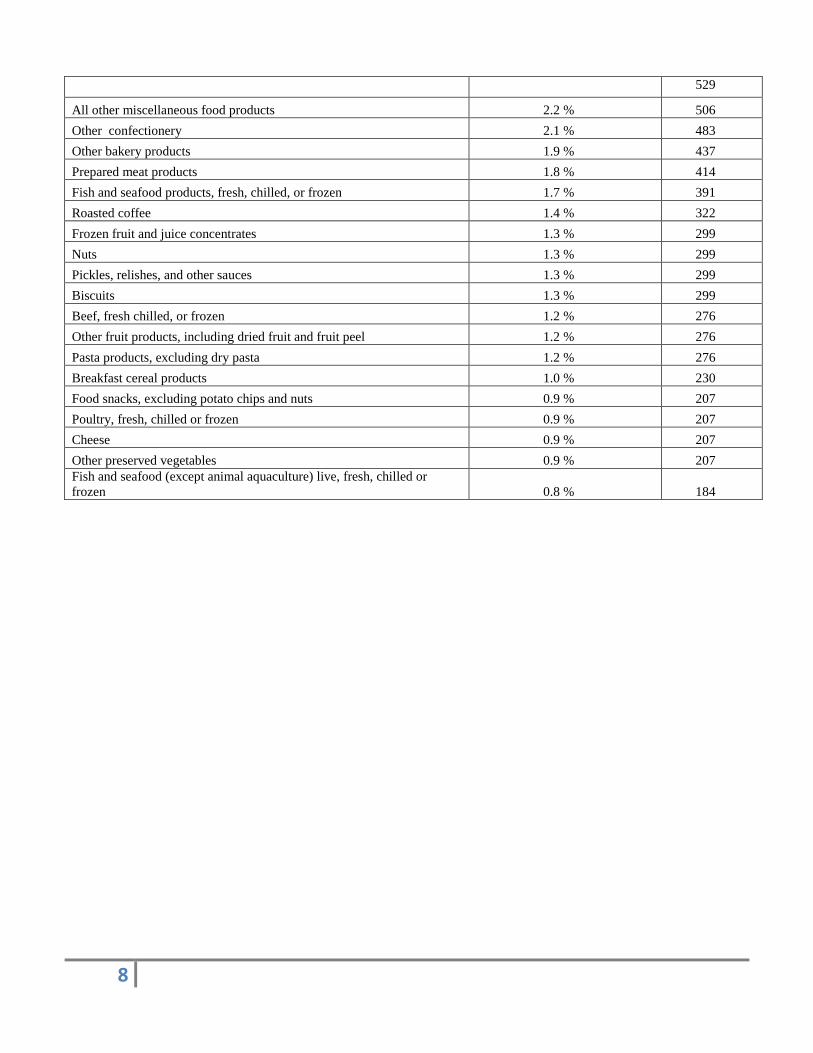
Table 6: Top Food Imports of Final Goods in 2012P
Product
Percentage
of
Total Canadian Food
Imports
Total
(C$
Millions)
Fresh Fruit, excluding tropical 6.5 % 1,495
Other vegetables, fresh or chilled 5.1 % 1,173
Tropical fruit 4.2 %
966
Fish and seafood products, canned or otherwise preserved 2.3 %
529
Chocolate confectionary 2.3 %
529
(continued)
Product
Percentage
of
Total Canadian Food
Imports
Total
(C$
Millions)
Fruit juices, excluding frozen concentrates 2.3 %
8
529
All other miscellaneous food products 2.2 % 506
Other confectionery 2.1 % 483
Other bakery products 1.9 % 437
Prepared meat products 1.8 % 414
Fish and seafood products, fresh, chilled, or frozen 1.7 % 391
Roasted coffee 1.4 % 322
Frozen fruit and juice concentrates 1.3 % 299
Nuts 1.3 % 299
Pickles, relishes, and other sauces 1.3 % 299
Biscuits 1.3 % 299
Beef, fresh chilled, or frozen 1.2 % 276
Other fruit products, including dried fruit and fruit peel 1.2 % 276
Pasta products, excluding dry pasta 1.2 % 276
Breakfast cereal products 1.0 % 230
Food snacks, excluding potato chips and nuts 0.9 % 207
Poultry, fresh, chilled or frozen 0.9 % 207
Cheese 0.9 % 207
Other preserved vegetables 0.9 % 207
Fish and seafood (except animal aquaculture) live, fresh, chilled or
frozen 0.8 % 184
9
Source: Statistics Canada. List does not include alcoholic beverages
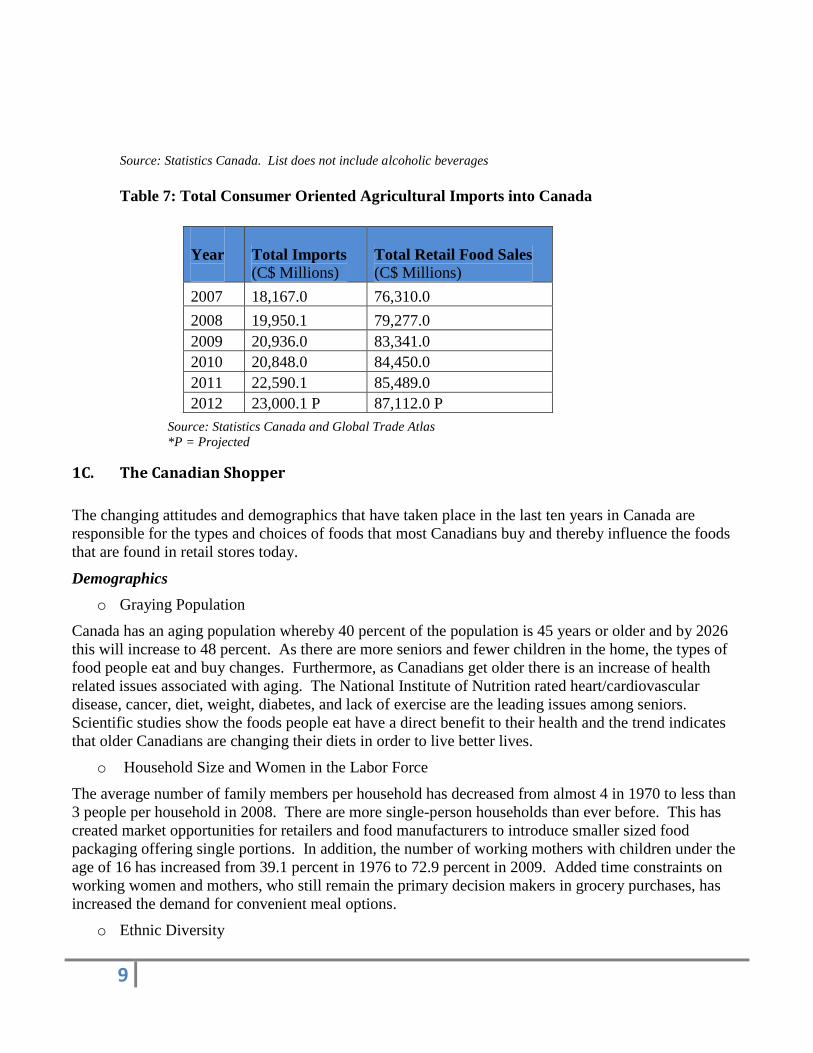
Table 7: Total Consumer Oriented Agricultural Imports into Canada
Source: Statistics Canada and Global Trade Atlas
*P = Projected
1C. The Canadian Shopper
The changing attitudes and demographics that have taken place in the last ten years in Canada are
responsible for the types and choices of foods that most Canadians buy and thereby influence the foods
that are found in retail stores today.
Demographics
o Graying Population
Canada has an aging population whereby 40 percent of the population is 45 years or older and by 2026
this will increase to 48 percent. As there are more seniors and fewer children in the home, the types of
food people eat and buy changes. Furthermore, as Canadians get older there is an increase of health
related issues associated with aging. The National Institute of Nutrition rated heart/cardiovascular
disease, cancer, diet, weight, diabetes, and lack of exercise are the leading issues among seniors.
Scientific studies show the foods people eat have a direct benefit to their health and the trend indicates
that older Canadians are changing their diets in order to live better lives.
o Household Size and Women in the Labor Force
The average number of family members per household has decreased from almost 4 in 1970 to less than
3 people per household in 2008. There are more single-person households than ever before. This has
created market opportunities for retailers and food manufacturers to introduce smaller sized food
packaging offering single portions. In addition, the number of working mothers with children under the
age of 16 has increased from 39.1 percent in 1976 to 72.9 percent in 2009. Added time constraints on
working women and mothers, who still remain the primary decision makers in grocery purchases, has
increased the demand for convenient meal options.
o Ethnic Diversity
Year
Total Imports
(C$ Millions) Total Retail Food Sales
(C$ Millions)
2007 18,167.0 76,310.0
2008 19,950.1 79,277.0
2009 20,936.0 83,341.0
2010 20,848.0 84,450.0
2011 22,590.1 85,489.0
2012 23,000.1 P 87,112.0 P
10
Cultural diversity is a critical force in the retail marketplace and many retailers are responding to this
change. The arrival of new immigrants into the country has helped to boost Canada’s population.
Consumers of South Asian and Chinese backgrounds make up the largest ethnic groups. Statistics
Canada projects that by 2031, ethnic shoppers will represent 31% of the consumers in Canada.
Canadian Purchasing Attitudes
In a survey conducted by Agriculture and Agri-Food Canada, the top four attributes influencing
Canadian shoppers in their selection of (in order of importance) are: price, quality, freshness and
health/nutrition.
o Price
Many Canadian consumers have become bargain shoppers due to a slow economic recovery and rising
food prices in 2011, which increased by 4.4 percent. These factors have caused shoppers to remain
cautious in their spending habits. A recent audit conducted by Deloitte Canada for the leading trade
magazine, Canadian Grocer, predicts ‘the consumer will remain just as price conscious as ever, with
little to no evidence of change.’2
o Quality
Consumers associate quality with freshness, nutrition, safety, appearance and flavor. Although, the
annual average household expenditures on food have decreased from 18.7 percent from 1969 to 10.2
percent in 2009, real spending per person has increased. Shoppers are buying high-value and quality
items. Post estimates the annual average spent on groceries per person in 2010 was C$ 3,494. In
response to these buying preferences, retailers are offering more specialty and gourmet foods to their
customers.
o Freshness
Freshness is becoming synonymous with quality among Canadians as it implies good taste, nutrition,
and more natural (not processed). The consumption of fruits and vegetables by Canadians has increased
significantly over the last decade. Agriculture and Agri-Food Canada report Canadians have added 10.9
percent more vegetables into their diets. In 2010 Walmart Canada recognized this trend and introduced
fresh produce into their stores. Also, noted earlier in Table 6 on Canada’s top leading food imports,
fresh fruits and vegetables were ranked #1 and #2 at the top of the list.
o Health/Nutrition
Consumers are informed about the many health benefits and risk associated with diet and many have
become conscious of reading food labels to check their nutritional value and list of ingredients.
Although Health Canada reports Canadians have reduced their intake of daily calories from 2,500 in
2001 to 2,358 in 2009, the incidents of childhood obesity have tripled in the past 30 years. Foods that
address the health concerns of younger and older consumers with appealing taste will continue to show
promise in the marketplace.
1D. Trends Driving Grocery Purchases
Value
2 Canadian Press. December 14, 2011. Food Industry Weathered Economic Report.
11
Discount Shopping: Higher food prices have caused consumers to switch to cheaper brands and cheaper
grocery stores.3
Promotional Priced Products: A growing number of Canadian shoppers browse their store
flyer for lower-priced specials and search the internet for coupons.4
This trend is expected to
grow through 2013. Although Canadians are price conscious shoppers they will not sacrifice
quality for price.
Private Label: Traditionally, private label had been seen as lower quality and generally less desirable
than national brands but this has changed. In 2011, private label represented C$ 11.3 billion in sales and
continued to increase in 2012.
Economical Meal Solutions: A resurgence of traditional products that offer value such as dehydrated
soups.
Quality/Freshness
Fresh Foods: Consumers are switching to fresh foods for they equate "fresh" with better value
that offers taste, health and nutrition. Canadian Grocer reports that Target Canada will offer a
limited selection of fresh products at a reasonable range to the consumer.
Frozen Foods: Retail sales of frozen foods grew by 3% and are predicted to increase as new
technology helps to improve the flavor of frozen food. Microwavable frozen meals that offer
steam packaging have become popular.
Convenience
Ready to Heat and Eat Foods: Women continue to do the majority of food purchasing,
preparation and clean up. As a result, the demand for foods that are easy and quick to prepare
yet tasty, fresh and nutritiously sound continues to grow.
One Dish Meals: Growth in quick one-dish meal kits such as stir-fries and stew are expected to
grow.
Custom Quick Food: Consumers do not spend an extensive amount of time preparing meals;
but it still is important to feel that they have contributed something to the preparation. Therefore,
opportunities exist for ready meals or kits, which allow the persons preparing them to add their
own personal touch.
Smaller Food Portions and Packages: Individual portions sizes are in demand as there are
more single-person households.
Flexible and Portable Packaging: Eating in vehicles or “Dashboard Dining,” as well as eating
lunches at the work desk is more common.
Snacks and Mini Meals: Canadians eat more snacks than Americans. Eating patterns are
changing from eating three main meals a day to eating several smaller meals throughout the day.
Convenient, nutritious snacks or mini meals will increase in demand (i.e. breakfast bars, wraps,
sports drinks).
3 2011 Ipsos Survey reported in a sample population that 44% of Canadian grocery shoppers switched to a cheaper brand and 36%
switched to a cheaper grocery store. 4 Brandspark International reported the 93% of Canadian grocery shoppers browse flyers while 54% subscribe to a coupon website.
12
Innovation: Convenience foods will continue to be popular but the key to success will be
innovation.
Physical and Emotional Energy: Stressed out consumers that are seeking energy, power and
performance from food are turning to sports drinks, energy bars and snacks.
Health and Wellness
Correcting Condition: Food and food ingredients continue to increase in popularity as a method
for self-medication and disease prevention. As a result, the demand for functional and
nutraceuticals foods will continue to increase and new products will be developed.
Healthy Foods for Kids: Approximately 26 percent of Canadian children ages 2-17 years old
are currently obese.
Food Safety: Consumers are increasingly interested in food products that provide reassurances
about food safety.
Gluten-Free: The demand for gluten-free products will continue to grow and it has more than
doubled since 2005.
Low Sodium: Canadian consumers are becoming conscious about the level of sodium in
prepackaged processed foods and in restaurant meals. Health Canada is currently reviewing new
recommended target levels of sodium intake.
Low Sugar: Canada’s Food Guide recommends moderate consumption of sugar, glucose,
fructose, and various kinds of syrups, as they are the major contributors to weight gain.
Low Calorie: Interest in weight loss products and lower calorie foods continues to be high
among Canadians.
Organics: The value of organic food products is estimated at C$ 2 billion and is predicted to
grow steadily.
Trans Fats and Saturated Fats: Canadians are continually concerned about fat intake and
health concerns associated with trans and saturated fats. As a result, low-fat cereals, dairy
products and frozen meals are rising.
Pleasure/Ethnic Foods
Economic growth and rising disposable income has made Canadians more confident about spending for
products and services that make their lives easier or provide pleasure.
Indulgence or Comfort Foods: Although Canadians are concerned about the nutritional value
of foods, they still are reaching out for tasty snacks that are high in fat, sugar and salt. The
demand for these foods continues to be high for they are often considered a reward for healthy
eating or surviving the stresses of everyday life.
Gourmet products of Meal Excitement: New, unique, high quality and expensive products will
be small indulgences for consumers who are seeking meal entertainment.
Regional Cuisine: Consumers are becoming more interested in seasonal, regional and high
flavor foods.
Ethnic Foods: Immigration to Canada and the number of minority groups has increased
dramatically. Consumers are flocking to healthful and flavorful ethnic cuisines such as Asian
and Mediterranean foods where the emphasis is on ingredients such as vegetables, grains and
13
fish. In 2010, ethnic food markets generated C$ 65 billion in food sales and are projected to
increase 15 -20 percent annually.
Ethical Buying
A small but growing number of Canadians are making buying choices based on where and how their
foods are grown. This trend goes beyond taste and health concern and into the realm of green politics
and anti-globalization. It includes the concepts of “fair trade”, “sustainable practices”, and “food miles.”
Buy Local Products: Consumers are concern for their local economy and where there foods
come from. Although, U.S. foods are not viewed as local this may present opportunities for U.S.
food companies. Canadians view U.S. products as safer and of better quality than imports from
other countries.
Recycled and Biodegradable Food Packaging: Most Canadian cities have instituted recycling
programs for their citizens and businesses. Each sector is looking to maintain a ‘green image.’
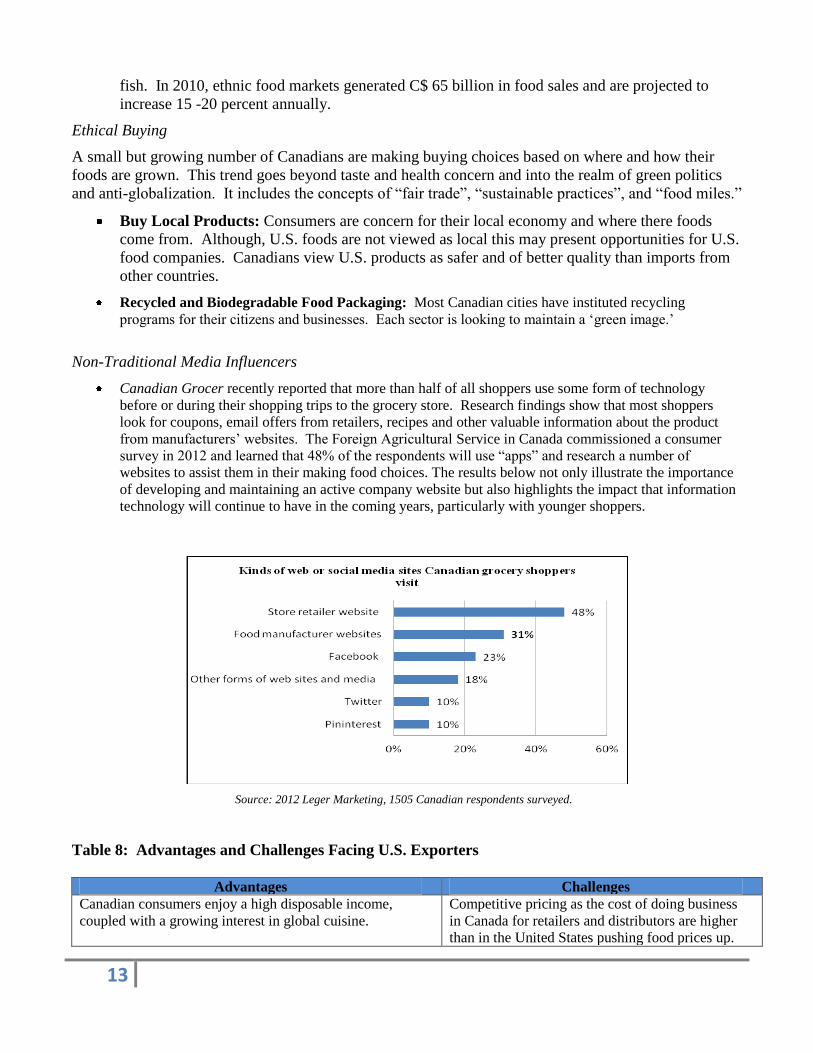
Non-Traditional Media Influencers
Canadian Grocer recently reported that more than half of all shoppers use some form of technology
before or during their shopping trips to the grocery store. Research findings show that most shoppers
look for coupons, email offers from retailers, recipes and other valuable information about the product
from manufacturers’ websites. The Foreign Agricultural Service in Canada commissioned a consumer
survey in 2012 and learned that 48% of the respondents will use “apps” and research a number of
websites to assist them in their making food choices. The results below not only illustrate the importance
of developing and maintaining an active company website but also highlights the impact that information
technology will continue to have in the coming years, particularly with younger shoppers.
Source: 2012 Leger Marketing, 1505 Canadian respondents surveyed.
Table 8: Advantages and Challenges Facing U.S. Exporters
Advantages Challenges
Canadian consumers enjoy a high disposable income,
coupled with a growing interest in global cuisine.
Competitive pricing as the cost of doing business
in Canada for retailers and distributors are higher
than in the United States pushing food prices up.

14
U.S. food products closely match Canadian tastes and
expectations.
Tariff rate quotas for certain products.
Fruit and vegetable consumption in Canada is
substantially higher than that in the United States. Except
for its greenhouse industry Canada’s horticulture
production is limited. This provides opportunities for U.S.
producers in the off seasons. Canadian retailers rely
heavily on imports to supply the domestic market all year
round.
With consolidation, sellers often face one
national retail buyer per category; this buyer will
often purchase for all banners under the retailer.
Buyers are constantly looking to reduce price,
improve product quality and extend the product
range with new entrants.
Canada and the U.S. share a 3,145-mile of border with 2/3
of the Canadian population living within 200 miles of the
U.S. border. This geographical proximity facilitates
communication and transportation. There is also
significant over flow of U.S. television and print media in
most Canadian centers, which can reduce advertising
costs for U.S. companies with media campaigns in U.S.
cities bordering on Canada.
Canada has a very high ethnic population with
specific dietary preferences. [The three largest
cities consist of more than 1/3 new Canadians].
This consumer ethnic diversity tends to be a
challenge for some large scale mass marketing
companies with products and marketing
campaigns more targeted at the U.S. market. On
the other hand the different ethnic markets in
Canada can create niche opportunities for smaller
companies.
Canada’s strong dollar is an advantage for U.S. exporters. Retailers and brokers/distributors may charge
high listing/placement fees.
Canadian ethnically diverse population provides
opportunities for specialty products in populated centers.
Food labeling, including bilingual packaging
requirement, and nutritional content claims are
highly regulated and frequently differ from the
United States.
Retail consolidation favors large-scale suppliers and
increases sales efficiency with fewer retailers to approach.
Retailers are interested in category extension, not
cannibalization. Products entering the market
must be innovative; not duplicative.
Duty free tariff treatment for most products under
NAFTA
Differences in Food Standards may require
special production runs and packaging due to
Canadian standard package sizes.
High U.S. quality and safety perceptions. Differences in approved chemicals and residue
tolerances.
Private label presents opportunities for custom packers of
high quality products.
Private label brands continue to grow in many
categories; sometimes taking shelf space from
American national brands.
The total population of Canada is slightly less
than California and much more spread out,
making marketing and distribution costs
generally higher than in the United States.
Section 2: Road Map for Market Entry
2A. Overview
Entry Strategy

15
US food manufacturers seeking to enter the Canadian marketplace have many opportunities. The United
States is Canada's largest trading partner with 63% per cent market share of Canada’s manufactured
food imports originating from the United States. This is a result of a number of factors, including a
convenient shipping corridor and a familiarity with consumer tastes and expectations, and most
importantly the North American Free Trade Agreement (NAFTA). There are a number of challenges
U.S. exporters must meet before exporting to Canada. Some of these include currency, customs
procedures and labeling requirements.
To meet these market challenges, we recommend that U.S. exporters entering the Canadian market take
the following steps:
1) Contact your State Regional Trade Group,
2) Research the market for your particular product,
3) Locate a Canadian partner: broker/distributor/importer, and
4) Understand the Canadian government standards and regulations that pertain to your product.
Step 1. Contact your State Regional Trade Group/State Regional Office
State Regional Trade Groups (SRTG) are non-profit organizations that offer many services to U.S.
food/agricultural product exporters. They are comprised of representatives from their region’s
Department of Agriculture and work together in supporting U.S. food companies. Primarily, they assist
in providing privileged information about the various food sectors in targeted foreign countries. Also,
key contact information on buyers and specifics about important trade and consumer shows in Canada is
available for potential exporters. Through the SRTGs, branded food products and agricultural
commodities can be promoted with assistance from Market Access Program (MAP) funds administered
by USDA’s Foreign Agricultural Service.
Packaging and label modifications, product tasting/demonstrations, in-store promotions, point-of-sale
materials, advertising, and trade show participation, are some of the activities for which eligible
participants can obtain partial reimbursements.
Table 9: State Regional Trade Groups
State Regional
Trade Group Web Site States
Food Export USA
Northeast
http://www.foodexportusa.org Connecticut, Delaware, Maine,
Massachusetts, New Hampshire,
New Jersey, New York,
Pennsylvania, Rhode Island,
Vermont
Food Export
Association of the
Midwest USA
http://www.foodexport.org
Illinois, Indiana, Iowa, Kansas,
Michigan, Minnesota, Missouri,
Nebraska, North Dakota, Ohio,
South Dakota, Wisconsin
Southern U.S.
Trade Association
(SUSTA)
http://www.susta.org Alabama, Arkansas, Florida,
Georgia, Kentucky, Louisiana,
Maryland, Mississippi, North
Carolina, Oklahoma, South
Carolina, Tennessee, Texas,
Puerto Rico, Virginia, West
16
Virginia
Western U.S.
Agricultural Trade
Association
(WUSATA)
http://www.wusata.org Alaska, Arizona, American
Samoa, California, Colorado,
Guam, Hawaii, Idaho, Montana,
Nevada, New Mexico, Oregon,
Utah, Washington, Wyoming
National
Association of
State Departments
of Agriculture
(NASDA)
http://www.nasda.org/cms/7195/8617.aspx
State Directory of the State
Departments of Agriculture
Step 2: Research the Market for Your Specific Product
A thorough understanding of consumer trends and needs are required in developing an effective market
strategy in Canada. There are many organizations in Canada with a wealth of information for U.S.
exporters interested in researching the many aspects and particularities of the Canadian food sector.
Fortunately, as Table 7 indicates, much of that information is available via the internet. Though some
consumer data can only be obtained with a fee, there are several trade publications that continuously
report on current developments of interest for U.S. exporters. These publications are Canadian Grocer
(www.canadiangrocer.ca) and Grocery Business (www.grocerybusiness.ca), closely follow upcoming
trends in the food retail industry in Canada.
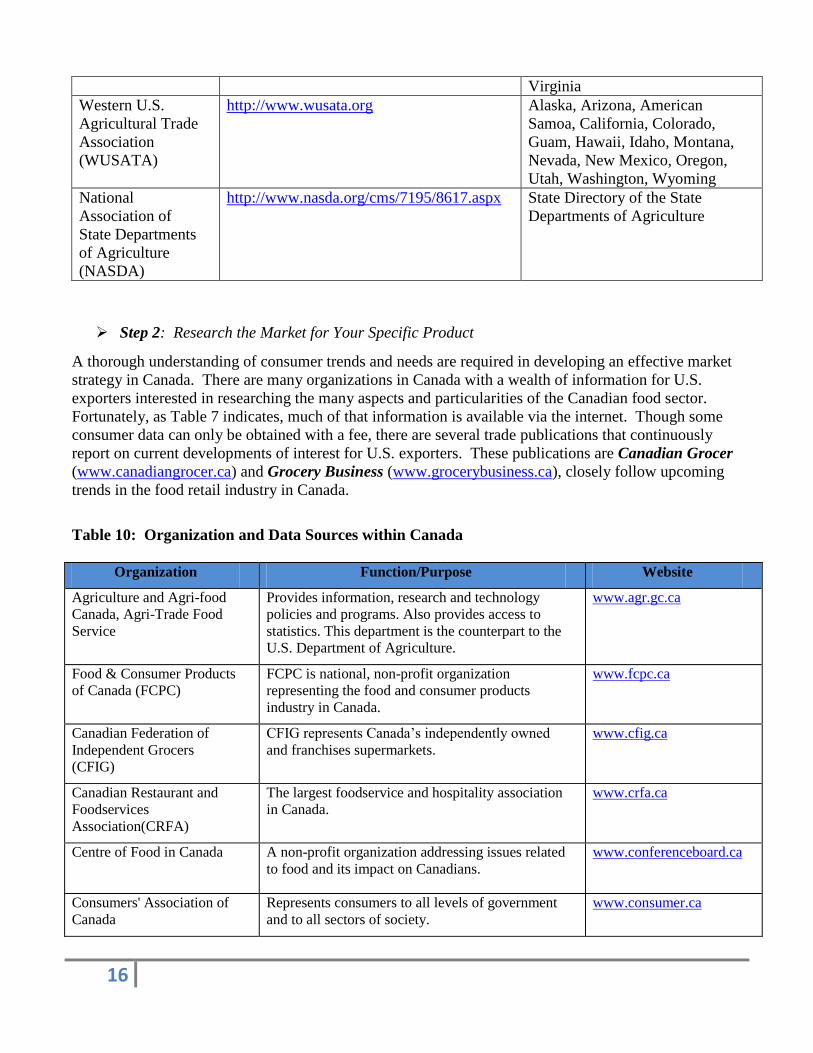
Table 10: Organization and Data Sources within Canada
Organization Function/Purpose Website
Agriculture and Agri-food
Canada, Agri-Trade Food
Service
Provides information, research and technology
policies and programs. Also provides access to
statistics. This department is the counterpart to the
U.S. Department of Agriculture.
www.agr.gc.ca
Food & Consumer Products
of Canada (FCPC)
FCPC is national, non-profit organization
representing the food and consumer products
industry in Canada.
www.fcpc.ca
Canadian Federation of
Independent Grocers
(CFIG)
CFIG represents Canada’s independently owned
and franchises supermarkets.
www.cfig.ca
Canadian Restaurant and
Foodservices
Association(CRFA)
The largest foodservice and hospitality association
in Canada.
www.crfa.ca
Centre of Food in Canada A non-profit organization addressing issues related
to food and its impact on Canadians.
www.conferenceboard.ca
Consumers' Association of
Canada
Represents consumers to all levels of government
and to all sectors of society.
www.consumer.ca
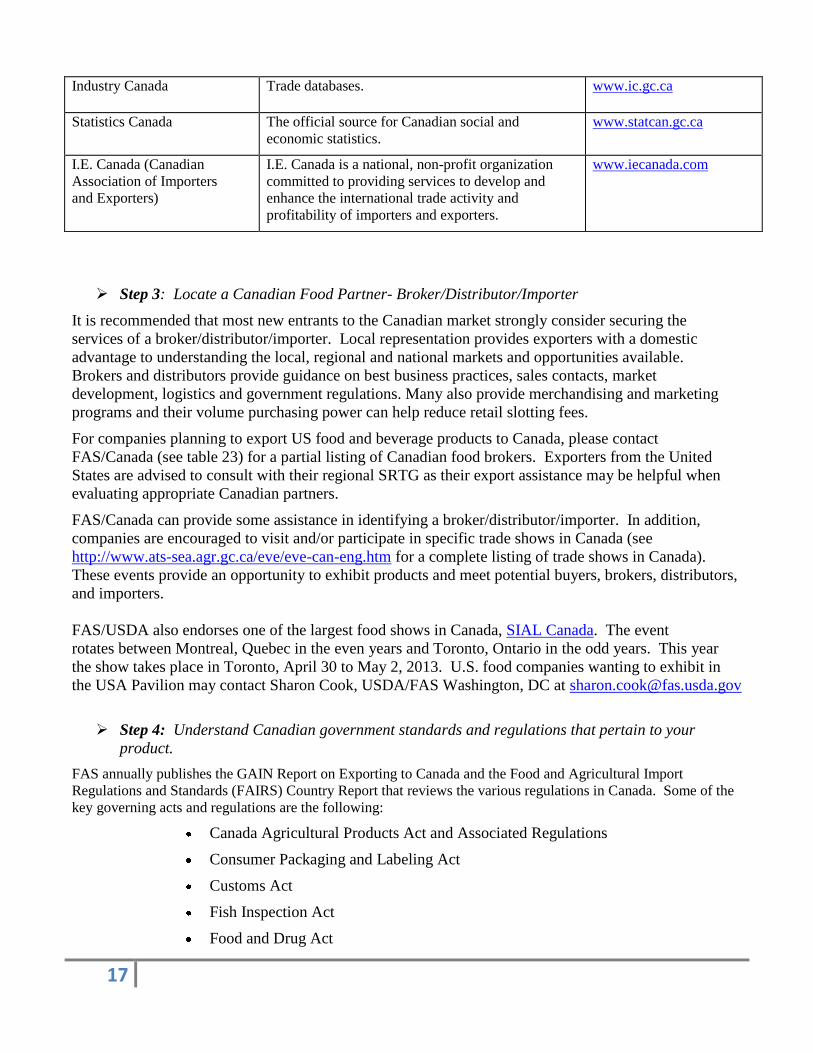
17
Industry Canada Trade databases. www.ic.gc.ca
Statistics Canada The official source for Canadian social and
economic statistics.
www.statcan.gc.ca
I.E. Canada (Canadian
Association of Importers
and Exporters)
I.E. Canada is a national, non-profit organization
committed to providing services to develop and
enhance the international trade activity and
profitability of importers and exporters.
www.iecanada.com
Step 3: Locate a Canadian Food Partner- Broker/Distributor/Importer
It is recommended that most new entrants to the Canadian market strongly consider securing the
services of a broker/distributor/importer. Local representation provides exporters with a domestic
advantage to understanding the local, regional and national markets and opportunities available.
Brokers and distributors provide guidance on best business practices, sales contacts, market
development, logistics and government regulations. Many also provide merchandising and marketing
programs and their volume purchasing power can help reduce retail slotting fees.
For companies planning to export US food and beverage products to Canada, please contact
FAS/Canada (see table 23) for a partial listing of Canadian food brokers. Exporters from the United
States are advised to consult with their regional SRTG as their export assistance may be helpful when
evaluating appropriate Canadian partners.
FAS/Canada can provide some assistance in identifying a broker/distributor/importer. In addition,
companies are encouraged to visit and/or participate in specific trade shows in Canada (see
http://www.ats-sea.agr.gc.ca/eve/eve-can-eng.htm for a complete listing of trade shows in Canada).
These events provide an opportunity to exhibit products and meet potential buyers, brokers, distributors,
and importers.
FAS/USDA also endorses one of the largest food shows in Canada, SIAL Canada. The event
rotates between Montreal, Quebec in the even years and Toronto, Ontario in the odd years. This year
the show takes place in Toronto, April 30 to May 2, 2013. U.S. food companies wanting to exhibit in
the USA Pavilion may contact Sharon Cook, USDA/FAS Washington, DC at [email protected]
Step 4: Understand Canadian government standards and regulations that pertain to your
product.
FAS annually publishes the GAIN Report on Exporting to Canada and the Food and Agricultural Import
Regulations and Standards (FAIRS) Country Report that reviews the various regulations in Canada. Some of the
key governing acts and regulations are the following:
Canada Agricultural Products Act and Associated Regulations
Consumer Packaging and Labeling Act
Customs Act
Fish Inspection Act
Food and Drug Act
18
Importation of Intoxicating Liquors Act
Meat Inspection Act
Weight and Measures Act
Canadian agents, distributors, brokers, and/or importers are often the best equipped to assist exporters
through the import regulatory process. The best entry method depends on the food product and the sub-
sector identified as appropriate for each food product. Government and industry import policies and
trade acts regulate each sub-sector. Each U.S. export opportunity must be thoroughly investigated
relative to the legislation that exists for the product requesting entry.
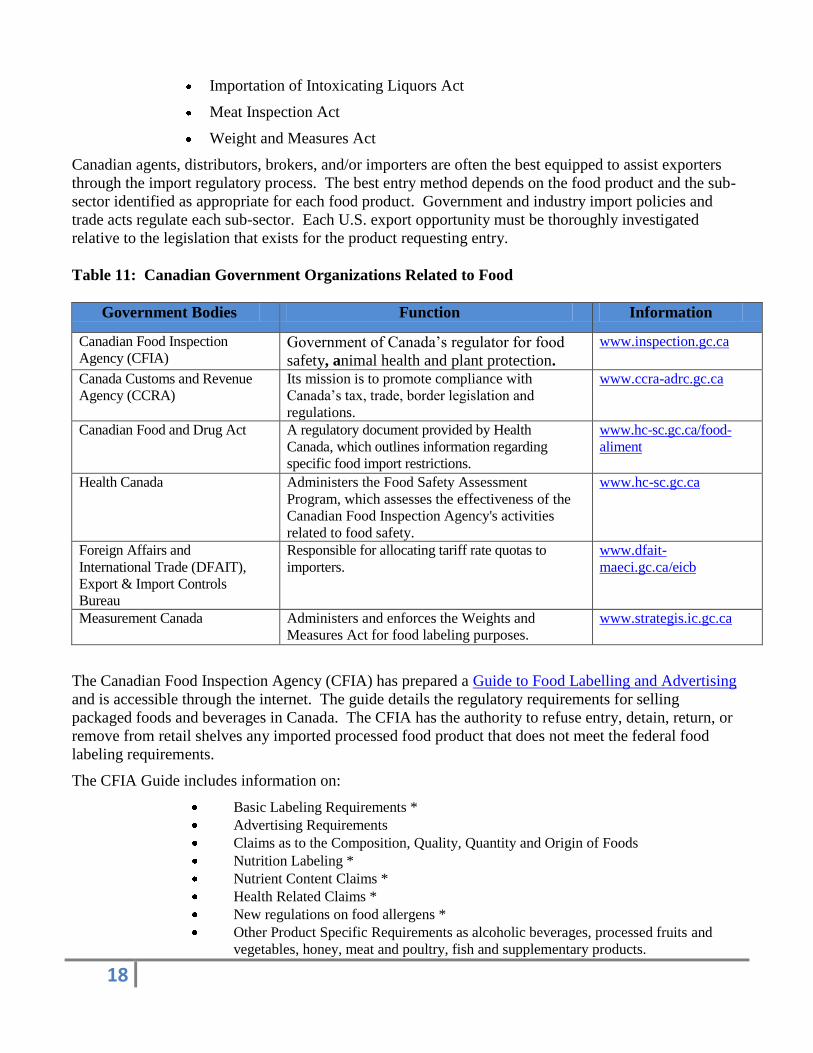
Table 11: Canadian Government Organizations Related to Food
Government Bodies Function Information
Canadian Food Inspection
Agency (CFIA) Government of Canada’s regulator for food
safety, animal health and plant protection.
www.inspection.gc.ca
Canada Customs and Revenue
Agency (CCRA) Its mission is to promote compliance with
Canada’s tax, trade, border legislation and
regulations.
www.ccra-adrc.gc.ca
Canadian Food and Drug Act A regulatory document provided by Health
Canada, which outlines information regarding
specific food import restrictions.
www.hc-sc.gc.ca/food-
aliment
Health Canada Administers the Food Safety Assessment
Program, which assesses the effectiveness of the
Canadian Food Inspection Agency's activities
related to food safety.
www.hc-sc.gc.ca
Foreign Affairs and
International Trade (DFAIT),
Export & Import Controls
Bureau
Responsible for allocating tariff rate quotas to
importers.
www.dfait-
maeci.gc.ca/eicb
Measurement Canada Administers and enforces the Weights and
Measures Act for food labeling purposes.
www.strategis.ic.gc.ca
The Canadian Food Inspection Agency (CFIA) has prepared a Guide to Food Labelling and Advertising
and is accessible through the internet. The guide details the regulatory requirements for selling
packaged foods and beverages in Canada. The CFIA has the authority to refuse entry, detain, return, or
remove from retail shelves any imported processed food product that does not meet the federal food
labeling requirements.
The CFIA Guide includes information on:
Basic Labeling Requirements *
Advertising Requirements
Claims as to the Composition, Quality, Quantity and Origin of Foods
Nutrition Labeling *
Nutrient Content Claims *
Health Related Claims *
New regulations on food allergens *
Other Product Specific Requirements as alcoholic beverages, processed fruits and
vegetables, honey, meat and poultry, fish and supplementary products.
19
*Regulations differ from the United States and require adherence for retail sales in Canada.
For more information on food labeling regulations and other information useful to U.S. food exporters,
refer to the Export Guide: A Practical Guide on Canada available online at: http://gain.fas.usda.gov.
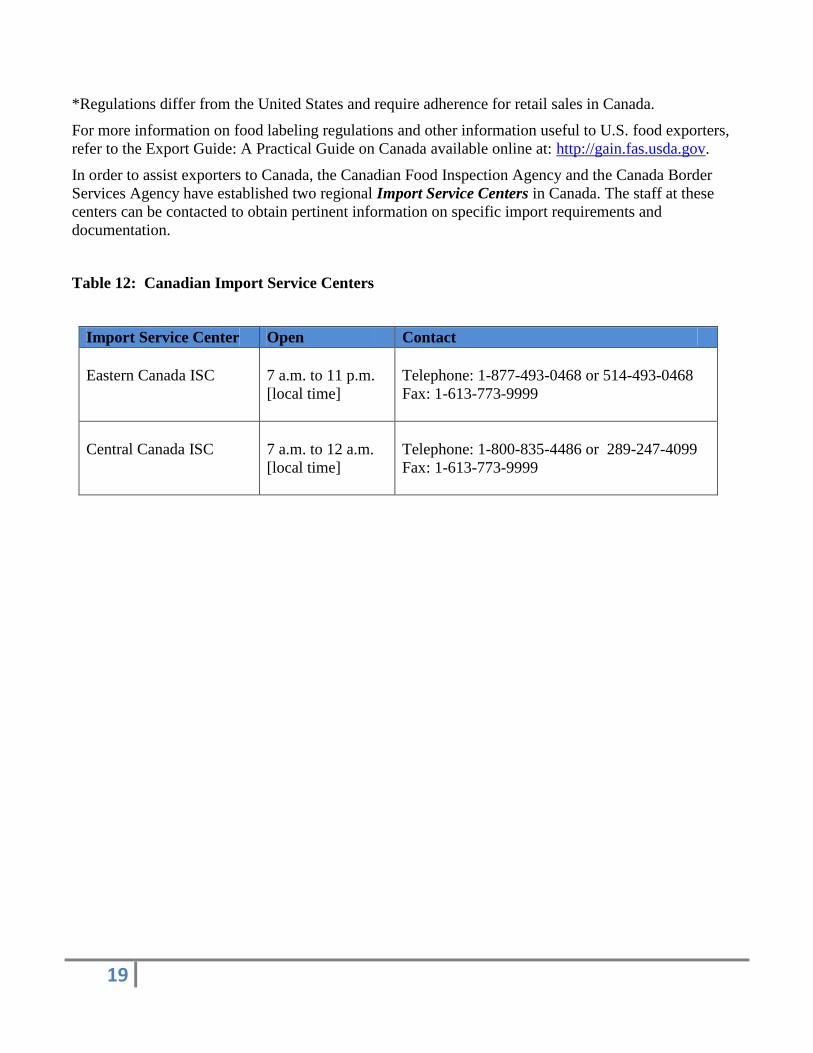
In order to assist exporters to Canada, the Canadian Food Inspection Agency and the Canada Border
Services Agency have established two regional Import Service Centers in Canada. The staff at these
centers can be contacted to obtain pertinent information on specific import requirements and
documentation.
Table 12: Canadian Import Service Centers
Import Service Center Open Contact
Eastern Canada ISC
7 a.m. to 11 p.m.
[local time]
Telephone: 1-877-493-0468 or 514-493-0468
Fax: 1-613-773-9999
Central Canada ISC
7 a.m. to 12 a.m.
[local time]
Telephone: 1-800-835-4486 or 289-247-4099
Fax: 1-613-773-9999
20
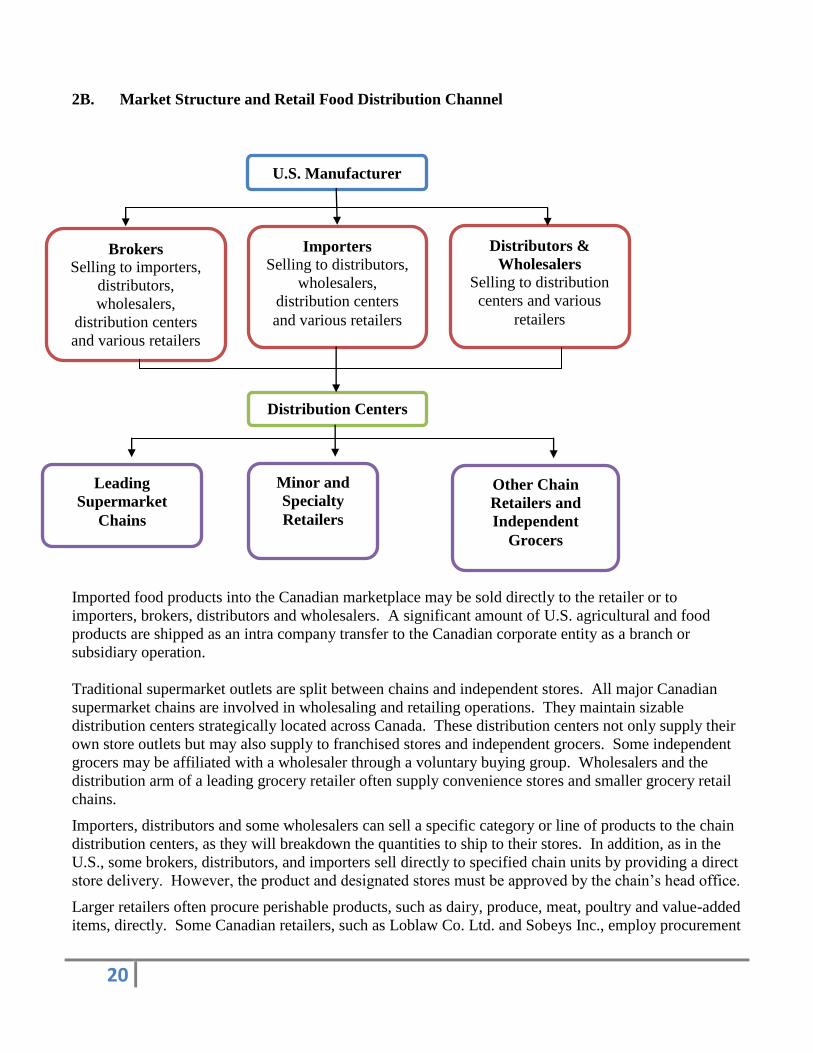
2B. Market Structure and Retail Food Distribution Channel
Imported food products into the Canadian marketplace may be sold directly to the retailer or to
importers, brokers, distributors and wholesalers. A significant amount of U.S. agricultural and food
products are shipped as an intra company transfer to the Canadian corporate entity as a branch or
subsidiary operation.
Traditional supermarket outlets are split between chains and independent stores. All major Canadian
supermarket chains are involved in wholesaling and retailing operations. They maintain sizable
distribution centers strategically located across Canada. These distribution centers not only supply their
own store outlets but may also supply to franchised stores and independent grocers. Some independent
grocers may be affiliated with a wholesaler through a voluntary buying group. Wholesalers and the
distribution arm of a leading grocery retailer often supply convenience stores and smaller grocery retail
chains.
Importers, distributors and some wholesalers can sell a specific category or line of products to the chain
distribution centers, as they will breakdown the quantities to ship to their stores. In addition, as in the
U.S., some brokers, distributors, and importers sell directly to specified chain units by providing a direct
store delivery. However, the product and designated stores must be approved by the chain’s head office.
Larger retailers often procure perishable products, such as dairy, produce, meat, poultry and value-added
items, directly. Some Canadian retailers, such as Loblaw Co. Ltd. and Sobeys Inc., employ procurement
U.S. Manufacturer
Brokers Selling to importers,
distributors,
wholesalers,
distribution centers
and various retailers
Importers
Selling to distributors,
wholesalers,
distribution centers
and various retailers
Distributors &
Wholesalers
Selling to distribution
centers and various
retailers
Distribution Centers
Leading
Supermarket
Chains
Minor and
Specialty
Retailers
Other Chain
Retailers and
Independent
Grocers
21
offices in the United States for this purpose. On the grocery side of the business, most retailers rely on
brokers, importers and distributors, particularly to identify unique products to sell in their stores.
Both retailers and suppliers are seeking efficiencies to reduce costs in their operations. Among some of
the strategies is reducing the number of vendors that category buyers work with. In response to this
trend, the broker/distributor industry is making efforts to consolidate products while introducing unique
novel products into the market. Larger firms are purchasing smaller brokers/distributors to offer
national coverage, while regional organizations are forming alliances across the country to stay
competitive by securing national coverage. Brokers and distributors focus on selling to the appropriate
category buyer of a head office. Larger brokerage or distribution firms offer merchandising services to
help in monitoring product movement and placement, as smaller companies will outsource these
services.
Consolidation in the food distribution sector has an important impact on the rest of the agri-food system
as fewer buyers control more of the business through selected suppliers. This may place greater
pressure on suppliers to deliver quality products at lower prices as well as continuously updating the
product line with new offerings.
The food distribution sector is playing an increasingly important role in the Canadian agri-food sector by
generating significant economic activity and contributing to the provision of one of the world's most
affordable food supply system.
Today’s growing non-traditional channels are forcing brokers/distributors to focus on specialized sales
teams to call on drug stores, c-stores, grocery stores (g-stores) clubs and mass merchandisers.
Furthermore, with new technologies being introduced at the home office and store level, some brokerage
and distribution firms are offering value-added services to their suppliers/principals. Services such as
promotional and sampling support, merchandising, computerized ordering, logistical support, and data
collection remain competitive in the market.
To partner with a broker/distributor, food manufacturers pay a percentage of the product sales revenue.
Fees can range from 3% to 10% depending on the volume and the amount of time and labor is required.
The percentages are influenced by several factors: the type of product line, expected sales volume,
additional special services such as planning promotions or data collection. Pioneering new product lines
may have a monthly retainer fees until the products generate enough sales volume to switch to a
percentage-of-sales format. All fees are negotiated between the principal and the broker prior to future
transactions.
In trying to introduce a new product and obtain a product listing, a broker will call on the head office of
key store chains and wholesale groups. Once a product listing is secured, there may be a listing fee on
new products unless the retailer views the product as a “must have” item. This fee will vary and will be
determined by the product’s uniqueness, the demand for the item, along with the advertising and
promotional expenditures required to launch the product in a store.
i. Retail Sub Sectors
Grocery Stores/Supermarkets/Superstores, Club Warehouse Outlets and Mass Merchandisers
The majority of retail foods continue to be sold through Canada’s traditional grocery retailers.
Canadian-based retailers Loblaw Co., Ltd., The Empire Company Ltd. (referred to as Sobeys’s) and
Metro Inc., are responsible for 43% of retail food sales in the country. These market leaders have
positioned themselves as the food specialists over their mass-merchandising competitors. They offer
discount banner stores that compete with some of the merchandisers. In the last year, the price
22
differential on certain foods has been minimal among stores, indicating retailers are responding to a
price conscious Canadian shopper. All three companies have been aggressive in developing their
private label brands, including their discounted private label. In the coming year, it is forecasted that
these retail leaders will aggressively compete with one another by offering discount promotions and
enticing shoppers with customer loyalty programs that offer award points and specials on groceries.
Loblaw Company Limited is the largest grocery retailer in the country with 1,027 stores across the
country and 20% share of the food market. The company’s 22 banner stores cover the complete
spectrum in types of stores as they include: large Superstores selling one third general merchandise
products, conventional supermarkets, discount units, convenience and club stores. Loblaw’s reported
they attracted 14 million customers to their stores in 2010. The company has earned a strategic
advantage among their competitors with their control-label brands or more commonly referred to their
private label brands. Some of their brands compete head-to-head with the national brands. Last year
management launched over 1,200 new control brand products. Among their 13 private label brands,
their most recognizable are “President’s Choice (PC)” and the “No Name’ brand representing over 5,200
products. (As a note of interest selected PC brands are now widely distributed in certain regions in the
U.S.) On the high end of the price spectrum, Loblaws offers its “Black Label” products which primarily
include specialty products, such as artisan-style croutons and cherry shiraz jelly. While at the other end,
the retailer offers their “No Name” brand to compete with rising food prices and competition. During
the 2012 holiday season this discounted brand was aggressively promoted in large urban centers through
television advertisements. In addition, the company has invested more than $ 700 million in store
improvements on 200 of their existing retail units. Some of the improvements included added floor
space to their produce and seafood departments, along with more counter space for meals on the go. To
reach the growing Asian market, Loblaws acquired T & T Supermarkets in Canada in 2009. The stores
offer Asian food products not found elsewhere. Today, there are 22 stores, primarily located in British
Columbia and in Ontario.
Today, Sobeys, is behind Loblaws with 13% share of the retail market; however, they offer more stores
than its leading competitor; 1,334 locations across the country. Between 2008 and 2011, the company
reported a 14% growth rate. In 2011, their sales topped over $ 16 billion. The company’s success has
largely been attributed to real estate choices and responding to the country’s changing demographics.
For example, with Canada’s population residing in dense urban areas, along with the growing number of
single and double person households, Sobeys introduced a new banner store called ‘Urban Fresh.” The
stores are smaller but efficient. They are located in high traffic neighborhoods next to high-rise
apartments and condominiums, catering to singles and smaller families living in downtown areas.
Sobeys also moved to expand its private label category and now offers seven brands with their
“Sensations Complements” line being the most recognizable on their store shelves. To capture the
ethnic and discount shopper, Sobeys moved to rebrand their former banner store, “Price Shopper” and
converted the stores to “FreschCo” in 2010. The new stores were redesigned to display more produce,
baked goods and meats as well as provide more shelf space to ethnic packaged goods. Lastly, the
forecast for increased sales looks promising for Sobeys as its wholesale division will become the
primary supplier of frozen, dairy and dry goods to Target Canada.
Metro Inc., represents 9% of the market as they operate a total 564 food stores, along with 257 drug and
convenience stores in Ontario and Quebec. The conventional supermarkets make up most of Metro’s
portfolio of stores however the company also operates discount stores under the Food Basics banner in
Ontario and Super C in Quebec. The company as well, increased their number of private label products
under the “Irrestibles” and “Selection” brands. To attract shoppers with food allergens, Metro Inc.,
partnered with the Quebec Association of Food Allergies (AQAA) to identify certain Metro brands as
23
“Certified Allergen Control” (CAC) products. Metro recently partnered with Quebec based Marche
Adonis, an ethnic food retailer offering Mediterranean style foods. The company intends to open stores
in the Ontario markets and capture more business from the growing ethnic market.
Although, Loblaws, Sobeys and Metro continue to be the market leaders, there are regional stores that
should not be overlooked. They are U.S. based Canada Safeway and Overwaitea Food Group in
Western Canada, along with Federated Co-ops stores in Alberta. Many of these retailers are also
moving forward with similar corporate strategies that reflect the changing demographics in the country.
For instance, Overwaitea Food Group with 124 stores offers an impressive selection of international
foods that includes 7,000 Asian food products to its customers. There are some regional based grocery
chains that have a loyal customer base and have aggressively opened up stores in downtown locations as
family owned firm, Longo’s. This past November Longo’s opened up its 26th
store in the Greater
Toronto Area (GTA). The latest store includes cooking classes and a full-service restaurant on its 48,000
square foot premise.
Warehouse Clubs stores such as Costco Canada have left a permanent foothold in Canada’s retail
landscape. With fewer weekly shopping trips made by Canadians, some shoppers, particularly younger
shoppers prefer the convenience of loading up on their groceries even if it means spending more on their
grocery bill in a single store visit. The warehouse format does not offer many frills but does offer
competitive prices by buying larger quantities directly from manufacturers. Club products carry an
average profit margin of about 11 percent, while other retailers mark up their goods anywhere from 25
to 50%. Stores such as Costco actively engage their customers by sampling all kinds of food products in
their stores on a regular basis.
Walmart Canada is the largest mass merchandiser in the country. In comparison to the market leaders,
the company’s share of the grocery receipts is only six percent. However, food sales grew exponentially
for Walmart Canada from $ 130 million in 2006 to $5.2 billion in 2011. A significant gain was made in
the last two years as they introduced frozen foods and produce in their stores, making it convenient for
time conscious shoppers to pick up all their items in a single shopping trip.
Target Canada, another merchandising giant, is to set to open 126 stores in 2013 with the first stores
opening in Ontario and Alberta. In addition to providing produce and chilled/frozen foods in their stores,
Target will offer both the national brands and their store brands called “Market Pantry” and “Archer
Farms.” Canadian Grocer forecasts that in its first few months, Target’s priority will likely not be on
food. However, competitors’ remain watchful as Target’s food and pet supplies categories have grown
by 5% in the last four years in the United States, and Target will surely put pressure on Canadian
grocery prices.
ii. Convenience Stores, Mini Marts, and Gas Stations
The Canadian Convenience Store Association reported 10.4 million visits are made each day to
Canada’s 23,000 convenience stores and gas stations. The sector is expected to continue to grow at a
steady pace. This growth has attracted newcomers and forced players to reinvent themselves to keep
their position in the market. Floor space for food products such as sushi, baked goods and snacks is
growing as many stores are expanding their premises to accommodate the increasing number of products
and services. The focus has been on equipment to prepare and stock high quality convenience foods,
particularly chilled items such as soft drinks. Much like the trend in the supermarket sector, products
that are perceived to be healthy are now becoming readily available in these types of stores.

24
iii. Drug Chains
Grocery sales through the drug stores remains small in comparison to the other retail channels however,
a few drug store chains have expanded their grocery section and will continue to increase their food
sales. Although, food prices are for the most part higher in drug stores, retailers such as Shoppes Drug
Mart have been aggressive in offering price specials on items like boxed cereal and other basic
groceries. These tactics are done to capture more food dollars from their regular shoppers.
The following table lists the leading retail chains and their major respective banner store as reported at
the end of 2011.
Provinces Abbreviations:
AB: Alberta
BC: British Columbia
MB: Manitoba
NB: New Brunswick
NL: Newfoundland and Labrador
NWT: Northwest Territories
NS: Nova Scotia
NU: Nunavut
ON: Ontario
PE: Prince Edward Island
QC: Quebec
SK: Saskatchewan YT: Yukon
Canadian Regions:
Eastern: NB, NS, PEI, NL
Central: ON & QC
Western and Prairies: AB, BC, MB, SK
Store Type:
SS: Superstore
SM:Supermarket
SC: Super Centre
C: Convenience
Price Category:
D: Discount
L: Low
M: Medium
W: Wholesale
U: Upper
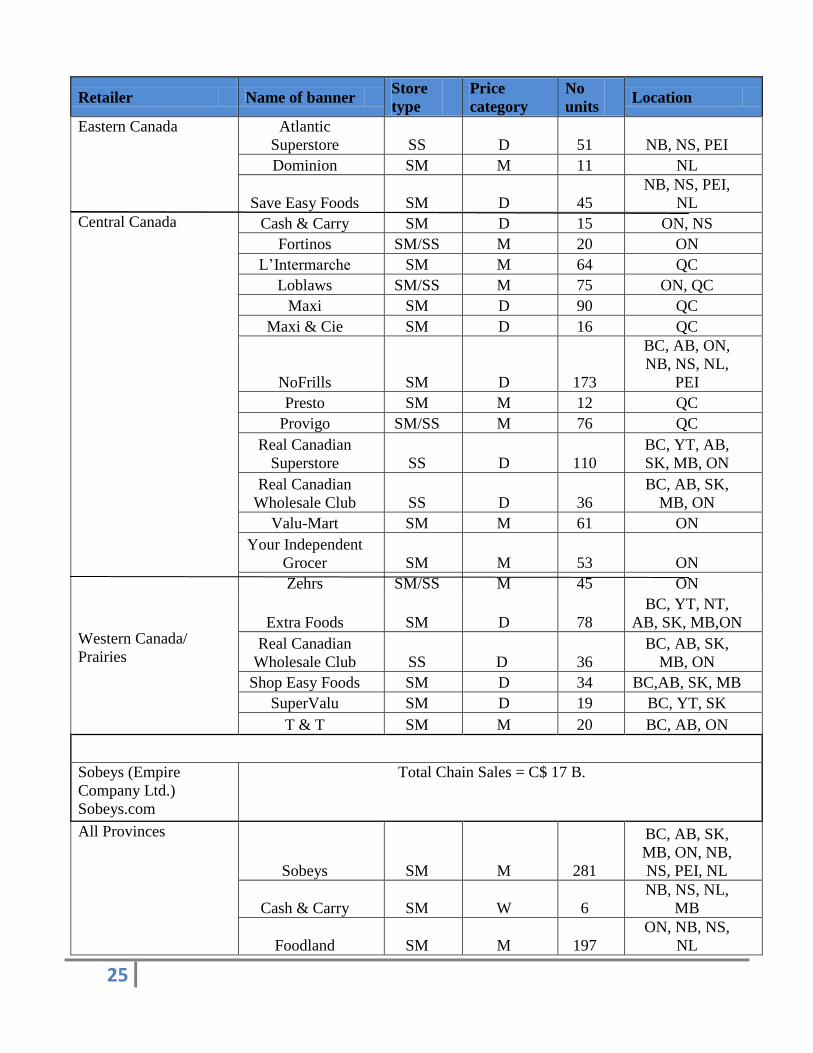
Table 13: Grocery Stores/Supermarkets/Superstores Banners
Retailer Name of banner Store
type
Price
category
No
units Location
Loblaw Companies
Ltd.
loblaw.ca
Total Chain Sales = C$ 32.4 B.
25
Retailer Name of banner Store
type
Price
category
No
units Location
Eastern Canada Atlantic
Superstore SS D 51 NB, NS, PEI
Dominion SM M 11 NL
Save Easy Foods SM D 45
NB, NS, PEI,
NL
Central Canada
Cash & Carry SM D 15 ON, NS
Fortinos SM/SS M 20 ON
L’Intermarche SM M 64 QC
Loblaws SM/SS M 75 ON, QC
Maxi SM D 90 QC
Maxi & Cie SM D 16 QC
NoFrills SM D 173
BC, AB, ON,
NB, NS, NL,
PEI
Presto SM M 12 QC
Provigo SM/SS M 76 QC
Real Canadian
Superstore SS D 110
BC, YT, AB,
SK, MB, ON
Real Canadian
Wholesale Club SS D 36
BC, AB, SK,
MB, ON
Valu-Mart SM M 61 ON
Your Independent
Grocer SM M 53 ON
Zehrs SM/SS M 45 ON
Western Canada/
Prairies
Extra Foods SM D 78
BC, YT, NT,
AB, SK, MB,ON
Real Canadian
Wholesale Club SS D 36
BC, AB, SK,
MB, ON
Shop Easy Foods SM D 34 BC,AB, SK, MB
SuperValu SM D 19 BC, YT, SK
T & T SM M 20 BC, AB, ON
Sobeys (Empire
Company Ltd.)
Sobeys.com
Total Chain Sales = C$ 17 B.
All Provinces
Sobeys SM M 281
BC, AB, SK,
MB, ON, NB,
NS, PEI, NL
Cash & Carry SM W 6
NB, NS, NL,
MB
Foodland SM M 197
ON, NB, NS,
NL
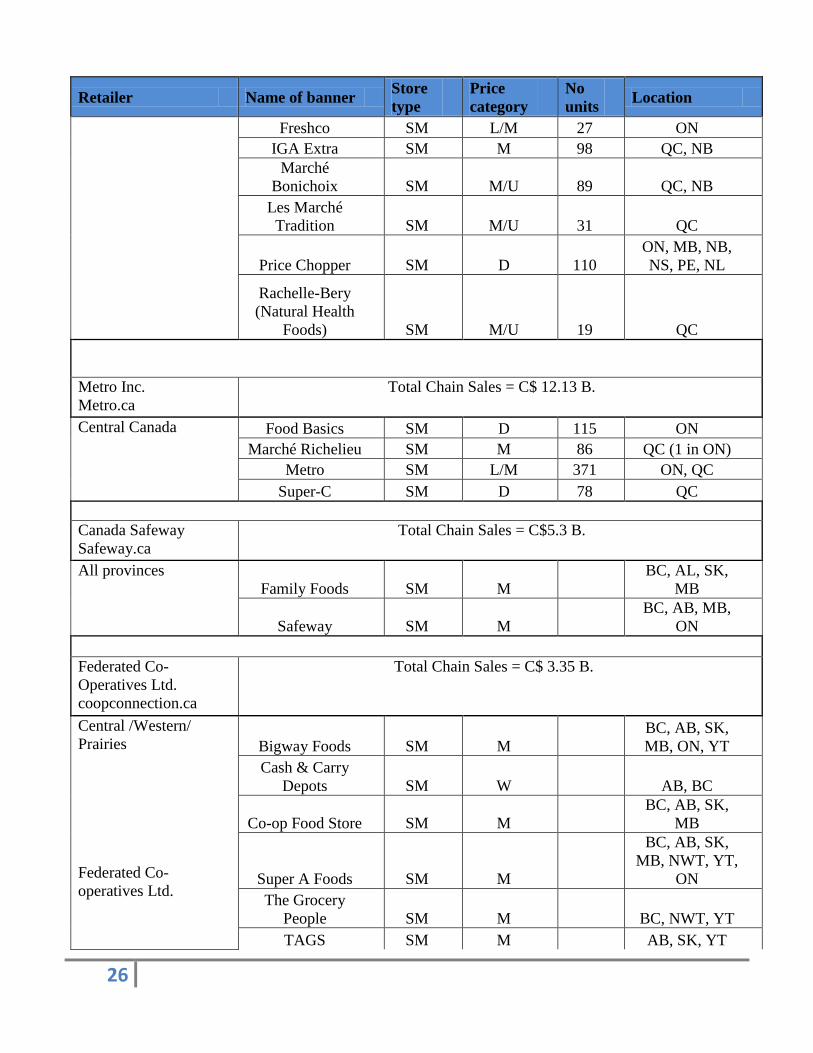
26
Retailer Name of banner Store
type
Price
category
No
units Location
Freshco SM L/M 27 ON
IGA Extra SM M 98 QC, NB
Marché
Bonichoix SM M/U 89 QC, NB
Les Marché
Tradition SM M/U 31 QC
Price Chopper SM D 110
ON, MB, NB,
NS, PE, NL
Rachelle-Bery
(Natural Health
Foods) SM M/U 19 QC
Metro Inc.
Metro.ca
Total Chain Sales = C$ 12.13 B.
Central Canada Food Basics SM D 115 ON
Marché Richelieu SM M 86 QC (1 in ON)
Metro SM L/M 371 ON, QC
Super-C SM D 78 QC
Canada Safeway
Safeway.ca
Total Chain Sales = C$5.3 B.
All provinces
Family Foods SM M
BC, AL, SK,
MB
Safeway SM M
BC, AB, MB,
ON
Federated Co-
Operatives Ltd.
coopconnection.ca
Total Chain Sales = C$ 3.35 B.
Central /Western/
Prairies
Federated Co-
operatives Ltd.
Bigway Foods SM M
BC, AB, SK,
MB, ON, YT
Cash & Carry
Depots SM W AB, BC
Co-op Food Store SM M
BC, AB, SK,
MB
Super A Foods SM M
BC, AB, SK,
MB, NWT, YT,
ON
The Grocery
People SM M BC, NWT, YT
TAGS SM M AB, SK, YT
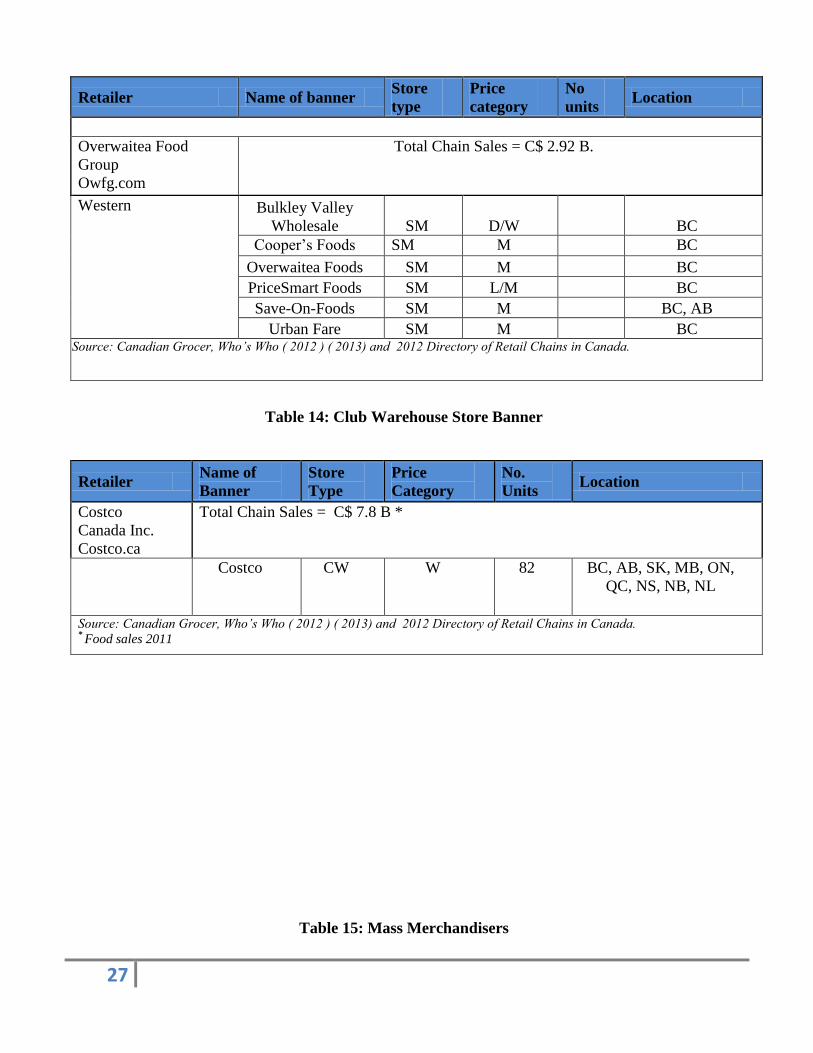
27
Retailer Name of banner Store
type
Price
category
No
units Location
Overwaitea Food
Group
Owfg.com
Total Chain Sales = C$ 2.92 B.
Western Bulkley Valley
Wholesale SM D/W BC
Cooper’s Foods SM M BC
Overwaitea Foods SM M BC
PriceSmart Foods SM L/M BC
Save-On-Foods SM M BC, AB
Urban Fare SM M BC Source: Canadian Grocer, Who’s Who ( 2012 ) ( 2013) and 2012 Directory of Retail Chains in Canada.
Table 14: Club Warehouse Store Banner
Retailer Name of
Banner
Store
Type
Price
Category
No.
Units Location
Costco
Canada Inc.
Costco.ca
Total Chain Sales = C$ 7.8 B *
Costco CW W 82 BC, AB, SK, MB, ON,
QC, NS, NB, NL
Source: Canadian Grocer, Who’s Who ( 2012 ) ( 2013) and 2012 Directory of Retail Chains in Canada. * Food sales 2011
Table 15: Mass Merchandisers

28
Table 16: Convenience Stores, Mini Marts, and Gas Stations
Retailer Name
Banner
Store
Type
Price
Category
Sales
(C$ 000)
No. Units Location
Canadian Tire
Corporation Canadian
Tire
MM MM 10C$10.3 B. 487 All
provinces
Dollar Tree
Canada Dollar Giant MM D N/A 101 BC, AB,
SK, MB,
ON
Dollarama
Stores Dollarama MM D C$ 1.4 B. 667 All
provinces,
mostly ON
and QC
Giant Tiger
Stores Giant Tiger MM D C$ 1.4 B. 196 All
provinces
The Northwest
Company
Northern MM M C$ 1.4 B. 196 All
provinces North Marts L/M
QuickStop L/M
Wal-Mart
Canada
Corporation
Wal-mart MM/SC D C$ 5.2 B. *
328 All
provinces Supercenters D 146
Zellers Inc.- A
Division of
Hudson’s Bay
Company
Zellars MM L/M C$ 5.9 B 279 All
provinces
Source: Canadian Grocer, Who’s Who 2012 and 2012 Directory of Retail Chains in Canada * Food sales 2011
Retailer Name of Banner Sales
(C$
000)
No. Units Location
29
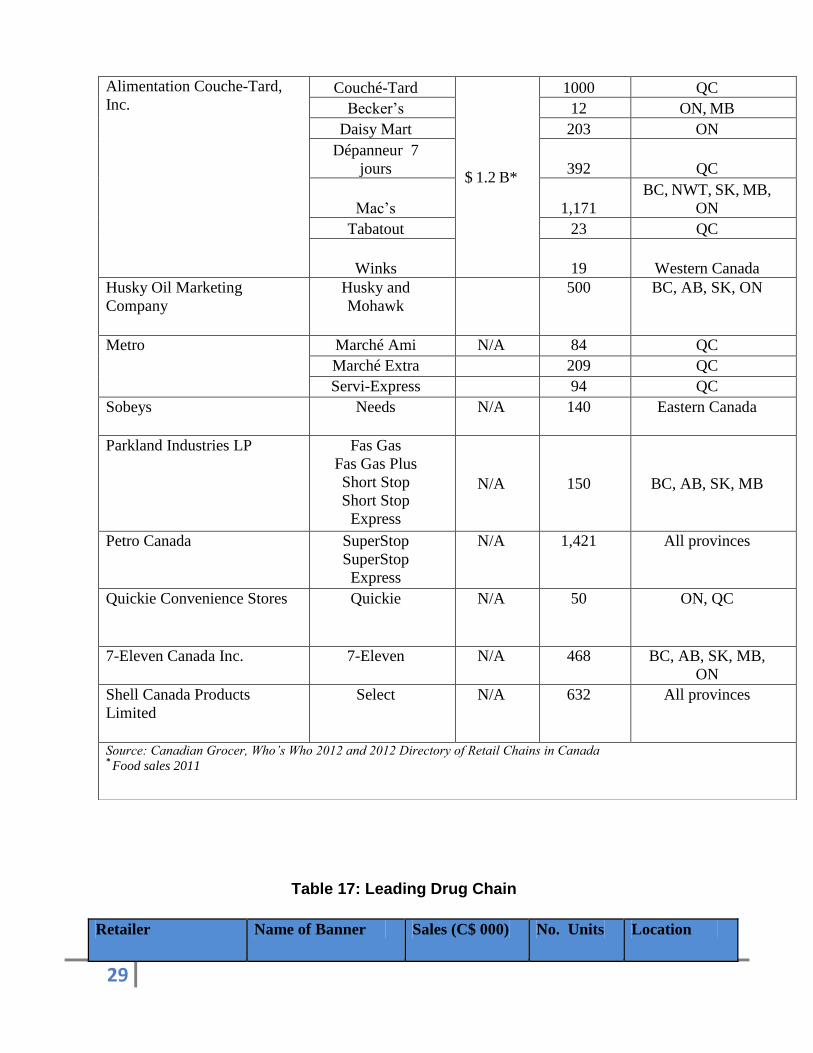
Table 17: Leading Drug Chain
Alimentation Couche-Tard,
Inc. Couché-Tard
$ 1.2 B*
1000 QC
Becker’s 12 ON, MB
Daisy Mart 203 ON
Dépanneur 7
jours 392 QC
Mac’s 1,171
BC, NWT, SK, MB,
ON
Tabatout 23 QC
Winks 19 Western Canada
Husky Oil Marketing
Company
Husky and
Mohawk
500 BC, AB, SK, ON
Metro Marché Ami N/A 84 QC
Marché Extra 209 QC
Servi-Express 94 QC
Sobeys Needs N/A 140 Eastern Canada
Parkland Industries LP Fas Gas
Fas Gas Plus
Short Stop
Short Stop
Express
N/A 150 BC, AB, SK, MB
Petro Canada SuperStop
SuperStop
Express
N/A 1,421 All provinces
Quickie Convenience Stores Quickie N/A 50 ON, QC
7-Eleven Canada Inc. 7-Eleven N/A 468 BC, AB, SK, MB,
ON
Shell Canada Products
Limited
Select N/A 632 All provinces
Source: Canadian Grocer, Who’s Who 2012 and 2012 Directory of Retail Chains in Canada * Food sales 2011
Retailer Name of Banner Sales (C$ 000) No. Units Location
30
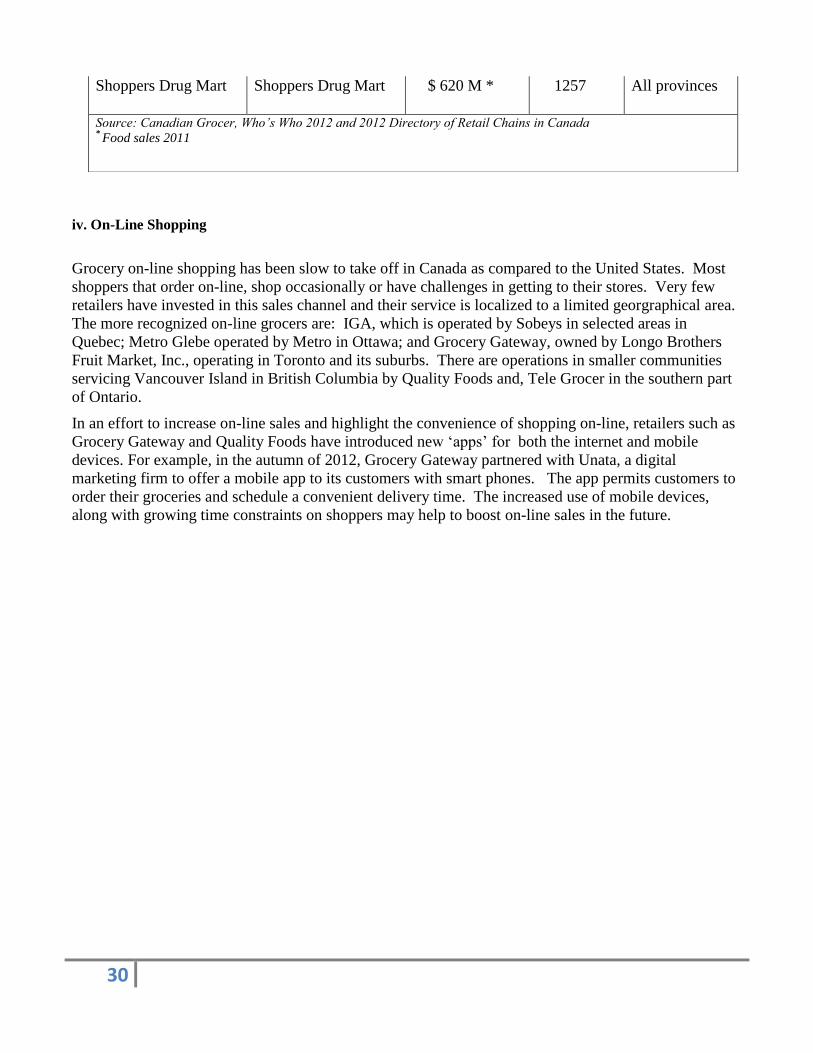
iv. On-Line Shopping
Grocery on-line shopping has been slow to take off in Canada as compared to the United States. Most
shoppers that order on-line, shop occasionally or have challenges in getting to their stores. Very few
retailers have invested in this sales channel and their service is localized to a limited georgraphical area.
The more recognized on-line grocers are: IGA, which is operated by Sobeys in selected areas in
Quebec; Metro Glebe operated by Metro in Ottawa; and Grocery Gateway, owned by Longo Brothers
Fruit Market, Inc., operating in Toronto and its suburbs. There are operations in smaller communities
servicing Vancouver Island in British Columbia by Quality Foods and, Tele Grocer in the southern part
of Ontario.
In an effort to increase on-line sales and highlight the convenience of shopping on-line, retailers such as
Grocery Gateway and Quality Foods have introduced new ‘apps’ for both the internet and mobile
devices. For example, in the autumn of 2012, Grocery Gateway partnered with Unata, a digital
marketing firm to offer a mobile app to its customers with smart phones. The app permits customers to
order their groceries and schedule a convenient delivery time. The increased use of mobile devices,
along with growing time constraints on shoppers may help to boost on-line sales in the future.
Shoppers Drug Mart Shoppers Drug Mart $ 620 M * 1257 All provinces
Source: Canadian Grocer, Who’s Who 2012 and 2012 Directory of Retail Chains in Canada * Food sales 2011
31
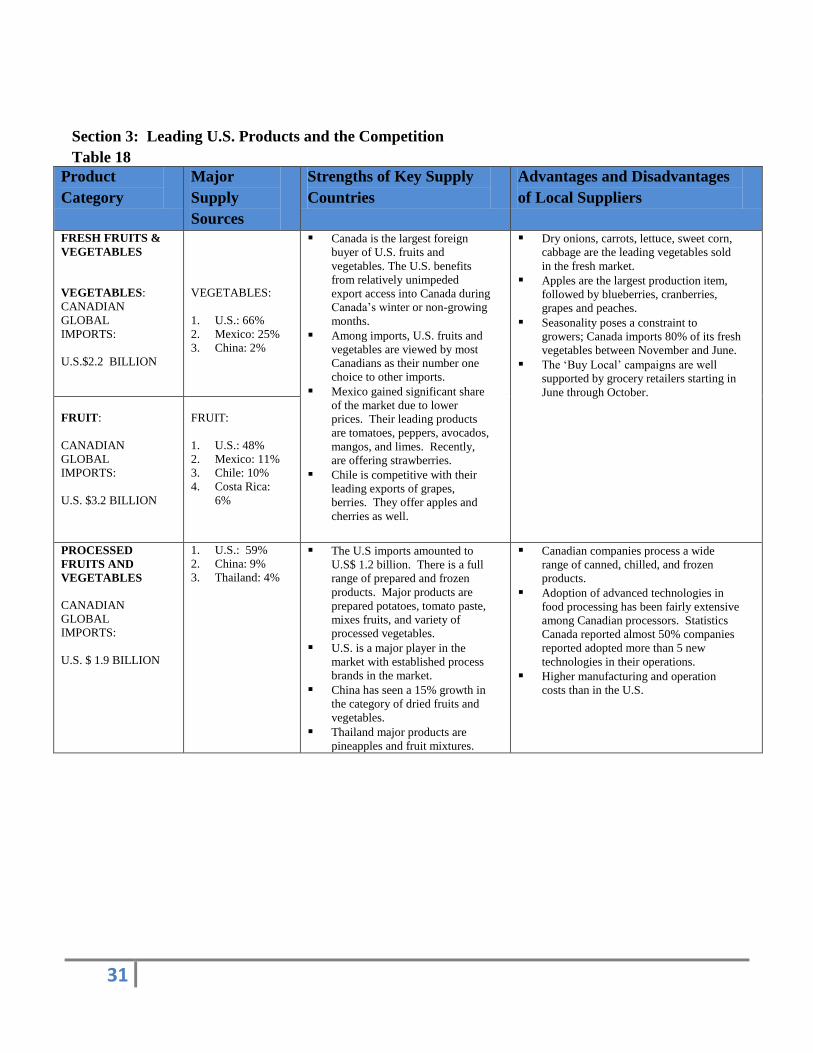
Section 3: Leading U.S. Products and the Competition
Table 18
Product
Category
Major
Supply
Sources
Strengths of Key Supply
Countries
Advantages and Disadvantages
of Local Suppliers
FRESH FRUITS &
VEGETABLES
VEGETABLES:
CANADIAN
GLOBAL
IMPORTS:
U.S.$2.2 BILLION
VEGETABLES:
1. U.S.: 66%
2. Mexico: 25%
3. China: 2%
Canada is the largest foreign
buyer of U.S. fruits and
vegetables. The U.S. benefits
from relatively unimpeded
export access into Canada during
Canada’s winter or non-growing
months.
Among imports, U.S. fruits and
vegetables are viewed by most
Canadians as their number one
choice to other imports.
Mexico gained significant share
of the market due to lower
prices. Their leading products
are tomatoes, peppers, avocados,
mangos, and limes. Recently,
are offering strawberries.
Chile is competitive with their
leading exports of grapes,
berries. They offer apples and
cherries as well.
Dry onions, carrots, lettuce, sweet corn,
cabbage are the leading vegetables sold
in the fresh market.
Apples are the largest production item,
followed by blueberries, cranberries,
grapes and peaches.
Seasonality poses a constraint to
growers; Canada imports 80% of its fresh
vegetables between November and June.
The ‘Buy Local’ campaigns are well
supported by grocery retailers starting in
June through October.
FRUIT:
CANADIAN
GLOBAL
IMPORTS:
U.S. $3.2 BILLION
FRUIT:
1. U.S.: 48%
2. Mexico: 11%
3. Chile: 10%
4. Costa Rica:
6%
PROCESSED
FRUITS AND
VEGETABLES
CANADIAN
GLOBAL
IMPORTS:
U.S. $ 1.9 BILLION
1. U.S.: 59%
2. China: 9%
3. Thailand: 4%
The U.S imports amounted to
U.S$ 1.2 billion. There is a full
range of prepared and frozen
products. Major products are
prepared potatoes, tomato paste,
mixes fruits, and variety of
processed vegetables.
U.S. is a major player in the
market with established process
brands in the market.
China has seen a 15% growth in
the category of dried fruits and
vegetables.
Thailand major products are
pineapples and fruit mixtures.
Canadian companies process a wide
range of canned, chilled, and frozen
products.
Adoption of advanced technologies in
food processing has been fairly extensive
among Canadian processors. Statistics
Canada reported almost 50% companies
reported adopted more than 5 new
technologies in their operations.
Higher manufacturing and operation
costs than in the U.S.
32
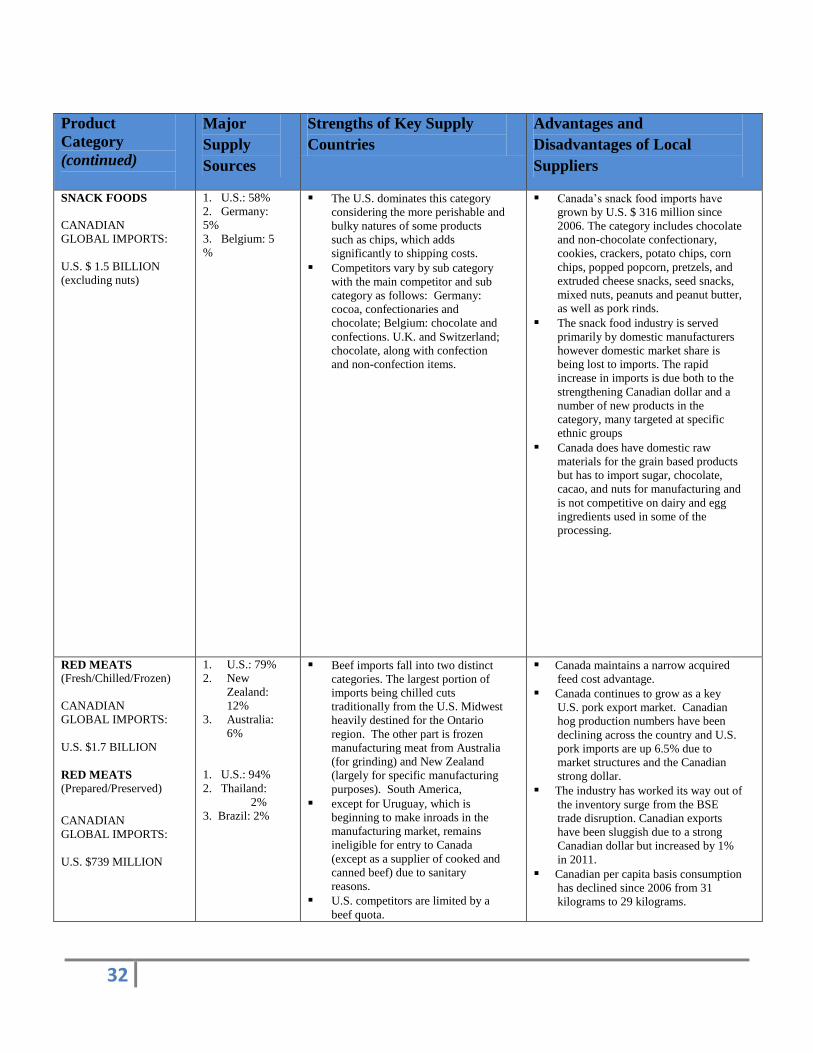
Product
Category
(continued)
Major
Supply
Sources
Strengths of Key Supply
Countries
Advantages and
Disadvantages of Local
Suppliers
SNACK FOODS
CANADIAN
GLOBAL IMPORTS:
U.S. $ 1.5 BILLION
(excluding nuts)
1. U.S.: 58%
2. Germany:
5%
3. Belgium: 5
%
The U.S. dominates this category
considering the more perishable and
bulky natures of some products
such as chips, which adds
significantly to shipping costs.
Competitors vary by sub category
with the main competitor and sub
category as follows: Germany:
cocoa, confectionaries and
chocolate; Belgium: chocolate and
confections. U.K. and Switzerland;
chocolate, along with confection
and non-confection items.
Canada’s snack food imports have
grown by U.S. $ 316 million since
2006. The category includes chocolate
and non-chocolate confectionary,
cookies, crackers, potato chips, corn
chips, popped popcorn, pretzels, and
extruded cheese snacks, seed snacks,
mixed nuts, peanuts and peanut butter,
as well as pork rinds.
The snack food industry is served
primarily by domestic manufacturers
however domestic market share is
being lost to imports. The rapid
increase in imports is due both to the
strengthening Canadian dollar and a
number of new products in the
category, many targeted at specific
ethnic groups
Canada does have domestic raw
materials for the grain based products
but has to import sugar, chocolate,
cacao, and nuts for manufacturing and
is not competitive on dairy and egg
ingredients used in some of the
processing.
RED MEATS
(Fresh/Chilled/Frozen)
CANADIAN
GLOBAL IMPORTS:
U.S. $1.7 BILLION
RED MEATS
(Prepared/Preserved)
CANADIAN
GLOBAL IMPORTS:
U.S. $739 MILLION
1. U.S.: 79%
2. New
Zealand:
12%
3. Australia:
6%
1. U.S.: 94%
2. Thailand:
2% 3. Brazil: 2%
Beef imports fall into two distinct
categories. The largest portion of
imports being chilled cuts
traditionally from the U.S. Midwest
heavily destined for the Ontario
region. The other part is frozen
manufacturing meat from Australia
(for grinding) and New Zealand
(largely for specific manufacturing
purposes). South America,
except for Uruguay, which is
beginning to make inroads in the
manufacturing market, remains
ineligible for entry to Canada
(except as a supplier of cooked and
canned beef) due to sanitary
reasons.
U.S. competitors are limited by a
beef quota.
Canada maintains a narrow acquired
feed cost advantage.
Canada continues to grow as a key
U.S. pork export market. Canadian
hog production numbers have been
declining across the country and U.S.
pork imports are up 6.5% due to
market structures and the Canadian
strong dollar.
The industry has worked its way out of
the inventory surge from the BSE
trade disruption. Canadian exports
have been sluggish due to a strong
Canadian dollar but increased by 1%
in 2011.
Canadian per capita basis consumption
has declined since 2006 from 31
kilograms to 29 kilograms.
33
Product Category
(continued)
Major
Supply
Sources
Strengths of Key Supply
Countries
Advantages and
Disadvantages of Local
Suppliers
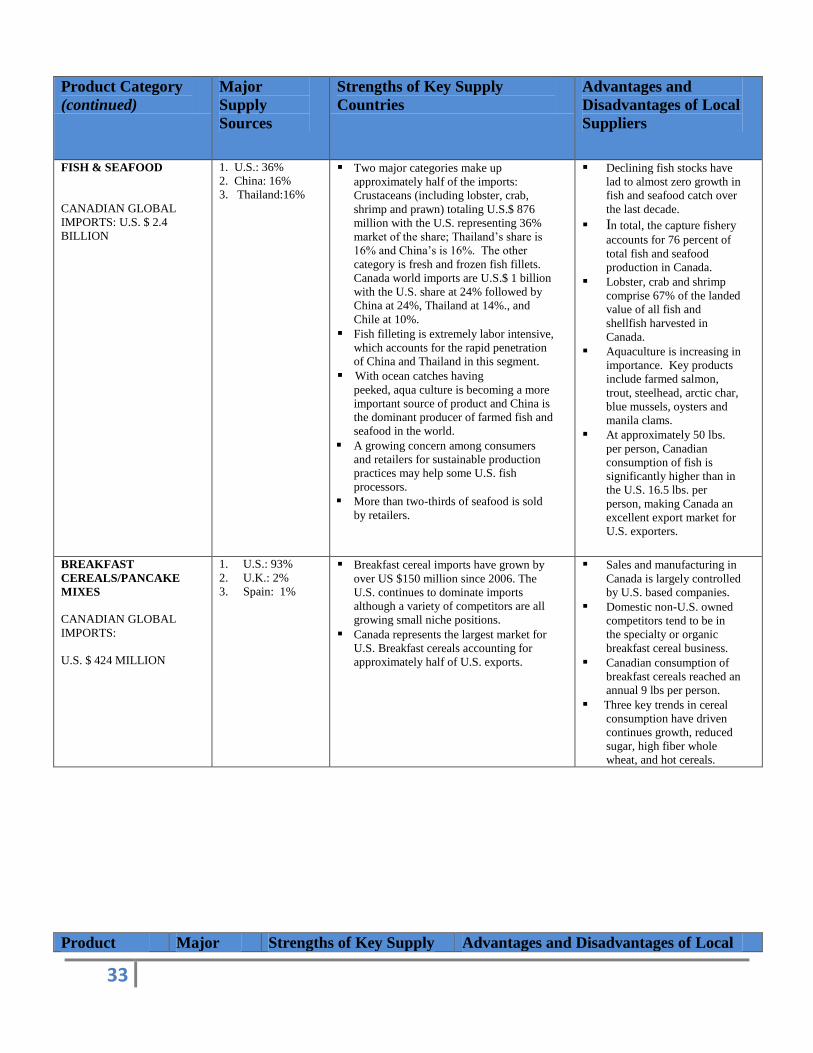
FISH & SEAFOOD
CANADIAN GLOBAL
IMPORTS: U.S. $ 2.4
BILLION
1. U.S.: 36%
2. China: 16% 3. Thailand:16%
Two major categories make up
approximately half of the imports:
Crustaceans (including lobster, crab,
shrimp and prawn) totaling U.S.$ 876
million with the U.S. representing 36%
market of the share; Thailand’s share is
16% and China’s is 16%. The other
category is fresh and frozen fish fillets.
Canada world imports are U.S.$ 1 billion
with the U.S. share at 24% followed by
China at 24%, Thailand at 14%., and
Chile at 10%.
Fish filleting is extremely labor intensive,
which accounts for the rapid penetration
of China and Thailand in this segment.
With ocean catches having peeked, aqua culture is becoming a more
important source of product and China is
the dominant producer of farmed fish and
seafood in the world.
A growing concern among consumers
and retailers for sustainable production
practices may help some U.S. fish
processors.
More than two-thirds of seafood is sold
by retailers.
Declining fish stocks have
lad to almost zero growth in
fish and seafood catch over
the last decade.
In total, the capture fishery
accounts for 76 percent of
total fish and seafood
production in Canada.
Lobster, crab and shrimp
comprise 67% of the landed
value of all fish and
shellfish harvested in
Canada.
Aquaculture is increasing in
importance. Key products
include farmed salmon,
trout, steelhead, arctic char,
blue mussels, oysters and
manila clams.
At approximately 50 lbs.
per person, Canadian
consumption of fish is
significantly higher than in
the U.S. 16.5 lbs. per
person, making Canada an
excellent export market for
U.S. exporters.
BREAKFAST
CEREALS/PANCAKE
MIXES
CANADIAN GLOBAL
IMPORTS:
U.S. $ 424 MILLION
1. U.S.: 93%
2. U.K.: 2%
3. Spain: 1%
Breakfast cereal imports have grown by
over US $150 million since 2006. The
U.S. continues to dominate imports
although a variety of competitors are all
growing small niche positions.
Canada represents the largest market for
U.S. Breakfast cereals accounting for
approximately half of U.S. exports.
Sales and manufacturing in
Canada is largely controlled
by U.S. based companies.
Domestic non-U.S. owned
competitors tend to be in
the specialty or organic
breakfast cereal business.
Canadian consumption of
breakfast cereals reached an
annual 9 lbs per person.
Three key trends in cereal
consumption have driven
continues growth, reduced
sugar, high fiber whole
wheat, and hot cereals.
Product Major Strengths of Key Supply Advantages and Disadvantages of Local
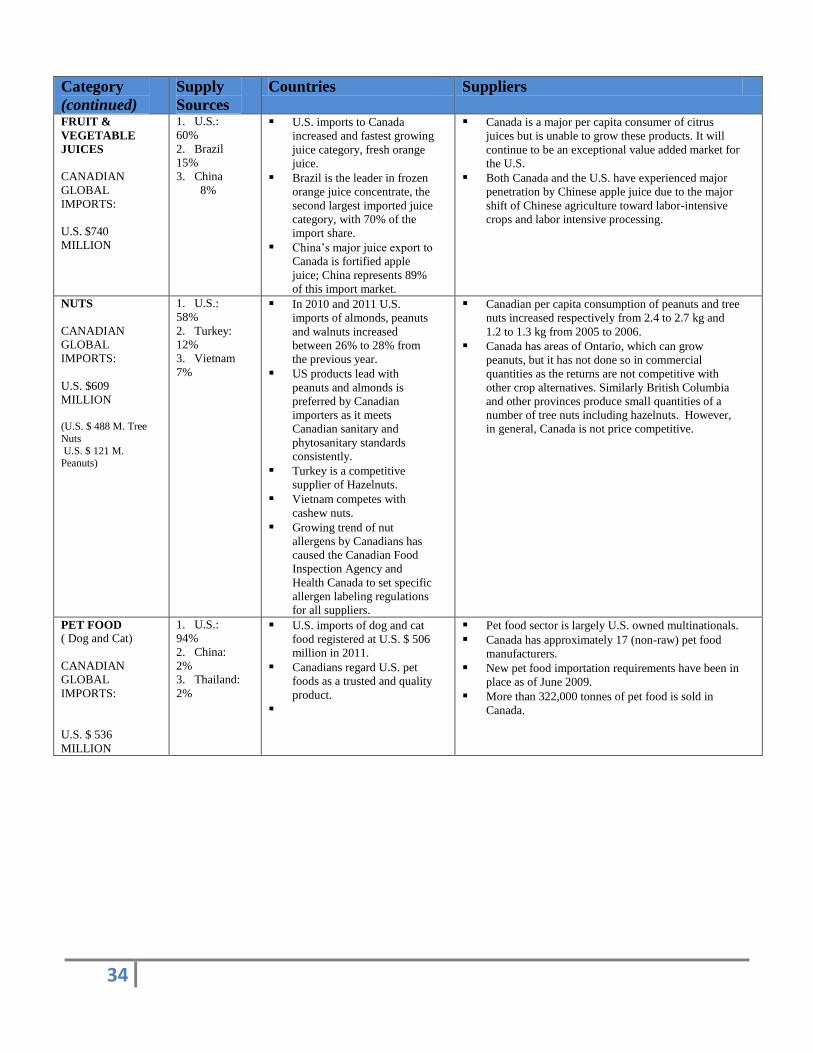
34
Category
(continued)
Supply
Sources
Countries Suppliers
FRUIT &
VEGETABLE
JUICES
CANADIAN
GLOBAL
IMPORTS:
U.S. $740
MILLION
1. U.S.:
60%
2. Brazil
15%
3. China
8%
U.S. imports to Canada
increased and fastest growing
juice category, fresh orange
juice.
Brazil is the leader in frozen
orange juice concentrate, the
second largest imported juice
category, with 70% of the
import share.
China’s major juice export to
Canada is fortified apple
juice; China represents 89%
of this import market.
Canada is a major per capita consumer of citrus
juices but is unable to grow these products. It will
continue to be an exceptional value added market for
the U.S.
Both Canada and the U.S. have experienced major
penetration by Chinese apple juice due to the major
shift of Chinese agriculture toward labor-intensive
crops and labor intensive processing.
NUTS
CANADIAN
GLOBAL
IMPORTS:
U.S. $609
MILLION
(U.S. $ 488 M. Tree
Nuts
U.S. $ 121 M. Peanuts)
1. U.S.:
58%
2. Turkey:
12%
3. Vietnam
7%
In 2010 and 2011 U.S.
imports of almonds, peanuts
and walnuts increased
between 26% to 28% from
the previous year.
US products lead with
peanuts and almonds is
preferred by Canadian
importers as it meets
Canadian sanitary and
phytosanitary standards
consistently.
Turkey is a competitive
supplier of Hazelnuts.
Vietnam competes with
cashew nuts.
Growing trend of nut
allergens by Canadians has
caused the Canadian Food
Inspection Agency and
Health Canada to set specific
allergen labeling regulations
for all suppliers.
Canadian per capita consumption of peanuts and tree
nuts increased respectively from 2.4 to 2.7 kg and
1.2 to 1.3 kg from 2005 to 2006.
Canada has areas of Ontario, which can grow
peanuts, but it has not done so in commercial
quantities as the returns are not competitive with
other crop alternatives. Similarly British Columbia
and other provinces produce small quantities of a
number of tree nuts including hazelnuts. However,
in general, Canada is not price competitive.
PET FOOD
( Dog and Cat)
CANADIAN
GLOBAL
IMPORTS:
U.S. $ 536
MILLION
1. U.S.:
94%
2. China:
2%
3. Thailand:
2%
U.S. imports of dog and cat
food registered at U.S. $ 506
million in 2011.
Canadians regard U.S. pet
foods as a trusted and quality
product.
Pet food sector is largely U.S. owned multinationals.
Canada has approximately 17 (non-raw) pet food
manufacturers.
New pet food importation requirements have been in
place as of June 2009.
More than 322,000 tonnes of pet food is sold in
Canada.
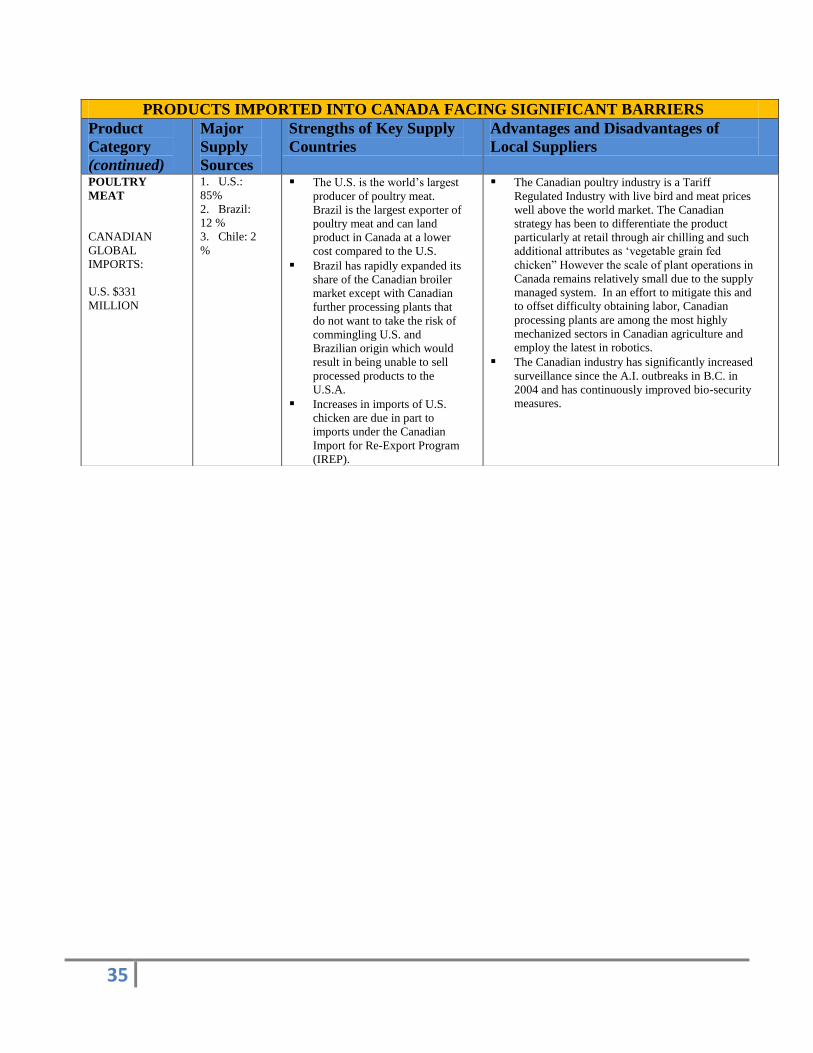
35
PRODUCTS IMPORTED INTO CANADA FACING SIGNIFICANT BARRIERS
Product
Category
(continued)
Major
Supply
Sources
Strengths of Key Supply
Countries
Advantages and Disadvantages of
Local Suppliers
POULTRY
MEAT
CANADIAN
GLOBAL
IMPORTS:
U.S. $331
MILLION
1. U.S.:
85%
2. Brazil:
12 %
3. Chile: 2
%
The U.S. is the world’s largest
producer of poultry meat.
Brazil is the largest exporter of
poultry meat and can land
product in Canada at a lower
cost compared to the U.S.
Brazil has rapidly expanded its
share of the Canadian broiler
market except with Canadian
further processing plants that
do not want to take the risk of
commingling U.S. and
Brazilian origin which would
result in being unable to sell
processed products to the
U.S.A.
Increases in imports of U.S.
chicken are due in part to
imports under the Canadian
Import for Re-Export Program
(IREP).
The Canadian poultry industry is a Tariff
Regulated Industry with live bird and meat prices
well above the world market. The Canadian
strategy has been to differentiate the product
particularly at retail through air chilling and such
additional attributes as ‘vegetable grain fed
chicken” However the scale of plant operations in
Canada remains relatively small due to the supply
managed system. In an effort to mitigate this and
to offset difficulty obtaining labor, Canadian
processing plants are among the most highly
mechanized sectors in Canadian agriculture and
employ the latest in robotics.
The Canadian industry has significantly increased
surveillance since the A.I. outbreaks in B.C. in
2004 and has continuously improved bio-security
measures.
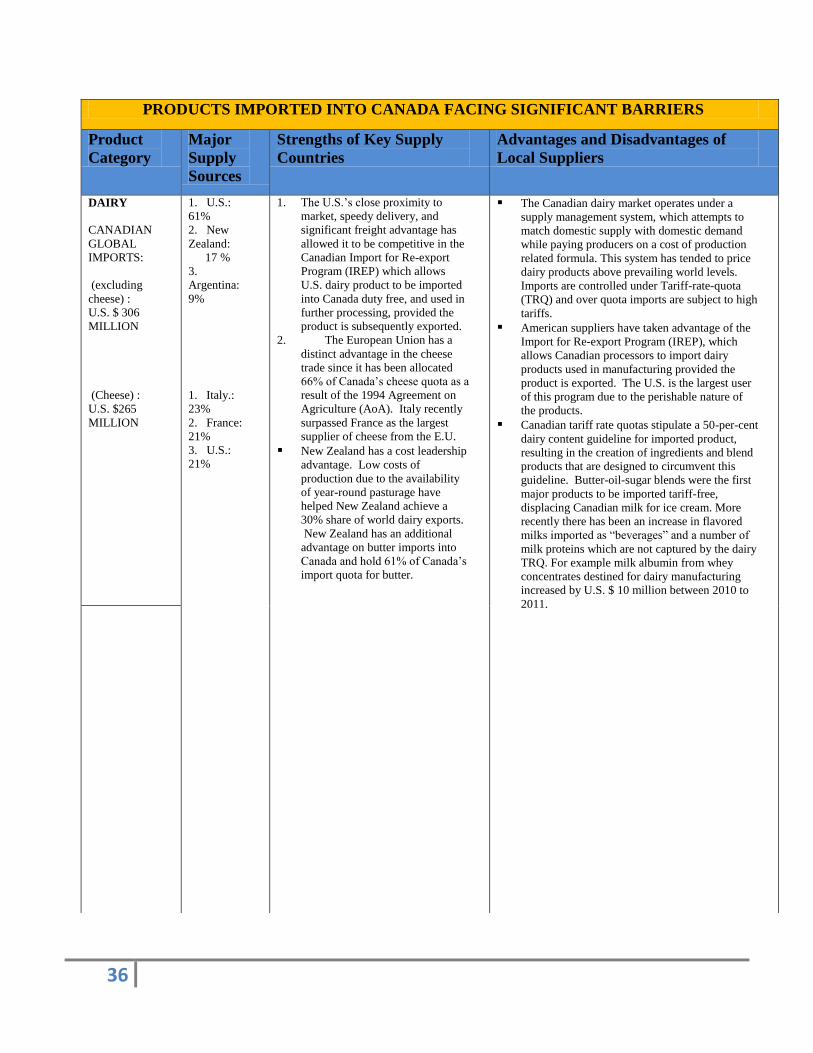
36
PRODUCTS IMPORTED INTO CANADA FACING SIGNIFICANT BARRIERS
Product
Category
Major
Supply
Sources
Strengths of Key Supply
Countries
Advantages and Disadvantages of
Local Suppliers
DAIRY
CANADIAN
GLOBAL
IMPORTS:
(excluding
cheese) :
U.S. $ 306
MILLION
(Cheese) :
U.S. $265
MILLION
1. U.S.:
61%
2. New
Zealand:
17 %
3.
Argentina:
9%
1. Italy.:
23%
2. France:
21%
3. U.S.:
21%
1. The U.S.’s close proximity to
market, speedy delivery, and
significant freight advantage has
allowed it to be competitive in the
Canadian Import for Re-export
Program (IREP) which allows
U.S. dairy product to be imported
into Canada duty free, and used in
further processing, provided the
product is subsequently exported.
2. The European Union has a
distinct advantage in the cheese
trade since it has been allocated
66% of Canada’s cheese quota as a
result of the 1994 Agreement on
Agriculture (AoA). Italy recently
surpassed France as the largest
supplier of cheese from the E.U.
New Zealand has a cost leadership
advantage. Low costs of
production due to the availability
of year-round pasturage have
helped New Zealand achieve a
30% share of world dairy exports.
New Zealand has an additional
advantage on butter imports into
Canada and hold 61% of Canada’s
import quota for butter.
The Canadian dairy market operates under a
supply management system, which attempts to
match domestic supply with domestic demand
while paying producers on a cost of production
related formula. This system has tended to price
dairy products above prevailing world levels.
Imports are controlled under Tariff-rate-quota
(TRQ) and over quota imports are subject to high
tariffs.
American suppliers have taken advantage of the
Import for Re-export Program (IREP), which
allows Canadian processors to import dairy
products used in manufacturing provided the
product is exported. The U.S. is the largest user
of this program due to the perishable nature of
the products.
Canadian tariff rate quotas stipulate a 50-per-cent
dairy content guideline for imported product,
resulting in the creation of ingredients and blend
products that are designed to circumvent this
guideline. Butter-oil-sugar blends were the first
major products to be imported tariff-free,
displacing Canadian milk for ice cream. More
recently there has been an increase in flavored
milks imported as “beverages” and a number of
milk proteins which are not captured by the dairy
TRQ. For example milk albumin from whey
concentrates destined for dairy manufacturing
increased by U.S. $ 10 million between 2010 to
2011.
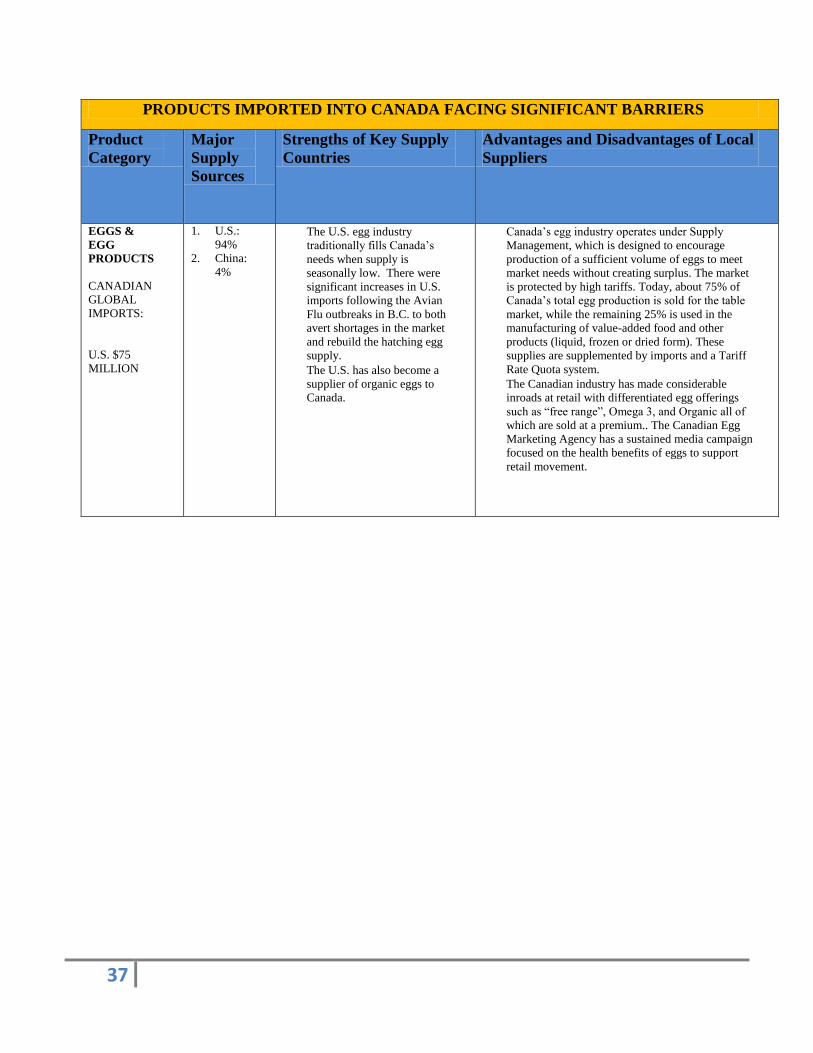
37
PRODUCTS IMPORTED INTO CANADA FACING SIGNIFICANT BARRIERS
Product
Category
Major
Supply
Sources
Strengths of Key Supply
Countries
Advantages and Disadvantages of Local
Suppliers
EGGS &
EGG
PRODUCTS
CANADIAN
GLOBAL
IMPORTS:
U.S. $75
MILLION
1. U.S.:
94%
2. China:
4%
The U.S. egg industry
traditionally fills Canada’s
needs when supply is
seasonally low. There were
significant increases in U.S.
imports following the Avian
Flu outbreaks in B.C. to both
avert shortages in the market
and rebuild the hatching egg
supply.
The U.S. has also become a
supplier of organic eggs to
Canada.
Canada’s egg industry operates under Supply
Management, which is designed to encourage
production of a sufficient volume of eggs to meet
market needs without creating surplus. The market
is protected by high tariffs. Today, about 75% of
Canada’s total egg production is sold for the table
market, while the remaining 25% is used in the
manufacturing of value-added food and other
products (liquid, frozen or dried form). These
supplies are supplemented by imports and a Tariff
Rate Quota system.
The Canadian industry has made considerable
inroads at retail with differentiated egg offerings
such as “free range”, Omega 3, and Organic all of
which are sold at a premium.. The Canadian Egg
Marketing Agency has a sustained media campaign
focused on the health benefits of eggs to support
retail movement.
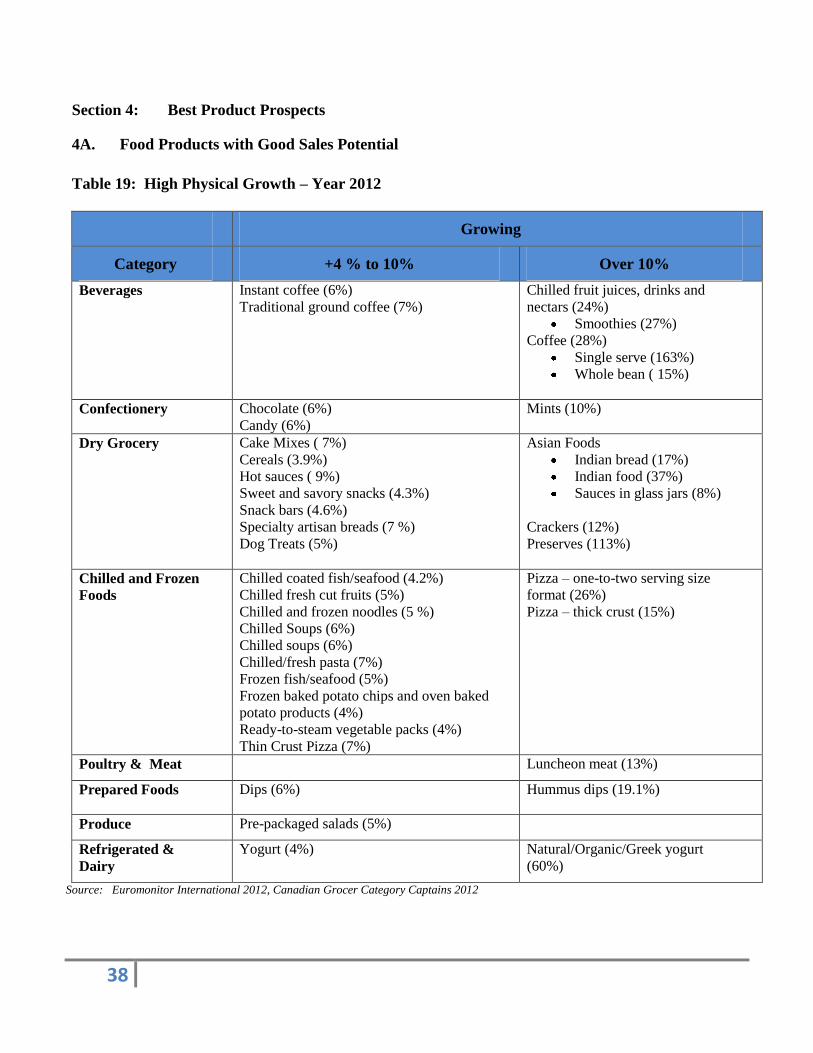
38
Section 4: Best Product Prospects
4A. Food Products with Good Sales Potential
Table 19: High Physical Growth – Year 2012
Growing
Category +4 % to 10% Over 10%
Beverages Instant coffee (6%)
Traditional ground coffee (7%)
Chilled fruit juices, drinks and
nectars (24%)
Smoothies (27%)
Coffee (28%)
Single serve (163%)
Whole bean ( 15%)
Confectionery Chocolate (6%)
Candy (6%)
Mints (10%)
Dry Grocery Cake Mixes ( 7%)
Cereals (3.9%)
Hot sauces ( 9%)
Sweet and savory snacks (4.3%)
Snack bars (4.6%)
Specialty artisan breads (7 %)
Dog Treats (5%)
Asian Foods
Indian bread (17%)
Indian food (37%)
Sauces in glass jars (8%)
Crackers (12%)
Preserves (113%)
Chilled and Frozen
Foods
Chilled coated fish/seafood (4.2%)
Chilled fresh cut fruits (5%)
Chilled and frozen noodles (5 %)
Chilled Soups (6%)
Chilled soups (6%)
Chilled/fresh pasta (7%)
Frozen fish/seafood (5%)
Frozen baked potato chips and oven baked
potato products (4%)
Ready-to-steam vegetable packs (4%)
Thin Crust Pizza (7%)
Pizza – one-to-two serving size
format (26%)
Pizza – thick crust (15%)
Poultry & Meat Luncheon meat (13%)
Prepared Foods Dips (6%)
Hummus dips (19.1%)
Produce Pre-packaged salads (5%)
Refrigerated &
Dairy
Yogurt (4%) Natural/Organic/Greek yogurt
(60%)
Source: Euromonitor International 2012, Canadian Grocer Category Captains 2012
39
4B. Products Facing Significant Barriers and Regulatory Challenges
Exporters from the United States are urged to familiarize themselves with the Canadian food laws and
regulations as this will help them evaluate their product’s market potential and ensure their products can
be legally sold in Canada. To learn more about these regulations, please read the GAIN report (CA
11073) on Food and Agricultural Import Regulations and Standards. The Canadian Food Inspection
Agency (CFIA) is responsible for the inspection of food products at all levels of trade. Below are some
key barriers and challenges in the market.
Tariffs and Tariff Rate Quotas (TRQs)
Effective January 1, 1998 the tariff provisions of the U.S.- Canada Free Trade Agreement (FTA)
removed all tariffs between the two countries with the exception of those products for which Canada
implemented tariff rate quotas on January 1, 1995. The provisions of the FTA were incorporated into
the NAFTA to which Mexico is also a signatory. The NAFTA came into effect on January 1, 1994.
In 1995, under the World Trade Organization (WTO) agreement, Canada replaced import quotas on
certain agricultural products with Tariff Rate Quotas (TRQs). Under the TRQ system, imports that are
within quotas are subject to low or free rates of duty, until the quota limit has been reached. Once quota
limits have been reached, over quota imports are subject to significantly higher Most-Favored-Nation
(MFN) rates of duty. To import and market TRQ commodities, a business must be a registered
Canadian business entity and must be in possession of an import permit. These companies are referred
to as ‘quota holders.’ For most commodities, TRQs are already allocated with only a few available for
new Canadian businesses. The Department of Foreign Affairs and International Trade (Export and
Import Controls Bureau) is responsible for administering Canada’s Tariff Rate Quotas for agricultural
products. For more information go to: http://www.dfait-maeci.gc.ca/trade/eicb/agric/agric-en.asp
Canada administers TRQs that affect exporters of the following U.S. agricultural commodities:
Broiler Hatching Eggs & Chicks
Chicken and Chicken Products
Turkey and Turkey Products
Table Eggs
Milk & Dairy Products
Cheese
Margarine
Important note for U.S. meat exporters: Canada has further TRQs that affect both the level and the
tariff rates of imports from non-NAFTA origin of pork, beef, and wheat, barley and their products, but
they do not apply to imports of U.S. origin (or Mexican origin when eligible).
Detailed Information is located at the link below:
http://www.international.gc.ca/controls-controles/prod/agri/index.aspx?menu_id=3&menu=R
Pesticides and Other Contaminants
40
Some agricultural chemicals approved for use in the United States are not registered in Canada. As a
result, these pesticides are deemed to have a zero tolerance in Canada and imported foods which contain
unregistered pesticide residues above 0.1 parts per million are deemed to be adulterated under Section
B.15.002 (1) of Canada's Food and Drug Regulations. The goods are subject to detention, destruction,
or return.
Canada is currently reviewing its policy of the 0.1 ppm default level. A discussion document issued by
Health Canada on this policy review is available at:
http://www.hc-sc.gc.ca/cps-spc/pest/part/consultations/_dis2006-01/index-eng.php
Health Canada
Health Canada continues to develop standards and policies for the safety of the food supply, which are applied by
the CFIA.
All foods sold in Canada are subject to the Food and Drugs Act and Regulations, which contains health and safety
requirements, labeling requirements and provision preventing deception and fraud. However, many agricultural
and fish products are also subject to other legislation. Consequently, the need for licensing, permits and
certificates depends upon the type of food being imported and in some cases on the country or area from which
the food is imported. It should be noted that in some provinces, there are additional requirements for certain
foods, such as dairy products, bottled water and maple syrup.
The Food and Drug Regulations (FDR) outline the specifications and further requirements for standardized and
non-standardized products. The following are just a few examples of regulatory issues, which could pose a
barrier for some United States food companies attempting to sell in Canada.
Food Additives: In the absence of specifications under the FDR, food additives must conform to specification in
the Food Chemical Codex (as required by section B.01.045 of the FDR). There are differences between Canadian
and United States rules. A list of food additives permitted for use in Canada can be found at: http://www.hc-
sc.gc.ca/fn-an/securit/addit/diction/dict_food-alim_add-eng.php.
Food Color: Synthetic food colors are the only additives that must be certified by the Health Products and Food
Branch of Health Canada before being used in foods. Regulations concerning food colors are listed in Division 6
and Table III of Division 16 of the FDR.
Vitamin and Mineral Fortification: Fortification in Canada is under review. Health Canada has signaled it is
looking at expanding discretionary fortification but with restrictions on which vitamins and minerals and what
amounts would be permissible. However, differences remain such as the folic acid exclusion on milled grain and
bakery products. More information on fortification can be seen: www.hc-sc.gc.ca/fn-
an/nutrition/vitamin/index_e.html.
Trans Fats: In July 2007, Health Canada announced that it is adopting the Trans Fat Task Force's
recommendation on trans fats, but will ask industry to voluntarily limit the trans fat content of vegetable oils and
soft, spreadable margarines to 2 per cent of the total fat content and to limit the trans fat content for all other foods
to 5 per cent, including ingredients sold to restaurants. Canada also requires that the levels of trans fat in pre-
packaged food be included on the mandatory nutrition label. Trans fat regulations are outlined at: http://www.hc-
sc.gc.ca/fn-an/nutrition/gras-trans-fats/index-eng.php.
Novel Foods (Foods Containing Genetically Modified Crops):Health Canada defines novel foods as: products
that have never been used as a food; foods that result from a process that has not been previously used for food; or
foods that have been modified by genetic manipulation (i.e., from foods containing genetically modified (GM)
crops).
41
Under the Novel Foods Regulations, such foods can only be sold in Canada once approved by Health
Canada. To learn more go to: GM Foods and Other Novel Foods: http://www.hc-sc.gc.ca/fn-an/gmf-
agm/index-eng.php
Diet-Related Health Claims: The Canadian Food Inspection Agency enforces specific regulations regarding
health claims that can be made about a product or ingredient. These regulations are in place to ensure accuracy
and validity. For exact wording, visit http://www.inspection.gc.ca/english/fssa/labeti/guide/ch8e.shtml#8.4.
Packaging and Container Regulations: Canadian regulations govern specific package sizes for fruits,
vegetables, processed horticultural products and processed meats stipulate standardized package sizes
that may differ from U.S. sizes. The standards of identity and the container sizes are generally stipulated
in the regulations encompassing agriculture and food products. Electronic access to all Canadian food-
related regulations is available through: http://www.inspection.gc.ca/english/reg/rege.shtml
Allergen Labeling Regulations on Pre-packaged Foods: Health Canada has added gluten sources,
mustard, and sulphites to the list of Priority Food Allergens list (see table below). As of August 4,
2012, the Canadian Food Inspection Agency (CRFA) and Health Canada will require most pre-packaged
products containing these allergenic ingredients be noted on the label in a list or in a statement such as
“Allergy and Intolerance Information”; Contains (name the allergen). The new regulations also require
manufacturers to use common names, for example spelt and kamut are to be declared as wheat for
allergen labeling purposes.
Health Canada provides the following reference guidance to food companies:
Food Allergen Labelling Guidance for Industry
http://www.hc-sc.gc.ca/fn-an/label-etiquet/allergen/guide_ligne_direct_indust-eng.php
Organic Standards: As of June 30, 2009, the Organic Products Regulations require mandatory
certification to the revised National Organic Standard for agricultural products represented as organic in
international and inter-provincial trade, or that bear the federal organic agricultural product legend (or
federal logo). Due to the equivalency agreement with the United States, the USDA organic certification
is fully recognized in Canada and there is no need for further certification in Canada for USDA-certified
organic products. The CFIA has more information on regulations for organic products on their website
at: http://www.inspection.gc.ca/food/organic-products/eng/1300139461200/1300140373901.
Revised Compositional Standards for Cheese: New cheese compositional standards came into force
on December 14, 2008. These standards impose limitations on the dairy ingredients that can be used in
cheese making and also bring in a regulatory scheme designed to make cheese importers more
accountable for ensuring that imported product complies with the new regulations. The regulations limit
dairy ingredients by requiring “minimum percentage of casein from milk” categories, and the
requirement of cheeses to meet the minimum ratios. To determine whether or not cheese to be imported
complies with Canadian compositional standards, refer to an official copy of the regulations, available
at:
http://laws.justice.gc.ca/en/showtdm/cr/SOR-79-840 (English)
http://laws.justice.gc.ca/fr/showtdm/cr/DORS-79-840 (French)
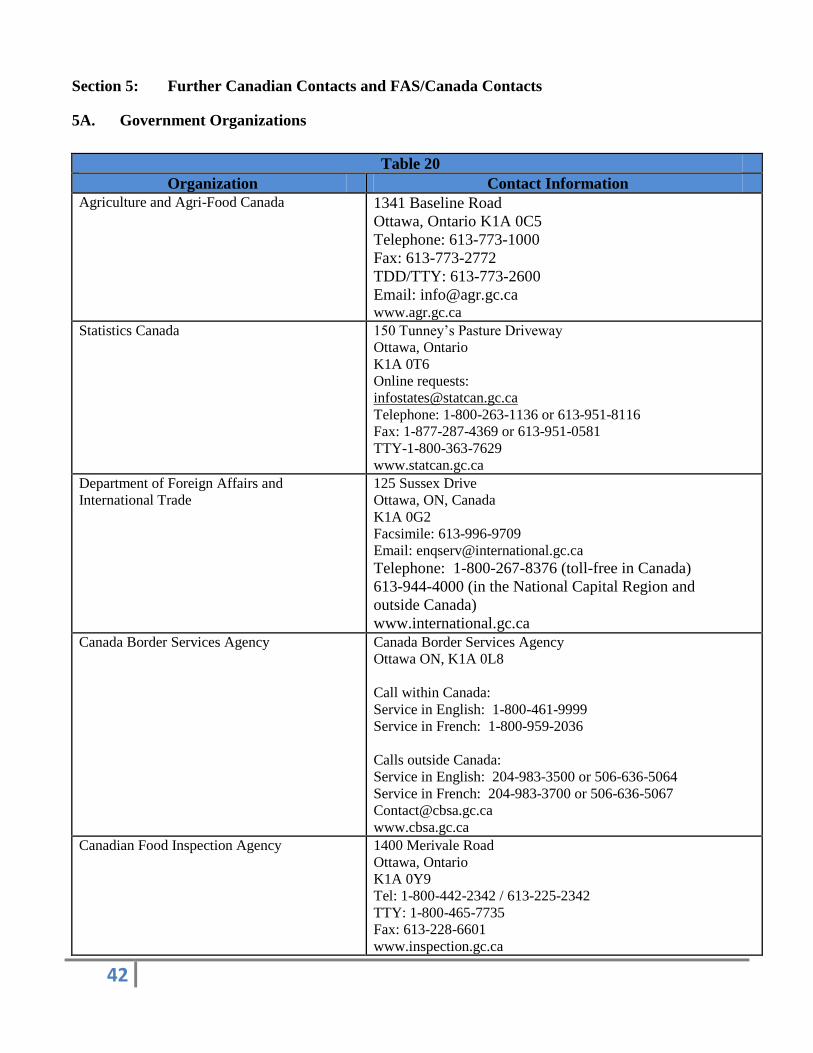
42
Section 5: Further Canadian Contacts and FAS/Canada Contacts
5A. Government Organizations
Table 20
Organization Contact Information
Agriculture and Agri-Food Canada 1341 Baseline Road
Ottawa, Ontario K1A 0C5
Telephone: 613-773-1000
Fax: 613-773-2772
TDD/TTY: 613-773-2600
Email: [email protected] www.agr.gc.ca
Statistics Canada 150 Tunney’s Pasture Driveway
Ottawa, Ontario
K1A 0T6
Online requests:
Telephone: 1-800-263-1136 or 613-951-8116
Fax: 1-877-287-4369 or 613-951-0581
TTY-1-800-363-7629
www.statcan.gc.ca
Department of Foreign Affairs and
International Trade
125 Sussex Drive
Ottawa, ON, Canada
K1A 0G2
Facsimile: 613-996-9709
Email: [email protected]
Telephone: 1-800-267-8376 (toll-free in Canada)
613-944-4000 (in the National Capital Region and
outside Canada)
www.international.gc.ca
Canada Border Services Agency Canada Border Services Agency
Ottawa ON, K1A 0L8
Call within Canada:
Service in English: 1-800-461-9999
Service in French: 1-800-959-2036
Calls outside Canada:
Service in English: 204-983-3500 or 506-636-5064
Service in French: 204-983-3700 or 506-636-5067
www.cbsa.gc.ca
Canadian Food Inspection Agency 1400 Merivale Road
Ottawa, Ontario
K1A 0Y9
Tel: 1-800-442-2342 / 613-225-2342
TTY: 1-800-465-7735
Fax: 613-228-6601
www.inspection.gc.ca

43
Health Canada Address Locator 0900C2
Ottawa, Ontario
K1A 0K9
Email: [email protected]
Telephone: 613-957-2991
Toll free: 1-866-225-0709
Facsimile: 613-941-5366
Teletypewriter: 1-800-267-1245 (Health Canada) www.hc-sc.gc.ca
Industry Canada C.D. Howe Building
235 Queen Street
Ottawa, Ontario K1A 0H5
Canada
Online: [email protected]
Telephone: 613-954-5031
Toll-free: 1-800-328-6189 (Canada)
TTY (for hearing-impaired only): 1-866-694-8389 (toll-free)
Fax: 613-954-2340
www.ic.gc.ca
5B. Industry Associations
Table 21
Organization Contact Information
Canadian Federation of Independent Grocers Canadian Federation of Independent Grocers
2235 Sheppard Ave. East, Suite 902
Willowdale, ON M2J 5B5
Tel: (416) 492-2311 or 800-661-2344
Fax: (416) 492-2347
Email: [email protected]
Web: www.cfig.ca
Canadian Produce Marketing Association [CPMA] Canadian Produce Marketing Association
162 Cleopatra Drive
Ottawa, ON K2G 5X2
Tel: (613) 226-4187
Fax: (613) 226-2984
Email: [email protected]
Web: www.cpma.ca
Food and Consumer Products of Canada (FCPC ) Food and Consumer Products of Canada
100 Sheppard Avenue East, Suite 600
Toronto, Ontario M2N 6N5
Tel. (416) 510-8024
Fax.(416) 510-8043
Email. [email protected]
Web: www.fcpc.ca
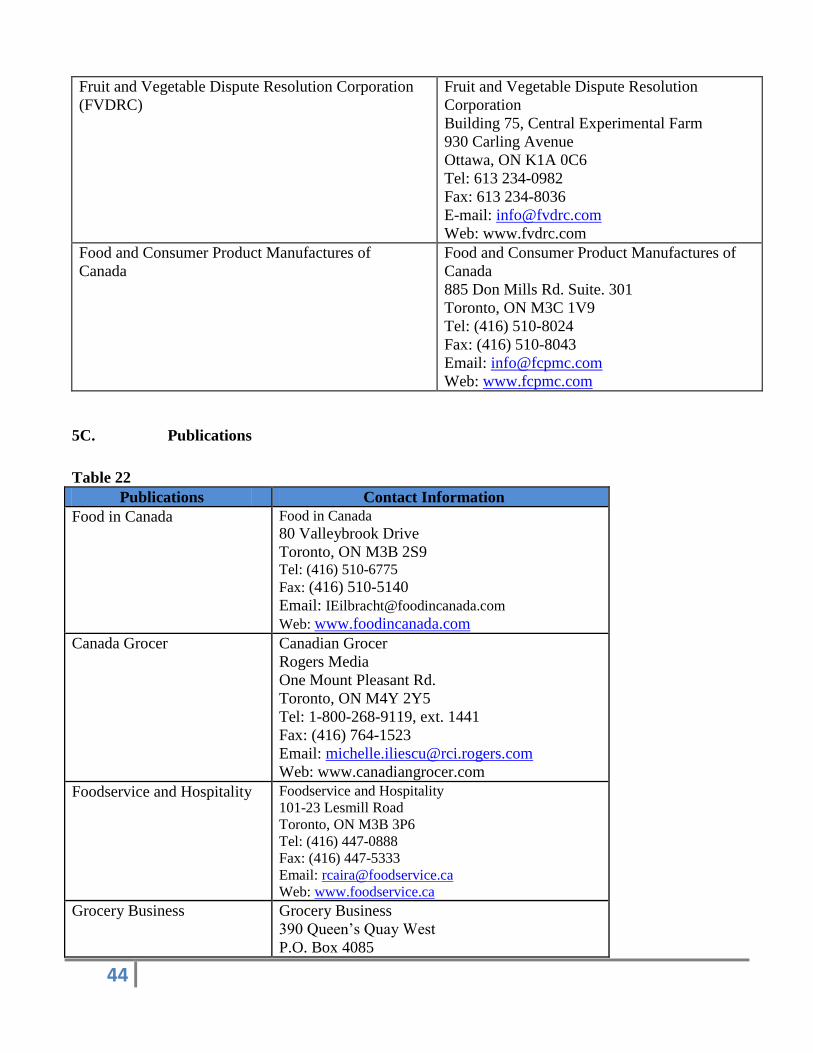
44
Fruit and Vegetable Dispute Resolution Corporation
(FVDRC)
Fruit and Vegetable Dispute Resolution
Corporation
Building 75, Central Experimental Farm
930 Carling Avenue
Ottawa, ON K1A 0C6
Tel: 613 234-0982
Fax: 613 234-8036
E-mail: [email protected]
Web: www.fvdrc.com
Food and Consumer Product Manufactures of
Canada
Food and Consumer Product Manufactures of
Canada
885 Don Mills Rd. Suite. 301
Toronto, ON M3C 1V9
Tel: (416) 510-8024
Fax: (416) 510-8043
Email: [email protected]
Web: www.fcpmc.com
5C. Publications
Table 22
Publications Contact Information
Food in Canada Food in Canada 80 Valleybrook Drive
Toronto, ON M3B 2S9 Tel: (416) 510-6775 Fax: (416) 510-5140
Email: [email protected]
Web: www.foodincanada.com
Canada Grocer Canadian Grocer
Rogers Media
One Mount Pleasant Rd.
Toronto, ON M4Y 2Y5
Tel: 1-800-268-9119, ext. 1441
Fax: (416) 764-1523
Email: [email protected]
Web: www.canadiangrocer.com
Foodservice and Hospitality Foodservice and Hospitality
101-23 Lesmill Road
Toronto, ON M3B 3P6
Tel: (416) 447-0888
Fax: (416) 447-5333
Email: [email protected]
Web: www.foodservice.ca
Grocery Business Grocery Business
390 Queen’s Quay West
P.O. Box 4085
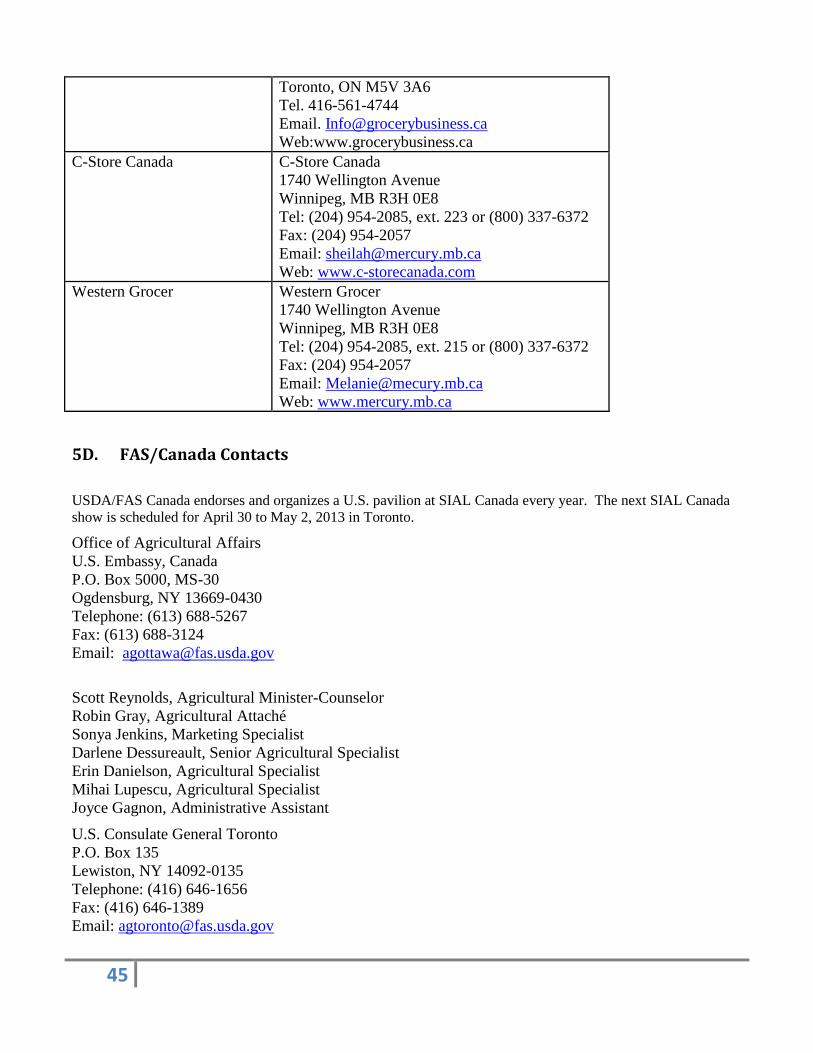
45
Toronto, ON M5V 3A6
Tel. 416-561-4744
Email. [email protected]
Web:www.grocerybusiness.ca
C-Store Canada C-Store Canada
1740 Wellington Avenue
Winnipeg, MB R3H 0E8
Tel: (204) 954-2085, ext. 223 or (800) 337-6372
Fax: (204) 954-2057
Email: [email protected]
Web: www.c-storecanada.com
Western Grocer Western Grocer
1740 Wellington Avenue
Winnipeg, MB R3H 0E8
Tel: (204) 954-2085, ext. 215 or (800) 337-6372
Fax: (204) 954-2057
Email: [email protected]
Web: www.mercury.mb.ca
5D. FAS/Canada Contacts
USDA/FAS Canada endorses and organizes a U.S. pavilion at SIAL Canada every year. The next SIAL Canada
show is scheduled for April 30 to May 2, 2013 in Toronto.
Office of Agricultural Affairs
U.S. Embassy, Canada
P.O. Box 5000, MS-30
Ogdensburg, NY 13669-0430
Telephone: (613) 688-5267
Fax: (613) 688-3124
Email: [email protected]
Scott Reynolds, Agricultural Minister-Counselor
Robin Gray, Agricultural Attaché
Sonya Jenkins, Marketing Specialist
Darlene Dessureault, Senior Agricultural Specialist
Erin Danielson, Agricultural Specialist
Mihai Lupescu, Agricultural Specialist
Joyce Gagnon, Administrative Assistant
U.S. Consulate General Toronto
P.O. Box 135
Lewiston, NY 14092-0135
Telephone: (416) 646-1656
Fax: (416) 646-1389
Email: [email protected]
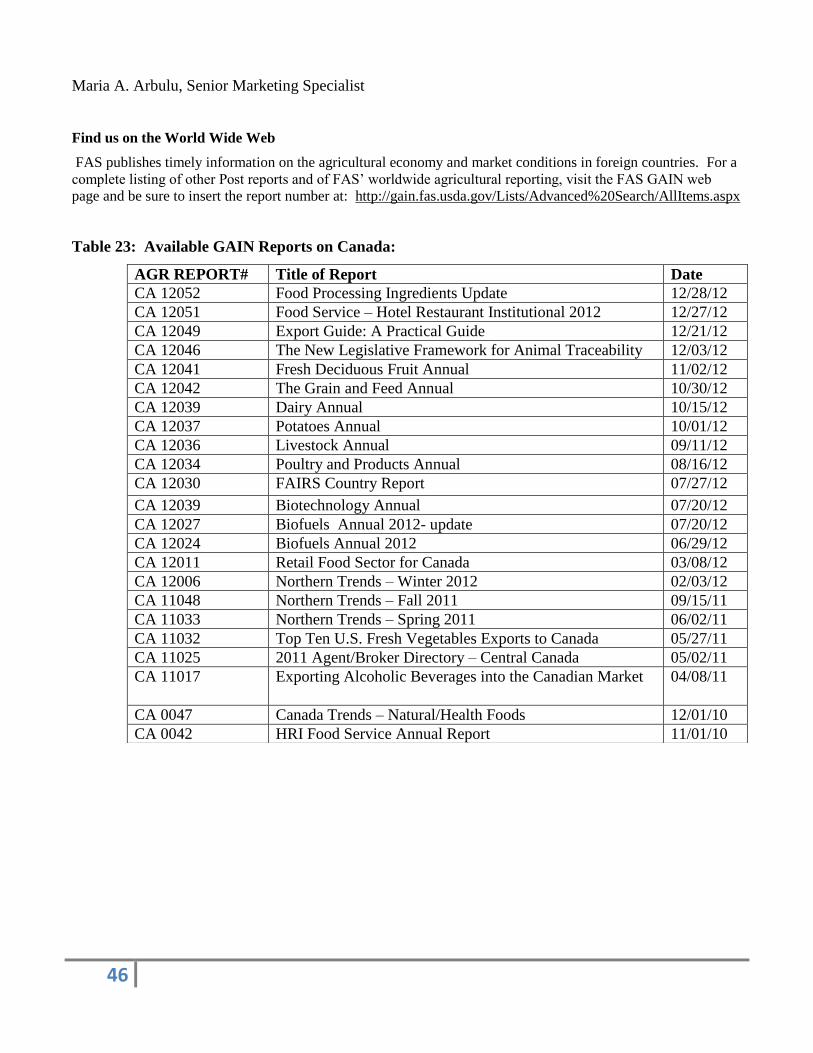
46
Maria A. Arbulu, Senior Marketing Specialist
Find us on the World Wide Web
FAS publishes timely information on the agricultural economy and market conditions in foreign countries. For a
complete listing of other Post reports and of FAS’ worldwide agricultural reporting, visit the FAS GAIN web
page and be sure to insert the report number at: http://gain.fas.usda.gov/Lists/Advanced%20Search/AllItems.aspx
Table 23: Available GAIN Reports on Canada:
AGR REPORT# Title of Report Date
CA 12052 Food Processing Ingredients Update 12/28/12
CA 12051 Food Service – Hotel Restaurant Institutional 2012 12/27/12
CA 12049 Export Guide: A Practical Guide 12/21/12
CA 12046 The New Legislative Framework for Animal Traceability 12/03/12
CA 12041 Fresh Deciduous Fruit Annual 11/02/12
CA 12042 The Grain and Feed Annual 10/30/12
CA 12039 Dairy Annual 10/15/12
CA 12037 Potatoes Annual 10/01/12
CA 12036 Livestock Annual 09/11/12
CA 12034 Poultry and Products Annual 08/16/12
CA 12030 FAIRS Country Report 07/27/12
CA 12039 Biotechnology Annual 07/20/12
CA 12027 Biofuels Annual 2012- update 07/20/12
CA 12024 Biofuels Annual 2012 06/29/12
CA 12011 Retail Food Sector for Canada 03/08/12
CA 12006 Northern Trends – Winter 2012 02/03/12
CA 11048 Northern Trends – Fall 2011 09/15/11
CA 11033 Northern Trends – Spring 2011 06/02/11
CA 11032 Top Ten U.S. Fresh Vegetables Exports to Canada 05/27/11
CA 11025 2011 Agent/Broker Directory – Central Canada 05/02/11
CA 11017 Exporting Alcoholic Beverages into the Canadian Market 04/08/11
CA 0047 Canada Trends – Natural/Health Foods 12/01/10
CA 0042 HRI Food Service Annual Report 11/01/10
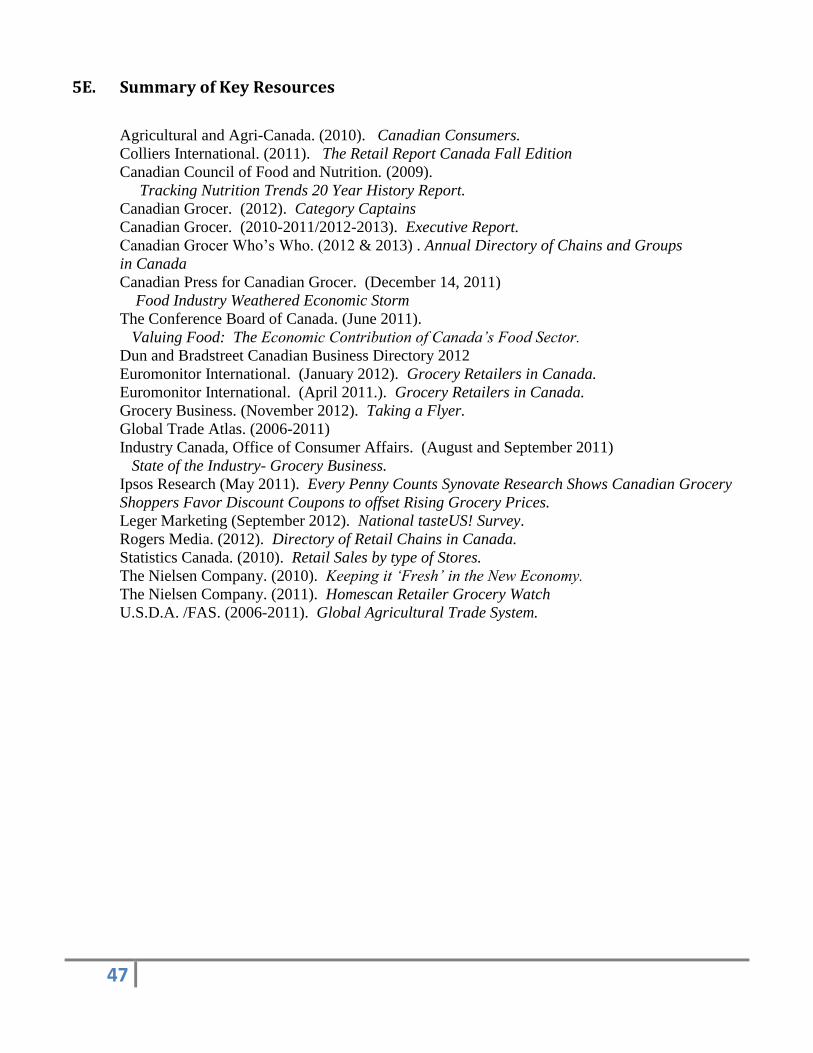
47
5E. Summary of Key Resources
Agricultural and Agri-Canada. (2010). Canadian Consumers.
Colliers International. (2011). The Retail Report Canada Fall Edition
Canadian Council of Food and Nutrition. (2009).
Tracking Nutrition Trends 20 Year History Report.
Canadian Grocer. (2012). Category Captains
Canadian Grocer. (2010-2011/2012-2013). Executive Report.
Canadian Grocer Who’s Who. (2012 & 2013) . Annual Directory of Chains and Groups
in Canada
Canadian Press for Canadian Grocer. (December 14, 2011)
Food Industry Weathered Economic Storm
The Conference Board of Canada. (June 2011).
Valuing Food: The Economic Contribution of Canada’s Food Sector.
Dun and Bradstreet Canadian Business Directory 2012
Euromonitor International. (January 2012). Grocery Retailers in Canada.
Euromonitor International. (April 2011.). Grocery Retailers in Canada.
Grocery Business. (November 2012). Taking a Flyer.
Global Trade Atlas. (2006-2011)
Industry Canada, Office of Consumer Affairs. (August and September 2011)
State of the Industry- Grocery Business.
Ipsos Research (May 2011). Every Penny Counts Synovate Research Shows Canadian Grocery
Shoppers Favor Discount Coupons to offset Rising Grocery Prices.
Leger Marketing (September 2012). National tasteUS! Survey.
Rogers Media. (2012). Directory of Retail Chains in Canada.
Statistics Canada. (2010). Retail Sales by type of Stores.
The Nielsen Company. (2010). Keeping it ‘Fresh’ in the New Economy.
The Nielsen Company. (2011). Homescan Retailer Grocery Watch
U.S.D.A. /FAS. (2006-2011). Global Agricultural Trade System.