Assessment of Impacts of and Adaptation to Climate Change in Multiple Regions and Sectors (AIACC)

Retail & Commercial Sectors Needs Assessment
Final Report June 2013

Retail & Commercial Sectors Needs Assessment
Final Report
Prepared for:
Moreton Bay Regional Council PO Box 159 CABOOLTURE QLD 4510
Prepared by:
Economic Associates Pty Ltd ACN 085 445 610 PO Box 541 Spring Hill QLD 4004 Telephone: (07) 3839 1011 Facsimile: (07) 3839 1022 June 2013 12047 © Economic Associates Pty Ltd

Retail & Commercial Sectors Needs Assessment i 24 June 2013 12047 Report Rev 0
TABLE OF CONTENTS
1 INTRODUCTION 1
1.1 Project Background & Purpose of Study 1
1.2 Report Structure 2
1.3 Interpretation 3
2 SOCIO ECONOMIC OVERVIEW OF THE MORETON BAY REGION DISTRICTS 4
2.1 Moreton Bay Regional Council Draft Strategic Framework Districts 4
2.2 Socio Economic Overview 6
2.2.1 2011 Census Data 6
2.3 Population and Household Projections 11
2.4 Labour Force 12
2.4.1 Unemployment 12
2.4.2 Labour Force Participation 14
2.5 Implications for Retail and Commercial Demand within Moreton Bay Regional Council 15
3 KEY POLICY AND PLANNING ISSUES 16
3.1 Key Strategic and Statutory Planning Issues 16
3.1.1 Statutory Compliance / Integrity 17
3.1.2 Statutory Alignment 17
3.1.3 Composition 18
3.1.4 Consistency 18
3.1.5 Complexity 18
3.1.6 Currency 19
4 RETAIL, COMMERCIAL AND CENTRE TRENDS 20
4.1 Types of Shopping Trips 20
4.2 Types of Shoppers 20
4.3 Types of Retail Centres 21
4.4 Trends in Retail Development 22
4.5 Commercial Office Trends 24
4.6 In-Centre Residential Trends 24
4.7 Planning Policy Trends 25
5 CENTRES NETWORK AND HIERARCHY 27
5.1 Existing Centres Network 27
5.1.1 Principal Regional Activity Centres 27
5.1.2 Major Regional Activity Centres 28
5.1.3 District Centres 30
5.1.4 Local Centres 34
5.2 Future Centres Hierarchy for Moreton Bay Regional Council 42
5.2.1 Principal Centres 42
5.2.2 Major Centres 43
5.2.3 District Centres 44
5.2.4 Local Centres 44
5.2.5 Neighbourhood Centres 44

Retail & Commercial Sectors Needs Assessment ii 24 June 2013 12047 Report Rev 0
5.3 Metrics for Principal and Major Centres 45
5.3.1 Relationship between Population and Principal / Major Centre Provision 45
5.3.2 Community Size and Future Job Provision 45
5.3.3 Existing Principal & Major Centres Network 47
5.3.4 Existing Community Infrastructure 48
5.3.5 Infrastructure Projects 49
5.3.6 Summary 49
5.4 Proposed Centres Hierarchy 50
5.4.1 Principal Centres 50
5.4.2 Major Centres 50
5.4.3 District Centres 51
5.4.4 Local and Neighbourhood Centres 51
5.4.5 Specialised Centre (Bulky Goods / Special Purpose) 52
6 RETAIL AND COMMERCIAL CATCHMENTS 54
6.1 Population and Household Projections within Catchments 56
7 PROJECTED RETAIL FLOOR SPACE DEMAND 58
7.1 Retail Floor Space Demand – Methodology 58
7.2 Available Retail Expenditure within Catchments 59
7.3 Sales Productivity 63
7.4 Retail Expenditure Leakage Rates 63
7.5 Supportable Floor Space 64
7.6 Centres by Retail Catchments 66
7.7 Large Scale Centre Assessment – PACs, MACs and Specialised Centre Precincts 69
7.7.1 Large Scale Centre Catchments and Market Shares 69
7.8 Large Scale Activity Centres Supply Demand Balance 72
7.8.1 Caboolture Morayfield PAC 72
7.8.2 North Lakes MAC 73
7.8.3 Strathpine MAC 74
7.8.4 Redcliffe – Kippa Ring MAC 74
7.8.5 Lawnton Employment Area 75
7.8.6 Rothwell – Deception Bay Catchment 75
7.9 District, Local and Neighbourhood Centres Assessment 76
7.10 Summary 78
7.10.1 Low Need 78
7.10.2 Moderate Need 78
7.10.3 High Need 79
8 PROJECTED COMMERCIAL FLOOR SPACE DEMAND 80
8.1 Methodology 80
8.2 Assumptions 81
8.2.1 Employment in Industries Requiring Commercial Office Space 81
8.2.2 Working Age Population 81
8.2.3 Labour Market Characteristics 82
8.2.4 Employment by Industry 83
8.2.5 Employment Retention 84
8.3 Employment Projections for Commercial Office Space 85
8.3.1 Employment within Commercial Office Sectors 85

Retail & Commercial Sectors Needs Assessment iii 24 June 2013 12047 Report Rev 0
8.3.2 Employment within Commercial Office Space 85
8.3.3 Commercial Office Floor Space Demand 88
8.3.4 Incremental Commercial Office Floor Space Demand 90
8.4 Summary 90
8.4.1 Low Need 90
8.4.2 Moderate Need 91
8.4.3 High Need 91
9 RETAIL AND COMMERCIAL CATCHMENT NEED SUMMARY 92
9.1 Low Need 94
9.1.1 Redcliffe 94
9.1.2 Lawnton – Bray Park 96
9.1.3 Rothwell – Deception Bay 97
9.1.4 Bribie Island 98
9.1.5 Caboolture East 99
9.1.6 Caboolture Hinterland 99
9.2 Moderate Need 99
9.2.1 Albany Creek 100
9.2.2 Burpengary – Narangba 101
9.2.3 Caboolture Midwest 102
9.2.4 Dakabin-Kallangur-Murrumba Downs 104
9.2.5 Hills District / Samford 105
9.2.6 Petrie / Dayboro 106
9.3 High Need 107
9.3.1 Caboolture – Morayfield 108
9.3.2 Griffin – Mango Hill 109
9.3.3 Strathpine 111
9.3.4 Central Pine West 112
10 RECOMMENDATIONS & STRATEGY 114
10.1 Background & Context 114
10.2 Guiding Principles 114
10.3 Drafting Principles 114
10.4 Alignment of Recommended Planning Approach with SEQ Regional Plan 115
10.4.1 The “Activity Centres Concept” 115
10.4.2 Planning Scheme Preparation Methodology 117
10.4.3 Alignment of SEQ Regional Plan, Place Model and QPP Zoning Structure 117
10.5 Planning Scheme Components 118
10.5.1 Introduction 118
10.5.2 Strategic Framework 118
10.5.3 Definitions 119
10.5.4 Tables of Assessment 119
10.5.5 Zones and Precincts 120
10.5.6 Local Plans 121
10.5.7 Overlays 122
10.6 Planning and Implementation Recommendations 122
10.6.1 Strategic Framework 122
10.6.2 Definitions 122

Retail & Commercial Sectors Needs Assessment iv 24 June 2013 12047 Report Rev 0
10.6.3 Tables of Assessment 122
10.6.4 Zones and Precincts 123
10.6.5 Local Plans 123
10.6.6 Overlays 123
10.6.7 Codes 123
10.6.8 Recommendations for Existing Centres 123
10.7 Recommendations for Moderate and High Need Catchments 132
10.7.1 Albany Creek 132
10.7.2 Burpengary – Narangba 133
10.7.3 Caboolture Midwest 134
10.7.4 Dakabin – Kallangur – Murrumba Downs 134
10.7.5 Hills District / Samford 136
10.7.6 Petrie / Dayboro 136
10.7.7 Caboolture – Morayfield 137
10.7.8 Griffin – Mango Hill 138
10.7.9 Strathpine 140
10.7.10 Central Pine West 141
11 REFERENCES 143
APPENDIX A 144
Literature Review 144
MBRC Corporate Plan 145
MBRC Community Plan 146
MBRC Economic Development Strategy 148
State Level Planning Documents 150
South East Queensland Regional Plan 2009-2031 150
Draft Queensland Planning Provisions v3 152
Next Generation Planning – A Handbook for Planners 2011 154
Local Level Planning Documents 156
The Moreton Bay Regional Council Draft Strategic Framework 2011 156
The Caboolture Shire Planning Scheme 2005 158
The Pine Rivers Plan 2005 160
The Redcliffe City Planning Scheme 2005 163
Mango Hill Infrastructure Development Control Plan 1998 165
Mango Hill Local Area Plan 166
Griffin Local Area Plan 168
Dakabin Local Area Plan 169
Centres Network Benchmarking 170
Regional Level Hierarchies 170
APPENDIX B 174
Detailed Retail Expenditure Tables 174
APPENDIX C 183
Supportable Floor Space 183
APPENDIX D 188
Development Approvals 188
Development Approvals 189

Retail & Commercial Sectors Needs Assessment v 24 June 2013 12047 Report Rev 0
LIST OF TABLES Figure 2.1: Planning Areas Definition, Moreton Bay Regional Council 5
Table 2.1: Socio-Economic Profile of Planning Areas, 2011 Census 8
Table 2.2: Projected Population and Households, 2012-2031 11
Table 2.3: Labour Force Size, Planning Areas in Moreton Bay Regional Council, 2008-2011 12
Figure 2.2: Unemployment Rate, Moreton Bay RC and QLD, 2003-2011 13
Table 2.4: Unemployment Rate, Planning Areas in Moreton Bay RC, 2008 to 2011 13
Figure 2.3: Labour Force Participation Rate, Moreton Bay RC and Queensland, 2008-2011 14
Table 2.5: Labour Force Participation Rate, Planning Areas in Moreton Bay RC, 2008 to 2011 15
Table 5.1: Caboolture-Morayfield Principal Regional Activity Centre 28
Table 5.2: Major Regional Activity Centres within Moreton Bay Regional Council 30
Table 5.3: District Centres within Moreton Bay Regional Council 33
Table 5.4: Local Centres within Moreton Bay Regional Council 35
Table 5.5: Comparison of Principal and Major Centre Provision by Local Government Area 45
Table 5.6: Anticipated Population and Employment within MBRC 45
Table 5.7: Anticipated Employment within the North Lakes / Redcliffe / MBRL Precinct 46
Table 5.8: Anticipated Population within the North Lakes / Redcliffe / MBRL Precinct 47
Table 5.9: Current Provision at Principal Activity Centres and Major Centres within Moreton Bay Regional Council 47
Table 5.10: Summary of Community Facilities Provision across existing Principal and Major Activity Centres 48
Table 5.11: Centre Parameters Utilised for Centres Network 53
Figure 6.1: Retail and Commercial Catchments for Moreton Bay Regional Council 55
Table 6.1: Projected Population and Households, 2012-2031 56
Figure 7.1: Methodology for Preparing Retail Floor Space Demand Projections 58
Table 7.1: Weekly Retail Expenditure Patterns of Catchment Area Households, 2012-2031 (2011 dollars) 59
Table 7.2: Annual Available Retail Expenditure within Catchment Areas, 2012-2031 ($M) (2011 dollars) 61
Table 7.3: Expenditure Leakage Range, Moreton Bay Regional Council 64
Table 7.4: Expenditure Leakage outside Moreton Bay RC by Retail Catchment 64
Table 7.5: Supportable Floor Space generated within Retail Catchments, 2012-2031 (sqm) 65
Table 7.6: Activity Centres within Catchments (based on current centres hierarchy) 67
Table 7.7: Principal, Major and Specialised Activity Centres Catchment Areas 70
Table 7.8: Market Shares of Large Scale Activity Centres, Caboolture Morayfield PAC 71
Table 7.9: Market Shares of Large Scale Activity Centres, North Lakes MAC 71
Table 7.10: Market Shares of Large Scale Activity Centres, Strathpine MAC 71
Table 7.11: Market Shares of Large Scale Activity Centres, Redcliffe – Kippa Ring MAC 72

Retail & Commercial Sectors Needs Assessment vi 24 June 2013 12047 Report Rev 0
Table 7.12: Market Shares of Large Scale Activity Centres, Lawnton Employment Area 72
Table 7.13: Market Shares of Large Scale Activity Centres, Rothwell – Deception Bay Catchment 72
Table 7.14: Supply Demand Balance, Caboolture – Morayfield PAC, 2012-2031 (sqm) 73
Table 7.15: Supply Demand Balance, North Lakes MAC, 2012-2031 (sqm) 73
Table 7.16: Supply Demand Balance, Strathpine MAC, 2012-2031 (sqm) 74
Table 7.17: Supply Demand Balance, Redcliffe – Kippa Ring MAC, 2012-2031 (sqm) 74
Table 7.18: Supply Demand Balance, Lawnton Employment Area, 2012-2031 (sqm) 75
Table 7.19: Supply Demand Balance, Rothwell – Deception Bay, 2012-2031 (sqm) 75
Table 7.20: Supply – Demand Balance, Retail Catchments, 2012-2031 (sqm) 76
Figure 8.1: Methodology for Preparing Commercial Office Demand Projections 80
Table 8.1: Projected Size of Working Age Population by Catchment, Moreton Bay Regional Council, 2011-2031 82
Table 8.2: Projected Labour Market Characteristics (15-64 population) by Catchment, Moreton Bay Regional Council, 2011 to 2031 82
Table 8.3: Projected Employment within Commercial Office Sectors by Catchment, Moreton Bay Regional Council, 2011-2031 83
Table 8.4: Projected Employment Retention within Commercial Office Sectors by Catchment, Moreton Bay Regional Council, 2011-2031 84
Table 8.5: Projected Employment within Commercial Office Sectors by Catchment, Moreton Bay Regional Council, 2012-2031 85
Table 8.6: Proportion of Commercial Office Sector Employment within Employing Businesses by Catchment, Moreton Bay Regional Council, 2011-2031 86
Table 8.7: Projected Employment within Commercial Office Space by Catchment, Moreton Bay Regional Council, 2012-2031 87
Table 8.8: Projected Commercial Office Floor Space Demand by Catchment, Moreton Bay Regional Council, 2012-2031 89
Table 8.9: Incremental Commercial Office Floor Space Demand by Catchment, Moreton Bay Regional Council, 2016-2031 90
Figure 9.1: Retail and Commercial Floor Space Need by Catchment 93
Table 9.1: Distribution of Additional Floor Space Demand, Redcliffe (sqm) 94
Figure 9.2: Redcliffe – Kippa Ring MAC 95
Figure 9.3: Margate Village District Centre 95
Table 9.2: Distribution of Additional Floor Space Demand, Lawnton – Bray Park (sqm) 96
Figure 9.4: Lawnton Employment Area 96
Table 9.3: Distribution of Additional Floor Space Demand, Rothwell – Deception Bay (sqm) 97
Figure 9.5: Deception Bay District Centre 97
Table 9.4: Distribution of Additional Floor Space Demand, Bribie Island (sqm) 98
Figure 9.6: Bellara District Centre 98
Table 9.5: Distribution of Additional Floor Space Demand, Caboolture East (sqm) 99
Table 9.6: Distribution of Additional Floor Space Demand, Caboolture Hinterland (sqm) 99
Table 9.7: Distribution of Additional Floor Space Demand, Albany Creek (sqm) 100
Figure 9.7: Albany Creek District Centre 101
Table 9.8: Distribution of Additional Floor Space Demand, Burpengary – Narangba (sqm) 101
Figure 9.8: Vacant Allotments, Burpengary District Centre 102

Retail & Commercial Sectors Needs Assessment vii 24 June 2013 12047 Report Rev 0
Table 9.9: Distribution of Additional Floor Space Demand, Caboolture Midwest (sqm) 103
Figure 9.9: Vacant Allotments, Wamuran Designated Centre 103
Table 9.10: Distribution of Additional Floor Space Demand, Dakabin-Kallangur-Murrumba Downs (sqm) 104
Figure 9.10: Vacant Allotments, Kallangur District Centre 105
Table 9.11: Distribution of Additional Floor Space Demand, Hills District / Samford (sqm) 105
Figure 9.11: Arana Hills District Centre 106
Table 9.12: Distribution of Additional Floor Space Demand, Petrie / Dayboro (sqm) 107
Figure 9.12: Petrie Village District Centre 107
Table 9.13: Distribution of Additional Floor Space Demand, Caboolture - Morayfield (sqm) 108
Figure 9.13: Caboolture Morayfield PAC 109
Table 9.14: Distribution of Additional Floor Space Demand, Griffin – Mango Hill (sqm) 110
Figure 9.14: Vacant Allotments, North Lakes MAC 110
Table 9.15: Distribution of Additional Floor Space Demand, Strathpine (sqm) 111
Figure 9.15: Vacant Allotments, Strathpine MAC 112
Table 9.16: Distribution of Additional Floor Space Demand, Central Pine West (sqm) 113
Figure 9.16: Warner Village District Centre 113
Table 10.1: Recommendations for existing centres 124
Figure 10.1: Albany Creek Catchment Centres 132
Figure 10.2: Burpengary – Narangba Catchment Centres 133
Figure 10.3: Caboolture Midwest Catchment Centres 134
Figure 10.4: Dakabin – Kallangur – Murrumba Downs Catchment Centres 135
Figure 10.5: Hills District / Samford Catchment Centres 136
Figure 10.6: Petrie / Dayboro Catchment Centres 137
Figure 10.7: Caboolture – Morayfield Catchment Centres 138
Figure 10.8: Recommended location of new centres, Griffin – Mango Hill catchment 140
Figure 10.9: Recommended location of new centres, Strathpine catchment 141
Figure 10.10: Central Pine West Catchment Centres 142
Figure A.1: Values of Moreton Bay Regional Council 145
FigureA.2: Integrated Corporate Reporting Structure of Moreton Bay Regional Council 148
Figure A.3: Vision, Economic Development Directives and Goals of the MBRC Economic Development Strategy 150
Figure A.4: Activity Centre Hierarchies in Australia-Regional Planning Hierarchies 171
Table A.1: Comparison of Centre Hierarchies - Local Government Level 171
Table B.1: Weekly retail expenditure patterns of catchment area households, 2012-2031 (2011 dollars) 175
Table B.2: Annual available retail expenditure within the trade areas, 2012-2031 ($M) (2011 dollars) 178
Table C.1: Supportable Floor Space generated within Retail Catchments, 2012-2031 (sqm) 184
Table D.1: Development Approvals, Moreton Bay Regional Council, 2005-2013 190

Retail & Commercial Sectors Needs Assessment 1 24 June 2013 12047 Report Rev 0
1 INTRODUCTION
1.1 Project Background & Purpose of Study
Moreton Bay Regional Council as one of South East Queensland’s (SEQ’s) ‘urban-ring’ councils, has a key role in accommodating future urban growth in SEQ. Management of this growth is necessary to mitigate the challenges caused by urban sprawl, such as high levels of commuting, the need for additional transport capacity, significant expenditure leakage, and low levels of employment and economic containment.
Identifying acceptable and sustainable carrying capacity in the Moreton Bay Region together with the economic, social and physical infrastructure necessary to support the region’s communities, is an essential element to future growth management.
The complex and diverse range of issues related to the management of urban growth and infrastructure delivery is being addressed at both the local and state (regional) level, but this project in particular has the opportunity to deliver on fundamental economic objectives, such as sustainability and diversity of employment opportunities and improved employment self-containment.
The South East Queensland’s Regional Plan Desired Regional Outcome (DRO) 9 seeks to plan for employment to support a strong, resilient and diversified economy that grows prosperity in the region by using the regions’ competitive advantages to deliver exports, investment and sustainable and accessible jobs.
The Moreton Bay Region has experienced strong population growth over recent years, outperforming SEQ and Queensland. While population growth is expected to moderate over the next twenty years, existing issues within the region relating to strong population growth are expected to remain problematic in the absence of proactive solutions. Given the challenges of growth, it is important to plan for accessible employment opportunities with the Moreton Bay Region.
Employment and business accessibility has many aspects, including:
• The ability for employers to reach workers and vice versa;
• The means by which that workers and consumers utilise to access businesses;
• The rights of businesses to conduct their business economically and sustainability;
• The rights of workers to be employed in environments and businesses that meet their values and expectations; and
• The means by which businesses can access customer and supplier markets, etc.
The delivery of a sustainable centres hierarchy to support the commercial and retail sectors within the Moreton Bay Region can also be interpreted as offering an accessible business climate. An important task for strategy development then is to identify relevant economic and market, environmental, infrastructure and planning constraints to retail and commercial business development and opportunity. Hence, this present study is an important opportunity to investigate and embrace sustainable centres that are accessible to workers and consumers, serviced by infrastructure, reflective of evolving tenant needs and expectations and that add value to the social, economic and environmental framework.

Retail & Commercial Sectors Needs Assessment 2 24 June 2013 12047 Report Rev 0
The purpose of this study is to develop a sustainable centres hierarchy to support retail and commercial activity within the Moreton Bay Region.
1.2 Report Structure
The report is structured as follows:
• Chapter 1: Introduction: Outlines the project background and the purpose of this study.
• Chapter 2: Socio Economic Overview of the Moreton Bay Region: Provides an overview of the demographic characteristics, population projections and labour force characteristics of the planning areas benchmarked to Moreton Bay Regional Council (MBRC), South East Queensland (SEQ) and Queensland. The chapter also provides an overview of the recent development approvals within Moreton Bay Regional Council.
• Chapter 3: Key Policy and Planning Issues: Summarises the key strategic and statutory planning issues in terms of: statutory compliance / integrity; statutory alignment; composition; consistency; complexity; and currency.
• Chapter 4: Retail, Commercial and Centre Trends: Outlines the retail, commercial and centres trends including: types of shopping trips; types of shoppers; types of retail centres; trends in retail development; commercial office trends; in-centre residential trends; and planning policy trends.
• Chapter 5: Centres Network and Hierarchy: Identifies the existing centres network with Moreton Bay Regional Council and the metrics for principal and major centres. The chapter also recommends a centres hierarchy for Moreton Bay Regional Council looking forward.
• Chapter 6: Retail and Commercial Catchment Definition: Defines retail and commercial catchment boundaries based on the existing centres network and additional factors and provides population projections for the defined catchments.
• Chapter7: Projected Retail Floor Space Demand: Estimates retail floor space demand by catchment to 2031 and categorises the catchments into low, moderate and high need.
• Chapter 8: Projected Commercial Floor Space Demand: Estimates commercial floor space demand by catchment to 2031 and categorises the catchments into low, moderate and high need.
• Chapter 9: Retail and Commercial Catchment Summary: Estimates floor space demand by centre for each of the catchments and provides an overview of the development approvals within each catchment.
• Chapter 10: Recommendations and Strategy: The chapter summarises the planning and implementation of recommendations for each catchment.
• Chapter 11: References
• Appendix A: Literature review of key policy and planning issues
• Appendix B: Detailed retail expenditure tables
• Appendix C: Detailed supportable floor space table
• Appendix D: Development approvals

Retail & Commercial Sectors Needs Assessment 3 24 June 2013 12047 Report Rev 0
1.3 Interpretation
This report represents a strategic assessment of retail and commercial sector activity within the Moreton Bay Region. It includes a range of projections over a twenty year horizon which form the basis of a series of strategic centre recommendations. The delivery of new centres should be accompanied by appropriate small area analyses at the time of delivery to account for micro-level conditions and / or change in the anticipated outlook.

Retail & Commercial Sectors Needs Assessment 4 24 June 2013 12047 Report Rev 0
2 SOCIO ECONOMIC OVERVIEW OF THE MORETON BAY REGION DISTRICTS
2.1 Moreton Bay Regional Council Draft Strategic Framework Districts
The planning areas for this study were derived based on the place type planning areas presented in the Moreton Bay Regional Council Draft Strategic Framework, using both statistical local area (SLA) and statistical area level 1 (SA1) boundaries. Seven catchments were defined for Moreton Bay Regional Council, these being:
• Strathpine City;
• North Lakes;
• Redcliffe;
• Caboolture City;
• Bribie & Coastal Villages;
• North West Rural; and
• South West Rural.
The definition of planning areas used here differs slightly from that in the Moreton Bay Regional Council Draft Strategic Framework as follows:
• The North Lakes Redcliffe Moreton Bay Rail Link planning area has been split into two distinct planning areas; and
• The rural planning area has been split into North West Rural and South West Rural.
The purpose of this section is to provide an overview and context of the various ‘districts’ identified in the Moreton Bay Regional Council Draft Strategic Framework. Base data for these districts is disaggregated in later sections of this report pertaining to more refined retail and commercial catchments.
Figure 2.1 provides a geographic overview of the planning areas in Moreton Bay Regional Council.

Retail & Commercial Sectors Needs Assessment 5 24 June 2013 12047 Report Rev 0
Figure 2.1: Planning Areas Definition, Moreton Bay Regional Council

Retail & Commercial Sectors Needs Assessment 6 24 June 2013 12047 Report Rev 0
2.2 Socio Economic Overview
2.2.1 2011 Census Data
A socio-economic profile of the catchment areas as at the 2011 Census of Population and Housing, benchmarked against Moreton Bay Regional Council (Moreton Bay RC), South East Queensland (SEQ) and Queensland, is provided in Table 2.1 below. A number of key points can be drawn from this profile including:
• The population of Moreton Bay RC was 378,045 persons in 2011, accounting for approximately 1.4% of the SEQ population. The most populous planning areas of Moreton Bay RC are North Lakes (26.6% of Moreton Bay RC), Strathpine City (25.8%) and Caboolture City (18.1%);
• Moreton Bay RC had a population profile similar to SEQ and Queensland. The Redcliffe and Bribie and Coastal Villages planning areas had significantly older populations relative to Moreton Bay RC, SEQ and Queensland. On the other hand, the Strathpine City, North Lakes and Caboolture City planning areas had younger population profiles than Moreton Bay RC, SEQ and Queensland;
• Moreton Bay RC recorded a slightly higher incidence of couple families with children households (44.9%) than SEQ (43.6%) and Queensland (42.8%). The Strathpine City planning area had a significantly higher proportion of couple families with children households (51.6%) while Bribie and Coastal Villages (27.7%) and Redcliffe planning areas (36.4%) had a significantly lower proportion of couple families with children households;
• A lower proportion of households were renting in Moreton Bay RC (29.3% of households) than in SEQ (33.0%) and Queensland (33.2%). A higher proportion of households were purchasing their home (i.e. had a mortgage) in Moreton Bay RC (39.8% of households) than in SEQ (36.0%) and Queensland (34.5%). The incidence of households with a mortgage was highest in South West Rural (51.8%) and Strathpine City (49.6%);
• On average, household incomes were marginally lower in Moreton Bay RC ($1,490 per week) than in SEQ ($1,534 per week and Queensland ($1,501 per week). Average household incomes were highest in South West Rural ($2,036 per week) and Strathpine City planning areas ($1,779 per week) and lowest in Bribie and Coastal Villages ($1,075 per week) and Redcliffe ($1,261 per week). Housing costs (i.e. average mortgages and rents) were also marginally lower in Moreton Bay RC than in SEQ and Queensland. Housing costs in South West Rural were significantly higher than all other planning areas;
• Moreton Bay RC recorded similar full-time employment, part-time employment and total employment rates to SEQ and Queensland. Bribie and Coastal Villages recorded a significantly lower full-time employment rate (52.6.8%) than SEQ (59.3%) and Queensland (60.0%), while a higher rate was experienced in Strathpine City (61.7%) and North Lakes (61.5%);
• Caboolture City and Bribie and Coastal Villages recorded significantly higher unemployment rates (8.2% and 8.4% respectively) than Moreton Bay RC (6.2%), SEQ (6.2%) and Queensland (6.1%), while South West Rural (4.1%) and Strathpine City (4.6%) recorded significantly lower unemployment rates;

Retail & Commercial Sectors Needs Assessment 7 24 June 2013 12047 Report Rev 0
• A marginally lower proportion of persons with a post-school qualification was recorded in Moreton Bay RC (42.2%) than SEQ (45.6%) and Queensland (43.3%). A significantly higher proportion of persons with post-school qualifications were recorded in South West Rural (54.4%) while a lower proportion was recorded in North West Rural (34.2%) and Bribie and Coastal Villages (36.4%);
• Moreton Bay RC experienced a significantly lower proportion of upper white collar workers (26.6%) than SEQ (32.6%) and Queensland (31.0%) and a marginally higher proportion of lower white collar workers. South West Rural (41.2%) recorded a significantly higher proportion of upper white collar workers than Moreton Bay RC, SEQ and Queensland, while Caboolture City (20.5%) recorded a significantly lower proportion. Significantly lower proportions of lower white collar workers were recorded in North West Rural (30.7%) and South West Rural (31.5%) than in Moreton Bay RC (37.7%), SEQ (35.8%) and Queensland (34.4%). Proportions of lower blue collar workers recorded in South West Rural (10.3%) and Strathpine City (13.5%) were significantly lower than those recorded in Caboolture City (24.4%), Moreton Bay RC (18.0%), SEQ (15.7%) and Queensland (17.9%); and
• North West Rural recorded a significantly higher proportion of employment in the agriculture, forestry and fishing industry (10.1%) than Moreton Bay RC (1.0%) SEQ (0.9%) and Queensland (0.9%).

Retail & Commercial Sectors Needs Assessment 8 24 June 2013 12047 Report Rev 0
Table 2.1: Socio-Economic Profile of Planning Areas, 2011 Census
Strathpine City
North Lakes
Redcliffe Caboolture City
Bribie and Costal Villages
North West Rural
South West Rural
MBRC SEQ Queensland
Population 97,584 100,590 55,993 68,555 30,665 6,371 18,277 378,045 3,302,559 4,332,739 Age Distribution 0-4 years 7.6% 8.8% 6.0% 8.3% 4.5% 5.7% 6.4% 7.5% 6.9% 6.9%
5-14 years 15.0% 15.9% 11.5% 15.4% 10.6% 13.5% 16.6% 14.5% 13.2% 13.3%
15-19 years 7.6% 7.2% 6.3% 7.7% 5.4% 6.9% 7.9% 7.1% 6.9% 6.8%
20-24 years 6.2% 6.2% 5.3% 7.0% 3.5% 5.8% 4.1% 5.9% 7.1% 6.8%
25-34 years 13.1% 13.8% 10.7% 12.8% 7.1% 12.5% 6.9% 12.1% 14.0% 13.6%
35-44 years 16.1% 15.8% 13.5% 13.6% 10.6% 14.6% 17.0% 14.8% 14.6% 14.3%
45-54 years 14.3% 12.5% 13.9% 12.8% 12.4% 15.7% 17.5% 13.5% 13.4% 13.6%
55-64 years 11.0% 9.7% 13.6% 11.0% 16.7% 13.5% 13.9% 11.7% 11.2% 11.6%
65-74 years 5.9% 5.8% 9.9% 6.6% 17.2% 8.2% 6.9% 7.6% 7.1% 7.4%
75-84 years 2.4% 3.0% 6.5% 3.5% 9.3% 2.8% 2.2% 3.9% 4.0% 4.1%
85 years and over 0.9% 1.2% 2.8% 1.4% 2.8% 0.8% 0.6% 1.5% 1.7% 1.6%
Average age (years) 35.3 34.6 42.0 35.6 47.5 38.3 37.2 37.3 37.4 37.7
Household Type (% of families) Couple families with children 51.6% 47.8% 36.4% 43.8% 27.7% 41.5% 47.9% 44.9% 43.6% 42.8%
Couple families without children 33.3% 34.2% 41.8% 34.8% 56.4% 42.1% 33.5% 37.3% 38.2% 39.5%
Single parent family 14.0% 16.9% 20.0% 20.1% 14.9% 15.8% 8.4% 16.6% 16.4% 16.1%
Other 1.2% 1.1% 1.8% 1.3% 0.9% 0.7% 0.6% 1.2% 1.8% 1.7%
Average household size 3.0 3.0 2.5 3.0 2.4 3.2 3.1 2.9 2.8 2.8
Average vehicle ownership 1.9 1.8 1.5 1.8 1.6 2.1 2.3 1.8 1.7 1.7
Household Finances % of households fully owning home 27.7% 22.0% 30.0% 23.3% 43.3% 35.0% 36.1% 27.9% 27.8% 29.0%
% of households purchasing home 49.6% 44.2% 27.7% 36.6% 23.8% 42.1% 51.8% 39.8% 36.0% 34.5%
% of households renting 20.5% 30.8% 38.4% 36.8% 29.1% 20.5% 10.3% 29.3% 33.0% 33.2%
Average weekly household income $1,779 $1,539 $1,261 $1,331 $1,075 $1,318 $2,036 $1,490 $1,534 $1,501
Average monthly housing loan repayment $2,003 $2,010 $1,859 $1,848 $1,816 $1,844 $2,383 $1,973 $2,033 $1,976
Average weekly rent payment $325 $320 $274 $280 $277 $267 $350 $298 $322 $299
Labour Market Full-time employment (% labour force) 61.7% 61.5% 57.9% 56.7% 52.6% 57.6% 58.3% 59.5% 59.3% 60.0% Part-time employment (% labour force) 28.0% 26.6% 29.2% 28.9% 32.6% 31.1% 32.2% 28.5% 29.0% 28.2% Total employment (% labour force) 95.4% 93.9% 93.0% 91.8% 91.6% 94.9% 95.9% 93.8% 93.8% 93.9%

Retail & Commercial Sectors Needs Assessment 9 24 June 2013 12047 Report Rev 0
Strathpine City
North Lakes
Redcliffe Caboolture City
Bribie and Costal Villages
North West Rural
South West Rural
MBRC SEQ Queensland
Unemployment rate (% labour force) 4.6% 6.1% 7.0% 8.2% 8.4% 5.1% 4.1% 6.2% 6.2% 6.1% Participation rate (% of population > 15 years) 71.8% 66.6% 56.4% 60.1% 43.3% 53.3% 69.3% 63.0% 63.7% 62.8% Qualifications % of persons with a non-school qualification 47.9% 41.8% 39.9% 37.0% 36.5% 34.2% 54.4% 42.2% 45.6% 43.3% % of persons with Bachelor or higher 16.8% 10.5% 11.3% 7.4% 8.0% 7.6% 24.7% 12.1% 18.3% 15.9% % of persons with Diploma 9.4% 8.0% 7.6% 6.3% 6.9% 5.8% 10.4% 8.0% 8.2% 7.5% % of persons with Certificate 21.8% 23.3% 21.1% 23.3% 21.6% 20.8% 19.3% 22.2% 19.1% 19.9% Occupation Upper White Collar Managers 11.2% 10.2% 9.7% 9.3% 10.8% 14.7% 15.0% 10.7% 11.7% 12.0% Professionals 19.4% 14.2% 16.0% 11.2% 12.4% 11.6% 26.3% 15.9% 20.9% 18.9% Subtotal 30.6% 24.4% 25.7% 20.5% 23.3% 26.3% 41.2% 26.6% 32.6% 31.0% Lower White Collar Community & Personal Service Workers 10.2% 10.6% 11.6% 10.6% 10.9% 9.7% 8.5% 10.5% 10.0% 10.0% Clerical and Admin Workers 18.8% 16.9% 15.9% 14.7% 15.3% 12.3% 15.2% 16.7% 15.6% 14.7% Sales Workers 10.0% 11.1% 10.4% 10.9% 11.6% 8.8% 7.8% 10.5% 10.2% 9.8% Subtotal 39.0% 38.7% 37.9% 36.2% 37.8% 30.7% 31.5% 37.7% 35.8% 34.4% Upper Blue Collar Technicians & Trades Workers 15.3% 16.3% 15.4% 16.9% 17.2% 16.4% 15.1% 16.0% 14.2% 14.9% Subtotal 15.3% 16.3% 15.4% 16.9% 17.2% 16.4% 15.1% 16.0% 14.2% 14.9% Lower Blue Collar Machinery Operators & Drivers 5.7% 8.1% 7.3% 9.9% 8.2% 9.1% 4.0% 7.4% 6.1% 7.3% Labourers 7.7% 10.8% 11.7% 14.5% 11.6% 15.5% 6.2% 10.5% 9.6% 10.6% Subtotal 13.5% 18.9% 19.0% 24.4% 19.8% 24.6% 10.3% 18.0% 15.7% 17.9% Employment by Industry (% of employees) Agriculture, forestry & fishing 0.2% 0.4% 0.3% 2.9% 1.3% 10.1% 1.4% 1.0% 0.9% 0.9% Mining 1.0% 1.0% 1.0% 1.0% 1.7% 1.4% 1.6% 1.1% 1.2% 1.2% Manufacturing 8.6% 11.2% 10.6% 10.7% 9.3% 10.1% 6.8% 9.9% 8.7% 8.7% Electricity, gas, water & waste services 1.5% 1.5% 1.1% 1.5% 1.1% 1.5% 1.4% 1.4% 1.1% 1.1% Construction 8.9% 9.9% 9.7% 11.4% 12.0% 11.9% 10.2% 10.0% 9.1% 9.1% Wholesale trade 3.9% 4.2% 3.7% 3.9% 3.4% 3.2% 3.6% 3.9% 3.9% 3.9% Retail trade 10.8% 12.3% 10.9% 12.5% 13.0% 11.2% 8.5% 11.5% 10.7% 10.7% Accommodation & food services 5.1% 5.4% 6.5% 6.0% 7.5% 4.6% 4.4% 5.6% 6.9% 6.9% Transport, postal & warehousing 5.7% 7.2% 6.8% 7.1% 5.7% 5.1% 4.9% 6.5% 5.2% 5.2% Information media & telecommunications 1.5% 1.1% 1.2% 0.9% 0.9% 0.9% 1.5% 1.2% 1.4% 1.4%

Retail & Commercial Sectors Needs Assessment 10 24 June 2013 12047 Report Rev 0
Strathpine City
North Lakes
Redcliffe Caboolture City
Bribie and Costal Villages
North West Rural
South West Rural
MBRC SEQ Queensland
Financial & insurance services 3.8% 2.8% 2.2% 1.8% 1.9% 1.1% 3.1% 2.8% 3.2% 3.2% Rental, hiring & real estate services 1.5% 1.8% 1.9% 1.4% 2.5% 1.4% 2.0% 1.7% 1.9% 1.9% Professional, scientific & technical services 7.1% 4.9% 5.1% 4.0% 4.6% 4.3% 10.8% 5.7% 7.6% 7.6% Administrative & support services 3.1% 3.3% 3.3% 3.4% 3.1% 2.7% 3.0% 3.2% 3.4% 3.4% Public administration & safety 9.3% 6.9% 6.3% 5.8% 5.6% 7.2% 7.6% 7.3% 6.6% 6.6% Education & training 8.0% 6.1% 6.8% 6.1% 6.2% 5.2% 9.5% 6.9% 8.0% 8.0% Health care & social assistance 12.7% 12.7% 15.0% 11.7% 12.7% 9.8% 11.5% 12.7% 12.3% 12.3% Arts & recreation services 1.3% 1.0% 1.2% 1.1% 1.2% 1.3% 1.7% 1.2% 1.6% 1.6% Other services 6.0% 6.4% 6.5% 6.7% 6.6% 7.1% 6.3% 6.4% 6.1% 6.1%
Source: Australian Bureau of Statistics (2012a)

Retail & Commercial Sectors Needs Assessment 11 24 June 2013 12047 Report Rev 0
2.3 Population and Household Projections
The population of Moreton Bay RC is projected to increase from 391,596 persons in 2012 to 534,362 persons in 2031, or by approximately 1.6% per annum. The number of households in Moreton Bay RC is projected to increase by 1.7% per annum from 155,589 households in 2012 to 216,221 households in 2031.
The rate of population growth and household formation in Moreton Bay RC is anticipated to be slightly lower than in SEQ and Queensland.
Within Moreton Bay RC, the rate of population growth and household formation is projected to be highest in the North Lakes, Caboolture City and North West Rural planning areas.
The Redcliffe, Bribie and Coastal Villages and South West Rural planning areas are projected to record population growth and household formation rates significantly lower than in Moreton Bay RC, SEQ and Queensland.
Table 2.2 below provides a summary of the projected population growth and household formation within Moreton Bay RC by planning area, benchmarked against SEQ and Queensland.
Table 2.2: Projected Population and Households, 2012-2031
2012 2016 2021 2026 2031 Ave. Ann Growth 2012 to 2031
Population Strathpine City 98,985 105,650 111,888 116,737 120,649 1.0% North Lakes 103,901 123,130 142,217 160,548 172,693 2.7% Redcliffe 57,083 59,183 61,298 62,593 64,298 0.6% Caboolture City 69,600 81,734 90,607 95,679 106,455 2.3% Bribie & Coastal Villages 34,090 35,318 36,503 36,539 36,602 0.4% North West Rural 8,621 9,679 10,792 11,744 13,067 2.2% South West Rural 19,315 20,244 20,372 20,400 20,598 0.3% Moreton Bay Regional Council 391,596 434,938 473,677 504,240 534,362 1.6% SEQ 3,130,730 3,394,182 3,729,934 4,064,556 4,393,841 1.8% Queensland 4,703,979 5,092,858 5,588,617 6,090,548 6,592,857 1.8% Households Strathpine City 36,117 39,017 41,779 44,044 45,649 1.2% North Lakes 39,473 47,007 54,730 61,882 66,640 2.8% Redcliffe 26,697 27,849 29,362 30,702 31,755 0.9% Caboolture City 26,456 31,144 34,888 37,314 41,385 2.4% Bribie & Coastal Villages 16,940 17,599 18,167 18,195 18,217 0.4% North West Rural 3,268 3,739 4,238 4,670 5,235 2.5% South West Rural 6,639 7,034 7,169 7,226 7,340 0.5% Moreton Bay Regional Council 155,589 173,389 190,333 204,033 216,221 1.7% SEQ 1,225,957 1,342,392 1,491,036 1,638,889 1,787,540 2.0% Queensland 1,844,869 2,020,294 2,241,451 2,463,297 2,689,502 2.0%

Retail & Commercial Sectors Needs Assessment 12 24 June 2013 12047 Report Rev 0
2012 2016 2021 2026 2031 Ave. Ann Growth 2012 to 2031
Average Household Size Strathpine City 2.74 2.71 2.68 2.65 2.64 - North Lakes 2.63 2.62 2.60 2.59 2.59 - Redcliffe 2.14 2.13 2.09 2.04 2.02 - Caboolture City 2.63 2.63 2.60 2.57 2.58 - Bribie & Coastal Villages 2.01 2.02 2.02 2.02 2.02 - North West Rural 2.64 2.59 2.55 2.51 2.50 - South West Rural 2.91 2.88 2.84 2.82 2.81 - Moreton Bay Regional Council 2.52 2.51 2.49 2.47 2.47 - SEQ 2.55 2.53 2.50 2.48 2.46 - Queensland 2.55 2.52 2.49 2.47 2.45 -
Note: The population and household projections presented in this table for Moreton Bay RC are based on those presented in Moreton Bay Regional Council (2012a) Planning Assumptions Specification – October 2012 and have been adjusted to address the inconsistency between planning area boundaries do not match perfectly with SLA boundaries. Source: Moreton Bay Regional Council (2012a), Office of Economic and Statistical Research (2011), Office of Economic and Statistical Research (2012)
2.4 Labour Force
This section provides a brief overview of the small area labour market statistics, available at the statistical local area (SLA) level and above. The analysis has been undertaken at SLA level and above because there is presently no means to adjust for SA1 boundaries.
In the past four years to 2011, the resident labour force in Moreton Bay RC increased from 172,463 persons to 186,701 persons or by 2.7% per annum. Over that period, total and sub-regional labour force growth in Moreton Bay RC mirrored the Queensland growth rate. In 2011 however, the Moreton Bay RC labour force shrank (by 0.4%) whereas the Queensland labour force grew (by 1.5%).
A summary of the labour force size in the Moreton Bay RC, its planning areas and Queensland between 2008 and 2011 is presented in Table 2.3.
Table 2.3: Labour Force Size, Planning Areas in Moreton Bay Regional Council, 2008-2011
Strathpine City
North Lakes
Redcliffe Caboolture City
Bribie and Costal Villages
North West Rural
South West Rural
MBRC QLD
2008 53,285 41,325 25,015 26,210 13,025 2,635 10,970 172,463 2,292,384 2009 55,683 43,192 26,143 27,397 13,614 2,755 11,466 180,249 2,354,420 2010 57,923 44,942 27,197 28,511 14,168 2,867 11,931 187,538 2,436,875 2011 57,675 44,738 27,079 28,378 14,102 2,853 11,876 186,701 2,472,850 Ave. Ann. Chg, 2008-11
2.7% 2.7% 2.7% 2.7% 2.7% 2.7% 2.7% 2.7% 2.6%
Ave. Ann. Chg, 2010-11
-0.4% -0.5% -0.4% -0.5% -0.5% -0.5% -0.5% -0.4% 1.5%
Source: Department of Employment and Workplace Relations (various years)
2.4.1 Unemployment
Between 2008 and 2011, all planning areas within Moreton Bay RC recorded a rise in unemployment as did Queensland, although the Moreton Bay RC unemployment rate was

Retail & Commercial Sectors Needs Assessment 13 24 June 2013 12047 Report Rev 0
consistently lower than the state average (Figure 2.2). The unemployment rate was lowest in South West Rural and Strathpine City planning catchments, and highest in Caboolture City, Bribie and Coastal Villages and Redcliffe.
Figure 2.2: Unemployment Rate, Moreton Bay RC and QLD, 2003-2011
Source: Department of Employment and Workplace Relations (various years)
The unemployment rates in each of the planning areas in Moreton Bay RC, benchmarked against Moreton Bay RC and Queensland between 2008 and 2011 are summarised in Table 2.4.
Table 2.4: Unemployment Rate, Planning Areas in Moreton Bay RC, 2008 to 2011
Strathpine City
North Lakes
Redcliffe Caboolture City
Bribie and Costal Villages
North West Rural
South West Rural
MBRC QLD
2008 1.5% 2.6% 3.6% 4.4% 4.5% 2.6% 1.0% 2.7% 3.7% 2009 2.8% 4.8% 6.3% 7.8% 7.9% 5.4% 2.0% 4.9% 5.4% 2010 2.6% 4.5% 5.6% 7.2% 7.1% 4.6% 1.7% 4.5% 5.5%
Source: Department of Employment and Workplace Relations (various years)

Retail & Commercial Sectors Needs Assessment 14 24 June 2013 12047 Report Rev 0
2.4.2 Labour Force Participation
The labour force participation rate in Moreton Bay RC was consistently lower than Queensland between 2008 and 2011. Recent falls in participation rates have been sharper in Moreton Bay RC than in Queensland (Figure 2.3).
Figure 2.3: Labour Force Participation Rate, Moreton Bay RC and Queensland, 2008-2011
Source: Department of Employment and Workplace Relations (various years)
The average labour force participation rate between 2008 and 2011 was:
• 73.6% in Strathpine City planning area;
• 61.0% in North Lakes planning area;
• 56.2% in Redcliffe planning area;
• 58.5% in Caboolture City planning area;
• 45.9% in Bribie and Coastal Villages planning area;
• 50.5% in North West Rural planning area;
• 71.9% in South West Rural planning area;
• 62.0% in Moreton Bay RC; and
• 66.9% in Queensland.
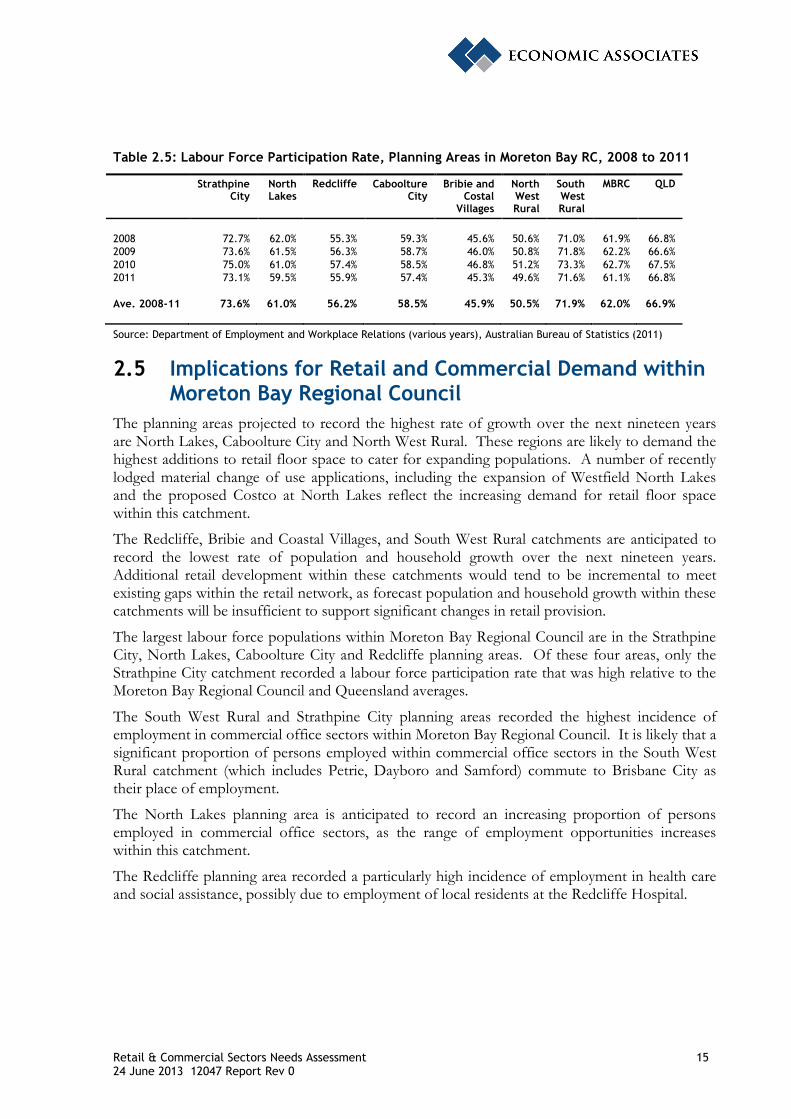
The labour force participation rate in the Moreton Bay RC, its planning areas and Queensland between 2008 and 2011 are summarised in Table 2.5.
Retail & Commercial Sectors Needs Assessment 15 24 June 2013 12047 Report Rev 0
Table 2.5: Labour Force Participation Rate, Planning Areas in Moreton Bay RC, 2008 to 2011
Strathpine City
North Lakes
Redcliffe Caboolture City
Bribie and Costal Villages
North West Rural
South West Rural
MBRC QLD
2008 72.7% 62.0% 55.3% 59.3% 45.6% 50.6% 71.0% 61.9% 66.8% 2009 73.6% 61.5% 56.3% 58.7% 46.0% 50.8% 71.8% 62.2% 66.6% 2010 75.0% 61.0% 57.4% 58.5% 46.8% 51.2% 73.3% 62.7% 67.5% 2011 73.1% 59.5% 55.9% 57.4% 45.3% 49.6% 71.6% 61.1% 66.8% Ave. 2008-11 73.6% 61.0% 56.2% 58.5% 45.9% 50.5% 71.9% 62.0% 66.9%
Source: Department of Employment and Workplace Relations (various years), Australian Bureau of Statistics (2011)
2.5 Implications for Retail and Commercial Demand within Moreton Bay Regional Council
The planning areas projected to record the highest rate of growth over the next nineteen years are North Lakes, Caboolture City and North West Rural. These regions are likely to demand the highest additions to retail floor space to cater for expanding populations. A number of recently lodged material change of use applications, including the expansion of Westfield North Lakes and the proposed Costco at North Lakes reflect the increasing demand for retail floor space within this catchment.
The Redcliffe, Bribie and Coastal Villages, and South West Rural catchments are anticipated to record the lowest rate of population and household growth over the next nineteen years. Additional retail development within these catchments would tend to be incremental to meet existing gaps within the retail network, as forecast population and household growth within these catchments will be insufficient to support significant changes in retail provision.
The largest labour force populations within Moreton Bay Regional Council are in the Strathpine City, North Lakes, Caboolture City and Redcliffe planning areas. Of these four areas, only the Strathpine City catchment recorded a labour force participation rate that was high relative to the Moreton Bay Regional Council and Queensland averages.
The South West Rural and Strathpine City planning areas recorded the highest incidence of employment in commercial office sectors within Moreton Bay Regional Council. It is likely that a significant proportion of persons employed within commercial office sectors in the South West Rural catchment (which includes Petrie, Dayboro and Samford) commute to Brisbane City as their place of employment.
The North Lakes planning area is anticipated to record an increasing proportion of persons employed in commercial office sectors, as the range of employment opportunities increases within this catchment.
The Redcliffe planning area recorded a particularly high incidence of employment in health care and social assistance, possibly due to employment of local residents at the Redcliffe Hospital.

Retail & Commercial Sectors Needs Assessment 16 24 June 2013 12047 Report Rev 0
3 KEY POLICY AND PLANNING ISSUES
The following documents were reviewed during the course of this present study:
• State level planning documents;
– South East Queensland Regional Plan 2009-2031;
– Draft Queensland Planning Provisions v3;
– Next Generation Planning – A Handbook for Planners, Designers and Developers in South East Queensland 2011;
• Local level planning documents;
– The Moreton Bay Regional Council Draft Strategic Framework 2011;
– The Caboolture Shire Planning Scheme 2005;
– The Pine Rivers Plan 2005;
– The Redcliffe City Planning Scheme 2005;
– Mango Hill Development Control Plan 1998;
• Local area plans;
– Mango Hill Local Area Plan;
– Griffin Local Area Plan; and
– Dakabin Local Area Plan.
A summary of the literature reviews can be found in Appendix A.
From the literature reviews this study has drawn a series of overall town planning conclusions that are relevant to needs within the retail and commercial sectors, and to the future approach adopted in respect of “centres planning” in Moreton Bay Regional Council.
The initial points identified are observations derived from an appraisal of the content and approach of existing statutory planning instruments, and the extent to which their content and regulatory approach will assist or hinder future commercial, retail and centres planning. The list of observations made at this stage of the project is not intended to be exhaustive or complete and is confined to those that emerged from the literature reviews. Observations made are intended to inform a broader and more detailed assessment of retail, commercial and centres planning in subsequent stages of the study.
3.1 Key Strategic and Statutory Planning Issues
Key planning and policy issues identified have been categorised to group common issues and provide a framework for new or remedial policy responses likely to emerge later in the study.
Issues identified through the initial literature review have been broadly categorised as follows:

Retail & Commercial Sectors Needs Assessment 17 24 June 2013 12047 Report Rev 0
• Statutory Compliance / Integrity: The need for planning and policy approaches that comply with relevant statutory requirements particularly those relating to the composition and regulatory approach mandated under the Sustainable Planning Act 2012;
• Statutory Alignment: The need for retail, commercial and centres planning instruments to vertically integrate with parent policy instruments (e.g. SEQ Regional Plan);
• Composition: The need for the composition of retail, commercial and centres planning instruments to comply with mandatory statutory or regulatory provisions dealing with structure and content (e.g. Queensland Planning Provisions QPP);
• Consistency: The need to ensure current alternative strategic and statutory planning approaches for retail, and commercial uses and centres across the MBRC are rationalised to achieve uniformity and consistency;
• Complexity: The need to ensure land use regulatory approaches applied to retail and commercial uses and centres, are no more complex than is necessary to efficiently and effectively articulate and implement preferred policy outcomes. In this regard an emphasis on lowering the regulatory burden is favoured, particularly where regulation results in a lack of procedural clarity, unnecessary costs and/or does not materially enhance the achievement of preferred planning outcomes. Eradicating “regulation for regulations sake” is of particular importance; and
• Currency: The need to ensure contemporary planning approaches and industry best practices is reflected in the composition and structure of retail, commercial and centres planning instruments.
3.1.1 Statutory Compliance / Integrity
There is a need to ensure that future planning scheme provisions dealing with retail and commercial development and centres planning are framed so as to definitively respond to and address the “key elements” and “core matters” relevant to planning schemes pursuant to sections 88 and 89 of the Sustainable Planning Act 2009.
Section 55 of the Sustainable Planning Act 2009 requires that planning scheme provisions are amended to achieve consistency with the standard planning scheme provisions. The applicable standard planning scheme provisions in this case are the Queensland Planning Provisions (QPP v3).
3.1.2 Statutory Alignment
A review of existing planning schemes and scheme components regulating development in the MBRC area reveals a general absence of vertical integration between existing planning schemes and both the Activity Centres concept and Activity Centres Network under the SEQ Regional Plan 2009-2031.
There is notable disparity in the extent to which former planning schemes align with the SEQ Regional Plan. Where this disparity is the greatest it is primarily a result of:
• Planning Schemes pre-dating the formulation of the SEQ Regional Plan; and/or
• The adoption of more traditional retail/commercial centre hierarchies as a means of implementing a structured approach to centre order and function.

Retail & Commercial Sectors Needs Assessment 18 24 June 2013 12047 Report Rev 0
Planning Schemes / Instruments which go to some way to incorporating an Activity Centres network do not fully embrace relevant principles at all levels.
3.1.3 Composition
Section 55 of the Sustainable Planning Act 2009 requires that planning scheme provisions are amended to achieve consistency with the standard planning scheme provisions. The applicable standard planning scheme provisions in this case are the Queensland Planning Provisions (QPP v3).
A common and uniform methodology for retail, commercial and centres planning is required to address the mandatory elements of the QPP, which most notably include:
• Strategic Framework - Strategic outcomes, themes, elements etc.
• The standard suite land use and administrative definitions;
• The standard suite of land use zones;
• The tables of assessment (format and composition); and
• The assessment categories (most notably the identification of exempt and compliance assessable development within tables of assessment).
Locality based provisions adopted under some existing planning schemes (e.g. Pine Rivers Plan) are not readily transferrable or compatible with the predominantly zone/precinct based provisions mandated by the QPP.
3.1.4 Consistency
A review of existing planning schemes and scheme components regulating development in the MBRC area reveals a general absence of horizontal integration between existing planning schemes in terms of components, regulatory approach and terminology for the regulation of retail and commercial development and identified centres. A uniform and consistent centres typology across the new Local Government area will be required to achieve improved clarity of land use intent for different centres in the network and the adoption of consistent implementation mechanisms.
The alignment of existing centre classification systems used under the component planning schemes of the MBRC will be required to appropriately reflect the SEQ ‘Place Model’ and the QPP.
3.1.5 Complexity
Some planning instruments, (for example the Pine Rivers Plan which relies on multiple levels of regulation including localities, locality precincts, zones and zone sub-precincts to convey preferred land use intent) are unnecessarily complex and overly prescriptive. Multi-tiered regulatory approaches can fragment and obscure the clear articulation of land use intent and results in unnecessary over regulation.
Differentiation in the role and function of alternative retail and commercial areas is best achieved at Zone level to the extent permitted under the QPP. The Redcliffe Planning Scheme provides an example of a planning instrument where limited differentiation in role and function at Zone
Retail & Commercial Sectors Needs Assessment 19 24 June 2013 12047 Report Rev 0
level (or an under reliance on zones for this purposes) has resulted in an over reliance on precincts (preferred use areas).
Performance Outcomes and Acceptable Outcomes within codes are not relied upon to articulate the centre role or function as is presently the case under certain codes forming part of existing planning schemes (e.g. Redcliffe Planning Scheme).
3.1.6 Currency
There is notable disparity in the manner and extent to which existing planning instruments embrace and facilitate contemporary retail and commercial centres planning approaches including but not limited to those related to:
• Mixed use development;
• Use “substitutability” or “interchangeability”;
• Centre activation;
• In-centre residential development;
• Centre, accessibility, legibility and “walkability”; and
• Transit orientated development (TOD) principles.
The function and viability of many existing activity centres is threatened by retail and commercial developments that are established in “out-of centre” locations, particularly stand-alone developments such as office parks, large format retailing along main roads, or clusters of highway retail and semi-commercial outlets. Often these have poor accessibility to public transport and encourage an over-reliance on the private vehicle. Strategies purposefully aimed at both recognising historical development trends (commercial corridors), but also regulating inappropriate out-of-centre development are required.

Retail & Commercial Sectors Needs Assessment 20 24 June 2013 12047 Report Rev 0
4 RETAIL, COMMERCIAL AND CENTRE TRENDS
4.1 Types of Shopping Trips
In considering the needs of consumers and the role and function of centres, it is important to consider the five types of trips typically undertaken by shoppers.
• Convenience / buy fresh trip: The convenience / buy fresh trip is typically for frequently used items (e.g. video hire), perishable items (e.g. milk, bread, takeaway meals) or items that have a specific use-life (e.g. daily newspaper). The needs of this trip are met by either convenience centres or supermarket anchored shopping centres;
• Main weekly (or fortnightly) shopping trip: The main weekly (fortnightly) shopping trip is for groceries and household essentials and is normally made at a centre which includes a full-line supermarket. This trip is considered a chore to be done as conveniently, cheaply and efficiently as possible;
• Comparison shopping: Comparison shopping is typically planned to be enjoyable and linked with other activities such as meeting friends or going to the movies. Clothing and other discretionary items are usually the main targets in this type of trip. Shoppers will visit a number of stores, comparing goods and prices before making a purchase decision. Comparison shopping trips typically occur within the city centre, or at a regional or sub-regional centre which offers a wide range and depth of merchandise combined with a range of entertainment facilities;
• Special purchase shopping trip: A special purpose shopping trip typically involves shopping for bulky goods items, such as furniture, sporting equipment, electrical goods, auto accessories or hardware. A number of home and leisure centres have established in response to special purpose shopping trips, as well as a range of category killer stores such as Harvey Norman, Bunnings, Super Cheap Auto and Toys R Us; and
• Leisure shopping trip: A leisure shopping trip is similar in nature to a comparison shopping trip, with the main point of difference being that a leisure shopping trip is usually undertaken without a specific list of goods in mind. This type of trip is more likely to be undertaken while on holiday when time is less pressing. Larger regional centres, factory outlet centres and markets appeal to this type of shopping trip.
4.2 Types of Shoppers
RDG Insights recently classified Australian shoppers based on psychological profiling and have identified seven broad categories:
• The harmonizer: Harmonizers are described as social, family oriented creatures of habit who love nature and are attracted to their home town. Harmonizers like welcoming, open environments with opportunities to socialise. An estimated 33% of Australian shoppers are classified as harmonizers;
• The open-minded: The open minded shopper is an indulgent, life affirming optimist and is savouring, imaginative and easy going. An estimated 18% of Australian shoppers are classified as open-minded;

Retail & Commercial Sectors Needs Assessment 21 24 June 2013 12047 Report Rev 0
• The traditionalist: Traditionalists are risk-conscious and security oriented. Traditionalists are loyal to brands and local retailers and want consistency, easy orientation and cleanliness. An estimated 14% of Australian shoppers are classified as traditionalists;
• The disciplined: Disciplined shoppers concentrate on quality and functionality and prefer subtle colours and a clear assortment with few alternatives. An estimated 13% of Australian shoppers are classified as disciplined;
• The hedonist: The hedonist is an early adopter and prefers inspiring, fashionable and aspirational stores with intense lighting and bright signs. An estimated 12% of Australian shoppers as classified as hedonists;
• The performer: Performers are prestige and performance oriented, preferring strong branded statements, graphics, subdued lighting with highly fashionable products and the impression of scarcity. An estimated 5% of Australian shoppers are classified as performers; and
• The adventurer: The adventurer is attracted to risk and thinks unconventionally. Impulse purchase areas appeal to this type of shopper. An estimated 5% of Australian shoppers are classified as adventurers.
The variance in types of shoppers means that centres need to offer a diversity of tenants to cater to shoppers.
4.3 Types of Retail Centres
Although the retail network comprises a range of centre types which satisfy various consumer needs. The retail centre definitions as presented below do not fit exactly with those as presented in the Queensland Planning Provisions, nor match exactly with the definitions as presented in the three planning schemes currently in place for the Moreton Bay Region, but they do seek to provide a concise overview of the types of retail centres typically present in a centres hierarchy.
The following definitions generally apply to each retail hierarchy element:
• Regional and Sub-regional Centres: Centres providing for higher order retailing (such as department stores and discount department stores) and other commercial activities, entertainment, community and recreation facilities to serve a regional population in excess of 50,000 persons. A lower household threshold is acceptable if the population to be served has special characteristics, or is isolated from other shopping opportunities;
• District Centres: Centres serving a series of neighbourhoods with a total population of up to 35,000 persons and providing a range of retail, office, entertainment, community and recreational facilities to cater for the major weekly shopping trip. The store mix of a district shopping centre generally includes a major supermarket, a full range of food and personal services, and a variety or discount store. Lettable retail area in district centres normally falls between 5,000m2 and 15,000m2, but it is the function of the centre, rather than the size, which is critical;
• Neighbourhood Centres: Centres providing a limited range of retail services to discrete communities of up to 6,000 persons. These centres normally provide only 2,000 m2 to 4,000 m2 of lettable retail floor space (excluding professional services) anchored by a full-line supermarket, have less than twenty specialty stores, with a merchandise mix highly biased towards food items;

Retail & Commercial Sectors Needs Assessment 22 24 June 2013 12047 Report Rev 0
• Local Convenience Centres: small-scale businesses serving their immediate localities, generally characterised by small convenience stores often located on major road arterials; and
• Retail Showroom Facilities: generally defined to include those bulky goods retailers that cater for home improvement/homeware products, garden centre products, indoor/outdoor entertainment/leisure/recreational products and new/used motor vehicle sales. Retail showrooms encompass a broad range of large stores involved in the sale of goods such as motor vehicles, furniture, domestic hardware, floor coverings, household appliances and electrical goods, including computers. Other retailers often attracted by the large floor areas, cheaper rents and the type of customers attracted to these centres, include toy and sports retailers, auto accessory outlets, soft furnishings and home improvement specialists.
4.4 Trends in Retail Development
As both the types of retail shoppers and shopping trips have evolved over time, the retail industry has adjusted to meet the ever changing needs of consumers. One of the major changes in retailing activity in recent times has been the evolution of bulky goods retailing and factory outlet retailing. These trends have highlighted the need for centres strategies and planning schemes to be designed in order to accommodate the diverse and evolving nature of retailing.
Recent trends in retail development include the following:
• Bulky goods retailing: Bulky goods centres consist of a collection of ‘big box’ retailers usually characterised by large stores, cheaper construction and minimal fit out. Initially, the majority of bulky good centre tenants were ‘pure’ bulky goods centres, featuring furniture, electrical goods, hardware and a wide range of homewares retailers, including kitchen, bathroom, brick and other display tenants. However, as the retail segment has developed, there are increasingly more ‘hybrid’ retailers, such as JB Hi Fi, that sell both bulky goods and smaller items commonly sold in traditional retail shops. Local government planning documents have struggled to accommodate bulky goods retailing since the emergence of the category in the 1980s (at the time referred to as Homemaker Centres). The principal challenge in planning for bulky goods retailing is the segment’s breadth and diversity and its overlaps with other retail formats (most notably discount department stores and department stores). The range and variety of retail goods appearing in bulky goods centres and freestanding locations are growing and will continue to pressure homewares traders and department stores in traditional shopping centres. This trend is responsible, in part, for the increasing regulation of centre location in various state and local level planning instruments;
• Category killers: Category killers, a subset of bulky goods retailing, are large stores that provide an extensive range within a narrow product area that are competitive with more traditional retailers. Toys R Us, IKEA, Officeworks, Bunnings and Masters are examples of Australia’s major category killers. Category killers are found in regional shopping centres, but are more commonly located on freestanding sites and in bulky goods centres. The emergence of category killers creates a major challenge for planning instruments. The longevity of category killers is uncertain, with a number of narrowly focussed category killers struggling to maintain their place in the market (e.g. WOW Sight and Sound). Ironically, the world’s first category killer, Toys R Us has struggled for sales in recent years, because of the seasonality associated with toy purchases. More broadly based category killers have tended to experience greater success. The most obvious example within the Australian context is Bunnings,

Retail & Commercial Sectors Needs Assessment 23 24 June 2013 12047 Report Rev 0
although there are numerous examples of other successful category killers in other retail segments (e.g. Dan Murphy’s, IKEA, Rebel Sport, JB Hi Fi, etc.);
• Factory outlets / clearance centres: Factory outlets, like bulky goods centres, rely on lower prices and the cumulative attraction of an agglomeration of tenants to generate consumer interest and ultimately shopper trips. Factory outlets typically include end of run, seconds, overrun and in-store or ‘own brand’ label stock. The factory outlet concept originated in the US in the early 1970s and experienced rapid growth. Recent estimates suggest that there are approximately 400 of these centres in the US. Factory outlet retailing and centres are gathering momentum in Australia, despite planning (and competitor) opposition. One of the major participants in this segment has been Direct Factory Outlet (DFO); however the recent deterioration in the retail segment and possibly over-expansion has seen DFO face financial difficulties. Apart from DFO, the most significant factory outlet centre in Queensland is Harbour Town on the Gold Coast. Consumer demand for value for money, coupled with an increasing frequency of sales ‘events’ in traditional stores, which has created a ‘never pay retail’ mentality, benefits factory outlet centres. Ultimately, however the growth potential of factory outlet centres and stores is likely to be limited, because too many would cannibalise the retail sales bases or the individual brands in central business district and regional shopping centres. With Australia’s small population base, factory outlet centres might well be limited to a small number in capital city and major provincial areas;
• Online retailing: There has been renewed focus on the impacts of online retailing on traditional bricks and mortar stores in Australia, with anecdotal evidence suggesting that the high Australian dollar is leading to increasing retail expenditure online at overseas retailers rather than at local bricks and mortar stores. The PwC and Frost & Sullivan Digital Media Research 2012 report identified a number of factors stimulating growth in online retail in Australia and New Zealand, including greater variety / choice of goods, widespread usage of mobile devices, continued strength of the Australian and New Zealand dollar, increasing level of sophistication and comfort amongst consumers across all age groups, use of social media by both consumers and retailers to drive brand awareness and proliferation of group buying sites. It is anticipated that online retailing will become increasingly important for Australian retailers, with those seeking to improve the multi-channel experience for shoppers likely to record the strongest performance in the short to medium term;
• Convenience focus: Increasingly time-poor consumers are demanding quick, convenient access to chore activities such as food and grocery shopping, with shoppers shopping more often for a smaller basket of goods. Supermarkets have responded with extended trading hours, store and centre layout designs aimed at amplifying convenience, and incorporating meal solutions; and
• Fresh food focus: In recent times, shoppers have been increasingly drawn to purchasing fresh locally sourced produce, as evidenced by the success of the Jan Powers Farmers Markets (held in various Brisbane locations). Coles and Woolworths have responded to this trend by actively promoting their fresh food focus. Woolworth has made their in-store butchers and bakers more visible to shoppers in a number of stores, suggesting to customers that their product is essentially prepared locally and on-site. The layout of the fresh produce section in both Coles and Woolworths has also been altered to provide a ‘market’ feel.

Retail & Commercial Sectors Needs Assessment 24 24 June 2013 12047 Report Rev 0
4.5 Commercial Office Trends
A number of trends in the commercial office market have been observed, including:
• Preference for CBD Location: Central business districts offer a large range of often prestige office space, access to amenities and services for both employers and employees; and in large centres access to high standard public transport;
• Other locational requirements: In an increasingly tight labour market, the needs and expectations of employees become increasingly significant in the locational decisions of businesses. Factors considered particularly important include access to public transport and dining/takeaway food options for staff;
• Campus style accommodation: Large floor plate, low rise commercial office buildings have been developed in recent years to provide lower cost office accommodation in city fringe locations. An example of campus style accommodation office provision is Brisbane Technology Park at Eight Mile Plains. Other facilities typically provided in campus style accommodation include relatively generous carparking provision and a range of dining/takeaway food options. Campus style accommodation is typically unsuitable in dense high cost CBD locations due to its low floor space yield (i.e. it is land extensive);
• Co-location of business activity: In an effort to streamline business operation, there has been an increasing trend to co-locate office, warehouse/manufacturing and distribution activities in the one location. This has generated increased demand for office space in low impact industrial precincts such as North Lakes Business Park, which accommodates a mix of commercial office and industrial tenants; and
• Changing floor plate sizes: Demand for floor space per person in Australia increased from approximately 14m2 per person in the 1970s to 20m2 per person in the 1990s. The provision of commercial office space per person in high cost CBD locations is typically less generous than in suburban and regional markets.
4.6 In-Centre Residential Trends
In-centre residential product has been developed in recent years, and has appealed in particular to young professionals and empty nesters. Critical success factors for in-centre residential product include walking proximity to major shopping and entertainment facilities and accessibility to public transport.
In-centre residential product has been developed in recent years in Chermside and Upper Mount Gravatt, with modest levels of activity also occurring in Toowoomba and Ipswich.
The population of Brisbane CBD has more than trebled between 2001 and 2011 as a result of inner city apartment growth, which has typically appealed to the empty nester market. Empty nesters are typically seeking an active lifestyle with access to a range of entertainment and leisure facilities including dining, theatre/cinema and cycle/walking paths.

Retail & Commercial Sectors Needs Assessment 25 24 June 2013 12047 Report Rev 0
4.7 Planning Policy Trends
A well-defined centres hierarchy includes the following elements:
• Central business district (CBD) – The CBD precinct contains the highest order employment, services, community, entertainment and administrative functions of the region in which it serves;
• Range of centre types – The centres hierarchy should allow for a range of retailing and service needs of residents, workers and visitors; and
• Centres offering more than just retail opportunities – Regional and sub-regional centres within the hierarchy should provide a greater range of services than just retailing opportunities.
Features which influence the ultimate performance of centres include:
• Provision of pedestrian friendly environments;
• Allowance for higher density dwelling at centre fringes;
• Public transport linkages;
• Provision of a safe and attractive environment; and
• Provision of public spaces / meeting places.
The development and promotion of successful, vibrant and active centres requires strategic partnerships between government (typically local and state government) and the private sector, in conjunction with other strategic planning documents, such as economic development strategies, urban renewal strategies and transport strategies. More detailed planning, such as master planning / structure planning is critical to the implementation of centre development or revitalisation.
The revitalisation of main street environments follows these eight principles:
• Comprehensive;
• Incremental;
• Self-help;
• Public/private partnership;
• Identifying and capitalising on existing assets;
• Quality;
• Change; and
• Action-oriented.
Retail and commercial activity has become more decentralised in recent years, not only in Moreton Bay RC but elsewhere generally due to the increasing mobility of consumers. Decentralisation has seen to the development of a number of smaller convenience or local based centres within the centres hierarchy.
The SEQ Regional Plan 2009-2031 seeks to promote active, main street environments for established and new centres through Desired Regional Outcome 8 – Compact Settlement, in particular through Principal 8.8:

Retail & Commercial Sectors Needs Assessment 26 24 June 2013 12047 Report Rev 0
Include a broad mix of land uses in activity centres and structure them as mixed-use centres in a predominantly main-street format to best serve their surrounding communities.
Traditional main street environments have been challenged over the last fifty years by the development of enclosed, air-conditioned shopping centres and malls. However, a renewed focus on main street environments is emerging, underpinned by a desire for connectedness: to feel part of a local community with a village atmosphere. Consumers are increasingly opting to shop locally and support local businesses. The local main street should also offer convenience and accessibility for time-poor consumers, who undertake smaller but more frequent shopping trips. Cafes and restaurants are also a prominent component of many main streets, meaning they also function as meeting places for residents, workers and visitors.
In Moreton Bay Regional Council, the most recent major centre development has been at North Lakes, which comprises an enclosed shopping mall, with main street retailing also present.

Retail & Commercial Sectors Needs Assessment 27 24 June 2013 12047 Report Rev 0
5 CENTRES NETWORK AND HIERARCHY
5.1 Existing Centres Network
5.1.1 Principal Regional Activity Centres
Caboolture-Morayfield Principal Regional Activity Centre
The Caboolture-Morayfield Principal Regional Activity Centre (PRAC) is intended to be the central focus of activity for Moreton Bay Regional Council and includes retail, commercial and community facilities located on or around Morayfield Road and King Street. The Caboolture-Morayfield PRAC has a total estimated floor space of 235,667m2 of which an estimated 70.0% is occupied by retail floor space, 15.7% is occupied by commercial floor space and 9.7% is occupied by community facilities and other floor space. There was an estimated 10,790m2 of vacant floor space identified within the Caboolture-Morayfield PRAC.
The Caboolture-Morayfield PRAC has two major precincts separated by the Caboolture River, namely,
• Morayfield: including Morayfield Shopping Centre (district centre) located at 171 Morayfield Road. Major tenants at the centre include Big W (7,991m2), Target (7,238m2) Kmart (6,928m2), Coles (4,206m2) and Woolworths (4,112m2); and
• Caboolture: including Caboolture Park Shopping Centre (district centre) located at 60-78 King Street. The centre is anchored by Kmart (6,785m2) and Coles Supermarket (4,472m2).
The balance of the Caboolture-Morayfield PAC has an estimated 161,692m2 of floor space of which:
• 61.5% is occupied by retail floor space;
• 21.4% is occupied by commercial floor space; and
• 11.0% is occupied by community facilities and other floor space.
There was an estimated 9,876m2 of vacant floor space identified within the Caboolture – Morayfield PRAC balance.

Retail & Commercial Sectors Needs Assessment 28 24 June 2013 12047 Report Rev 0
Table 5.1: Caboolture-Morayfield Principal Regional Activity Centre
Centre Name Caboolture-Morayfield PRAC
Morayfield Shopping Centre
Caboolture Park Shopping Centre
Caboolture-Morayfield PRAC Balance
Major Tenants Big W 7,991m2 Kmart 6,785m2 Woolworths 3,634m2 Target 7,238m2 Coles 4,742m2 Kmart 6,928m2 Coles 4,206m2 Woolworths 4,112m2
Area % of
Total Area % of
Total Area % of
Total Area % of
Total Groceries 23,367 9.9% 8,672 14.6% 4,995 34.1% 9,700 6.0% Dept. Store/DDS 31,841 13.5% 22,157 37.4% 6,785 46.3% 2,899 1.8% Take-away and dining1
6,087 2.6% 1,255 2.1% 101 0.7% 4,731 2.9%
Specialty2 37,167 15.8% 16,403 27.7% 1,117 7.6% 19,647 12.2% Core Bulky 19,209 8.2% 852 1.4% 90 0.6% 18,267 11.3% Ancillary Bulky 35,080 14.9% 3,140 5.3% 0 0.0% 31,940 19.8% Hardware 12,222 5.2% 0 0.0% 0 0.0% 12,222 7.6% Vacant/For Lease
10,790 4.6% 503 0.8% 411 2.8% 9,876 6.1%
Total Retail 164,974 70.0% 52,480 88.5% 13,088 89.3% 99,406 61.5% Total Commercial
37,068 15.7% 1,229 2.1% 1,160 7.9% 34,680 21.4%
Community Facilities and Other
22,835 9.7% 5,104 8.6% 0 0.0% 17,731 11.0%
Total 235,667 100.0% 59,316 100.0% 14,659 100.0% 161,692 100.0%
Note 1: including on premise liquor Note 2: includes clothing, personal and other goods & take-away liquor.
5.1.2 Major Regional Activity Centres
Strathpine Major Regional Activity Centre
Strathpine Major Regional Activity Centre (MRAC) has a total estimated floor space of 111,465m2 and includes:
• Westfield Strathpine (district centre) located at 295 Gympie Road with an estimated floor space of 44,743m2. Major tenants at the centre include Big W (7,791m2), Target (5,634m2) Woolworths (4,100m2), Coles (3,277m2), Aldi (1,484m2) and Best & Less (1,146m2).
• Strathpine Plaza Shopping Centre;
• Strathpine Central;
• Brendale IGA and
• Other business activities located along Gympie Road.
Of the 111,465m2 of floor space in Strathpine MRAC:
• 66.6% of total floor space is retail;
• 22.9% of total floor space is commercial; and

Retail & Commercial Sectors Needs Assessment 29 24 June 2013 12047 Report Rev 0
• 7.4% of total floor space is community facilities and other tenancies.
There was an estimated 3,511m2 of vacant floor space identified within the Strathpine MRAC.
North Lakes Major Regional Activity Centre
North Lakes MRAC includes an estimated 116,588m2 of floor space focused around Westfield North Lakes (district centre). Within North Lakes MRAC:
• Retail tenancies account for approximately 69.9% of total floor space;
• Commercial tenancies for 18.3% of total floor space; and
• Community facilities and other tenancies for 6.9% of total floor space.
Vacancies accounted for an estimated 5,606m2 of vacant floor space within North Lakes MRAC.
Westfield North Lakes is located on the corner for Anzac Avenue and North Lakes Drive, North Lakes. The centre has an estimated 61,452m2 of floor space, the majority of which is occupied by retail tenancies. Major tenants at the centre include:
• Myer (12,128m2): notably the only department store within Moreton Bay RC;
• Big W (8,580m2);
• Target (7,157m2);
• Woolworths (4,049m2);
• Coles (3,609m2);
• Aldi (1,349m2); and
• Best & Less (1,202m2).
Redcliffe – Kippa Ring Major Regional Activity Centre
Redcliffe – Kippa Ring MRAC includes Peninsula Fair (district centre) and businesses located along Anzac Avenue at Kippa Ring and along Redcliffe Parade and Anzac Avenue at Redcliffe. Redcliffe – Kippa Ring MRAC has an estimated 106,657m2 with approximately:
• 65.1% of total floor space occupied by retail tenancies;
• 23.5% of total floor space occupied by commercial tenancies; and
• 5.7% of total floor space occupied by community facilities and other tenancies.
There was an estimated 6,097m2 of vacant tenancies identified in Redcliffe – Kippa Ring MRAC.
Peninsula Fair is located at 272 Anzac Avenue, Kippa Ring and has an estimated 30,733m2 of floor space. The major tenants at the centre were Kmart (8,960m2), Coles (4,386m2) and Best & Less (847m2). The centre also includes a cinema.
Other major tenants within the Redcliffe – Kippa Ring MRAC include:
• Woolworths (2,400m2) within Kippa-Ring Village Shopping Centre;
• Aldi (1,334m2) located on Anzac Avenue;
• Woolworths (3,941m2) located within Bluewater Square; and

Retail & Commercial Sectors Needs Assessment 30 24 June 2013 12047 Report Rev 0
• Coles (1,160m2) on Sutton Street.
Table 5.2: Major Regional Activity Centres within Moreton Bay Regional Council
Centre Name Strathpine North Lakes Redcliffe – Kippa Ring
Major Tenants Big W 7,791m2 Myer 12,128m2 Kmart 8,960m2 Target 5,634m2 Big W 8,580m2 Coles 4,386m2 Woolworths 4,100m2 Target 7,157m2 Best & Less 847m2 Coles 3,277m2 Woolworths 4,049m2 Woolworths 2,400m2 Aldi 1,484m2 Coles 3,609m2 Aldi 1,334m2 Best & Less 1,146m2 Aldi 1,349m2 Woolworths 3,941m2 Best & Less 1,202m2 Coles 1,160m2
Area % of Total Area % of Total Area % of Total Groceries 13,194 11.8% 10,247 8.8% 15,100 14.2% Dept. Store/DDS 14,571 13.1% 27,865 23.9% 8,960 8.4% Take-away and dining1 8,386 7.5% 8,835 7.6% 17,593 16.5% Specialty2 25,109 22.5% 18,032 15.5% 23,368 21.9% Core Bulky 7,368 6.6% 988 0.8% 1,874 1.8% Ancillary Bulky 3,866 3.5% 1,556 1.3% 2,506 2.3% Hardware 1,695 1.5% 14,000 12.0% 0 0.0% Vacant/For Lease 3,511 3.2% 5,606 4.8% 6,097 5.7% Total Retail 74,187 66.6% 81,522 69.9% 69,400 65.1% Total Commercial 25,516 22.9% 21,364 18.3% 25,026 23.5% Community Facilities and Other 8,250 7.4% 8,096 6.9% 6,134 5.8% Total 111,465 100.0% 116,588 100.0% 106,657 100.0%
Note 1: including on premise liquor Note 2: includes clothing, personal and other goods & take-away liquor.
5.1.3 District Centres
Arana Hills District Centre
Arana Hills District Centre has an estimated floor space of 21,451m2 and includes Arana Hills Plaza and businesses located along Patricks Road, Dawson Parade and Nepean Avenue. The majority of the Arana Hills District Centre is occupied by retail tenancies (84.2%). There was an estimated 1,214m2 of vacant floor space identified.
Arana Hills Plaza is located at 5 Patricks Road, Arana Hills and has an estimated floor space of 12,834m2. Major tenants within Arana Hills Plaza include Kmart (6,526m2) and Coles (3,143m2).
Albany Creek District Centre
Albany Creek District Centre comprises:
• Albany Creek Shopping Centre: anchored by Coles (4,874m2);
• Albany Marketplace: anchored by Woolworths (3,498m2); and
• Strip retail along Albany Creek Road.
Albany Creek District Centre has a total floor space of approximately 26,049m2 of which:
• 67.2% is occupied by retail tenancies;
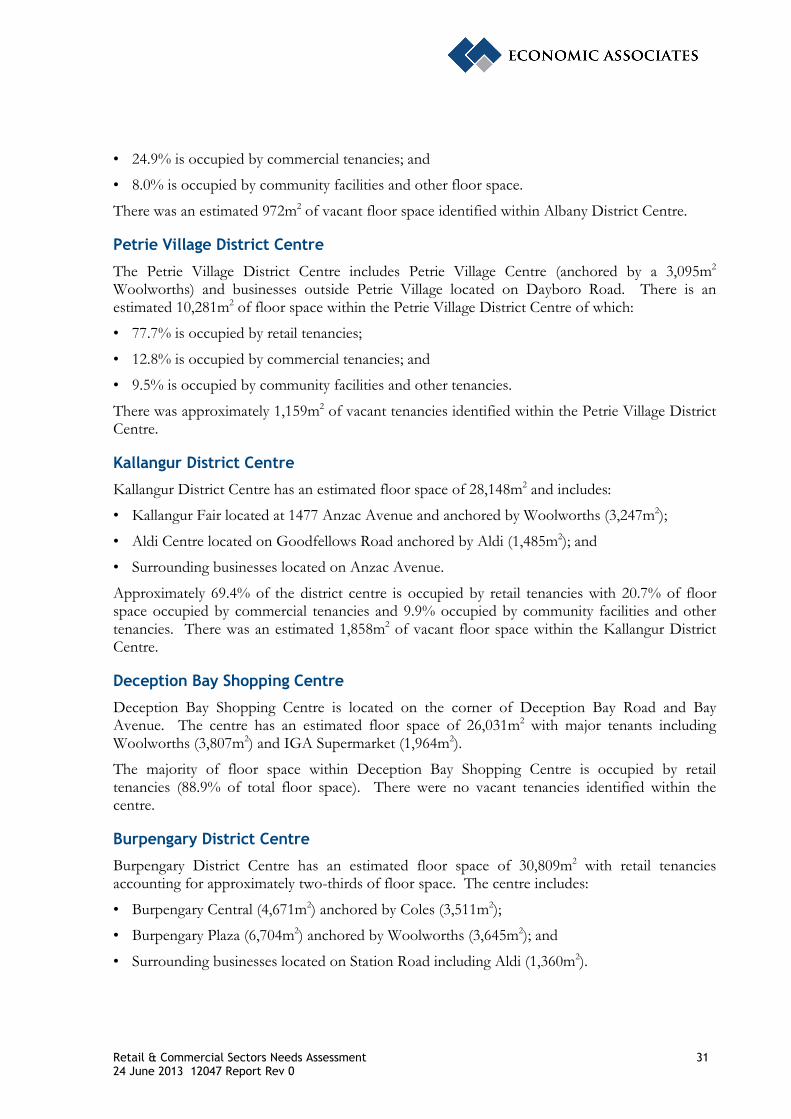
Retail & Commercial Sectors Needs Assessment 31 24 June 2013 12047 Report Rev 0
• 24.9% is occupied by commercial tenancies; and
• 8.0% is occupied by community facilities and other floor space.
There was an estimated 972m2 of vacant floor space identified within Albany District Centre.
Petrie Village District Centre
The Petrie Village District Centre includes Petrie Village Centre (anchored by a 3,095m2 Woolworths) and businesses outside Petrie Village located on Dayboro Road. There is an estimated 10,281m2 of floor space within the Petrie Village District Centre of which:
• 77.7% is occupied by retail tenancies;
• 12.8% is occupied by commercial tenancies; and
• 9.5% is occupied by community facilities and other tenancies.
There was approximately 1,159m2 of vacant tenancies identified within the Petrie Village District Centre.
Kallangur District Centre
Kallangur District Centre has an estimated floor space of 28,148m2 and includes:
• Kallangur Fair located at 1477 Anzac Avenue and anchored by Woolworths (3,247m2);
• Aldi Centre located on Goodfellows Road anchored by Aldi (1,485m2); and
• Surrounding businesses located on Anzac Avenue.
Approximately 69.4% of the district centre is occupied by retail tenancies with 20.7% of floor space occupied by commercial tenancies and 9.9% occupied by community facilities and other tenancies. There was an estimated 1,858m2 of vacant floor space within the Kallangur District Centre.
Deception Bay Shopping Centre
Deception Bay Shopping Centre is located on the corner of Deception Bay Road and Bay Avenue. The centre has an estimated floor space of 26,031m2 with major tenants including Woolworths (3,807m2) and IGA Supermarket (1,964m2).
The majority of floor space within Deception Bay Shopping Centre is occupied by retail tenancies (88.9% of total floor space). There were no vacant tenancies identified within the centre.
Burpengary District Centre
Burpengary District Centre has an estimated floor space of 30,809m2 with retail tenancies accounting for approximately two-thirds of floor space. The centre includes:
• Burpengary Central (4,671m2) anchored by Coles (3,511m2);
• Burpengary Plaza (6,704m2) anchored by Woolworths (3,645m2); and
• Surrounding businesses located on Station Road including Aldi (1,360m2).

Retail & Commercial Sectors Needs Assessment 32 24 June 2013 12047 Report Rev 0
There was an estimated 3,947m2 of vacant floor space identified within Burpengary District Centre.
Bellara District Centre
Bellara District Centre includes Bribie Island Shopping Centre and tenancies along Benabrow Avenue and Goodwin Drive. The centre has an estimated 21,512m2 of floor space of which:
• 66.7% is occupied by retail tenancies;
• 24.2% occupied by commercial tenancies; and
• 3.9% occupied by community facilities and other tenancies.
There was an estimated 1,104m2 of vacant floor space identified within the Bellara District Centre. The major tenants within the district centre are Woolworths (3,784m2) and Target (3,416m2) located within Bribie Island Shopping Centre.
Warner Village District Centre
Warner Village District Centre includes Warner Village Shopping Centre (6,998m2 anchored by Woolworths: 3,296m2) located on the corner of Old North Road and Samsonvale Road and surrounding businesses. The district centre has a total floor space of approximately 10,403m2 of which:
• 77.9% occupied by retail tenancies;
• 12.5% occupied by commercial tenancies; and
• 9.6% occupied by community facilities and other.
There was 139m2 of vacant floor space identified within the Warner Village District Centre.
Margate District Centre
The Margate District Centre includes Margate Village Shopping Centre (anchored by Woolworths 3,414m2) and strip retail along Oxley Avenue. The district centre has a total estimated floor space of 23,800m2 of including:
• Retail tenancies: 51.8% of total floor space
• Commercial tenancies: 27.7% of total floor space; and
• Community facilities and other: 13.0% of total floor space.
There was 1,770m2 of vacant floor space identified within the Margate District Centre.

Retail & Commercial Sectors Needs Assessment 33 24 June 2013 12047 Report Rev 0
Table 5.3: District Centres within Moreton Bay Regional Council
Centre Name
Arana Hills Albany Creek Petrie Village Kallangur Deception Bay Burpengary Bellara Warner Margate
Major Tenants
Kmart 6,526m2 Coles 4,874m2 Woolworths 3,095m2 Woolworths 3,247m2 Woolworths 3,807m2 Coles 3,511m2 Woolworths 3,784m2 Woolworths 3,296m2 Woolworths 3,414m2 Coles 3,143m2 Woolworths 3,498m2 Aldi 1,485m2 IGA 1,964m2 Woolworths 3,645m2 Target 3,416m2 Aldi 1,360m2 Category Area % of
Total Area % of
Total Area % of
Total Area % of
Total Area % of
Total Area % of
Total Area % of
Total Area % of
Total Area % of
Total Groceries 3,798 17.7% 8,917 34.2% 3,152 30.7% 5,804 20.6% 7,820 30.0% 9,744 31.6% 4,089 19.0% 3,628 34.9% 4,294 18.0% Dept. Store/DDS
6,526 30.4% 0 0.0% 0 0.0% 0 0.0% 0 0.0% 0 0.0% 3,416 15.9% 0 0.0% 0 0.0%
Take-away and dining1
3,175 14.8% 2,697 10.4% 1,479 14.4% 5,495 19.5% 3,510 13.5% 2,268 7.4% 1,199 5.6% 3,257 31.3% 2,090 8.8%
Specialty2 3,089 14.4% 5,460 21.0% 2,605 25.3% 6,450 22.9% 11,394 43.8% 5,527 17.9% 4,263 19.8% 1,224 11.8% 4,385 18.4% Core Bulky 84 0.4% 321 1.2% 374 3.6% 450 1.6% 0 0.0% 1,682 5.5% 120 0.6% 0 0.0% 736 3.1% Ancillary Bulky
1,130 5.3% 100 0.4% 375 3.6% 395 1.4% 420 1.6% 1,698 5.5% 208 1.0% 0 0.0% 835 3.5%
Hardware 268 1.2% 0 0.0% 0 0.0% 930 3.3% 0 0.0% 0 0.0% 1,056 4.9% 0 0.0% 0 0.0% Vacant/For Lease
1,214 5.7% 972 3.7% 1,159 11.3% 1,858 6.6% 0 0.0% 3,947 12.8% 1,104 5.1% 139 1.3% 1,770 7.4%
Total Retail 18,070 84.2% 17,495 67.2% 7,986 77.7% 19,524 69.4% 23,144 88.9% 20,919 67.9% 14,350 66.7% 8,109 77.9% 12,340 51.8% Total Commercial
2,791 13.0% 6,481 24.9% 1,318 12.8% 5,838 20.7% 2,395 9.2% 4,162 13.5% 5,211 24.2% 1,298 12.5% 6,598 27.7%
Community Facilities and Other
590 2.8% 2,073 8.0% 977 9.5% 2,786 9.9% 492 1.9% 1,781 5.8% 847 3.9% 996 9.6% 3,092 13.0%
Total 21,451 100.0% 26,049 100.0% 10,281 100.0% 28,148 100.0% 26,031 100.0% 30,809 100.0% 21,512 100.0% 10,403 100.0% 23,800 100.0%
Note 1: including on premise liquor Note 2: includes clothing, personal and other goods & take-away liquor.

Retail & Commercial Sectors Needs Assessment 34 24 June 2013 12047 Report Rev 0
5.1.4 Local Centres
There were approximately 100 local centres identified within Moreton Bay Regional Council, ranging from 80m2 (Oakey Flat Road) to 20,953m2 (Deception Bay Road). Table 5.4 below provides a summary of these centres.

Retail & Commercial Sectors Needs Assessment 35 24 June 2013 12047 Report Rev 0
Table 5.4: Local Centres within Moreton Bay Regional Council
Centre Name Address Floor Space (sqm)
Tenants
Albany Place Cnr Keong Road & Albany Creek
Road, Albany Creek 4,907 Aldi (1,100m2) is the major tenant at the centre with other tenants including
convenience retail and commercial tenancies.
Radius Medical Centre Cnr Keong Road & Old Northern Road, Albany Creek
3,261 The centre has a focus on medical related tenancies. There is also a veterinary and childcare at the centre.
Woolworths Market Place, Albany Creek
Cnr Albany Forest Drive & Old Northern Road, Albany Creek
4,861 The centre is anchored by Woolworths (3,498m2) with other tenancies focused on convenience retail and commercial.
Dawn Road Local Centre Dawn Road, Albany Creek 1,965 The centre includes Spar Supermarket, specialty retail and a childcare.
Bellara Corner Store Bellara Street , Bellara 120 The centre includes Bellara Corner Store (vacant at the time of inspection, October 2012) and a hair salon.
Bribie Island Hotel Sylvan Beach Esplanade, Bellara 880 Bribie Island Hotel and Liquorland Bottleshop.
Bongaree First Avenue, Bongaree 5,791 Includes strip retail along First Avenue.
Woorim North Street, Woorim 4,662 Includes strip retail along North Street.
Welsby Parade Shops Welsby Parade, Bongaree 4,498 Includes Supa IGA (1,200m2) and convenience retail and commercial tenancies.
Cotterill Shops Cotterill Avenue, Bongaree 241 Comprises two take-away food tenants.
Aldi Centre - Bribie Island Goodwin Drive, Bongaree 2,100 Anchored by Aldi (1,400m2) the centre includes six retail shops and one commercial tenancy.
Coolgarra Shops Cnr Cotterill Avenue & Goodwin Drive, Bongaree
1,523 The centre includes three grocery tenants, a take-away food store and hardware.
Currong Shops Currong Crescent, Bellara 569 There are two retail tenancies located on Currong Crescent.
Elkhorn Avenue Elkhorn Avenue, Bellara 114 Small standalone tattoo shop.
Marine Parade Marine Parade, Bellara 387 There are four café and seaside related stores located on Marine Parade.
Banksia Beach Shopping Village Sunderland Drive, Banksia Beach
4,943 Anchored by IGA (2,766m2) the centre has eight convenience retail tenancies and a commercial tenancy.
FoodWorks Burpengary Cnr Burpengary Road & Henderson Road, Burpengary
990 The centre includes FoodWorks and three retail tenancies.
Oakey Flat Road Oakey Flat Road, Morayfield 80 There is a BP Service Station with a café on Oakey Flat Road.

Retail & Commercial Sectors Needs Assessment 36 24 June 2013 12047 Report Rev 0
Centre Name Address Floor Space (sqm)
Tenants
Woodpecker Tavern Cnr Rowley Road & Facer Road,
Burpengary 729 Includes Woodpecker Tavern and Liquorland Bottleshop.
Narangba Village 32-36 Main Street, Narangba 1,819 The centre includes fifteen convenience retail and commercial tenancies.
Narangba Station Plaza Main Street, Narangba 888 The centre includes convenience retail and commercial and a day care centre and a veterinary surgery.
Chooks Corner Mackie Road, Narangba 805 Chooks Corner has five convenience retail tenancies, one of which was identified as vacant.
Narangba Valley Shopping Centre Young Road, Narangba 3,090 The centre is anchored by Woolworths (2,000m2) and has 10 specialty shops.
The Big Fish Tavern Bruce Highway, Caboolture 470 The Big Fish Tavern is the site for the Sungate Business Park which will include retail, commercial and industrial and will be anchored by Woolworths.
Tullawong Corner Store Parish Road, Caboolture 350 There is a small convenience store located on Parish Road in close proximity to a child care centre on Smiths Road.
Lear Jet Centre Lear Jet Drive, Caboolture 2,653 The centre includes six retail tenancies and two commercial tenancies. There was a vacant tenancy at the time of inspection.
Argyll Street Centre Argyll Street, Caboolture 277 Includes three convenience retail stores.
Bellmere Shopping Centre Bellmere Road, Bellmere 848 The centre has eight convenience retail tenancies one of which was vacant at the time of inspection.
Central Lakes Shopping Village Cnr McKean Street & Pettigrew Street, Caboolture
5,699 The centre is anchored by Woolworths (3,575m2) and has ten convenience retail and three commercial tenancies.
Trader Dukes Centre King Street, Caboolture 1,930 The centre includes Trader Dukes Tavern and eleven convenience retail tenancies.
Woodford Shopping Centre 73-75 Archer Street, Woodford 4,962 The centre is relatively new (opened in 2009) and is anchored by Woolworths (3,668m2). There are ten specialty retail tenancies within the centre.
Woodford Central Shopping Centre Archer Street, Woodford 1,956 The centre includes Supa IGA (1,344m2) and three convenience retail tenancies.
Woodford Strip Retail Archer Street, Woodford 7,067 Strip retail along Archer Street at Woodford includes a variety of convenience retail and commercial tenancies.
D'Aguilar D'Aguilar Highway, D’Aguilar 1,114 Located along the D'Aguilar Highway at D'Aguilar are the D'Aguilar Hotel, a bottleshop, corner store and petrol station.

Retail & Commercial Sectors Needs Assessment 37 24 June 2013 12047 Report Rev 0
Centre Name Address Floor Space (sqm)
Tenants
Wamuran D'Aguilar Highway, Wamuran 1,983 The centre includes two hair salons, a pharmacy, a real estate agent and a
fitness centre. Strip retail along the D'Aguilar Highway at Wamuran includes eleven convenience retail tenancies, a medical centre and veterinary.
Elimbah Beerburrum Road, Elimbah 640 Eight of ten tenancies were vacant at the time of inspection (October 2012). There are a clothes store and newsagent within the centre.
Excelsior Park Village Cnr Oakey Flat Road & Nairn Road, Morayfield
550 The centre includes a convenience food store, bottleshop and a combined bakery and café.
Bunya Park Drive Convenience Centre
Bunya Park Drive, Eatons Hill 2,400 The centre includes six retail tenancies and four commercial tenancies.
Eatons Hill Convenience Centre Cnr Eatons Crossing Road & Queen Elizabeth Drive, Eatons Hill
1,203 The centre includes a convenience food store, five convenience retail stores, a medical centre and a dentist.
Eatons Hill Hotel and Function Centre
646 South Pine Road, Eatons Hill 7,365 The centre includes the Eatons Hill Hotel, a bottleshop, a function centre and a motel.
Ningi Caboolture-Bribie Island Road, Ningi
1,531 Ningi floor space includes retail and commercial tenancies spread out along Caboolture-Bribie Island Road at Ningi. In total there are thirteen convenience retail tenancies, and five commercial tenancies.
The Village Sandstone Point 204-208 Bestmann Road East, Sandstone Point
3,004 The centre is anchored by IGA (1,252m2) and includes seven convenience retail tenancies, a medical centre and a real estate agent.
Beachmere Plaza Beachmere Road, Beachmere 3,001 The centre includes ten convenience retail tenancies, a medical centre, real estate agent and childcare centre.
Toorbul Cnr Freeman Road & The Esplanade, Toorbul
516 There is a tavern, bottle and small convenience store at Toorbul.
Donnybrook Alice Street, Donnybrook 316 There is a small store on Alice Street, Donnybrook that includes post office, boat hire, food store and plumbing service.
Anzac Avenue Local Centre Anzac Avenue, Kallangur 1,776 The centre includes eight retail tenancies and a veterinary surgery. There was one vacant tenancy identified at the centre.
Kallangur Village Shopping Centre Cnr Marsden Road & Ann Street, Kallangur
733 The centre includes Spar Express, a bottleshop and a childcare.
Lilly Brook Shopping Village 980 Brickworks Road, Kallangur 7,244 The centre is anchored by Coles (3,956m2) and includes eleven convenience retail tenancies, a medical centre and a real estate agent.
Murrumba Downs Shopping Centre Cnr Goodrich Road & Dohles Rocks Road, Murrumba Downs
6,534 The centre is anchored by Coles (2,563m2) and has twelve convenience retail tenancies, a medical centre and two real estate agents.

Retail & Commercial Sectors Needs Assessment 38 24 June 2013 12047 Report Rev 0
Centre Name Address Floor Space (sqm)
Tenants
Castle Hill Centre Cnr Castle Hill Drive & Dohles
Rocks Road, Murrumba Downs 2,703 The centre includes ten convenience retail tenancies, a medical centre and a
real estate agent. There was a building under construction at the time of inspection (October 2012).
Dakabin Village Whitehorse Road, Dakabin 1,083 Comprises a Spar Supermarket and childcare centre.
Bayview Shops Bayview Terrace, Deception Bay 975 The centre includes a restaurant, café, real estate agent and the Deception Bay Library.
Deception Bay Strip Retail Deception Bay Road, Deception Bay
20,953 There's extensive strip retail along Deception Bay Road at Deception Bay with tenants including Aldi (1,440m2), Dan Murphy’s (1,250m2) and Fernwood Gym (1,196m2).
Zone Rothwell 757 Deception Bay Road, Rothwell
11,088 Zone Rothwell is a bulky goods centre with major tenants including Rays Outdoor Furniture (1,851m2) and Amart All Sports (1,157m2). There were five vacant tenancies identified at the time of inspection (October 2012).
Bay Markets Deception Bay Road, Deception Bay
1,000 The centre includes seven convenience retail tenancies and three commercial tenancies.
Bunnings Rothwell & Harvey Norman Centre
Deception Bay Road, Rothwell 17,682 Bunnings is located on Deception Bay Road (11,680m2) adjacent Harvey Norman, Good Price Pharmacy, and Pet Barn.
Deception Bay IGA Bailey Road, Deception Bay 2,336 The centre is anchored by IGA (1,398m2) and includes eight convenience retail tenancies.
Rothwell Local Centre Deception Bay Road, Rothwell 2,060 The centre includes eight retail tenancies, a medical centre and a back.
Burpengary Tavern Cnr Bruce Highway & Old Bay Road, Burpengary
762 The centre lies to the east of the Bruce Highway and includes Burpengary Tavern and a bottleshop.
Redcliffe Leagues Club Cnr Klingner & Ashmole Roads, Redcliffe
8,398 Redcliffe Leagues Club includes the Dolphins Health Precinct and is the site for the Dolphins Central Shopping Centre.
North Rise Lipscombe Road, Deception Bay 1,580 The centre includes Spar supermarket, a bakery, bottleshop, hair salon, childcare centre and medical centre.
North Bay Shopping Centre Zammit Street, Deception Bay 952 The centre includes a convenience store, four specialty retail tenancies, and two community facilities and other tenancies. There were two vacant tenancies identified at the centre.
North Lakes Convenience Centre Cnr Discovery Drive & College Street, North Lakes
1,149 The centre comprises eight retail tenancies, including Night Owl convenience centre and five dining and take-away food stores, and two commercial tenancies. At the time of inspection there was a vacant tenancy identified.
Astley Parade Local Centre Astley Parade, North Lakes 5,350 The centre is anchored by IGA supermarket (2,506m2) and includes three retail tenancies and two commercial tenancies.

Retail & Commercial Sectors Needs Assessment 39 24 June 2013 12047 Report Rev 0
Centre Name Address Floor Space (sqm)
Tenants
Ferny Way South Ferny Way, Ferny Hills 4,379 There are a number of tenancies located on both sides of Ferny Way near the
intersection of Gordon Road. In total there are 27 businesses including twelve retail tenancies, eleven commercial tenancies and two community facilities and other tenancies. There were two vacant tenancies at the time of inspection (October 2012).
Mt Glorious Mount Glorious Road, Mt Glorious
355 Within Mount Glorious there are the Mount Glorious Teahouse, a café and a commercial tenancy.
Arlington Court Cnr Arlington Drive & Bunya Road, Arana Hills
820 Retail on Arlington Drive includes a convenience store, three convenience retail tenancies and a childcare centre. There was one vacant tenancy identified at the centre.
Everton Shopping Village Camelia Avenue, Everton Hills 1,666 The centre includes nine retail tenancies, three commercial tenancies and veterinary clinic.
Chinook Street Local Centre Chinook Street, Everton Hills 2,588 The centre includes three tenancies associated with health and fitness and a take-away food tenancy.
Ferny Way Local Centre Ferny Way, Ferny Hills 478 The centre includes a deli, fruit market and a mower store.
170 Patricks Road 170 Patricks Road, Arana Hills 952 The centre includes six retail tenancies and three commercial tenancies. There was a vacant tenancy identified within the centre.
Fernlands Village Woodhill Road, Ferny Hills 1,389 The centre includes Spar convenience store, three dining and take-away stores, a hair salon, bottleshop, medical centre, dentist and veterinary clinic.
Everton Hills Shopping Centre Cnr South Pine & Queens Roads, Everton Hills
2,427 The centre includes four retail tenancies, a medical centre, and a dentist. There was one vacant tenancy identified at the centre.
Samford Village Main Street Retailing
Main Street, Samford Village 7,743 Strip retail along Main Street at Samford Village includes approximately 35 retail tenancies, 17 commercial tenancies and one community facilities and other tenancy.
Samford Central Main Street, Samford Village 2,397 The centre includes Supa IGA (800m2), twelve convenience retail tenancies and four commercial tenancies. At the time of inspection (October 2012) there was one vacant tenancy identified.
Samford Country Centre Main Street, Samford Village 1,012 The centre includes nine retail tenancies and two commercial tenancies. There was one vacant tenancy identified at the centre at the time of inspection (October 2012).
Samford Valley Mount Glorious Road, Samford Valley
2,414 There are five retail tenancies with a focus on gardening and landscaping and one commercial tenancy located along Mount Glorious Road.

Retail & Commercial Sectors Needs Assessment 40 24 June 2013 12047 Report Rev 0
Centre Name Address Floor Space (sqm)
Tenants
Francis Road Local Centre Francis Road, Bray Park 1,343 The centre includes FoodWorks convenience centre, a hair salon, bottleshop,
two take-away food stores and a childcare centre.
Ebert Place Shops Ebert Parade, Lawnton 1,938 The centre includes ten retail tenancies, one commercial tenancy and one community facilities and other tenancy. There was one vacant tenancy identified at the centre.
Ellis Street Local Centre Cnr Ellis Street & Francis Road, Lawnton
504 The centre includes a convenience store, hair salon, bakery, laundromat, take-away food store and a day spa.
Sparkes Road Local Centre Sparkes Road, Bray Park 729 The centre includes a medical centre, pharmacy and podiatrist.
Kensington Village Shopping Centre Cnr Kensington Way & Sovereign Avenue, Bray Park
7,043 The centre is anchored by Coles (3,040m2) and includes eight retail tenancies, a medical centre, dentist and a childcare centre.
The Hub Convenience Centre Uhlmann Road, Burpengary 4,136 The centre includes nine retail tenancies, five commercial tenancies and a childcare centre.
Parkridge Shopping Village Parkridge Avenue, Upper Caboolture
1,123 The centre includes FoodWorks convenience centre, bottleshop, hair salon, beauty salon and a lawyers office.
Glenwood Drive Centre Glenwood Drive, Morayfield 1,205 The centre comprises seven retail tenancies including IGA convenience centre.
Hillcrest Gardens Shopping Centre Cresthaven Drive, Morayfield 661 The centre includes a combined convenience and take-away food store, bakery, hair salon and a women's clinic.
Dayboro Williams Street, Dayboro 10,169 Strip retail along Williams Street includes 21 retail tenancies, ten commercial tenancies and four community facilities and other tenancies. There were two vacant tenancies identified at the time of inspection (October 2012).
Beeville Road Local Centre Beeville Road, Petrie 2,748 The centre is anchored by IGA supermarket (1,427m2) and includes a bakery, take-away food store, hair salon, bottleshop, video store, pharmacy, veterinary clinic and pathology centre.
Redcliffe IGA Elizabeth Avenue, Clontarf 6,013 The centre is anchored by Supa IGA (2,257m2) and includes a bottleshop, video store and four commercial tenancies. There were four vacant tenancies identified at the centre (October 2012).
Redcliffe Coastal Strip Retail Hornibrook Esplanade, Clontarf 1,832 Retail along Hornibrook Esplanade includes fourteen retail tenancies, three commercial tenancies and three community facilities and other tenancies. There was one vacant tenancy identified on Hornibrook Esplanade.
Clontarf Bayside Plaza Elizabeth Avenue, Clontarf 2,990 The centre includes nine dining and take-away food stores, a post office, service station and six commercial tenancies including the Redcliffe Super Clinic. There were five vacant tenancies identified at the time of inspection (October 2012).

Retail & Commercial Sectors Needs Assessment 41 24 June 2013 12047 Report Rev 0
Centre Name Address Floor Space (sqm)
Tenants
Landsborough Avenue Local Centre Landsborough Avenue,
Scarborough 6,829 Strip retail along Landsborough Avenue includes two dining and take-away
food tenancies, a newsagent, pharmacy post office, two hair salons and seven commercial tenancies.
Mariners Plaza Griffith Road, Scarborough 1,090 The centre includes a convenience store, two hair salons, two dining and take-away food stores, a bottleshop and an education centre.
Midways Convenience Centre Oxley Avenue, Redcliffe 1,395 The centre includes FoodWorks convenience store, a post office, newsagent, butcher, take-away food store, real estate agent and veterinary clinic.
Ashmole Shopping Village Cnr Ashmole Road & Porter Street, Kippa Ring
890 The centre includes Spar Express, a bakery, take-away food store, pharmacy, hair salon, dry cleaners and a medical centre.
Victoria Avenue Local Centre Victoria Avenue, Redcliffe 600 The centre includes Friendly Grocer, a bakery, butcher, two take-away food stores, hair salon, newsagent, florist and pawn broker.
Lincoln Centre Lincoln Lane, Strathpine 1,898 The centre includes twelve retail tenancies with a focus on dining and take-way food stores, and five commercial tenancies. There were two vacant tenancies identified at the centre.
Bell's Corner Bells Pocket Road, Strathpine 315 The centre includes a hair salon, beauty salon, laundromat and two commercial tenancies.
Sandalwood Shopping Village Samsonvale Road, Strathpine 642 The centre includes a Friendly Grocer, bakery, butcher, take-away food store and a bottle shop. There were four vacant tenancies identified at the centre.

Retail & Commercial Sectors Needs Assessment 42 24 June 2013 12047 Report Rev 0
5.2 Future Centres Hierarchy for Moreton Bay Regional Council
The SEQ Regional Plan 2009-2031 and the Draft Queensland Planning Provisions v3.0 identify five centre types relevant to Moreton Bay Regional Council:
• Principal centres;
• Major centres;
• District centres;
• Local centres; and
• Neighbourhood centres.
Moreton Bay Regional Council’s current classification of centres, includes:
• One principal centre;
• Three major centres;
• Eight district centres; and
• A very large number of local centres.
Formulation of a possible future centres hierarchy also considers the Draft Strategic Framework in consideration of the future intent of centres within Moreton Bay Regional Council.
This section reviews the current and future intent of each centre within Moreton Bay Regional Council and provides suggestions as to the appropriate criteria to apply to classify a centre.
5.2.1 Principal Centres
The SEQ Regional Plan 2009-2031 defines a principal activity centre as follows:
SEQ’s principal regional activity centres serve catchments of regional significance and accommodate key employment concentrations. They also serve business, major comparison and convenience retail, and service uses. These centres provide a secondary administrative focus, accommodating regional offices of health, education, cultural and entertainment facilities that have governmental and regional significance. Outside the Brisbane CBD, principal regional activity centres serve as key focal points for regional employment and in-centre regional development. As major trip generators, these centres typically have existing or planned, dedicated public transport, including rail, bus or light rail, and comprise key nodes in the regional public transport system. Residential development densities in principal regional activity centres should be around 40–120 dwellings per hectare (net) or greater. (Source: Department of Infrastructure & Planning (2009), pg 99)
Within Moreton Bay Regional Council, Caboolture – Morayfield is the only principal activity centre.
The Draft Queensland Planning Provisions version 3.0 (released October 2011), outlines the purpose of principal centres as follows:

Retail & Commercial Sectors Needs Assessment 43 24 June 2013 12047 Report Rev 0
The purpose of the principal centre zone code is to provide for the largest and most diverse mix of uses and activities that forms the core of an urban settlement. It includes key concentrations of high-order retail, commercial, employment, residential, health services, administrative, community, cultural, recreational and entertainment activities and other uses, capable of servicing the planning scheme area (in this case Moreton Bay Regional Council). (Source: Growth Management Queensland (2011), pg 93)
Moreton Bay Regional Council’s Draft Strategic Framework provides the following definition for both principal and major centres:
Principal and other Major Regional Activity Centres are major transport hubs that serve catchments of regional and sub-regional significance and accommodate key employment concentrations and include a substantial local residential population. They provide a secondary administrative function to the Brisbane CBD and accommodate regional, district or branch government facilities and professional offices. They are also the preferred locations for tertiary health, education, cultural and entertainment facilities. (Source: Moreton Bay Regional Council (2012b), pg 31)
The Draft Strategic Framework identifies Caboolture-Morayfield as the principal activity centre for Moreton Bay Regional Council.
5.2.2 Major Centres
The SEQ Regional Plan 2009-2031 defines major centres as follows:
These centres complement the principal regional activity centres by serving catchments of sub-regional significance and accommodating key employment concentrations. They also provide business, service, and major retail and convenience functions. With a secondary, sub-regional administration focus, they accommodate district or branch offices of government facilities, and cultural and entertainment facilities of regional significance. These centres are typically located around key suburban or inter-urban public transport stops, and provide frequent public transport services to link the centre to surrounding communities. Residential development densities in major activity centres should be around 30–80 dwellings per hectare (net) or greater. (Source: Department of Infrastructure & Planning (2009), pg 99)
North Lakes, Redcliffe and Strathpine are the main centres in Moreton Bay Regional Council.
The Draft Queensland Planning Provisions version 3.0 (released October 2011), outlines the purpose of major centres as follows:
The purpose of the major centre zone code is to provide for a mix of use and activities. It includes concentrations of higher order retail, commercial, offices, residential, administrative and health services, community, cultural and entertainment facilities and other uses capable of servicing a subregion in the planning scheme area (in this case Moreton Bay Regional Council). (Source: Growth Management Queensland (2011), pg 94)
Moreton Bay Regional Council’s Draft Strategic Framework assumes that both principal and major regional activity centres have a similar role and function.
Consistent with the SEQ Regional Plan 2009-2031, the Draft Strategic Framework identifies North Lakes, Redcliffe and Strathpine as major activity centres.

Retail & Commercial Sectors Needs Assessment 44 24 June 2013 12047 Report Rev 0
5.2.3 District Centres
The Draft Queensland Planning Provisions version 3.0 (released October 2011), outlines the purpose of district centres as follows:
The purpose of the district centre zone code is to provide for a mix of uses and activities. It includes a mix of land uses including retail, commercial, residential, offices, administrative and health services, community, small-scale entertainment and recreational facilities capable of servicing a district. (Source: Growth Management Queensland (2011), pg 94)
Moreton Bay Regional Council’s Draft Strategic Framework provides the following definition for district centres:
The District Centres are important transport hubs and provide a diverse mix of land uses and activities with a concentration of retail, business, commercial, employment, health services, administrative, community, cultural, recreational and entertainment capable of servicing the district and include a substantial resident population. (Source: Moreton Bay Regional Council (2012b), pg 31)
The Draft Strategic Framework identifies ten district centres within Moreton Bay Regional Council, namely Deception Bay, Margate, Kallangur, Burpengary, Narangba, Petrie, Bellara, Warner, Albany Creek and Arana Hills. The Draft Strategic Framework also identifies the potential for a new district centre within the Caboolture West investigation area.
5.2.4 Local Centres
The Draft Queensland Planning Provisions version 3.0 (released October 2011), outlines the purpose of local centres as follows:
The purpose of the local centre zone code is to provide for a limited range of land uses and activities to service local needs. It includes local shopping, local employment nodes, commercial, residential, cafes and dining, entertainment, community services and residential development where it can integrate and enhance the fabric of the activity centre, but is not the predominant use. (Source: Growth Management Queensland (2011), pg 95)
The Moreton Bay Region currently has over 100 local centres. Across these 100 local centres there is a significant variation in floor space provision and scale of anchor tenancies. This variation implies that there is also a significant variation in the role and function fulfilled by each of these 100 plus local centres.
5.2.5 Neighbourhood Centres
The Draft Queensland Planning Provisions version 3.0 (released October 2011), outlines the purpose of neighbourhood centres as follows:
The purpose of the neighbourhood centre zone code is to provide for a small mix of land uses to service residential neighbourhoods. It includes small-scale convenience shopping, professional offices, community services and other uses which directly support the immediate community. (Source: Growth Management Queensland (2011), pg 96)
The Moreton Bay Region currently does not have any neighbourhood centres, but instead designates a large number of small centres as Local Centres.

Retail & Commercial Sectors Needs Assessment 45 24 June 2013 12047 Report Rev 0
5.3 Metrics for Principal and Major Centres
5.3.1 Relationship between Population and Principal / Major Centre Provision
There appears to be no clear relationship between local government area population and the number of designated centres in each area (refer to Table 5.5 below).
Notably, Moreton Bay Regional Council has a lower than average provision of principal and major activity centres per 100,000 persons. The provision of principal activity centres is the lowest of all SEQ local governments and its provision of major activity centres the second lowest.
The relatively low provision of higher order centres may have significant implications for the region’s ability to increase employment self-containment.
Table 5.5: Comparison of Principal and Major Centre Provision by Local Government Area
Council Area No. of Principal Activity Centres
No. of Major Activity Centres
Population (2011 ERP)
100,000 persons / Principal Activity
Centres
100,000 persons / Major Activity
Centres
Brisbane 4 4 1,089,743 2.72 2.72 Gold Coast 2 7 513,954 2.57 0.73 Sunshine Coast 1 7 316,858 3.17 0.45 Moreton Bay 1 3 389,661 3.90 1.30 Logan 2 5 287,517 1.44 0.58 Redland 2 0 143,628 0.72 - Ipswich 2 2 172,147 0.86 0.86 Scenic Rim 1 1 37,415 0.37 0.37 Somerset 0 3 22,062 - 0.07 Lockyer Valley 1 1 35,795 0.36 0.36 SEQ 16 33 3,008,780 1.88 0.91
Source: Department of State Development, Infrastructure & Planning (2009) and Australian Bureau of Statistics (2012c)
5.3.2 Community Size and Future Job Provision
In the Moreton Bay Regional Council Draft Strategic Framework, future population and employment were identified for each for the five planning areas within the region, and is summarised below in Table 5.6.
Table 5.6: Anticipated Population and Employment within MBRC
Planning Area Popoulation Jobs
Caboolture / Morayfield 190,000 80,000 North Lakes / Redcliffe / MBRL 220,000 70,000 Strathpine 108,000 41,000 Bribie & Coastal 43,000 6,000 Rural District 45,000 7,500 Moreton Bay Regional Council 606,000 204,500
Source: Moreton Bay Regional Council (2012b)

Retail & Commercial Sectors Needs Assessment 46 24 June 2013 12047 Report Rev 0
Composition of North Lakes / Redcliffe / MBRL Corridor
Currently, the four SLAs of Redcliffe (in Table 5.7) account for approximately 50% of employment within the North Lakes / Redcliffe / Moreton Bay Rail Link (MBRL) corridor. By 2031, it is anticipated that this will fall to 38% of employment with significant employment growth projected for Griffin-Mango Hill, Burpengary-Narangba and Dakabin-Kallangur-Murrumba Downs.
Employment growth within Redcliffe is constrained to some extent due to limited available land, with employment growth to be generated through increased workforces at existing enterprises and infill development.
Analysis shown in Table 5.7 below also highlights that employment within the North Lakes region is anticipated to overtake Strathpine (see Tables 5.6 and 5.7) in terms of employment.
Table 5.7: Anticipated Employment within the North Lakes / Redcliffe / MBRL Precinct
2011 Employment 2031 Employment Change
North Lakes 20,458 43,447 22,989 Dakabin-Kallangur-M. Downs 4,666 8,749 4,083 Griffin-Mango Hill 7,113 19,356 12,243 Deception Bay 3,485 4,823 1,338 Burpengary-Narangba 5,194 10,519 5,325
Redcliffe 20,811 26,884 6,073 Clontarf 3,202 3,747 545 Margate-Woody Point 1,928 2,398 470 Redcliffe-Scarborough 8,131 10,264 2,133 Rothwell-Kippa-Ring 7,550 10,475 2,925
Total 41,269 70,331 29,062 Redcliffe as % of total 50.4% 38.2%
Source: Moreton Bay Regional Council (2012b)
Over 90% of population growth within the North Lakes / Redcliffe / MBRL precinct is anticipated to occur within the North Lakes region, with population increases to be greater in Griffin-Mango Hill (additional 29,766 persons) and Burpengary-Narangba (additional 24,556 persons) (Table 5.8).

Retail & Commercial Sectors Needs Assessment 47 24 June 2013 12047 Report Rev 0
Table 5.8: Anticipated Population within the North Lakes / Redcliffe / MBRL Precinct
2011 Population 2031 Population Change
North Lakes 99,583 172,693 73,110 Dakabin-Kallangur-M. Downs 28,860 42,367 13,507 Griffin-Mango Hill 21,491 51,257 29,766 Deception Bay 21,912 27,193 5,281 Burpengary-Narangba 27,320 51,876 24,556
Redcliffe 56,570 64,298 7,728 Clontarf 7,947 8,437 490 Margate-Woody Point 10,850 11,889 1,039 Redcliffe-Scarborough 20,434 23,140 2,706 Rothwell-Kippa-Ring 17,339 20,832 3,493
Total 156,153 236,991 80,838 Redcliffe as % of total 36.2% 27.1%
Source: Moreton Bay Regional Council (2012b)
5.3.3 Existing Principal & Major Centres Network
The Caboolture – Morayfield Principal Regional Activity Centre is currently the dominant centre in terms of floor space provision, with the largest number of full line supermarkets, discount department stores, bulky goods floor space, and the largest concentration of retail floor space, commercial floor space and community facility floor space.
The North Lakes centre has the largest retail floor space provision of all major centres within Moreton Bay Regional Council, and is also the only centre with a department store (Myer). Both North Lakes and Caboolture – Morayfield also have a large format hardware retailer in centre1.
Table 5.9: Current Provision at Principal Activity Centres and Major Centres within Moreton Bay Regional Council
No. of Full Line S’mkts
No. of Dept Stores / DDS’s
Total Bulky Goods Floor Space (incl
H’ware)
Total Retail Floor Space
Total Commercial Floor Space
Total Community Facilities / Other Floor
Space
Principal Activity Centre Caboolture – Morayfield 4 4 66,512 164,974 37,068 22,835 Major Centres Strathpine 3 2 12,928 74,187 25,516 8,250 North Lakes 3 3 16,544 81,522 21,364 8,096 Redcliffe – Kippa Ring 4 1 4,379 69,400 25,026 6,134
Source: Economic Associates inventory
1 Bunnings is also located within Rothwell and Lawnton.

Retail & Commercial Sectors Needs Assessment 48 24 June 2013 12047 Report Rev 0
5.3.4 Existing Community Infrastructure
Existing community infrastructure within principal and major activity centres is shown below in Table 5.10. Caboolture – Morayfield and Redcliffe clearly have the highest level of community infrastructure provision of all centres within Moreton Bay Regional Council.
Table 5.10: Summary of Community Facilities Provision across existing Principal and Major Activity Centres
Caboolture - Morayfield
• Caboolture Hub (4 Hasking Street, Caboolture): An integrated facility which incorporates the Caboolture Library, Caboolture Regional Art Gallery, Learning & Business Centre (offers a conference room and seminar rooms for hire) and Creative Studios (short term leases available at subsidised prices for artists in new media arts and contemporary arts practice);
• Caboolture Private Hospital (McKean Street, Caboolture); • Caboolture Public Hospital (McKean Street, Caboolture); • Caboolture Community Health Centre (McKean Street, Caboolture); • Queensland University of Technology (80-106 Tallon Street, Caboolture); • Brisbane North Institute of TAFE (Tallon Street, Caboolture); • Showgrounds at Old Gympie Road, Caboolture; • Caboolture Swimming Pool (King Street, Caboolture); • Moreton Bay Regional Council customer service centre (2 Hasking Street,
Caboolture);
Strathpine
• Pine Rivers Gallery (7/199 Gympie Road, Strathpine); • Strathpine Library (corner of Gympie and South Pine Roads, Strathpine); • Moreton Bay Regional Council customer service centre (220 Gympie Road,
Strathpine); • Pine Rivers Community Health Centre (568 Gympie Road, Strathpine);
North Lakes
• North Lakes Aquatic Leisure Centre (9 The Corso, North Lakes); • North Lakes Library (5 Discovery Drive, North Lakes); • North Lakes Health Precinct (9 Endeavour Boulevard, North Lakes); • The Corso: Under Construction (The Corso, North Lakes);
Redcliffe
• Redcliffe City Gallery (407-476 Oxley Avenue, Redcliffe); • Redcliffe Cultural Centre (Downs Street, Redcliffe); • Showgrounds at Scarborough Road, Redcliffe; • Brisbane North Institute of TAFE (64-68 Klingner Road, Redcliffe); • Redcliffe War Memorial Pool (Sydney Street, Redcliffe); • Settlement Cove Lagoon (Redcliffe Parade, Redcliffe); • Redcliffe Library (470-476 Oxley Avenue, Redcliffe); • Moreton Bay Regional Council customer service centre (Irene Street,
Redcliffe)
Existing community infrastructure within lower order centres includes:
• Arana Hills
– Arana Hills Library (Narellan Park, Arana Hills);
• Albany Creek
– Albany Creek Leisure Centre (Old Northern Road, Albany Creek);
– Albany Creek Library (16 Ferguson Street, Albany Creek);
• Kallangur
– Kallangur Library (1480 Anzac Avenue, Kallangur);

Retail & Commercial Sectors Needs Assessment 49 24 June 2013 12047 Report Rev 0
• Deception Bay
– Deception Bay Aquatic & Fitness Centre (Maine Terrace, Deception Bay);
– Deception Bay Library (corner Captain Cook Parade & Bayview Terrace, Deception Bay);
• Burpengary
– Caboolture Regional Aquatic Leisure Centre (1 Aquatic Centre Drive, Burpengary);
– Burpengary Library (121 Station Road, Burpengary);
• Bribie Island
– Bribie Island Aquatic Leisure Centre (Goodwin Drive, Bribie Island); and
– Bribie Island Library (corner First Avenue & Welsby Parade, Bongaree).
No community infrastructure was identified at Petrie or Warner.
5.3.5 Infrastructure Projects
The South East Queensland Regional Plan 2009-2031 identifies a number of key infrastructure projects that will support the delivery of the SEQ Regional Plan, including:
• The Houghton Highway duplication and bus priority;
• The Lawnton to Petrie third rail track (Moreton Bay Rail Link);
• The Petrie to Redcliffe rail corridor;
• The North Lakes Health Precinct;
• The Caboolture Health Precinct; and
• Upgrades to the Redcliffe Aquatic Centre.
The Moreton Bay Rail Link will significantly improve accessibility to North Lakes, which is currently serviced only by bus routes. Other key infrastructure projects identified above would provide significant benefits to Redcliffe and North Lakes, but none would directly benefit Strathpine.
North Lakes will soon have additional community infrastructure with development of The Corso at North Lakes, which will incorporate a library twice the size of the existing library, a community centre, a young persons space and 4,000m2 of commercial offices.
The Strathpine Gateway project, which will be located next to Council’s Strathpine offices, will include the Strathpine Library and other community spaces. It will also link Strathpine train station to the surrounding retail precinct.
5.3.6 Summary
Within SEQ, Moreton Bay RC has a low provision of higher order centres relative to the other local governments. This may have implications for the region’s ability to increase employment self-containment.
Of the higher order centres, Caboolture – Morayfield PRAC currently has the largest provision of floor space and the highest provision of full-line supermarkets, and department and discount department stores within Moreton Bay RC. Furthermore Caboolture – Morayfield includes

Retail & Commercial Sectors Needs Assessment 50 24 June 2013 12047 Report Rev 0
Caboolture Hub, private and public hospital, community health centre, tertiary education, showgrounds, swimming pool and a service centre. Caboolture – Morayfield also serves as an inter-regional public transport hub.
North Lakes MRAC currently has the second highest provision of floor space and the only department store within the region (Myer). North Lakes MRAC has strong growth prospects (as shown in Table 2.2 of the report) and a number of development approvals (refer to Table 2.6 above). Community facility provision within North Lakes currently includes an aquatic centre, library and health precinct with future projects including Corso at North Lakes.
Redcliffe MRAC and Strathpine MRAC currently have a high provision of floor space and community facilities, but only limited population and employment growth prospects. As such, these centres do not have the same capacity to grow into principal regional activity centres as North Lakes.
5.4 Proposed Centres Hierarchy
5.4.1 Principal Centres
Based on the above analysis, it is recommended that both Caboolture – Morayfield and North Lakes are designated as Principal Centres.
It is evident from the analysis contained in sections 5.3.1 to 5.3.5 that Caboolture – Morayfield will remain the principal employment centre within Moreton Bay Regional Council and have the highest level of retail and community facility provision. Any future department store provision within Moreton Bay Regional Council should be directed to either the Caboolture – Morayfield principal activity centre or North Lakes principal activity centre.
North Lakes is the only centre within Moreton Bay Regional Council to have a department store (Myer) and also the recently approved site for Queensland’s first Costco. Employment within the North Lakes district is anticipated to more than double over the next twenty years to over 40,000 persons, with the population within the region to reach almost 173,000 persons. As its population grows North Lakes is likely to have a growing community sector. For all of these reasons North Lakes is logical as a principal activity centre.
5.4.2 Major Centres
The Redcliffe – Kippa Ring area has a broad range of community facilities, mainly as a result of previous local government boundaries and its isolation from other centres. However, a number of factors contains its capacity to function as more than a major activity centre. The population of Redcliffe – Kippa Ring will tend to access higher order services both locally and from the higher order centre of North Lakes. Land accessibility constraints, will essentially limit the area’s ability to function as a principal centre. The population of the broader Redcliffe area is anticipated to increase by approximately 8,000 persons between 2011 and 2031, representing only 5% of the total population growth anticipated within Moreton Bay Regional Council in this period.
While it has a number of commercial office tenancies and community facilities, the Strathpine centre faces challenges in attracting higher order retail tenancies due to its proximity to Brisbane (particularly Chermside) and North Lakes. Westfield Strathpine previously featured a Myer department store, which closed in 2008. Subsequently, a Myer store was opened in North Lakes.

Retail & Commercial Sectors Needs Assessment 51 24 June 2013 12047 Report Rev 0
Strathpine is unlikely to attract a department store despite population growth in surrounding areas (particularly Warner), due to its proximity to Brisbane, and in particular to the Chermside Principal Regional Activity Centre which has both Myer and David Jones as tenants.
5.4.3 District Centres
The Draft Strategic Framework identifies nine district centres within Moreton Bay Regional Council:
• Arana Hills;
• Albany Creek;
• Warner;
• Petrie;
• Kallangur;
• Margate;
• Deception Bay;
• Burpengary, and
• Bellara.
Petrie and Warner currently do not function as district centres. However, in the 2011 to 2031 period, the population of Central Pine West (of which Warner is a part) is projected to increase by approximately 14,000 persons to 37,009 persons. With this growth, the function of Warner will evolve towards a district centre function.
Petrie services a large area (west to Dayboro) but has only limited provision of existing floor space. With an increase of floor space provision Petrie would have the potential to function as a district centre.
5.4.4 Local and Neighbourhood Centres
The key point of difference between local and neighbourhood centres should be the presence in a local centre of a full-line supermarket with a relative depth in product offering. A small scale centre anchored by a full-line supermarket (typically 2,500m2 or larger) typically has a broader catchment than a centre with a smaller supermarket tenancy (e.g. an IGA, Foodworks, Aldi). However, despite Dayboro (Williams Street) and Samford (Main Street) not being anchored by a full-line supermarket they should be considered as local centres because they aim to cater for the day to day needs of the population within these rural villages.
The following classification is suggested:
• Local Centres
– Woolworths Market Place (Albany Creek);
– Banksia Beach Shopping Village;
– Central Lakes Shopping Village;
– Woodford Shopping Centre;

Retail & Commercial Sectors Needs Assessment 52 24 June 2013 12047 Report Rev 0
– Lily Brook Shopping Village;
– Astley Parade Local Centre;
– Kensington Village Shopping Centre;
– Murrumba Downs Shopping Centre;
– Dayboro (Williams Street);
– Samford (Main Street);
– The Big Fish Tavern site (if Woolworths proposal ultimately proceeds);
– Redcliffe Leagues Club site (if supermarket proposal ultimately proceeds); and
• Neighbourhood centres:
– All other centres currently classified as local centres within Moreton Bay Regional Council.
5.4.5 Specialised Centre (Bulky Goods / Special Purpose)
Specialised centres are centres which do not conform to the other centre categories (i.e. Principal, Major, District, Local and Neighbourhood). Within Moreton Bay RC, specialised centres have a focus on bulky goods retailers (e.g. home improvement, homeware products, furniture, floor coverings electrical goods, etc.). Specialised centres within Moreton Bay RC currently include the Lawnton Employment Area, Zone Rothwell Centre and the Bunnings Rothwell and Harvey Norman Centres.

Retail & Commercial Sectors Needs Assessment 53 24 June 2013 12047 Report Rev 0
Table 5.11: Centre Parameters Utilised for Centres Network
Parameter Principal Centre Major Centre District Centre Local Centre Neighborhood Centre
Place type Major transport hubs serving regional catchments. Most significant employment and retail nodes outside Brisbane CBD. Preferred locations for tertiary, health, education, cultural and entertainment facilities.
Major transport hubs serving regional and sub-regional catchments. Accommodate key employment concentrations and substantial local residential population. Preferred locations for tertiary health, education, cultural and entertainment facilities.
Significant transport hubs servicing districts. Provide a diverse mix of land uses and activities with a concentration of retail, business, commercial, employment, health services, administrative, community, cultural, recreational and entertainment. Accommodates a residential population.
Service walkable catchments and located along public transport routes. Provides services to weekly needs, and lower order commercial services. Include lower order community facilities and/or are co-located with schools, local and district sporting facilities, etc.
Service walkable catchments. Provide services necessary to meet immediate and day-to-day needs. Include or lower order community facilities.
Approximate catchment size
>10km radius ~ 7.5km radius ~ 5km radius ~2km radius ~0.5 km radius
Retail >60,000m2 without limitations on types of tenants
~40,000m2-60,000m2 Including:
• 2-4 full line supermarkets
• 2 DDS
• Mini majors
• Specialty retailers
• Retail showrooms
15,000m2-25,000m2 Including:
• 1-2 full line supermarkets
• 1 DDS
• Mini majors
• Specialty retailers
• Retail showrooms Excludes:
• Bulky goods centres
• Dept stores
5,000m2-7,000m2 Including:
• 1 full line supermarket
• Specialty retailers Excludes:
• Bulky goods centres
• >1 full line supermarket
• DDS
• Mini majors
• Dept stores
• Retail showrooms / bulky goods
<2,000m2 Including:
• Limited line supermarket;
• Specialty retailers. Excludes:
• Bulky goods centres
• Full line supermarkets
• DDS
• Mini majors
• Dept stores
• Retail showrooms / bulky goods
Commercial Effectively no limits >5,000m2 2,000m2-5,000m2 500m2-2,000m2
<500m2
Community Examples include:
• Tertiary education;
• Schools;
• Long day care;
• Health precinct;
• Place of worship;
• Convention centre;
• Library;
• Cinema.
Examples include:
• Long day care;
• Place of worship;
• Medical /health centre;
• Indoor recreation;
• Schools;
• Arts hub;
• Cinema.
Examples include:
• Long day care;
• Place of worship;
• Medical /health centre;
• Indoor recreation;
• Schools.
Examples include:
• Long day care;
• Place of worship; and
• Medical /health centre.
Examples include:
• Long day care;
• Place of worship; and
• Medical /health centre.

Retail & Commercial Sectors Needs Assessment 54 24 June 2013 12047 Report Rev 0
6 RETAIL AND COMMERCIAL CATCHMENTS
The purpose of this study is to develop a sustainable centres hierarchy to support retail and commercial activity within the Moreton Bay Region. This section identifies catchments for retail and commercial sector activity to facilitate detailed small area analysis. These catchments represent sub-districts to the Moreton Bay Regional Council Draft Strategic Framework districts discussed in Section 2. The catchments defined in this Section are used in the retail and commercial analyses contained in Sections 7 and 8 of this report respectively.
Retail and commercial catchments have been identified based on the existing centres network. A number of additional factors were considered in defining the retail and commercial catchments for Moreton Bay Regional Council, including:
• Local road infrastructure in terms of access to the site;
• Natural and man-made barriers;
• Travel times for shopper and worker trips;
• The location, role and function of existing centres;
• Psychological barriers;
• Other barriers such as railways and water courses.
This report defines sixteen catchments within Moreton Bay Regional Council, with two catchments extending beyond the Moreton Bay Regional Council boundary. The catchments have been defined primarily using statistical local area (SLA) boundaries, with adjustments made with SA1 and SA2s as necessary.
The catchments are as follows:
• Hills District / Samford;
• Albany Creek;
• Strathpine;
• Petrie / Dayboro;
• Central Pine West;
• Lawnton-Bray Park;
• Griffin-Mango Hill;
• Dakabin-Kallangur-Murrumba Downs;
• Redcliffe;
• Rothwell / Deception Bay;
• Bribie Island;
• Caboolture-Morayfield;
• Caboolture East;
• Burpengary-Narangba;

Retail & Commercial Sectors Needs Assessment 55 24 June 2013 12047 Report Rev 0
• Caboolture Midwest; and
• Caboolture Hinterland.
Figure 6.1 below provides a geographic representation of the retail and commercial catchments for Moreton Bay Regional Council.
Figure 6.1: Retail and Commercial Catchments for Moreton Bay Regional Council

Retail & Commercial Sectors Needs Assessment 56 24 June 2013 12047 Report Rev 0
6.1 Population and Household Projections within Catchments
The population of Moreton Bay RC retail and commercial catchments is projected to increase from 408,351 persons in 2012 to 556,918 persons in 2031, or by approximately 1.6% per annum.
The number of households in the activity centre catchments of Moreton Bay RC is anticipated to increase from 161,043 households in 2012 to 224,004 households in 2031 (~1.8% per annum).
Dakabin-Kallangur-Murrumba Downs, Burpengary-Narangba, Central Pine West, Caboolture Hinterland and Caboolture-Morayfield catchments are projected to have the highest rates of population and households formation growth.
Table 6.1 below provides a summary of the projected population and household growth within Moreton Bay RC by retail and commercial catchment areas.
Table 6.1: Projected Population and Households, 2012-2031
2012 2016 2021 2026 2031 Ave. Ann Growth 2012 to 2031
Population Albany Creek 23,784 24,912 26,649 27,769 29,007 1.1% Bribie Island 17,523 18,302 19,021 19,151 19,235 0.5% Burpengary - Narangba 27,753 29,555 34,859 42,778 51,876 3.3% Caboolture East 16,728 17,181 17,651 17,557 17,535 0.2% Caboolture Hinterland 8,621 9,679 10,792 11,744 13,067 2.2% Caboolture Midwest 15,729 17,285 19,283 21,166 23,173 2.1% Caboolture Morayfield 53,698 64,284 71,155 74,344 83,114 2.3% Central Pine West 24,134 27,143 31,148 34,595 37,009 2.3% Dakabin-Kallangur-Murrumba Downs 30,053 35,341 39,906 42,088 42,367 1.8% Griffin-Mango Hill 23,421 33,035 40,562 48,851 51,257 4.2% Hills District/Samford 32,090 33,839 33,950 34,297 34,970 0.5% Lawnton - Bray Park 15,886 16,760 17,350 17,750 18,494 0.8% Petrie/Dayboro 18,609 19,216 19,672 19,896 20,033 0.4% Redcliffe 48,708 50,285 51,947 53,089 54,387 0.6% Rothwell - Deception Bay 30,910 34,097 36,241 36,335 37,104 1.0% Strathpine 20,376 22,019 23,377 24,145 24,290 0.9% Total 408,351 452,933 493,563 525,555 556,918 1.6% Households Albany Creek 8,158 8,636 9,318 9,804 10,293 1.2% Bribie Island 9,963 10,398 10,724 10,724 10,724 0.4% Burpengary - Narangba 9,457 10,231 12,209 15,060 18,169 3.5% Caboolture East 7,045 7,270 7,516 7,543 7,565 0.4% Caboolture Hinterland 3,268 3,739 4,238 4,670 5,235 2.5% Caboolture Midwest 5,510 6,103 6,876 7,562 8,265 2.2% Caboolture Morayfield 20,875 24,972 27,939 29,680 33,048 2.4% Central Pine West 7,995 9,240 10,715 12,129 13,075 2.6% Dakabin-Kallangur-Murrumba Downs 12,330 14,363 16,300 17,173 17,336 1.8% Griffin-Mango Hill 8,964 12,658 15,794 19,182 20,529 4.5% Hills District/Samford 11,721 12,446 12,661 12,908 13,192 0.6% Lawnton - Bray Park 6,100 6,493 6,740 6,896 7,196 0.9% Petrie/Dayboro 6,606 6,956 7,349 7,551 7,608 0.7% Redcliffe 23,398 24,317 25,530 26,558 27,353 0.8% Rothwell - Deception Bay 11,972 13,287 14,259 14,611 15,008 1.2% Strathpine 7,681 8,309 8,892 9,264 9,408 1.1% Total 161,043 179,418 197,061 211,315 224,004 1.8%

Retail & Commercial Sectors Needs Assessment 57 24 June 2013 12047 Report Rev 0
2012 2016 2021 2026 2031 Ave. Ann Growth 2012 to 2031
Average Household Size Albany Creek 2.92 2.88 2.86 2.83 2.82 - Bribie Island 1.76 1.76 1.77 1.79 1.79 - Burpengary - Narangba 2.93 2.89 2.86 2.84 2.86 - Caboolture East 2.37 2.36 2.35 2.33 2.32 - Caboolture Hinterland 2.64 2.59 2.55 2.51 2.50 - Caboolture Midwest 2.85 2.83 2.80 2.80 2.80 - Caboolture Morayfield 2.57 2.57 2.55 2.50 2.51 - Central Pine West 3.02 2.94 2.91 2.85 2.83 - Dakabin-Kallangur-Murrumba Downs 2.44 2.46 2.45 2.45 2.44 - Griffin-Mango Hill 2.61 2.61 2.57 2.55 2.50 - Hills District/Samford 2.74 2.72 2.68 2.66 2.65 - Lawnton - Bray Park 2.60 2.58 2.57 2.57 2.57 - Petrie/Dayboro 2.82 2.76 2.68 2.63 2.63 - Redcliffe 2.08 2.07 2.03 2.00 1.99 - Rothwell - Deception Bay 2.58 2.57 2.54 2.49 2.47 - Strathpine 2.65 2.65 2.63 2.61 2.58 - Total 2.54 2.52 2.50 2.49 2.49 -
Note: The population and household projections presented in this table for Moreton Bay RC are based on those presented in the Moreton Bay Regional Council (2012a) Planning Assumptions Specification – October 2012 and have been adjusted to address the inconsistency between planning area boundaries and SLA boundaries. Source: Moreton Bay Regional Council (2012a), Office of Economic and Statistical Research (2011) and Office of Economic and Statistical Research (2012)

Retail & Commercial Sectors Needs Assessment 58 24 June 2013 12047 Report Rev 0
7 PROJECTED RETAIL FLOOR SPACE DEMAND
7.1 Retail Floor Space Demand – Methodology
Figure 7.1 below outlines the methodology used to estimate retail floor space demand for each of the defined catchments within Moreton Bay Regional Council.
Figure 7.1: Methodology for Preparing Retail Floor Space Demand Projections

Retail & Commercial Sectors Needs Assessment 59 24 June 2013 12047 Report Rev 0
7.2 Available Retail Expenditure within Catchments
Retail expenditure analysis seeks to identify retail expenditure patterns for households in identified catchment areas, which can then be extrapolated by projected household formation over time to generate a total future available retail expenditure estimate for identified trade area/s.
A number of retail categories are identified, these being:
• Grocery and Specialty:
– Groceries and take home food;
– Dining & take-away food (including on-premise liquor);
– Clothing, footwear and apparel;
– Personal and other goods;
– Takeaway liquor;
• Bulky goods:
– Core bulky goods 2;
– Ancillary bulky goods 3; and
– Hardware.
Retail expenditure data for Greater Metropolitan Brisbane is taken from the ABS Household Expenditure Survey 2009-10 (Cat No. 6535.0.55.001) and assigned to the above retail expenditure categories and then adjusted for sub-regional variations based on income quintiles. All estimates are expressed in 2011 dollars.
Table 7.1 below summarises the estimated weekly retail expenditure patterns of households within the trade areas between 2012 and 2031 (the detailed weekly retail expenditure by category table can be found in Appendix B).
Table 7.1: Weekly Retail Expenditure Patterns of Catchment Area Households, 2012-2031 (2011 dollars)
2012 2016 2021 2026 2031
Albany Creek Total Grocery & Specialty $563.71 $572.21 $586.65 $601.47 $616.66 Total Bulky Goods $169.19 $171.74 $176.08 $180.52 $185.08 Total $732.90 $743.95 $762.73 $781.99 $801.74 Bribie Island Total Grocery & Specialty $407.54 $413.68 $424.13 $434.84 $445.82 Total Bulky Goods $109.22 $110.86 $113.66 $116.53 $119.47 Total $516.75 $524.54 $537.79 $551.37 $565.29
2 Core bulky goods include furniture and floor coverings, household appliances and audio-visual equipment and parts.
3 Ancillary bulky goods include blankets, household linen and household furnishings, glassware, tableware, cutlery and household utensils, home computer equipment, camping equipment and motor vehicle parts and accessories purchased separately
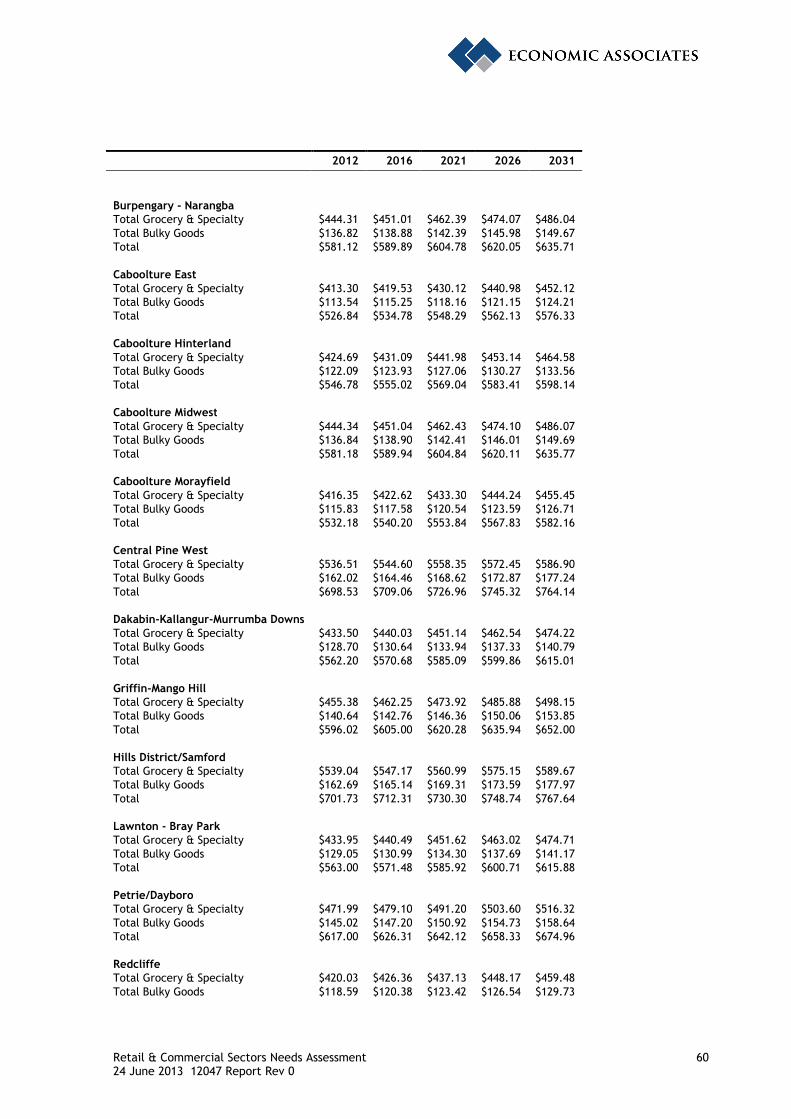
Retail & Commercial Sectors Needs Assessment 60 24 June 2013 12047 Report Rev 0
2012 2016 2021 2026 2031
Burpengary - Narangba Total Grocery & Specialty $444.31 $451.01 $462.39 $474.07 $486.04 Total Bulky Goods $136.82 $138.88 $142.39 $145.98 $149.67 Total $581.12 $589.89 $604.78 $620.05 $635.71 Caboolture East Total Grocery & Specialty $413.30 $419.53 $430.12 $440.98 $452.12 Total Bulky Goods $113.54 $115.25 $118.16 $121.15 $124.21 Total $526.84 $534.78 $548.29 $562.13 $576.33 Caboolture Hinterland Total Grocery & Specialty $424.69 $431.09 $441.98 $453.14 $464.58 Total Bulky Goods $122.09 $123.93 $127.06 $130.27 $133.56 Total $546.78 $555.02 $569.04 $583.41 $598.14 Caboolture Midwest Total Grocery & Specialty $444.34 $451.04 $462.43 $474.10 $486.07 Total Bulky Goods $136.84 $138.90 $142.41 $146.01 $149.69 Total $581.18 $589.94 $604.84 $620.11 $635.77 Caboolture Morayfield Total Grocery & Specialty $416.35 $422.62 $433.30 $444.24 $455.45 Total Bulky Goods $115.83 $117.58 $120.54 $123.59 $126.71 Total $532.18 $540.20 $553.84 $567.83 $582.16 Central Pine West Total Grocery & Specialty $536.51 $544.60 $558.35 $572.45 $586.90 Total Bulky Goods $162.02 $164.46 $168.62 $172.87 $177.24 Total $698.53 $709.06 $726.96 $745.32 $764.14 Dakabin-Kallangur-Murrumba Downs Total Grocery & Specialty $433.50 $440.03 $451.14 $462.54 $474.22 Total Bulky Goods $128.70 $130.64 $133.94 $137.33 $140.79 Total $562.20 $570.68 $585.09 $599.86 $615.01 Griffin-Mango Hill Total Grocery & Specialty $455.38 $462.25 $473.92 $485.88 $498.15 Total Bulky Goods $140.64 $142.76 $146.36 $150.06 $153.85 Total $596.02 $605.00 $620.28 $635.94 $652.00 Hills District/Samford Total Grocery & Specialty $539.04 $547.17 $560.99 $575.15 $589.67 Total Bulky Goods $162.69 $165.14 $169.31 $173.59 $177.97 Total $701.73 $712.31 $730.30 $748.74 $767.64 Lawnton - Bray Park Total Grocery & Specialty $433.95 $440.49 $451.62 $463.02 $474.71 Total Bulky Goods $129.05 $130.99 $134.30 $137.69 $141.17 Total $563.00 $571.48 $585.92 $600.71 $615.88 Petrie/Dayboro Total Grocery & Specialty $471.99 $479.10 $491.20 $503.60 $516.32 Total Bulky Goods $145.02 $147.20 $150.92 $154.73 $158.64 Total $617.00 $626.31 $642.12 $658.33 $674.96 Redcliffe Total Grocery & Specialty $420.03 $426.36 $437.13 $448.17 $459.48 Total Bulky Goods $118.59 $120.38 $123.42 $126.54 $129.73

Retail & Commercial Sectors Needs Assessment 61 24 June 2013 12047 Report Rev 0
2012 2016 2021 2026 2031
Total $538.63 $546.75 $560.55 $574.71 $589.22 Rothwell - Deception Bay Total Grocery & Specialty $415.78 $422.04 $432.70 $443.63 $454.83 Total Bulky Goods $115.40 $117.14 $120.10 $123.13 $126.24 Total $531.18 $539.18 $552.80 $566.76 $581.07 Strathpine Total Grocery & Specialty $437.64 $444.24 $455.46 $466.96 $478.75 Total Bulky Goods $131.82 $133.80 $137.18 $140.65 $144.20 Total $569.46 $578.04 $592.64 $607.61 $622.95
Source: Derived from ABS (2011) Household Expenditure Survey, 2009-10 Australian Bureau of Statistics (2012a)
Annual available retail expenditure in the combined retail and commercial catchment areas is anticipated to increase from $4,854.90 million in 2012 to $7,398.54 million in 2031 or by 2.2% per annum.
The major catchments in terms of total retail expenditure are:
• Caboolture – Morayfield: 11.9% of total retail expenditure in 2012 increasing to 13.5% in 2031;
• Redcliffe: 13.5% of total retail expenditure in 2012 decreasing to 11.3% in 2031;
• Griffin – Mango Hill: 5.7% of total retail expenditure in 2012 increasing to 9.4% in 2031; and
• Burpengary – Narangba: 5.9% of total retail expenditure in 2012 increasing to 8.1% in 2031.
Table 7.2 below summarises the annual available retail expenditure within the catchment areas (a detailed table can be found in Appendix B of this report).
Table 7.2: Annual Available Retail Expenditure within Catchment Areas, 2012-2031 ($M) (2011 dollars)
2012 2016 2021 2026 2031
Albany Creek Total Grocery & Specialty $239.13 $256.96 $284.27 $306.64 $330.06 Total Bulky Goods $71.77 $77.12 $85.32 $92.03 $99.06 Total $310.90 $334.08 $369.59 $398.68 $429.12 Bribie Island Total Grocery & Specialty $211.13 $223.68 $236.51 $242.49 $248.61 Total Bulky Goods $56.58 $59.94 $63.38 $64.98 $66.62 Total $267.71 $283.62 $299.90 $307.47 $315.23 Burpengary - Narangba Total Grocery & Specialty $218.50 $239.94 $293.56 $371.25 $459.21 Total Bulky Goods $67.28 $73.89 $90.40 $114.32 $141.41 Total $285.78 $313.83 $383.96 $485.58 $600.61 Caboolture East Total Grocery & Specialty $151.40 $158.61 $168.10 $172.98 $177.87 Total Bulky Goods $41.59 $43.57 $46.18 $47.52 $48.86 Total $192.99 $202.18 $214.28 $220.50 $226.73

Retail & Commercial Sectors Needs Assessment 62 24 June 2013 12047 Report Rev 0
2012 2016 2021 2026 2031
Caboolture Hinterland Total Grocery & Specialty $72.17 $83.82 $97.40 $110.04 $126.47 Total Bulky Goods $20.75 $24.10 $28.00 $31.63 $36.36 Total $92.92 $107.91 $125.40 $141.67 $162.82 Caboolture Midwest Total Grocery & Specialty $127.31 $143.14 $165.34 $186.43 $208.91 Total Bulky Goods $39.21 $44.08 $50.92 $57.41 $64.34 Total $166.52 $187.22 $216.26 $243.84 $273.24 Caboolture Morayfield Total Grocery & Specialty $451.95 $548.79 $629.51 $685.61 $782.69 Total Bulky Goods $125.73 $152.67 $175.13 $190.74 $217.75 Total $577.68 $701.46 $804.64 $876.35 $1,000.43 Central Pine West Total Grocery & Specialty $223.05 $261.67 $311.10 $361.05 $399.03 Total Bulky Goods $67.36 $79.02 $93.95 $109.03 $120.50 Total $290.41 $340.69 $405.05 $470.08 $519.54 Dakabin-Kallangur-Murrumba Downs Total Grocery & Specialty $277.93 $328.65 $382.39 $413.04 $427.49 Total Bulky Goods $82.52 $97.58 $113.53 $122.63 $126.92 Total $360.45 $426.23 $495.92 $535.67 $554.41 Griffin-Mango Hill Total Grocery & Specialty $212.26 $304.26 $389.22 $484.65 $531.78 Total Bulky Goods $65.55 $93.97 $120.21 $149.68 $164.23 Total $277.82 $398.22 $509.43 $634.33 $696.02 Hills District/Samford Total Grocery & Specialty $328.53 $354.13 $369.35 $386.06 $404.52 Total Bulky Goods $99.15 $106.88 $111.47 $116.52 $122.09 Total $427.69 $461.00 $480.82 $502.58 $526.60 Lawnton - Bray Park Total Grocery & Specialty $137.66 $148.73 $158.28 $166.04 $177.63 Total Bulky Goods $40.94 $44.23 $47.07 $49.37 $52.82 Total $178.59 $192.95 $205.35 $215.41 $230.46 Petrie/Dayboro Total Grocery & Specialty $162.13 $173.30 $187.70 $197.73 $204.26 Total Bulky Goods $49.81 $53.24 $57.67 $60.75 $62.76 Total $211.94 $226.54 $245.38 $258.49 $267.02 Redcliffe Total Grocery & Specialty $511.05 $539.12 $580.32 $618.93 $653.56 Total Bulky Goods $144.29 $152.22 $163.85 $174.75 $184.53 Total $655.34 $691.34 $744.18 $793.69 $838.09 Rothwell - Deception Bay Total Grocery & Specialty $258.84 $291.61 $320.82 $337.05 $354.95 Total Bulky Goods $71.84 $80.94 $89.05 $93.55 $98.52 Total $330.68 $372.54 $409.87 $430.60 $453.46 Strathpine Total Grocery & Specialty $174.81 $191.94 $210.61 $224.94 $234.21 Total Bulky Goods $52.65 $57.81 $63.43 $67.75 $70.54 Total $227.46 $249.75 $274.04 $292.68 $304.75

Retail & Commercial Sectors Needs Assessment 63 24 June 2013 12047 Report Rev 0
2012 2016 2021 2026 2031
Total Total Grocery & Specialty $3,757.86 $4,248.32 $4,784.49 $5,264.93 $5,721.23 Total Bulky Goods $1,097.04 $1,241.26 $1,399.56 $1,542.69 $1,677.31 Total $4,854.90 $5,489.57 $6,184.06 $6,807.61 $7,398.54
Source: Derived from Table 6.1 and Table 7.1
7.3 Sales Productivity
To derive the amount of retail floor space supportable by each catchment, sales productivity rates have been applied to each retail expenditure category. Sales productivity within the retail catchments has been assumed as follows:
• Groceries and take home food: $8,500/m2;
• Dining and take-away food, including on-premise liquor: $5,000/m2;
• Clothing, footwear and apparel: $4,500/m2;
• Personal and other goods: $4,500/m2;
• Core bulky goods: $3,500/m2;
• Ancillary bulky goods: $4,000/m2;
• Hardware: $2,500/m2; and
• Takeaway liquor: $6,000/m2.
Sales productivity rates are used as a means of rationing floor space within and across catchments. The sales productivity rates adopted allow for reasonable levels of commercial performance balanced against the need to ensure sufficient supply to meet community expectations of choice and convenience.
At a small area level, it may be appropriate to adopt marginally lower rates (i.e. no more than 10% lower) in situations where there is very limited choice.
7.4 Retail Expenditure Leakage Rates
Retail catchments within Moreton Bay Regional Council are anticipated to experience retail expenditure leakage to retail centres outside the region. Retail catchments located in close proximity to major Brisbane based centres and / or the Bruce Highway are anticipated to record marginally higher levels of retail expenditure leakage than those further north and / or removed from the Bruce Highway.
These adopted leakage rates seek to balance the inevitability of expenditure leakage to Brisbane centres against an overlying policy objective of Moreton Bay RC to minimise expenditure leakage.
Assumed retail expenditure leakage rates are shown in Table 7.3 below.

Retail & Commercial Sectors Needs Assessment 64 24 June 2013 12047 Report Rev 0
Table 7.3: Expenditure Leakage Range, Moreton Bay Regional Council
Retail Category Low High
Groceries & take home food 2.5% 10.0%
Dining & take-away food (incl. on-premise liquor) 7.5% 30.0%
Clothing, footwear & apparel 10.0% 40.0%
Personal & other goods 7.5% 30.0%
Core bulky goods 10.0% 40.0%
Ancillary bulky goods 10.0% 40.0%
Hardware 7.5% 30.0%
Takeaway liquor 2.5% 15.0%
The retail catchments by leakage gradient based on each retail catchment’s proximity to major Brisbane based centres and / or the Bruce Highway is shown in Table 7.4.
Table 7.4: Expenditure Leakage outside Moreton Bay RC by Retail Catchment
Low Low/Medium Medium/High High
Bribie Island Burpengary - Narangba Dakabin-Kallangur-
Murrumba Downs Albany Creek
Caboolture East Griffin-Mango Hill Strathpine Hills District/Samford Caboolture Hinterland Lawnton – Bray Park Caboolture Midwest Redcliffe Caboolture Morayfield Rothwell – Deception Bay Central Pine West Petrie / Dayboro
7.5 Supportable Floor Space
Floor space supportable by the estimated catchment generated expenditures is summarised in Table 7.5 below (a detailed table can be found in Appendix C). Supportable floor space is estimated by applying sales productivity rates and expenditure leakage rates to the catchment level available expenditure estimates.
The retail catchments in total are estimated to support 824,250m2 of floor space in 2012, increasing to 1,263,666m2 of floor space in 2031. In 2031, supportable floor space is anticipated to be largest in:
• Caboolture Morayfield: 178,997m2 or 14.2% of total supportable floor space;
• Redcliffe: 144,754m2 of 11.5% or total supportable floor space;
• Griffin – Mango Hill: 122,139m2 or 9.7% of total supportable floor space;
• Burpengary – Narangba: 105,270m2 or 8.3% of total supportable floor space; and
• Central Pine West: 94,834m2 or 7.5% of total supportable floor space.

Retail & Commercial Sectors Needs Assessment 65 24 June 2013 12047 Report Rev 0
Table 7.5: Supportable Floor Space generated within Retail Catchments, 2012-2031 (sqm)
2012 2016 2021 2026 2031
Albany Creek Total Grocery & Specialty 30,538 32,815 36,303 39,160 42,150 Total Bulky Goods 12,655 13,599 15,044 16,228 17,467 Total 43,194 46,414 51,347 55,388 59,618 Bribie Island Total Grocery & Specialty 33,004 34,964 36,971 37,905 38,862 Total Bulky Goods 14,590 15,457 16,344 16,756 17,179 Total 47,593 50,421 53,315 54,661 56,041 Burpengary - Narangba Total Grocery & Specialty 33,734 37,044 45,323 57,318 70,897 Total Bulky Goods 16,356 17,961 21,974 27,790 34,374 Total 50,089 55,005 67,297 85,108 105,270 Caboolture East Total Grocery & Specialty 23,746 24,876 26,365 27,130 27,897 Total Bulky Goods 10,710 11,220 11,891 12,236 12,582 Total 34,456 36,096 38,256 39,366 40,478 Caboolture Hinterland Total Grocery & Specialty 11,391 13,229 15,373 17,368 19,961 Total Bulky Goods 5,329 6,189 7,192 8,125 9,338 Total 16,720 19,418 22,565 25,493 29,299 Caboolture Midwest Total Grocery & Specialty 20,297 22,820 26,360 29,722 33,305 Total Bulky Goods 10,034 11,281 13,031 14,693 16,464 Total 30,331 34,102 39,391 44,415 49,770 Caboolture Morayfield Total Grocery & Specialty 71,007 86,221 98,904 107,718 122,969 Total Bulky Goods 32,352 39,284 45,063 49,079 56,028 Total 103,359 125,505 143,967 156,796 178,997 Central Pine West Total Grocery & Specialty 35,693 41,873 49,783 57,776 63,855 Total Bulky Goods 17,317 20,315 24,152 28,030 30,979 Total 53,010 62,187 73,936 85,806 94,834 Dakabin-Kallangur-Murrumba Downs Total Grocery & Specialty 40,756 48,193 56,073 60,568 62,687 Total Bulky Goods 18,930 22,385 26,045 28,133 29,117 Total 59,686 70,577 82,118 88,701 91,803 Griffin-Mango Hill Total Grocery & Specialty 32,812 47,033 60,167 74,919 82,204 Total Bulky Goods 15,940 22,849 29,229 36,396 39,935 Total 48,752 69,881 89,396 111,314 122,139 Hills District/Samford Total Grocery & Specialty 41,932 45,198 47,141 49,274 51,629 Total Bulky Goods 17,459 18,819 19,628 20,516 21,497 Total 59,391 64,017 66,769 69,790 73,126 Lawnton - Bray Park Total Grocery & Specialty 21,146 22,847 24,315 25,505 27,287

Retail & Commercial Sectors Needs Assessment 66 24 June 2013 12047 Report Rev 0
2012 2016 2021 2026 2031
Total Bulky Goods 9,970 10,772 11,464 12,025 12,865 Total 31,117 33,618 35,778 37,531 40,153 Petrie/Dayboro Total Grocery & Specialty 25,894 27,678 29,979 31,581 32,623 Total Bulky Goods 12,764 13,643 14,777 15,567 16,080 Total 38,658 41,321 44,757 47,148 48,704 Redcliffe Total Grocery & Specialty 77,941 82,222 88,506 94,394 99,676 Total Bulky Goods 35,249 37,185 40,027 42,690 45,078 Total 113,190 119,407 128,533 137,085 144,754 Rothwell - Deception Bay Total Grocery & Specialty 39,385 44,371 48,817 51,285 54,008 Total Bulky Goods 17,568 19,792 21,775 22,876 24,091 Total 56,953 64,163 70,592 74,161 78,099 Strathpine Total Grocery & Specialty 25,683 28,200 30,942 33,048 34,410 Total Bulky Goods 12,069 13,252 14,540 15,530 16,170 Total 37,752 41,452 45,483 48,577 50,580 Total Total Grocery & Specialty 564,959 639,585 721,321 794,670 864,420 Total Bulky Goods 259,291 294,000 332,177 366,670 399,245 Total 824,250 933,585 1,053,498 1,161,340 1,263,666
Source: Derived from Table 7.2 and Economic Associates estimates
7.6 Centres by Retail Catchments
Table 7.6 below lists the centres hierarchy within the retail catchments as identified in Section 5 of this report.

Retail & Commercial Sectors Needs Assessment 67 24 June 2013 12047 Report Rev 0
Table 7.6: Activity Centres within Catchments (based on current centres hierarchy)
Albany
Creek
Bribie
Island
Burpengary
- Narangba
Caboolture
Morayfield
Caboolture
East
Caboolture
Hinterland
Caboolture
Midwest
Central Pine
West
Dakabin
Kallangur-
Murrumba
Downs
Griffin
Mango Hill
Hills
District /
Samford
Lawnton –
Bray Park
Petrie Redcliffe Rothwell -
Deception
Bay
Strathpine
PRAC Caboolture
Morayfield
MRAC Caboolture North Lakes Redcliffe -
Kippa Ring Strathpine
Morayfield District Albany
Creek Bribie Island
Burpengary Caboolture Park Shopping Centre
Warner Village Kallangur Westfield North Lakes
Arana Hills
Petrie Village
Peninsula Fair
Deception Bay Shopping Centre
Westfield Strathpine
Morayfield Shopping Centre
Margate Village
Local Albany
Place Bellara Corner Store
FoodWorks Burpengary
The Big Fish Tavern
Ningi Woodford Shopping Centre
Wamuran Bunya Park Drive Convenience Centre
Anzac Avenue Local Centre
North Lakes Convenience Centre
Ferny Way South
Francis Road Local Centre
Dayboro Redcliffe IGA Bayview Shops
Lincoln Centre
Radius Medical Centre
Bribie Island Hotel
Oakey Flat Road
Tullawong Corner Store
The Village Sandstone Point
Woodford Central Shopping Centre
Elimbah Eatons Hill Convenience Centre
Kallangur Village Shopping Centre
Astley Parade Local Centre
Mt Glorious
Ebert Place Shops
Beeville Road Local Centre
Redcliffe Coastal Strip Retail
Deception Bay Strip Retail
Bell's Corner
Woolworths Market Place
Bongaree Woodpecker Tavern
Lear Jet Centre
Beachmere Plaza
Woodford Strip Retail
Excelsior Park Village
Lilly Brook Shopping Village
Arlington Court
Ellis Street Local Centre
Clontarf Bayside Plaza
Zone Rothwell
Sandalwood Shopping Village
Dawn Road Local Centre
Woorim Narangba Village
Argyll Street Centre
Toorbul D'Aguilar Murrumba Downs Shopping Centre
Everton Shopping Village
Sparkes Road Local Centre
Landsborough Avenue Local Centre
Bay Markets
Welsby Parade Shops
Narangba Station Plaza
Bellmere Shopping Centre
Donnybrook Castle Hill Centre
Chinook Street Local Centre
Kensington Village Shopping Centre
Mariners Plaza
Bunnings Rothwell & Harvey Norman Centre
Cotterill Shops
Chooks Corner
Central Lakes Shopping Village
Dakabin Village
Ferny Way Local Centre
Midways Convenience Centre
Deception Bay IGA
Aldi Centre - Bribie Island
Narangba Valley Shopping Centre
Trader Dukes Centre
170 Patricks Road
Ashmole Shopping Village
Rothwell Local Centre

Retail & Commercial Sectors Needs Assessment 68 24 June 2013 12047 Report Rev 0
Albany
Creek
Bribie
Island
Burpengary
- Narangba
Caboolture
Morayfield
Caboolture
East
Caboolture
Hinterland
Caboolture
Midwest
Central Pine
West
Dakabin
Kallangur-
Murrumba
Downs
Griffin
Mango Hill
Hills
District /
Samford
Lawnton –
Bray Park
Petrie Redcliffe Rothwell -
Deception
Bay
Strathpine
Coolgarra
Shops The Hub
Convenience Centre
Fernlands Village
Victoria Avenue Local Centre
Burpengary Tavern
Currong Shops
Parkridge Shopping Village
Everton Hills Shopping Centre
Redcliffe Leagues Club
North Bay Shopping Centre
Elkhorn Avenue
Glenwood Drive Centre
Samford Village Main Street Retailing
North Rise
Marine Parade
Hillcrest Gardens Shopping Centre
Samford Central
Banksia Beach Shopping Village
Samford Country Centre
Samford Valley
Note: Centres that fall within Brisbane City Council are not included in the table.

Retail & Commercial Sectors Needs Assessment 69 24 June 2013 12047 Report Rev 0
7.7 Large Scale Centre Assessment – PACs, MACs and Specialised Centre Precincts
7.7.1 Large Scale Centre Catchments and Market Shares
Larger centres within Moreton Bay RC are likely to draw trade from a number of retail catchment areas. Table 7.7 below lists the retail trade catchment areas for Caboolture – Morayfield Principal Activity Centre (PAC), North Lakes Major Activity Centre (MAC), Strathpine MAC and Redcliffe – Kippa Ring MAC.
Lawnton Employment Area and Rothwell – Deception Bay catchment area have extensive provision of bulky goods and hardware, and are likely to draw trade for these categories from surrounding retail catchment areas. As such, these precincts are also assessed separately in this section.
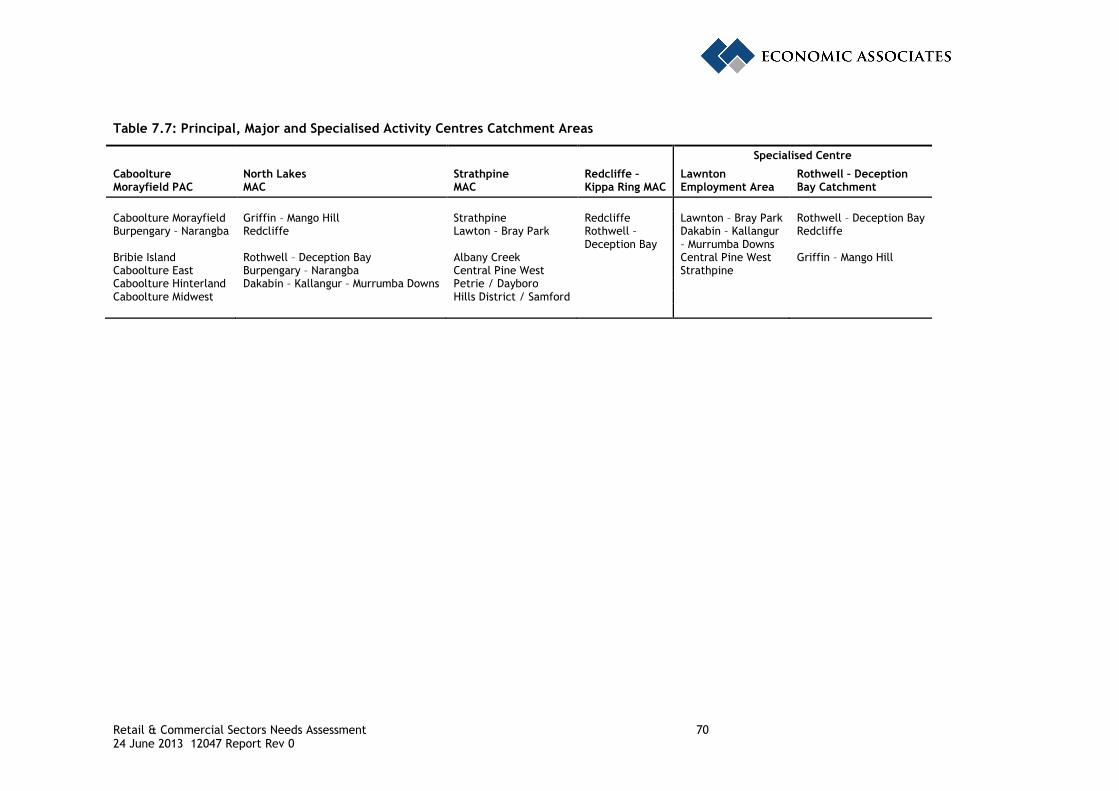
Retail & Commercial Sectors Needs Assessment 70 24 June 2013 12047 Report Rev 0
Table 7.7: Principal, Major and Specialised Activity Centres Catchment Areas
Specialised Centre
Caboolture Morayfield PAC
North Lakes MAC
Strathpine MAC
Redcliffe – Kippa Ring MAC
Lawnton Employment Area
Rothwell – Deception Bay Catchment
Caboolture Morayfield Griffin – Mango Hill Strathpine Redcliffe Lawnton – Bray Park Rothwell – Deception Bay Burpengary – Narangba Redcliffe Lawton – Bray Park Rothwell –
Deception Bay Dakabin – Kallangur – Murrumba Downs
Redcliffe
Bribie Island Rothwell – Deception Bay Albany Creek Central Pine West Griffin – Mango Hill Caboolture East Burpengary – Narangba Central Pine West Strathpine Caboolture Hinterland Dakabin – Kallangur – Murrumba Downs Petrie / Dayboro Caboolture Midwest Hills District / Samford
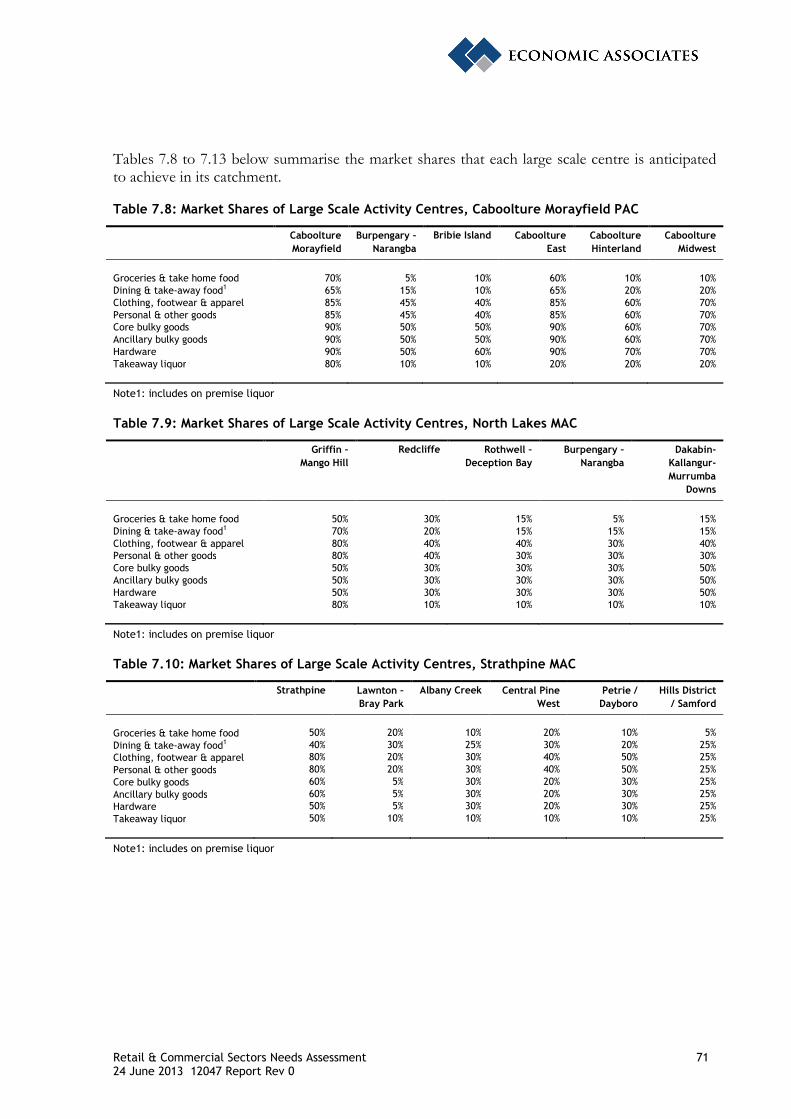
Retail & Commercial Sectors Needs Assessment 71 24 June 2013 12047 Report Rev 0
Tables 7.8 to 7.13 below summarise the market shares that each large scale centre is anticipated to achieve in its catchment.
Table 7.8: Market Shares of Large Scale Activity Centres, Caboolture Morayfield PAC
Caboolture
Morayfield
Burpengary –
Narangba
Bribie Island Caboolture
East
Caboolture
Hinterland
Caboolture
Midwest
Groceries & take home food 70% 5% 10% 60% 10% 10% Dining & take-away food1 65% 15% 10% 65% 20% 20% Clothing, footwear & apparel 85% 45% 40% 85% 60% 70% Personal & other goods 85% 45% 40% 85% 60% 70% Core bulky goods 90% 50% 50% 90% 60% 70% Ancillary bulky goods 90% 50% 50% 90% 60% 70% Hardware 90% 50% 60% 90% 70% 70% Takeaway liquor 80% 10% 10% 20% 20% 20%
Note1: includes on premise liquor
Table 7.9: Market Shares of Large Scale Activity Centres, North Lakes MAC
Griffin –
Mango Hill
Redcliffe Rothwell –
Deception Bay
Burpengary –
Narangba
Dakabin-
Kallangur-
Murrumba
Downs
Groceries & take home food 50% 30% 15% 5% 15% Dining & take-away food1 70% 20% 15% 15% 15% Clothing, footwear & apparel 80% 40% 40% 30% 40% Personal & other goods 80% 40% 30% 30% 30% Core bulky goods 50% 30% 30% 30% 50% Ancillary bulky goods 50% 30% 30% 30% 50% Hardware 50% 30% 30% 30% 50% Takeaway liquor 80% 10% 10% 10% 10%
Note1: includes on premise liquor
Table 7.10: Market Shares of Large Scale Activity Centres, Strathpine MAC
Strathpine Lawnton –
Bray Park
Albany Creek Central Pine
West
Petrie /
Dayboro
Hills District
/ Samford
Groceries & take home food 50% 20% 10% 20% 10% 5%
Dining & take-away food1 40% 30% 25% 30% 20% 25%
Clothing, footwear & apparel 80% 20% 30% 40% 50% 25%
Personal & other goods 80% 20% 30% 40% 50% 25%
Core bulky goods 60% 5% 30% 20% 30% 25%
Ancillary bulky goods 60% 5% 30% 20% 30% 25%
Hardware 50% 5% 30% 20% 30% 25%
Takeaway liquor 50% 10% 10% 10% 10% 25%
Note1: includes on premise liquor

Retail & Commercial Sectors Needs Assessment 72 24 June 2013 12047 Report Rev 0
Table 7.11: Market Shares of Large Scale Activity Centres, Redcliffe – Kippa Ring MAC
Redcliffe Rothwell –
Deception Bay
Groceries & take home food 45% 15% Dining & take-away food1 55% 65% Clothing, footwear & apparel 45% 30% Personal & other goods 45% 20% Core bulky goods 35% 10% Ancillary bulky goods 35% 10% Hardware 20% 20% Takeaway liquor 70% 10%
Note1: includes on premise liquor
Table 7.12: Market Shares of Large Scale Activity Centres, Lawnton Employment Area
Lawnton –
Bray Park
Dakabin-
Kallangur-
Murrumba Downs
Central Pine West Strathpine
Groceries & take home food 50% - - - Dining & take-away food1 60% - - - Clothing, footwear & apparel 60% - - - Personal & other goods 60% - - - Core bulky goods 80% 30% 30% 30% Ancillary bulky goods 80% 30% 30% 30% Hardware 80% 30% 30% 30% Takeaway liquor 70% - - -
Note1: includes on premise liquor Note: Lawnton Employment Area has high provision of bulky goods floor space and is anticipated to capture market shares only within the bulky goods and hardware categories.
Table 7.13: Market Shares of Large Scale Activity Centres, Rothwell – Deception Bay Catchment
Lawnton –
Bray Park
Redcliffe Griffin –
Mango Hill
Groceries & take home food 70% - - Dining & take-away food1 20% - - Clothing, footwear & apparel 30% - - Personal & other goods 50% - - Core bulky goods 60% 20% 40% Ancillary bulky goods 60% 20% 40% Hardware 50% 20% 40% Takeaway liquor 80% - -
Note1: includes on premise liquor Note: Rothwell – Deception Bay has a high provision of bulky goods floor space and is anticipated to capture shares only within the bulky goods and hardware categories.
7.8 Large Scale Activity Centres Supply Demand Balance
7.8.1 Caboolture Morayfield PAC
Table 7.14 below shows the supply of retail floor space within Caboolture – Morayfield PAC as identified in Section 5 of this report and the projected demand of retail floor space within Caboolture – Morayfield PAC.

Retail & Commercial Sectors Needs Assessment 73 24 June 2013 12047 Report Rev 0
Demand for retail floor space in the Caboolture – Morayfield PAC is projected to increase from 160,321m2 in 2012 to 259,967m2 in 2031, or by approximately 2.6% per annum.
There is currently (2012) an oversupply of retail floor space within the Caboolture – Morayfield PAC particularly in non-food retail tenancies (including take home liquor). By 2016, retail floor space across all categories will be undersupplied by a total of 8,809m2.
By 2031, there is projected to be significant demand for additional retail floor space within the Caboolture – Morayfield PAC in the order of:
• 14,838m2 of additional groceries tenancies;
• 57,091m2 of additional non-food (including take home liquor) tenancies; and
• 23,065m2 of additional take-away and dining tenancies.
Table 7.14: Supply Demand Balance, Caboolture – Morayfield PAC, 2012-2031 (sqm)
Supply Demand Balance
2012 2012 2016 2021 2026 2031 2012 2016 2021 2026 2031
Caboolture Morayfield PAC
Groceries 23,367 23,868 27,879 31,494 34,077 38,205 -501 -4,512 -8,126 -10,709 -14,838 Non-Food1 135,520 118,423 135,785 154,385 170,432 192,610 17,096 -266 -18,866 -34,912 -57,091 Take-away and dining 6,087 18,029 20,909 23,701 25,885 29,152 -11,942 -14,822 -17,614 -19,797 -23,065 Vacant 10,790 - - - - - - - - - - Total 175,764 160,321 184,573 209,580 230,393 259,967 15,443 -8,809 -33,816 -54,629 -84,204
Note: a negative balance indicates an undersupply of floor space Note1: includes take home liquor
7.8.2 North Lakes MAC
Demand for retail floor space in the North Lakes MAC is projected to increase from 107,745m2 in 2012 to 190,051m2 in 2031, or by approximately 3.0% per annum.
There is estimated to be an undersupply of retail provision in North Lakes MAC, increasing from 20,617m2 in 2012 to 102,923m2 in 2031. All categories of floor space will be undersupplied by 2031 with the largest deficiency of 75,725m2 being in non-food (including take home liquor) (72,725m2).
Table 7.15: Supply Demand Balance, North Lakes MAC, 2012-2031 (sqm)
Supply Demand Balance
2012 2012 2016 2021 2026 2031 2012 2016 2021 2026 2031
North Lakes MAC Groceries 10,247 17,230 20,500 23,874 27,250 29,341 -6,983 -10,254 -13,627 -17,003 -19,094 Non-Food1 62,441 77,113 91,884 107,942 124,079 135,166 -14,673 -29,444 -45,501 -61,638 -72,725 Take-away and dining 8,835 13,402 16,602 19,890 23,380 25,545 -4,568 -7,768 -11,055 -14,545 -16,710 Vacant 5,606 - - - - - - - - - - Total 87,128 107,745 128,987 151,705 174,708 190,051 -20,617 -41,859 -64,577 -87,580 -102,923
Note: a negative balance indicates an undersupply of floor space Note1: includes take home liquor

Retail & Commercial Sectors Needs Assessment 74 24 June 2013 12047 Report Rev 0
7.8.3 Strathpine MAC
Demand for retail floor space in the Strathpine MAC is projected to increase from 74,691m2 in 2012 to 104,392m2 in 2031, or by approximately 1.8% per annum (Table 7.16).
From 2016, there is estimated to be an undersupply of retail provision in Strathpine MAC, increasing from 4,482m2 to 26,694m2 in 2031. The estimated undersupply of retail floor space in Strathpine MAC in 2031 is driven by an undersupply of non-food (including take home liquor) floor space (20,038m2) and to a lesser extent an undersupply of take-away and dining floor space (8,911m2).
There is anticipated to be an oversupply of grocery floor space to 2021 and only limited demand for additional grocery floor space post 2021.
Table 7.16: Supply Demand Balance, Strathpine MAC, 2012-2031 (sqm)
Supply Demand Balance
2012 2012 2016 2021 2026 2031 2012 2016 2021 2026 2031
Strathpine MRAC Groceries 13,194 10,188 11,262 12,496 13,575 14,449 3,006 1,932 698 -381 -1,255 Non-Food1 52,608 52,216 57,383 63,308 68,481 72,646 392 -4,775 -10,700 -15,873 -20,038 Take-away and dining 8,386 12,287 13,536 14,940 16,208 17,297 -3,901 -5,150 -6,554 -7,822 -8,911 Vacant 3,511 Total 77,699 74,691 82,181 90,743 98,263 104,392 3,008 -4,482 -13,044 -20,565 -26,694
Note: a negative balance indicates an undersupply of floor space Note1: includes take home liquor
7.8.4 Redcliffe – Kippa Ring MAC
In the Redcliffe – Kippa Ring MAC, demand for retail floor space is projected to increase from 63,224m2 in 2012 to 82,144m2 in 2031, or by approximately 1.4% per annum.
A current oversupply of 12,272m2 including vacancies (6,097m2) is expected to shift to an undersupply of 2,344m2 by 2026, with the largest undersupply being in non-food (including take home liquor).
Table 7.17: Supply Demand Balance, Redcliffe – Kippa Ring MAC, 2012-2031 (sqm)
Supply Demand Balance
2012 2012 2016 2021 2026 2031 2012 2016 2021 2026 2031
Redcliffe – Kippa Ring MAC
Groceries 15,100 13,542 14,428 15,583 16,581 17,501 1,557 672 -484 -1,481 -2,402 Non-Food1 36,708 33,440 35,700 38,587 41,037 43,311 3,268 1,007 -1,879 -4,330 -6,604 Take-away and dining 17,593 16,242 17,569 19,074 20,223 21,332 1,350 24 -1,481 -2,630 -3,739 Vacant 6,097 - - - - - Total 75,497 63,224 67,697 73,244 77,841 82,144 12,272 7,800 2,253 -2,344 -6,647
Note: a negative balance indicates an undersupply of floor space Note1: includes take home liquor

Retail & Commercial Sectors Needs Assessment 75 24 June 2013 12047 Report Rev 0
7.8.5 Lawnton Employment Area
Retail floor space demand in the Lawnton Employment Area is projected to increase from 34,603m2 in 2012 to 48,827m2 in 2031, or by approximately 1.8% per annum.
A current oversupply of retail floor space in Lawnton Employment Area is expected to persist out to 2031 but to decline significantly from its current 19,174m2 to 4,950m2 by 2031.
Oversupply is expected in all categories but predominantly in non-food (including take home liquor).
Table 7.18: Supply Demand Balance, Lawnton Employment Area, 2012-2031 (sqm)
Supply Demand Balance
2012 2012 2016 2021 2026 2031 2012 2016 2021 2026 2031
Lawnton Employment Area
Groceries 5,216 3,359 3,629 3,863 4,052 4,335 1,857 1,587 1,353 1,164 881 Non-Food1 41,071 28,188 31,580 35,167 38,024 40,550 12,883 9,491 5,904 3,047 521 Take-away and dining 4,132 3,055 3,301 3,513 3,685 3,942 1,077 831 619 447 190 Vacant 3,358 - - - - - - - - - - Total 53,777 34,603 38,510 42,542 45,761 48,827 19,174 15,267 11,235 8,016 4,950
Note: a negative balance indicates an undersupply of floor space Note1: includes take home liquor
7.8.6 Rothwell – Deception Bay Catchment
There is extensive provision of bulky goods and hardware floor space within the Rothwell – Deception Bay catchment and as such the catchment has been assessed separately here.
The catchment is currently oversupplied in all floor space categories by 27,053m2, more than half of which is in the non-food (including take home liquor) category. Demand-supply balance is expected to emerge around 2026 in groceries and non-food (including take home liquor) but take-away and dining is anticipated to remain oversupplied out to 2031.
Table 7.19: Supply Demand Balance, Rothwell – Deception Bay, 2012-2031 (sqm)
Supply Demand Balance
2012 2012 2016 2021 2026 2031 2012 2016 2021 2026 2031
Rothwell – Deception Bay Catchment
Groceries 12,498 9,203 10,368 11,407 11,984 12,620 3,295 2,130 1,092 515 -122 Non-Food1 45,765 31,468 36,903 42,060 46,590 49,731 14,297 8,862 3,705 -825 -3,966 Take-away and dining 5,544 1,864 2,100 2,310 2,427 2,556 3,681 3,445 3,235 3,118 2,989 Vacant 5,780 - - - - - - - - - - Total 69,588 42,535 49,370 55,777 61,000 64,906 27,053 20,218 13,811 8,588 4,682
Note: a negative balance indicates an undersupply of floor space Note1: includes take home liquor
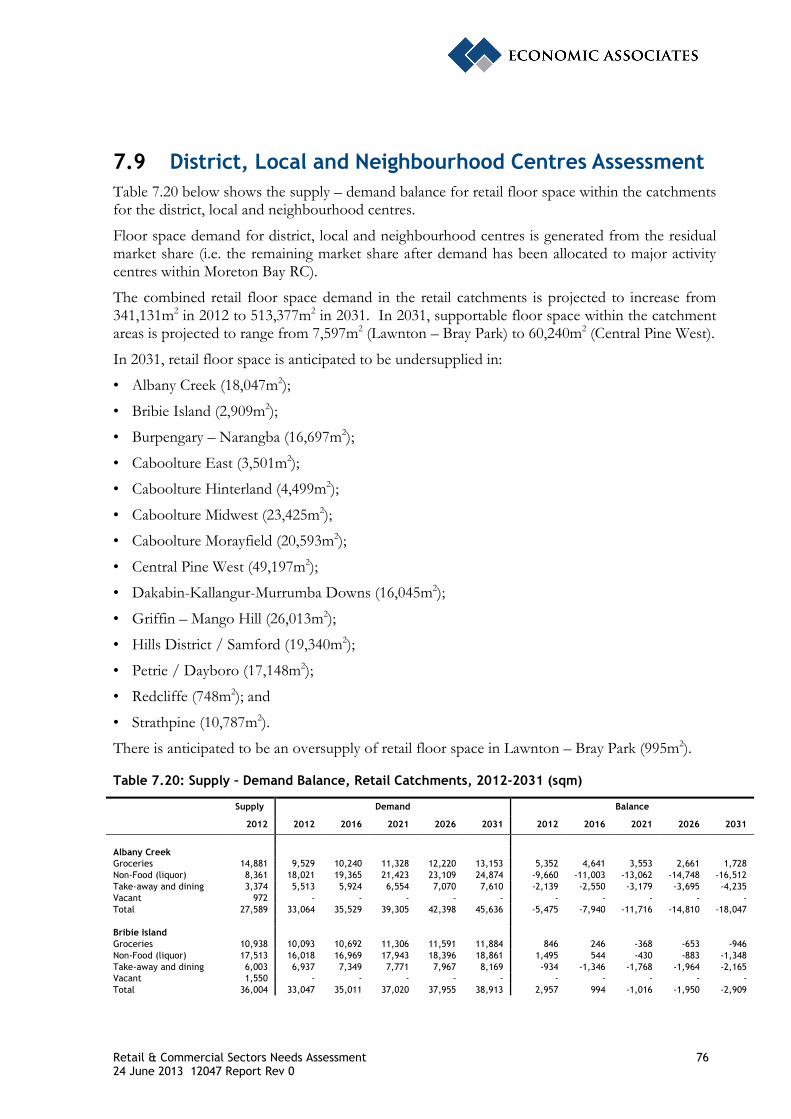
Retail & Commercial Sectors Needs Assessment 76 24 June 2013 12047 Report Rev 0
7.9 District, Local and Neighbourhood Centres Assessment
Table 7.20 below shows the supply – demand balance for retail floor space within the catchments for the district, local and neighbourhood centres.
Floor space demand for district, local and neighbourhood centres is generated from the residual market share (i.e. the remaining market share after demand has been allocated to major activity centres within Moreton Bay RC).
The combined retail floor space demand in the retail catchments is projected to increase from 341,131m2 in 2012 to 513,377m2 in 2031. In 2031, supportable floor space within the catchment areas is projected to range from 7,597m2 (Lawnton – Bray Park) to 60,240m2 (Central Pine West).
In 2031, retail floor space is anticipated to be undersupplied in:
• Albany Creek (18,047m2);
• Bribie Island (2,909m2);
• Burpengary – Narangba (16,697m2);
• Caboolture East (3,501m2);
• Caboolture Hinterland (4,499m2);
• Caboolture Midwest (23,425m2);
• Caboolture Morayfield (20,593m2);
• Central Pine West (49,197m2);
• Dakabin-Kallangur-Murrumba Downs (16,045m2);
• Griffin – Mango Hill (26,013m2);
• Hills District / Samford (19,340m2);
• Petrie / Dayboro (17,148m2);
• Redcliffe (748m2); and
• Strathpine (10,787m2).
There is anticipated to be an oversupply of retail floor space in Lawnton – Bray Park (995m2).
Table 7.20: Supply – Demand Balance, Retail Catchments, 2012-2031 (sqm)
Supply Demand Balance
2012 2012 2016 2021 2026 2031 2012 2016 2021 2026 2031
Albany Creek Groceries 14,881 9,529 10,240 11,328 12,220 13,153 5,352 4,641 3,553 2,661 1,728 Non-Food (liquor) 8,361 18,021 19,365 21,423 23,109 24,874 -9,660 -11,003 -13,062 -14,748 -16,512 Take-away and dining 3,374 5,513 5,924 6,554 7,070 7,610 -2,139 -2,550 -3,179 -3,695 -4,235 Vacant 972 - - - - - - - - - - Total 27,589 33,064 35,529 39,305 42,398 45,636 -5,475 -7,940 -11,716 -14,810 -18,047 Bribie Island Groceries 10,938 10,093 10,692 11,306 11,591 11,884 846 246 -368 -653 -946 Non-Food (liquor) 17,513 16,018 16,969 17,943 18,396 18,861 1,495 544 -430 -883 -1,348 Take-away and dining 6,003 6,937 7,349 7,771 7,967 8,169 -934 -1,346 -1,768 -1,964 -2,165 Vacant 1,550 - - - - - - - - - - Total 36,004 33,047 35,011 37,020 37,955 38,913 2,957 994 -1,016 -1,950 -2,909

Retail & Commercial Sectors Needs Assessment 77 24 June 2013 12047 Report Rev 0
Supply Demand Balance
2012 2012 2016 2021 2026 2031 2012 2016 2021 2026 2031
Burpengary - Narangba Groceries 12,823 9,389 10,311 12,615 15,954 19,733 3,434 2,513 208 -3,130 -6,910 Non-Food (liquor) 11,972 8,040 8,830 10,803 13,662 16,898 3,932 3,143 1,170 -1,689 -4,926 Take-away and dining 3,178 5,738 6,301 7,709 9,749 12,059 -2,560 -3,123 -4,531 -6,571 -8,881 Vacant 4,019 - - - - - - - - - - Total 31,993 23,168 25,441 31,127 39,365 48,691 8,825 6,552 867 -7,372 -16,697 Caboolture East Groceries 2,552 3,175 3,326 3,525 3,627 3,730 -623 -774 -973 -1,075 -1,178 Non-Food (liquor) 3,063 3,491 3,658 3,876 3,989 4,102 -429 -595 -814 -926 -1,039 Take-away and dining 1,011 1,953 2,046 2,168 2,231 2,294 -942 -1,035 -1,158 -1,221 -1,284 Vacant 0 - - - - - - - - - - Total 6,625 8,619 9,029 9,569 9,847 10,125 -1,994 -2,404 -2,945 -3,222 -3,501 Caboolture Hinterland Groceries 5,376 3,320 3,855 4,480 5,062 5,817 2,056 1,521 896 314 -441 Non-Food (liquor) 3,332 4,278 4,968 5,773 6,523 7,496 -946 -1,636 -2,441 -3,191 -4,164 Take-away and dining 3,467 2,166 2,515 2,923 3,302 3,795 1,301 952 544 165 -328 Vacant 434 - - - - - - - - - - Total 12,609 9,763 11,339 13,176 14,886 17,108 2,846 1,270 -567 -2,277 -4,499 Caboolture Midwest Groceries 679 5,615 6,313 7,292 8,222 9,213 -4,936 -5,634 -6,613 -7,543 -8,534 Non-Food (liquor) 828 6,295 7,078 8,175 9,218 10,329 -5,467 -6,250 -7,347 -8,390 -9,501 Take-away and dining 544 3,927 4,415 5,100 5,751 6,444 -3,383 -3,871 -4,556 -5,207 -5,900 Vacant 510 - - - - - - - - - - Total 2,561 15,837 17,806 20,567 23,191 25,986 -13,276 -15,245 -18,006 -20,630 -23,425 Caboolture Morayfield Groceries 7,879 7,059 8,571 9,832 10,708 12,225 821 -692 -1,953 -2,829 -4,345 Non-Food (liquor) 3,765 8,048 9,773 11,211 12,210 13,938 -4,284 -6,008 -7,446 -8,445 -10,174 Take-away and dining 3,612 5,858 7,113 8,159 8,886 10,145 -2,246 -3,501 -4,547 -5,274 -6,532 Vacant 458 - - - - - - - - - - Total 15,714 20,965 25,457 29,202 31,804 36,308 -5,251 -9,743 -13,488 -16,090 -20,593 Central Pine West Groceries 4,900 8,588 10,075 11,979 13,902 15,365 -3,689 -5,176 -7,079 -9,002 -10,465 Non-Food (liquor) 2,565 18,801 22,056 26,222 30,432 33,634 -16,236 -19,491 -23,658 -27,868 -31,070 Take-away and dining 3,439 6,283 7,371 8,764 10,171 11,241 -2,845 -3,932 -5,325 -6,732 -7,802 Vacant 139 - - - - - - - - - - Total 11,042 33,672 39,502 46,965 54,505 60,240 -22,630 -28,460 -35,923 -43,463 -49,197 Dakabin-Kallangur-Murrumba Downs
Groceries 13,754 11,238 13,288 15,461 16,701 17,285 2,516 465 -1,708 -2,947 -3,531 Non-Food (liquor) 15,861 16,047 18,975 22,078 23,847 24,682 -186 -3,114 -6,216 -7,986 -8,820 Take-away and dining 6,574 8,247 9,752 11,347 12,257 12,685 -1,673 -3,178 -4,773 -5,682 -6,111 Vacant 2,418 - - - - - - - - - - Total 38,607 35,532 42,016 48,886 52,805 54,652 3,075 -3,409 -10,279 -14,198 -16,045 Griffin-Mango Hill Groceries 2,764 5,039 7,224 9,241 11,506 12,625 -2,275 -4,460 -6,477 -8,742 -9,861 Non-Food (liquor) 805 4,536 6,502 8,318 10,357 11,365 -3,731 -5,697 -7,513 -9,552 -10,560 Take-away and dining 377 2,407 3,450 4,413 5,495 6,029 -2,030 -3,073 -4,036 -5,118 -5,652 Vacant 60 - - - - - - - - - - Total 4,006 11,982 17,175 21,972 27,359 30,019 -7,976 -13,169 -17,966 -23,353 -26,013 Hills District/Samford Groceries 7,939 13,862 14,942 15,584 16,289 17,068 -5,922 -7,002 -7,644 -8,350 -9,128 Non-Food (liquor) 21,534 26,089 28,121 29,330 30,657 32,123 -4,555 -6,587 -7,796 -9,123 -10,588 Take-away and dining 7,538 7,511 8,096 8,444 8,826 9,248 27 -558 -906 -1,288 -1,710 Vacant 2,087 - - - - - - - - - - Total 39,098 47,461 51,159 53,357 55,772 58,438 -8,363 -12,061 -14,259 -16,674 -19,340 Lawnton - Bray Park Groceries 4,093 2,016 2,178 2,318 2,431 2,601 2,077 1,915 1,775 1,662 1,492 Non-Food (liquor) 3,050 3,363 3,633 3,867 4,056 4,339 -313 -584 -817 -1,006 -1,290 Take-away and dining 554 509 550 585 614 657 45 4 -31 -60 -103 Vacant 896 - - - - - - - - - -
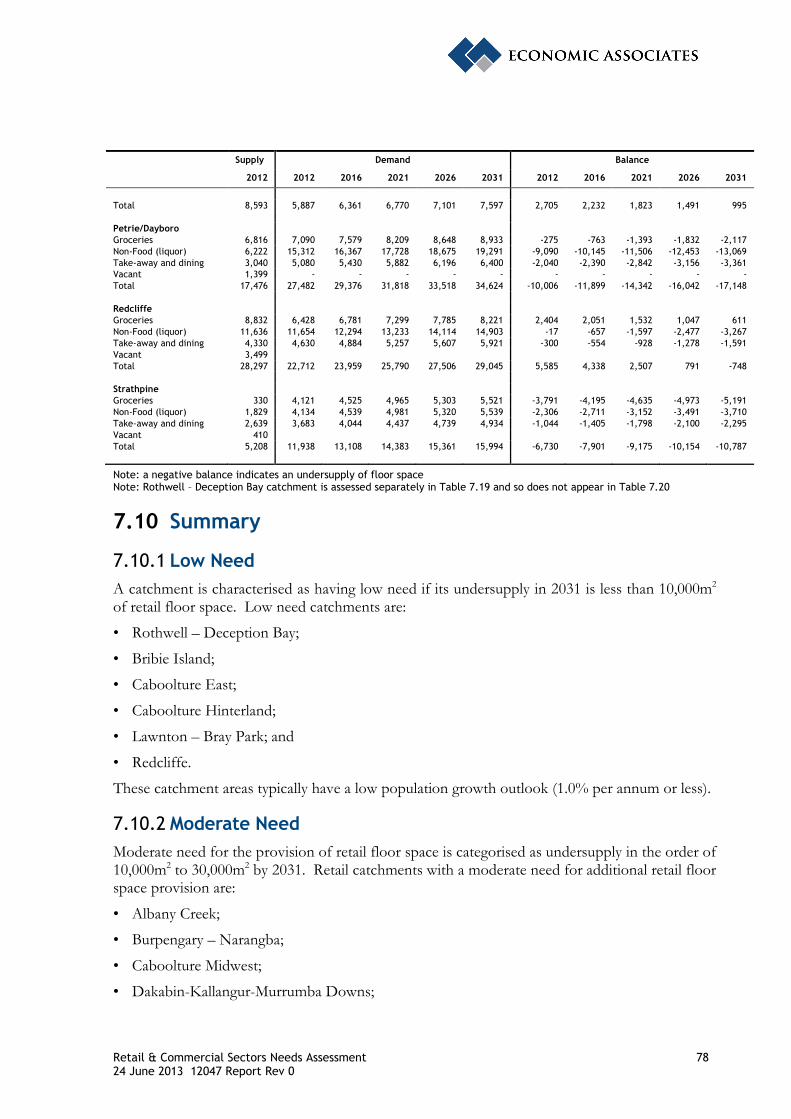
Retail & Commercial Sectors Needs Assessment 78 24 June 2013 12047 Report Rev 0
Supply Demand Balance
2012 2012 2016 2021 2026 2031 2012 2016 2021 2026 2031
Total 8,593 5,887 6,361 6,770 7,101 7,597 2,705 2,232 1,823 1,491 995 Petrie/Dayboro Groceries 6,816 7,090 7,579 8,209 8,648 8,933 -275 -763 -1,393 -1,832 -2,117 Non-Food (liquor) 6,222 15,312 16,367 17,728 18,675 19,291 -9,090 -10,145 -11,506 -12,453 -13,069 Take-away and dining 3,040 5,080 5,430 5,882 6,196 6,400 -2,040 -2,390 -2,842 -3,156 -3,361 Vacant 1,399 - - - - - - - - - - Total 17,476 27,482 29,376 31,818 33,518 34,624 -10,006 -11,899 -14,342 -16,042 -17,148 Redcliffe Groceries 8,832 6,428 6,781 7,299 7,785 8,221 2,404 2,051 1,532 1,047 611 Non-Food (liquor) 11,636 11,654 12,294 13,233 14,114 14,903 -17 -657 -1,597 -2,477 -3,267 Take-away and dining 4,330 4,630 4,884 5,257 5,607 5,921 -300 -554 -928 -1,278 -1,591 Vacant 3,499 Total 28,297 22,712 23,959 25,790 27,506 29,045 5,585 4,338 2,507 791 -748 Strathpine Groceries 330 4,121 4,525 4,965 5,303 5,521 -3,791 -4,195 -4,635 -4,973 -5,191 Non-Food (liquor) 1,829 4,134 4,539 4,981 5,320 5,539 -2,306 -2,711 -3,152 -3,491 -3,710 Take-away and dining 2,639 3,683 4,044 4,437 4,739 4,934 -1,044 -1,405 -1,798 -2,100 -2,295 Vacant 410 Total 5,208 11,938 13,108 14,383 15,361 15,994 -6,730 -7,901 -9,175 -10,154 -10,787
Note: a negative balance indicates an undersupply of floor space Note: Rothwell – Deception Bay catchment is assessed separately in Table 7.19 and so does not appear in Table 7.20
7.10 Summary
7.10.1 Low Need
A catchment is characterised as having low need if its undersupply in 2031 is less than 10,000m2 of retail floor space. Low need catchments are:
• Rothwell – Deception Bay;
• Bribie Island;
• Caboolture East;
• Caboolture Hinterland;
• Lawnton – Bray Park; and
• Redcliffe.
These catchment areas typically have a low population growth outlook (1.0% per annum or less).
7.10.2 Moderate Need
Moderate need for the provision of retail floor space is categorised as undersupply in the order of 10,000m2 to 30,000m2 by 2031. Retail catchments with a moderate need for additional retail floor space provision are:
• Albany Creek;
• Burpengary – Narangba;
• Caboolture Midwest;
• Dakabin-Kallangur-Murrumba Downs;

Retail & Commercial Sectors Needs Assessment 79 24 June 2013 12047 Report Rev 0
• Hills District / Samford; and
• Petrie / Dayboro.
With the exceptions of the Burpengary – Narangba and Dakabin-Kallangur-Murrumba Downs catchments, these catchments are estimated to have a current (2012) undersupply of floor space.
7.10.3 High Need
High need for retail floor space is categorised as an undersupply in excess of 30,000m2 by 2031. Retail catchments with high demand for additional retail floor space are:
• Caboolture - Morayfield;
• Griffin – Mango Hill;
• Strathpine; and
• Central Pine West.

Retail & Commercial Sectors Needs Assessment 80 24 June 2013 12047 Report Rev 0
8 PROJECTED COMMERCIAL FLOOR SPACE DEMAND
8.1 Methodology
Figure 8.1 below outlines the methodology used to prepare commercial office floor space projections for each of the defined catchments within Moreton Bay Regional Council.
Figure 8.1: Methodology for Preparing Commercial Office Demand Projections
Employment of resident
population by industry
Employment of working
population by industry
Employment retention by industry
Labour force participation
rate
Unemployment rate
Net available workforce rate
Commercial office sector share of
employment
Working age population projections
Employment in commercial office sectors
Businesses requiring
commercial office space
Employment in commercial office space
Employment density
(sqm per worker)
Commercial office floor space
demand
Retail & Commercial Sectors Needs Assessment 81 24 June 2013 12047 Report Rev 0
8.2 Assumptions
8.2.1 Employment in Industries Requiring Commercial Office Space
The key industry sectors requiring commercial office space are:
• Financial and insurance services
– Finance;
– Insurance and superannuation funds;
– Auxiliary finance and insurance services;
– Finance and insurance services, nfd4;
• Professional, scientific and technical services
– Professional, scientific and technical services (except computer services design and related services);
– Professional, scientific and technical services, nfd;
– Computer system design and related services;
• Health care and social assistance
– Medical and other health care services;
• Rental, hiring and real estate services
– Property operators and real estate services;
• Public administration and safety
– Public administration;
• Information media and telecommunications
– Internet publishing and broadcasting;
– Internet service providers, web search portals and data processing services; and
• Administrative and support services
– Administrative services.
8.2.2 Working Age Population
Within the sixteen catchments of Moreton Bay Regional Council, the working age population is projected to grow at an average annual rate of 0.2% per annum and 4.2% per annum between 2012 and 2031.
The catchments projected to have the highest average annual growth rate are:
• Griffin- Mango Hill – 4.2% per annum between 2012 and 2031;
• Burpengary – Narangba – 3.3% per annum between 2012 and 2031;
4 nfd – not further defined

Retail & Commercial Sectors Needs Assessment 82 24 June 2013 12047 Report Rev 0
• Caboolture – Morayfield – 2.3% per annum between 2012 and 2031.
The projected working age population within each of the catchments in Moreton Bay Regional Council between 2011 and 2031 is summarised in Table 8.1.
Table 8.1: Projected Size of Working Age Population by Catchment, Moreton Bay Regional Council, 2011-2031
2011 2012 2016 2021 2026 2031 Ave. Ann. Growth, 2012-31
Hills District / Samford 21,550 21,838 23,028 23,104 23,340 23,798 0.5% Albany Creek 15,777 15,961 16,718 17,883 18,635 19,466 1.1% Strathpine 13,742 14,011 15,140 16,074 16,602 16,702 0.9% Petrie / Dayboro 12,606 12,707 13,122 13,433 13,586 13,680 0.4% Central Pine West 16,047 16,526 18,586 21,329 23,689 25,342 2.3% Lawnton - Bray Park 10,644 10,787 11,380 11,781 12,053 12,558 0.8% Griffin – Mango Hill 13,864 15,109 21,311 26,167 31,514 33,066 4.2% Redcliffe 30,726 30,972 31,975 33,032 33,758 34,583 0.6% Rothwell - Deception Bay 18,601 19,063 21,029 22,351 22,409 22,883 1.0% Bribie Island 9,067 9,166 9,573 9,950 10,018 10,062 0.5% Caboolture – Morayfield 32,933 34,448 41,239 45,647 47,692 53,319 2.3% Caboolture East 9,932 9,999 10,269 10,550 10,494 10,481 0.2% Burpengary - Narangba 18,294 18,583 19,790 23,342 28,644 34,736 3.3% Caboolture Midwest 10,307 10,553 11,597 12,937 14,200 15,547 2.1% Caboolture Hinterland 5,771 5,941 6,670 7,437 8,093 9,005 2.2% Dakabin - Kallangur - Murrumba Downs 19,332 20,132 23,674 26,732 28,193 28,380 1.8%
Source: Australian Bureau of Statistics (2012a) and Economic Associates estimates
8.2.3 Labour Market Characteristics
Unemployment rates at the 2011 Census varied between 3.6% (Central Pine West) and 9.4% (Caboolture – Morayfield). Labour force participation rates within the catchments varied between 59.8% (Caboolture Hinterland) and 81.9% (Central Pine West).
For the purpose of this analysis, it has been assumed that unemployment rates and labour force participation rates remain constant throughout the projection period within each catchment.
Assumed unemployment rates and labour force participation rates between 2011 and 2031 are shown in Table 8.2.
Table 8.2: Projected Labour Market Characteristics (15-64 population) by Catchment, Moreton Bay Regional Council, 2011 to 2031
Unemployment Rate Labour Force Participation Rate
Hills District / Samford 4.1% 79.4% Albany Creek 3.8% 80.8% Strathpine 5.7% 77.0% Petrie / Dayboro 4.9% 77.6% Central Pine West 3.6% 81.9% Lawnton - Bray Park 6.4% 75.7% Griffin – Mango Hill 4.9% 80.7% Redcliffe 7.2% 70.7% Rothwell - Deception Bay 8.4% 67.7% Bribie Island 8.5% 61.4%

Retail & Commercial Sectors Needs Assessment 83 24 June 2013 12047 Report Rev 0
Unemployment Rate Labour Force Participation Rate
Caboolture – Morayfield 9.4% 67.5% Caboolture East 8.7% 64.8% Burpengary - Narangba 5.7% 77.5% Caboolture Midwest 5.5% 75.2% Caboolture Hinterland 5.2% 59.8% Dakabin - Kallangur - Murrumba Downs 5.7% 76.6%
Source: Australian Bureau of Statistics (2012a) and Economic Associates estimates
8.2.4 Employment by Industry
The incidence of resident employment in commercial office sectors was highest in Hills District / Samford and Albany Creek as at 2011. It is likely that a significant proportion of residents from these catchments pursue commercial office employment opportunities within the Brisbane City Council area.
The four major commercial office precincts within Moreton Bay Regional Council are contained within the Strathpine, Griffin – Mango Hill, Redcliffe and Caboolture – Morayfield catchments. The incidence of employment within commercial office sectors in these catchments is likely to increase in the 2011 to 2031 period, as an increasing range of commercial opportunities are established within these precincts.
The analysis assumes that the incidence of employment within commercial office sectors in all other catchments remains relatively stable throughout the projection period.
Table 8.3 below summarises the projected employment within commercial office sectors between 2011 and 2031.
Table 8.3: Projected Employment within Commercial Office Sectors by Catchment, Moreton Bay Regional Council, 2011-2031
2011 2012 2016 2021 2026 2031
Hills District / Samford 26.9% 26.9% 26.9% 26.9% 26.9% 26.9% Albany Creek 25.0% 25.0% 25.0% 25.0% 25.0% 25.0% Strathpine 19.0% 19.0% 19.3% 19.7% 20.1% 20.4% Petrie / Dayboro 20.7% 20.7% 20.7% 20.7% 20.7% 20.7% Central Pine West 21.7% 21.7% 21.7% 21.7% 21.7% 21.7% Lawnton - Bray Park 18.3% 18.3% 18.3% 18.3% 18.3% 18.3% Griffin – Mango Hill 21.1% 21.2% 21.5% 21.9% 22.3% 22.7% Redcliffe 17.4% 17.5% 17.7% 18.1% 18.4% 18.7% Rothwell - Deception Bay 13.0% 13.0% 13.0% 13.0% 13.0% 13.0% Bribie Island 17.3% 17.3% 17.3% 17.3% 17.3% 17.3% Caboolture - Morayfield 13.4% 13.5% 13.7% 14.0% 14.2% 14.4% Caboolture East 13.9% 13.9% 13.9% 13.9% 13.9% 13.9% Burpengary - Narangba 16.6% 16.6% 16.6% 16.6% 16.6% 16.6% Caboolture Midwest 14.8% 14.8% 14.8% 14.8% 14.8% 14.8% Caboolture Hinterland 13.2% 13.2% 13.2% 13.2% 13.2% 13.2% Dakabin - Kallangur - Murrumba Downs 17.0% 17.0% 17.0% 17.0% 17.0% 17.0%
Source: Australian Bureau of Statistics (2012a) and Economic Associates estimates

Retail & Commercial Sectors Needs Assessment 84 24 June 2013 12047 Report Rev 0
8.2.5 Employment Retention
Employment retention within commercial office sectors at the 2011 Census ranged between 16.2% (Central Pine West) and 136.4% (Strathpine).
The following assumptions have been made regarding the degree of change to employment retention rates in the catchments of Moreton Bay Regional Council to 2031:
• Strathpine, Redcliffe and Caboolture - Morayfield: These three centres are anticipated to continue to record relatively high employment retention rates within Moreton Bay Regional Council, with retention increasing by 10% between 2011 and 2031;
• Griffin – Mango Hill: As North Lakes evolves and fulfils its role as a higher order centre, it is envisaged that employment retention in commercial office sectors will also increase. The analysis assumes that commercial office sector retention in Griffin – Mango Hill in 2031 will be consistent with that recorded in Redcliffe as of the 2011 Census;
• Central Pine West: As Warner expands and fulfils its role as a district centre, employment retention in commercial office sectors is also expected to increase. The analysis assumes that commercial office sector retention in Central Pine West in 2031 is consistent with that recorded in Dakabin – Kallangur – Murrumba Downs as at the 2011 Census;
• All other catchments: Employment retention in commercial office sectors increases by 5% in all other catchments, as part of Moreton Bay Regional Council’s efforts to improve employment retention throughout Moreton Bay Regional Council.
Table 8.4 below summarises the assumed employment retention within each of the catchments within Moreton Bay Regional Council between 2011 and 2031.
Table 8.4: Projected Employment Retention within Commercial Office Sectors by Catchment, Moreton Bay Regional Council, 2011-2031
2011 2012 2016 2021 2026 2031
Hills District / Samford 24.1% 24.2% 24.4% 24.7% 25.0% 25.3% Albany Creek 26.2% 26.3% 26.6% 26.9% 27.3% 27.5% Strathpine 136.4% 137.1% 140.0% 143.6% 147.2% 150.0% Petrie / Dayboro 33.2% 33.3% 33.6% 34.1% 34.5% 34.8% Central Pine West 16.2% 16.6% 18.1% 19.9% 21.8% 23.3% Lawnton - Bray Park 20.9% 20.9% 21.1% 21.4% 21.7% 21.9% Griffin – Mango Hill 37.7% 39.5% 46.5% 55.3% 64.1% 71.2% Redcliffe 71.2% 71.5% 73.0% 74.9% 76.8% 78.3% Rothwell - Deception Bay 50.8% 50.9% 51.5% 52.1% 52.8% 53.3% Bribie Island 67.6% 67.8% 68.5% 69.4% 70.3% 71.0% Caboolture – Morayfield 92.4% 92.8% 94.8% 97.2% 99.6% 101.6% Caboolture East 22.2% 22.3% 22.5% 22.8% 23.1% 23.3% Burpengary - Narangba 29.5% 29.6% 29.9% 30.3% 30.7% 31.0% Caboolture Midwest 20.3% 20.4% 20.6% 20.9% 21.1% 21.4% Caboolture Hinterland 54.3% 54.5% 55.0% 55.7% 56.5% 57.0% Dakabin - Kallangur - Murrumba Downs 23.3% 23.3% 23.6% 23.9% 24.2% 24.4%
Source: Australian Bureau of Statistics (2012a) and Economic Associates estimates

Retail & Commercial Sectors Needs Assessment 85 24 June 2013 12047 Report Rev 0
8.3 Employment Projections for Commercial Office Space
8.3.1 Employment within Commercial Office Sectors
Based on the assumptions presented in Section 8.2 above, employment within commercial office sectors is estimated to be highest in 2012 in Strathpine, Caboolture – Morayfield and Redcliffe.
By 2031, employment within commercial office sectors is projected to be highest in the Caboolture - Morayfield and Griffin – Mango Hill catchments, at 4,805 persons and 3,998 persons, respectively.
Table 8.5 below summarises projected employment within commercial office sectors in each of the catchments in Moreton Bay Regional Council between 2012 and 2031.
Table 8.5: Projected Employment within Commercial Office Sectors by Catchment, Moreton Bay Regional Council, 2012-2031
2012 2016 2021 2026 2031
Hills District / Samford 1,079 1,150 1,169 1,196 1,232 Albany Creek 814 862 934 986 1,040 Strathpine 2,662 2,983 3,311 3,572 3,718 Petrie / Dayboro 645 673 698 715 727 Central Pine West 472 586 751 923 1,063 Lawnton - Bray Park 293 313 328 340 358 Griffin – Mango Hill 980 1,635 2,408 3,399 3,998 Redcliffe 2,528 2,706 2,923 3,120 3,307 Rothwell - Deception Bay 775 864 930 944 974 Bribie Island 602 635 669 682 692 Caboolture - Morayfield 2,650 3,289 3,807 4,154 4,805 Caboolture East 187 194 202 204 205 Burpengary - Narangba 662 713 852 1,058 1,297 Caboolture Midwest 227 252 284 316 349 Caboolture Hinterland 244 277 313 345 387 Dakabin - Kallangur - Murrumba Downs 583 692 792 846 860
Source: Economic Associates estimates
8.3.2 Employment within Commercial Office Space
Employment includes jobs in sole trader businesses as well as employing businesses. The Australian Bureau of Statistics information regarding the incidence of employment in sole trader businesses and employing businesses by industry at the SA2 level has been applied to the commercial office employment analysis.
As of June 2011, an estimated 27% (Caboolture Hinterland) to 93% (Strathpine) of employment within commercial office sectors was within employing businesses in Moreton Bay Regional Council. The analysis assumes that the proportion of commercial office sector employment within employing businesses remains constant throughout the projection period.
Table 8.6 below summarises the proportion of commercial office sector employment within employing businesses by catchment.

Retail & Commercial Sectors Needs Assessment 86 24 June 2013 12047 Report Rev 0
Table 8.6: Proportion of Commercial Office Sector Employment within Employing Businesses by Catchment, Moreton Bay Regional Council, 2011-2031
Financial & Insurance
Services
Professional, Scientific &
Technical Services
Health Care & Social
Assistance
Rental, Hiring & Real
Estate Services
Public Administration &
Safety
Inform
ation Media &
Telecommunications
Administrative & Support
Services
Commercial Office Sectors
Hills District / Samford 45% 80% 90% 20% 100% 65% 95% 74% Albany Creek 50% 80% 95% 80% 70% 85% 95% 79% Strathpine 85% 95% 95% 80% 100% 100% 90% 93% Petrie / Dayboro 35% 80% 90% 80% 0% 0% 65% 58% Central Pine West 55% 60% 65% 75% 0% 85% 90% 64% Lawnton - Bray Park 75% 60% 95% 90% 100% 0% 55% 71% Griffin – Mango Hill 40% 80% 70% 80% 85% 80% 90% 67% Redcliffe 45% 80% 90% 65% 0% 0% 70% 62% Rothwell - Deception Bay 90% 50% 95% 10% 100% 35% 95% 78% Bribie Island 60% 75% 100% 85% 85% 0% 95% 84% Caboolture Morayfield 60% 85% 95% 80% 95% 0% 95% 88% Caboolture East 20% 65% 80% 50% 0% 0% 90% 60% Burpengary - Narangba 60% 60% 90% 75% 100% 0% 95% 77% Caboolture Midwest 35% 60% 55% 25% 0% 0% 65% 49% Caboolture Hinterland 0% 60% 80% 35% 0% 0% 0% 27% Dakabin - Kallangur - Murrumba Downs 20% 55% 95% 15% 0% 0% 90% 53%
Source: ABS 8165.0, Economic Associates estimates
Sole trader businesses typically operate either from home (which does not require commercial office space) or within commercial office space.
For the purposes of this assessment, it has been assumed that:
• Half of all sole trader businesses within each catchment require commercial office space; and
• All employing businesses within each catchment require commercial office space.
Table 8.7 below provides a summary of the projected employment within commercial office space in employing and non-employing businesses between 2012 and 2031.

Retail & Commercial Sectors Needs Assessment 87 24 June 2013 12047 Report Rev 0
Table 8.7: Projected Employment within Commercial Office Space by Catchment, Moreton Bay Regional Council, 2012-2031
Employing Businesses Non-Employing Businesses Total Businesses 2012 2016 2021 2026 2031 2012 2016 2021 2026 2031 2012 2016 2021 2026 2031
Hills District / Samford 801 854 868 888 914 77 82 84 86 88 878 936 951 973 1,002 Albany Creek 644 681 738 779 822 59 62 68 71 75 703 744 806 851 898 Strathpine 2,484 2,783 3,089 3,333 3,469 78 88 97 105 109 2,562 2,871 3,186 3,438 3,578 Petrie / Dayboro 376 392 406 416 424 38 40 41 42 43 414 432 448 459 466 Central Pine West 300 371 474 580 667 51 63 80 98 112 351 434 554 678 779 Lawnton - Bray Park 208 222 233 241 254 26 27 29 30 31 234 249 261 271 285 Griffin – Mango Hill 664 1,134 1,705 2,443 2,901 92 150 217 301 351 756 1,284 1,922 2,744 3,252 Redcliffe 1,576 1,687 1,822 1,945 2,061 169 181 195 208 221 1,744 1,867 2,017 2,153 2,282 Rothwell - Deception Bay 603 672 724 735 758 36 40 43 44 45 639 712 767 779 803 Bribie Island 506 534 562 573 582 35 37 39 40 40 541 571 601 613 622 Caboolture Morayfield 2,344 2,910 3,367 3,675 4,251 120 149 173 189 218 2,464 3,059 3,540 3,863 4,469 Caboolture East 112 116 121 122 123 18 18 19 19 20 130 135 140 141 143 Burpengary - Narangba 509 548 654 813 996 51 55 66 82 101 560 603 720 895 1,097 Caboolture Midwest 111 123 139 155 171 24 27 30 34 37 135 150 170 189 209 Caboolture Hinterland 65 73 83 91 103 11 13 14 16 18 76 86 97 107 121 Dakabin - Kallangur - Murrumba Downs 309 368 421 449 457 41 49 56 60 61 351 417 476 509 518
Source: Economic Associates estimates

Retail & Commercial Sectors Needs Assessment 88 24 June 2013 12047 Report Rev 0
8.3.3 Commercial Office Floor Space Demand
The average office space per employee in Queensland is 20m2 per employee. However, the Queensland Government along with a number of other state governments has set occupancy density targets of 15m2 per employee. For the purpose of this assessment the midpoint of 17.5m2 per employee has been applied in respect of employing businesses.
In the case of sole traders, it has been assumed that a 17.5m2 tenancy would be insufficient, and as such a floor space ratio of 30m2 per sole trader has been assumed.
Table 8.8 below provides an overview of commercial office floor space demand by catchment between 2012 and 2031.

Retail & Commercial Sectors Needs Assessment 89 24 June 2013 12047 Report Rev 0
Table 8.8: Projected Commercial Office Floor Space Demand by Catchment, Moreton Bay Regional Council, 2012-2031
Employing Businesses Non-Employing Businesses Total Businesses 2012 2016 2021 2026 2031 2012 2016 2021 2026 2031 2012 2016 2021 2026 2031
Hills District / Samford 14,019 14,938 15,182 15,534 15,999 2,316 2,468 2,508 2,566 2,643 16,335 17,406 17,690 18,100 18,642 Albany Creek 11,266 11,924 12,921 13,637 14,389 1,771 1,874 2,031 2,143 2,261 13,036 13,798 14,952 15,780 16,650 Strathpine 43,465 48,707 54,063 58,322 60,709 2,343 2,626 2,915 3,144 3,273 45,808 51,333 56,978 61,467 63,982 Petrie / Dayboro 6,574 6,860 7,114 7,287 7,412 1,141 1,191 1,235 1,265 1,286 7,715 8,051 8,348 8,552 8,698 Central Pine West 5,249 6,494 8,299 10,158 11,672 1,532 1,890 2,408 2,939 3,372 6,781 8,384 10,706 13,097 15,043 Lawnton - Bray Park 3,640 3,881 4,069 4,217 4,438 773 824 865 896 943 4,413 4,705 4,934 5,112 5,381 Griffin – Mango Hill 11,618 19,843 29,838 42,757 50,762 2,754 4,499 6,496 9,035 10,526 14,372 24,341 36,334 51,792 61,288 Redcliffe 27,573 29,519 31,882 34,032 36,074 5,061 5,419 5,852 6,247 6,622 32,635 34,938 37,735 40,279 42,696 Rothwell - Deception Bay 10,556 11,767 12,669 12,865 13,270 1,074 1,197 1,289 1,309 1,350 11,630 12,964 13,958 14,174 14,620 Bribie Island 8,857 9,348 9,841 10,035 10,181 1,047 1,105 1,163 1,186 1,203 9,903 10,452 11,004 11,221 11,385 Caboolture Morayfield 41,019 50,922 58,929 64,308 74,389 3,612 4,484 5,189 5,662 6,550 44,631 55,406 64,118 69,970 80,939 Caboolture East 1,960 2,034 2,117 2,133 2,152 534 555 577 581 587 2,494 2,589 2,694 2,714 2,738 Burpengary - Narangba 8,905 9,583 11,449 14,230 17,432 1,542 1,660 1,983 2,465 3,019 10,447 11,242 13,432 16,695 20,451 Caboolture Midwest 1,943 2,157 2,438 2,710 2,997 726 806 911 1,012 1,120 2,668 2,963 3,348 3,722 4,117 Caboolture Hinterland 1,132 1,284 1,451 1,599 1,797 339 385 435 479 538 1,471 1,669 1,885 2,078 2,335 Dakabin - Kallangur - Murrumba Downs 5,414 6,434 7,359 7,861 7,993 1,234 1,467 1,678 1,792 1,822 6,649 7,901 9,037 9,653 9,816
Source: Economic Associates estimates

Retail & Commercial Sectors Needs Assessment 90 24 June 2013 12047 Report Rev 0
8.3.4 Incremental Commercial Office Floor Space Demand
The largest demand for additional floor space (i.e. over and above 2012 demand) occurs in:
• Griffin-Mango Hill: Incremental commercial office floor space demand of 46,916m2;
• Caboolture-Morayfield: Incremental commercial office floor space demand of 36,309m2;
• Strathpine: Incremental commercial office floor space demand of 18,174m2;
• Redcliffe: Incremental commercial office floor space demand of 10,062m2; and
• Burpengary-Narangba: Incremental commercial office floor space demand of 10,003m2.
Table 8.9 below summarises the incremental commercial office floor space demand by catchment within Moreton Bay Regional Council between 2016 and 2031.
Table 8.9: Incremental Commercial Office Floor Space Demand by Catchment, Moreton Bay Regional Council, 2016-2031
2016 2021 2026 2031
Hills District / Samford 1,071 1,355 1,765 2,307 Albany Creek 762 1,915 2,744 3,614 Strathpine 5,525 11,170 15,658 18,174 Petrie / Dayboro 335 633 837 983 Central Pine West 1,603 3,925 6,316 8,262 Lawnton - Bray Park 292 521 699 967 Griffin - Mango Hill 9,969 21,962 37,420 46,916 Redcliffe 2,303 5,100 7,644 10,062 Rothwell - Deception Bay 1,334 2,328 2,544 2,990 Bribie Island 549 1,101 1,318 1,481 Caboolture Morayfield 10,775 19,487 25,339 36,309 Caboolture East 94 200 220 244 Burpengary - Narangba 795 2,985 6,248 10,003 Caboolture Midwest 295 680 1,054 1,448 Caboolture Hinterland 198 414 607 864 Dakabin - Kallangur - Murrumba Downs 1,252 2,388 3,005 3,167
Note: Incremental commercial office floor space demand estimates are on 2012 levels. Source: Economic Associates estimates
8.4 Summary
8.4.1 Low Need
A catchment is characterised as having low need if its incremental demand in 2031 is less than 10,000m2 of commercial office floor space. Low need catchments are:
• Hills District / Samford;
• Albany Creek;
• Petrie / Dayboro;
• Central Pine West;
• Lawnton – Bray Park;

Retail & Commercial Sectors Needs Assessment 91 24 June 2013 12047 Report Rev 0
• Rothwell Deception Bay;
• Bribie Island;
• Caboolture East;
• Caboolture Midwest;
• Caboolture Hinterland; and
• Dakabin – Kallangur – Murrumba Downs.
8.4.2 Moderate Need
Moderate need for the provision of commercial office floor space is categorised as incremental demand in the order of 10,000m2 to 30,000m2 by 2031. Retail catchments with a moderate need for additional retail floor space provision are:
• Strathpine;
• Redcliffe; and
• Burpengary – Narangba.
8.4.3 High Need
High need for commercial office floor space is categorised as incremental demand in excess of 30,000m2 by 2031. High need catchments are:
• Griffin – Mango Hill; and
• Caboolture – Morayfield.

Retail & Commercial Sectors Needs Assessment 92 24 June 2013 12047 Report Rev 0
9 RETAIL AND COMMERCIAL CATCHMENT NEED SUMMARY
This section gives an indication of the level of need for the retail and commercial catchments within Moreton Bay Regional Council; need is an interaction of supply and demand. Sections 7 and 8 of this report estimated the demand for additional retail and commercial floor space and categorised the retail and commercial catchments into low, moderate or high need for additional retail and commercial provision. The retail and commercial catchments are categorised as follows:
• Low need:
– Redcliffe5;
– Lawnton – Bray Park;
– Rothwell – Deception Bay;
– Bribie Island;
– Caboolture East;
– Caboolture Hinterland;
• Moderate need:
– Albany Creek;
– Burpengary – Narangba;
– Caboolture Midwest;
– Dakabin-Kallangur-Murrumba Downs;
– Hills District / Samford;
– Petrie / Dayboro;
• High need:
– Caboolture Morayfield;
– Strathpine;
– Griffin – Mango Hill; and
– Central Pine West.
Additional floor space demand can be accommodated through the expansion / redevelopment of existing centres and / or the addition of new centres. The allocation of additional floor space is recommended in this section with a focus on the expansion of existing centres with an emphasis on allocation to higher order centres (i.e. Principal, Major and District centres) within each
5 Although Redcliffe falls into the “moderate need” category for incremental floor space demand, the catchment is anticipated to have an oversupply of retail floor space to 2021 in excess of 1,000m2 (Refer to Section 7 of this report). As such, the catchment has been categorised as “low need”.
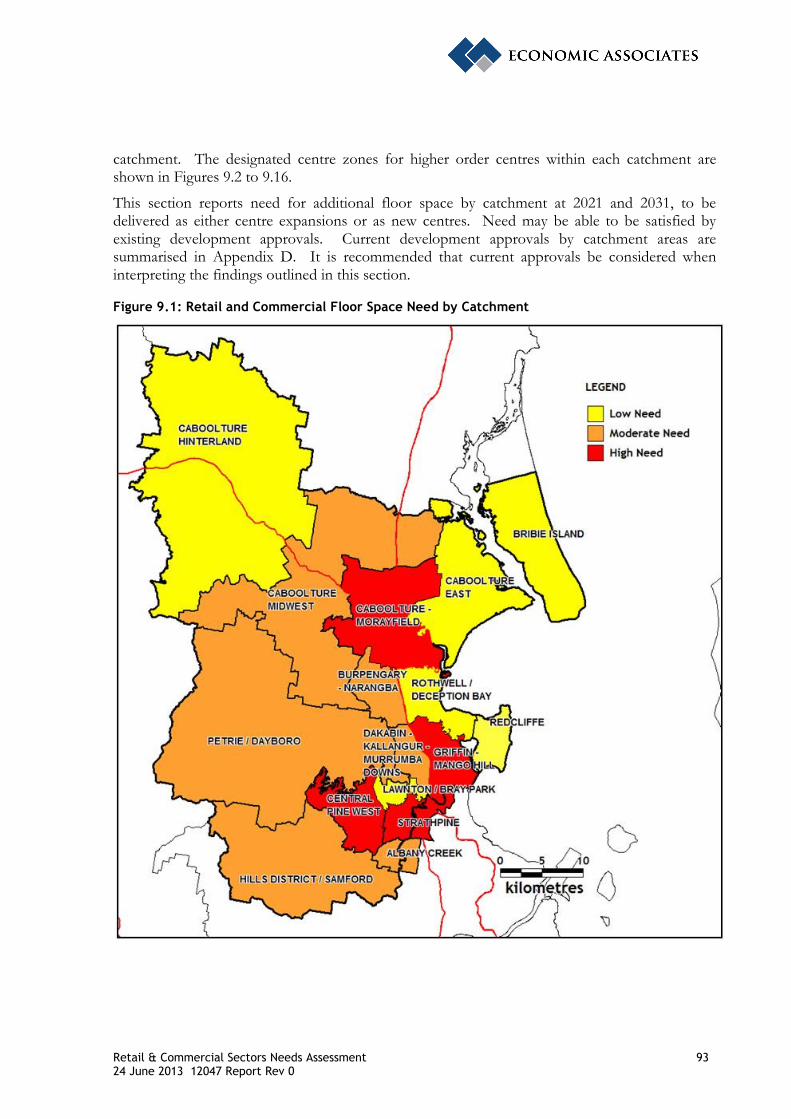
Retail & Commercial Sectors Needs Assessment 93 24 June 2013 12047 Report Rev 0
catchment. The designated centre zones for higher order centres within each catchment are shown in Figures 9.2 to 9.16.
This section reports need for additional floor space by catchment at 2021 and 2031, to be delivered as either centre expansions or as new centres. Need may be able to be satisfied by existing development approvals. Current development approvals by catchment areas are summarised in Appendix D. It is recommended that current approvals be considered when interpreting the findings outlined in this section.
Figure 9.1: Retail and Commercial Floor Space Need by Catchment

Retail & Commercial Sectors Needs Assessment 94 24 June 2013 12047 Report Rev 0
9.1 Low Need
9.1.1 Redcliffe
An oversupply of retail floor space is anticipated in the Redcliffe catchment in 2021, possibly indicating that centres are performing below identified benchmark trading levels. By 2031 Redcliffe is estimated to have a retail undersupply of 7,395m2.
Commercial floor space in Redcliffe is estimated to have incremental demand of 5,100m2 in 2021, increasing to 10,062m2 by 2031.
The addition of retail and commercial floor space within Redcliffe may be accommodated through expansions and redevelopment of existing centres with the focus on the Redcliffe – Kippa Ring MAC, where the extent of undersupply is expected to be greatest.
Table 9.1 below provides a breakdown for the recommended provision of additional floor space demand in Redcliffe. Figure 9.2 below shows the Redcliffe – Kippa Ring MAC. There are a number of houses located within the designated centre zone. Remnant houses within centre zones represent breaks in centre activities within the centre. Utilisation of these sites to deliver a more integrated centre would often require redevelopment of neighbouring sites already used for centre activities.
Figure 9.3 below shows the Margate Village District Centre.
Table 9.1: Distribution of Additional Floor Space Demand, Redcliffe (sqm)
Existing Supply Additional Demand 2021 Additional Demand 2031 Retail Commercial Retail Commercial Retail Commercial
Redcliffe 103,794 38,722 4,760 -5,100 -7,395 -10,062 Redcliffe - Kippa Ring MAC 75,497 25,026 - -3,060 -6,647 -6,037 Margate Village District Centre 14,110 6,598 - -983 -373 -1,939 Redcliffe IGA 3,809 2,204 - -328 -101 -648 Landsborough Avenue Local Centre 3,769 3,060 - -456 -100 -899 Clontarf Bayside Plaza 1,752 1,238 - -184 -46 -364 Redcliffe Coastal Strip Retail 1,418 220 - -33 -37 -65 Midways Convenience Centre 1,115 120 - -18 -29 -35 Mariners Plaza 950 140 - -21 -25 -41 Ashmole Shopping Village 774 116 - -17 -20 -34 Victoria Avenue Local Centre 600 - - - -16 -
Note: a negative balance indicates an undersupply of floor space Source: Economic Associates estimates

Retail & Commercial Sectors Needs Assessment 95 24 June 2013 12047 Report Rev 0
Figure 9.2: Redcliffe – Kippa Ring MAC
Figure 9.3: Margate Village District Centre

Retail & Commercial Sectors Needs Assessment 96 24 June 2013 12047 Report Rev 0
9.1.2 Lawnton – Bray Park
Retail floor space is expected to be oversupplied in Lawnton – Bray Park out to 2031. The commercial office market is estimated to have low incremental demand over the period to 2031. Figure 9.4 below shows the Lawnton Employment Area.
Table 9.2: Distribution of Additional Floor Space Demand, Lawnton – Bray Park (sqm)
Existing Supply Additional Demand 2021 Additional Demand 2031 Retail Commercial Retail Commercial Retail Commercial
Lawnton - Bray Park 62,370 6,257 13,058 -521 5,945 -967 Lawnton Employment Area 53,777 4,948 - -312 - -580 Kensington Village Shopping Centre 5,433 690 - -110 - -204 Ebert Place Shops 1,839 44 - -7 - -13 Francis Road Local Centre 663 - - - - - Sparkes Road Local Centre 154 575 - -91 - -170 Ellis Street Local Centre 504 - - - - -
Note: a negative balance indicates an undersupply of floor space Source: Economic Associates estimates
Figure 9.4: Lawnton Employment Area

Retail & Commercial Sectors Needs Assessment 97 24 June 2013 12047 Report Rev 0
9.1.3 Rothwell – Deception Bay
The Rothwell – Deception Bay catchment is estimated to be oversupplied with retail floor space out to 2031.
Demand for additional commercial office floor space is anticipated to be in the order of 2,328m2 to 2,990m2 by 2031. Table 9.3 below shows the suggested allocation of additional commercial office floor space demand. Figure 9.5 below shows the Deception Bay district centre.
Table 9.3: Distribution of Additional Floor Space Demand, Rothwell – Deception Bay (sqm)
Existing Supply Additional Demand 2021 Additional Demand 2031 Retail Commercial Retail Commercial Retail Commercial
Rothwell - Deception Bay 69,588 5,267 13,811 -2,328 4,682 -2,990 Deception Bay District Centre 23,144 2,395 - -1,059 - -1,360 Bunnings Rothwell & Harvey Norman Centre 17,682 - - - - - Zone Rothwell 10,587 154 - -68 - -88 Deception Bay Strip Retail 10,354 1,768 - -781 - -1,004 Deception Bay IGA 2,336 - - - - - Rothwell Local Centre 1,610 450 - -199 - -255 North Rise 1,259 200 - -88 - -114 Bay Markets 780 220 - -97 - -125 Burpengary Tavern 762 - - - - - North Bay Shopping Centre 742 - - - - - Bayview Shops 332 80 - -35 - -45
Note: a negative balance indicates an undersupply of floor space Source: Economic Associates estimates
Figure 9.5: Deception Bay District Centre

Retail & Commercial Sectors Needs Assessment 98 24 June 2013 12047 Report Rev 0
9.1.4 Bribie Island
By 2021, there is estimated to be demand for an additional 1,016m2 of retail floor space and 1,101m2 of commercial office floor space within the Bribie Island catchment.
By 2031, there is projected to be demand for additional floor space in the order of 2,909m2 of retail floor space and 1,481m2 of commercial office floor space in the Bribie Island catchment. Additional floor space could be supplied through the expansion of existing centres with focus on the Bellara District Centre (see Figure 9.6 below).
Table 9.4 below shows the suggested distribution of additional floor space demand within the Bribie Island catchment.
Table 9.4: Distribution of Additional Floor Space Demand, Bribie Island (sqm)
Existing Supply Additional Demand 2021 Additional Demand 2031 Retail Commercial Retail Commercial Retail Commercial
Bribie Island 36,004 9,008 -1,016 -1,101 -2,909 -1,481 Bellara District Centre 15,454 5,211 -436 -637 -1,249 -857 Banksia Beach Shopping Village 4,209 734 -119 -90 -340 -121 Bongaree 3,641 740 -103 -90 -294 -122 Welsby Parade Shops 3,448 1,050 -97 -128 -279 -173 Woorim 3,368 1,224 -95 -150 -272 -201 Aldi Centre - Bribie Island 2,050 50 -58 -6 -166 -8 Coolgarra Shops 1,523 - -43 - -123 - Bribie Island Hotel 880 - -25 - -71 - Marine Parade 387 - -11 - -31 - Currong Shops 569 - -16 - -46 - Cotterill Shops 241 - -7 - -19 - Bellara Corner Store 120 - -3 - -10 - Elkhorn Avenue 114 - -3 - -9 -
Note: a negative balance indicates an undersupply of floor space Source: Economic Associates estimates
Figure 9.6: Bellara District Centre

Retail & Commercial Sectors Needs Assessment 99 24 June 2013 12047 Report Rev 0
9.1.5 Caboolture East
There is estimated to be demand for an additional 2,945m2 to 3,501m2 of retail floor space and up to 244m2 of commercial office floor space between 2021 and 2031. Additional retail and commercial floor space within the Caboolture East catchment could be provided by expansions to the existing centres. Table 9.5 below shows the suggested distribution of retail and commercial office floor space demand within the Caboolture East catchment. There are no higher order centres within the Caboolture East catchment.
Table 9.5: Distribution of Additional Floor Space Demand, Caboolture East (sqm)
Existing Supply Additional Demand 2021 Additional Demand 2031 Retail Commercial Retail Commercial Retail Commercial
Caboolture East 6,625 1,432 -2,945 -200 -3,501 -244 The Village Sandstone Point 2,503 501 -1,113 -70 -1,323 -85 Beachmere Plaza 2,254 436 -1,002 -61 -1,191 -74 Ningi 1,152 379 -512 -53 -609 -65 Toorbul 516 - -229 0 -273 0 Donnybrook 200 116 -89 -16 -106 -20
Note: a negative balance indicates an undersupply of floor space Source: Economic Associates estimates
9.1.6 Caboolture Hinterland
By 2031, there is projected to be demand for additional floor space in the order of 4,499m2 of retail floor space and 864m2 of commercial office floor space. Incremental expansions to existing centres would provide the additional floor space demanded. There are no higher order centres within the Caboolture Hinterland catchment.
Table 9.6 below shows the suggested distribution of additional floor space provision within the Caboolture Hinterland catchment.
Table 9.6: Distribution of Additional Floor Space Demand, Caboolture Hinterland (sqm)
Existing Supply Additional Demand 2021 Additional Demand 2031 Retail Commercial Retail Commercial Retail Commercial
Caboolture Hinterland 12,609 770 -567 -414 -4,499 -864 Woodford Shopping Centre 4,962 - -223 0 -1,771 - Woodford Strip Retail 4,577 770 -206 -414 -1,633 -864 Woodford Central Shopping Centre 1,956 - -88 0 -698 - D'Aguilar 1,114 - -50 0 -398 -
Note: a negative balance indicates an undersupply of floor space Source: Economic Associates estimates
9.2 Moderate Need
For catchments with moderate need for additional retail and commercial floor space vacant allotments were identified within centre zones with large future demand (e.g. principal, major and district centre activity zones). The identification of vacant allotments within these zones gives an indication of the potential for centre expansion and / or the development of new centres within the zone. There are instances of under-utilised land (i.e. houses and under-utilised allotments within the centre zone) within higher order centres. House sites located within centre zones represent opportunities for the provision of additional floor space within the zone. However,

Retail & Commercial Sectors Needs Assessment 100 24 June 2013 12047 Report Rev 0
remnant houses within centre zones represent breaks in centre activities within the centre. As a result, the centre has developed around remnant houses. Utilisation of these sites to deliver a more integrated centre would often require redevelopment of neighbouring sites already used for centre activities.
9.2.1 Albany Creek
In 2021, there is anticipated to be demand for an additional 11,716m2 of retail floor space and 1,915m2 of commercial office floor space in Albany Creek. By 2031, there is anticipated to be demand for additional retail and commercial office floor space in the order of 18,047m2 and 3,614m2 respectively.
Table 9.7 below provides an indication of the appropriate distribution of additional retail and commercial office floor space across existing centres (with a focus on expanding the Albany Creek District Centre) and potentially new centres within the catchment.
Table 9.7: Distribution of Additional Floor Space Demand, Albany Creek (sqm)
Existing Supply Additional Demand 2021
Additional Demand 2031
Retail Commercial Retail Commercial
Retail Commercial
Albany Creek 27,589 9,422 -11,716 -1,915 -18,047 -3,614 Albany Creek District Centre 18,467 6,481 -4,705 -931 -7,248 -1,757 Woolworths Market Place 4,694 167 -1,196 -11 -1,842 -21 Albany Place 2,604 1,613 -663 -232 -1,022 -437 Dawn Road Local Centre 1,524 - -388 0 -598 0 Radius Medical Centre 300 1,161 -76 -167 -118 -315 New Centres - - -4,686 -575 -7,219 -1,084
Note: a negative balance indicates an undersupply of floor space Source: Economic Associates estimates
Vacant Allotments within the Albany Creek District Centre
There was one vacant allotment identified within the Albany Creek District Centre of approximately 0.5 hectares. Future floor space demand could be accommodated through the expansion / redevelopment of existing centres (including the Albany Creek Hotel site) and centre development on the vacant allotment identified in Figure 9.7 below. Houses within the centre zone are mostly converted houses.

Retail & Commercial Sectors Needs Assessment 101 24 June 2013 12047 Report Rev 0
Figure 9.7: Albany Creek District Centre
9.2.2 Burpengary – Narangba
There is estimated to be sufficient provision of retail floor space within the Burpengary – Narangba catchment to 2021 and demand for an additional 2,985m2 of commercial office floor space.
By 2031, there is projected demand for an additional 16,697m2 of retail floor space and 10,003m2 of commercial office floor space. The provision of additional floor space demand is split between existing centres moving up the centres network hierarchy and the provision of new centres.
Table 9.8: Distribution of Additional Floor Space Demand, Burpengary – Narangba (sqm)
Existing Supply Additional Demand 2021 Additional Demand 2031 Retail Commercial Retail Commercial Retail Commercial
Burpengary - Narangba 31,993 5,244 867 -2,985 -16,697 -10,003 Burpengary District Centre 24,866 4,162 - -1,658 -7,787 -5,557 Narangba Valley Shopping Centre 2,872 218 - -87 -899 -291 Narangba Village 1,411 408 - -163 -442 -545 FoodWorks Burpengary 990 - - - -310 - Chooks Corner 805 - - - -252 - Woodpecker Tavern 729 - - - -228 - Narangba Station Plaza 240 456 - -182 -75 -609 Oakey Flat Road 80 - - - -25 - New Centres - - - -895 -6,679 -3,001
Note: a negative balance indicates an undersupply of floor space Source: Economic Associates estimates

Retail & Commercial Sectors Needs Assessment 102 24 June 2013 12047 Report Rev 0
Vacant Allotments within Burpengary District Centre
There were two vacant allotments identified within the Burpengary district centre with a combined area of 3.9 hectares. There is potential for the expansion of the existing centres within the Burpengary District Centre and / or new centres. With the redevelopment potential of existing sites and availability of vacant sites the Burpengary District Centre zone appears to be of sufficient size.
Figure 9.8 below shows the vacant allotments within the Burpengary District Centre.
Figure 9.8: Vacant Allotments, Burpengary District Centre
9.2.3 Caboolture Midwest
Within the Caboolture Midwest catchment there is projected to be demand for an additional 18,006m2 to 23,425m2 of retail floor space and 680m2 to 1,448m2 of commercial office floor space between 2021 and 2031. Table 9.9 below shows the suggested distribution of additional retail and commercial floor space within Caboolture Midwest, with provision for the development of new centres.

Retail & Commercial Sectors Needs Assessment 103 24 June 2013 12047 Report Rev 0
Table 9.9: Distribution of Additional Floor Space Demand, Caboolture Midwest (sqm)
Existing Supply Additional Demand 2021 Additional Demand 2031 Retail Commercial Retail Commercial Retail Commercial
Caboolture Midwest 2,561 280 -18,006 -680 -23,425 -1,448 Wamuran 1,371 280 -5,784 -476 -7,524 -1,014 Elimbah 640 - -2,700 - -3,512 - Excelsior Park Village 550 - -2,320 - -3,019 - New Centres - - -7,203 -204 -9,370 -435
Note: a negative balance indicates an undersupply of floor space Source: Economic Associates estimates
Vacant Allotments within Wamuran Designated Centre
Although Wamuran is not a higher order centre (i.e. Principal, Major or District centre), the centre currently has the largest provision of floor space within the catchment. As the catchment is anticipated to have a moderate demand for future floor space provision the vacant allotments within the Wamuran designated centre have been identified.
There were three vacant allotments identified within the Wamuran designated centre with a combined area of 4.6 hectares. Hence, centre expansion could be accommodated on vacant allotments within the centre zone. Figure 9.9 below shows vacant allotments with the potential to accommodate expansion and / or new centres within the Wamuran designated centre within the Caboolture Midwest catchment.
Figure 9.9: Vacant Allotments, Wamuran Designated Centre

Retail & Commercial Sectors Needs Assessment 104 24 June 2013 12047 Report Rev 0
9.2.4 Dakabin-Kallangur-Murrumba Downs
There is projected to be demand for an additional 16,045m2 of retail floor space and 3,167m2 of commercial office floor space within the Dakabin-Kallangur-Murrumba Downs catchment by 2031. Table 9.10 below shows the suggested distribution of additional retail and commercial floor space within Dakabin-Kallangur-Murrumba Downs, with provision for the development of new centres.
Table 9.10: Distribution of Additional Floor Space Demand, Dakabin-Kallangur-Murrumba Downs (sqm)
Existing Supply Additional Demand 2021 Additional Demand 2031 Retail Commercial Retail Commercial Retail Commercial
Dakabin-Kallangur-Murrumba Downs 38,607 7,417 -10,279 -2,388 -16,045 -3,167 Kallangur District Centre 21,382 5,838 -3,416 -1,128 -5,332 -1,496 Lilly Brook Shopping Village 6,887 357 -1,100 -69 -1,717 -91 Murrumba Downs Shopping Centre 5,137 998 -821 -193 -1,281 -256 Castle Hill Centre 2,479 224 -396 -43 -618 -57 Anzac Avenue Local Centre 1,536 - -245 - -383 - Dakabin Village 831 - -133 - -207 - Kallangur Village Shopping Centre 355 - -57 - -89 - New Centres - - -4,112 -955 -6,418 -1,267
Note: a negative balance indicates an undersupply of floor space Source: Economic Associates estimates
Vacant Allotments within Kallangur District Centre
There was one vacant allotment identified within the Kallangur district centre with an area of approximately 0.2 hectares. There is limited potential for redevelopment and centre expansion within the Kallangur district centre zone. Therefore, given the additional retail and commercial floor space demand within the district centre to 2031, it may be appropriate to expand the designated centre zone. It is recommended that expansion of the centre zone should occur to the north rather than the south, brining properties fronting Boardman Street into the centre zone. Due to the grid based road network, expanding the centre zone north would allow for better permeability between the existing and future centres.
Alternatively the former Tulip Town site could be considered for the provision of additional floor space by establishing a new centre as per the Pine Rivers planning scheme. The former Tulip Town site was zoned a central and local business zone in the planning scheme, adjacent a major employment centres locality.
Figure 9.10 below shows the vacant allotment within the Kallangur District Centre, the former Tulip Town site and the potential area for centre zone expansion.

Retail & Commercial Sectors Needs Assessment 105 24 June 2013 12047 Report Rev 0
Figure 9.10: Vacant Allotments, Kallangur District Centre
9.2.5 Hills District / Samford
Within the Hills District / Samford catchment there is anticipated to be demand for an additional 14,259m2 to 19,340m2 of retail floor space and 1,355m2 to 2,307m2 of commercial office floor space between 2021 and 2031.
Table 9.11 below provides an indication of the appropriate distribution of additional floor space across existing centres (with a focus on expanding the Arana Hills District Centre) and potentially new centres within the catchment.
Table 9.11: Distribution of Additional Floor Space Demand, Hills District / Samford (sqm)
Existing Supply Additional Demand 2021 Additional Demand 2031 Retail Commercial Retail Commercial Retail Commercial
Hills District/Samford 39,098 8,871 -14,259 -1,355 -19,340 -2,307 Arana Hills District Centre 19,284 2,791 -4,220 -299 -5,723 -508 Samford Village Main Street Retailing 5,179 2,444 -1,133 -261 -1,537 -445 Ferny Way South 2,624 1,472 -574 -157 -779 -268 Everton Hills Shopping Centre 2,172 255 -475 -27 -645 -46 Samford Valley 2,167 247 -474 -26 -643 -45 Samford Central 2,029 368 -444 -39 -602 -67 Everton Shopping Village 1,280 282 -280 -30 -380 -51 Fernlands Village 931 368 -204 -39 -276 -67 Samford Country Centre 812 200 -178 -21 -241 -36 Chinook Street Local Centre 725 - -159 - -215 - 170 Patricks Road 618 334 -135 -36 -183 -61 Arlington Court 554 - -121 - -164 - Ferny Way Local Centre 478 - -105 - -142 - Mt Glorious 245 110 -54 -12 -73 -20 New Centres - - -5,704 -407 -7,736 -692
Note: a negative balance indicates an undersupply of floor space Source: Economic Associates estimates
Vacant Allotments within Arana Hills District Centre
No vacant allotments were identified within the Arana Hills District Centre. However, there is potential to accommodate future floor space demand with the redevelopment of Arana Hills Plaza. There is remnant housing located within the centre zone, including converted houses.

Retail & Commercial Sectors Needs Assessment 106 24 June 2013 12047 Report Rev 0
Utilisation of house sites within the centre and expansion of the centre zone would require redevelopment of neighbouring sites already used for centre activities to deliver a more integrated centre.
Figure 9.11 below shows the Arana Hills District Centre.
Figure 9.11: Arana Hills District Centre
9.2.6 Petrie / Dayboro
Within the Petrie / Dayboro catchment, there is projected to be demand for additional 17,148m2 of retail floor space and 983m2 of commercial office floor space by 2031. Table 9.12 below shows the distribution of additional floor space demand with provision for new centres.

Retail & Commercial Sectors Needs Assessment 107 24 June 2013 12047 Report Rev 0
Table 9.12: Distribution of Additional Floor Space Demand, Petrie / Dayboro (sqm)
Existing Supply Additional Demand 2021 Additional Demand 2031 Retail Commercial Retail Commercial Retail Commercial
Petrie / Dayboro 17,476 4,429 -14,342 -633 -17,148 -983 Petrie Village District Centre 9,145 1,318 -4,503 -132 -5,384 -205 Dayboro 5,948 2,928 -2,929 -293 -3,502 -455 Beeville Road Local Centre 2,384 182 -1,174 -18 -1,403 -28 New Centres - - -5,737 -190 -6,859 -295
Note: a negative balance indicates an undersupply of floor space Source: Economic Associates estimates
Vacant Allotments within Petrie Village District Centre
There were no vacant allotments identified within the Petrie Village district centre. Accordingly, it might be appropriate to expand the designated Petrie Village centre zone. The Village Holden site is located adjacent the centre zone. Expansion of the centre zone to include the Village Holden site would be appropriate to accommodate long term demand. There is remnant housing located within the centre zone, including converted houses. Utilisation of house sites within the centre and expansion of the centre zone would require redevelopment of neighbouring sites already used for centre activities to deliver a more integrated centre.
Figure 9.12: Petrie Village District Centre
9.3 High Need
For catchments with high need for additional retail and commercial floor space, vacant allotments were identified within centre zones with large future demand (e.g. principal, major and district centre activity zones). The identification of vacant allotments within these zones gives an indication of the potential for centre expansion and / or the development of new centres within the zone. There are instances of under-utilised land (i.e. houses and under-utilised allotments

Retail & Commercial Sectors Needs Assessment 108 24 June 2013 12047 Report Rev 0
within the centre zone) within higher order centres. House sites located within centre zones represent opportunities for the provision of additional floor space within the zone. However, remnant houses within centre zones represent breaks in centre activities within the centre. As a result, the centre has developed around remnant houses. Utilisation of these sites to deliver a more integrated centre would often require redevelopment of neighbouring sites already used for centre activities.
9.3.1 Caboolture – Morayfield
There is significant demand for additional retail and commercial office floor space within the Caboolture – Morayfield catchment in the order of an additional 104,797m2 of retail floor space and 36,309m2 of commercial office floor space by 2031. Within the Caboolture – Morayfield PAC, there is demand for an additional 84,204m2 of additional retail floor space and 21,785m2 of additional commercial office floor space by 2031.
Table 9.13 below shows the suggested distribution of additional floor space demand within the Caboolture – Morayfield catchment including provision for the expansion of existing centres and the addition of new centres.
Table 9.13: Distribution of Additional Floor Space Demand, Caboolture - Morayfield (sqm)
Existing Supply Additional Demand 2021 Additional Demand 2031 Retail Commercial Retail Commercial Retail Commercial
Caboolture Morayfield 191,478 39,324 -47,304 -19,487 -104,797 -36,309
Caboolture Morayfield PAC 175,764 37,068 -33,816 -11,692 -84,204 -21,785
Central Lakes Shopping Village 4,579 620 -1,572 -1,071 -2,400 -1,996
Lear Jet Centre 2,493 160 -856 -276 -1,307 -515
The Hub Convenience Centre 2,204 1,250 -757 -2,159 -1,155 -4,023
Trader Dukes Centre 1,930 - -663 - -1,012 -
Glenwood Drive Centre 1,205 - -414 - -632 -
Parkridge Shopping Village 1,013 110 -348 -190 -531 -354
Bellmere Shopping Centre 848 - -291 - -445 -
Hillcrest Gardens Shopping Centre 545 116 -187 -200 -286 -373
The Big Fish Tavern 470 - -161 - -246 -
Argyll Street Centre 277 - -95 - -145 -
Tullawong Corner Store 150 - -51 - -79 -
New Centres - - -8,093 -3,897 -12,356 -7,262
Note: a negative balance indicates an undersupply of floor space Source: Economic Associates estimates
Vacant Allotments within the Caboolture – Morayfield PAC
There were no vacant allotments identified within the Caboolture – Morayfield PAC. Figure 9.13 below shows the boundary of the Caboolture – Morayfield PAC. The Caboolture – Morayfield PAC covers a large area and as such there is significant opportunity for the redevelopment and / or expansion of existing centres. There are also a number of house sites located within the centre zone including converted houses.

Retail & Commercial Sectors Needs Assessment 109 24 June 2013 12047 Report Rev 0
Figure 9.13: Caboolture Morayfield PAC
9.3.2 Griffin – Mango Hill
The centres network within Griffin – Mango Hill is centred around the North Lakes MAC. By 2031, there is projected to be demand for an additional 128,936m2 of retail floor space and 46,916m2 of commercial office floor space. Within the North Lakes MAC, there is demand for

Retail & Commercial Sectors Needs Assessment 110 24 June 2013 12047 Report Rev 0
an additional 102,923m2 of retail floor space and 28,150m2 of commercial office floor space by 2031.
Table 9.14 below shows the suggested distribution of additional retail and commercial floor space within the Griffin – Mango Hill catchment including the expansion of existing centres to higher order centres and the provision for the addition of new centres.
Table 9.14: Distribution of Additional Floor Space Demand, Griffin – Mango Hill (sqm)
Existing Supply Additional Demand 2021 Additional Demand 2031 Retail Commercial Retail Commercial Retail Commercial
Griffin - Mango Hill 91,134 23,857 -82,543 -21,962 -128,936 -46,916 North Lakes MAC 87,128 21,364 -64,577 -13,177 -102,923 -28,150 Astley Parade Local Centre 3,046 2,304 -5,464 -4,059 -7,912 -8,672 North Lakes Convenience Centre 960 189 -1,722 -333 -2,494 -711 New Centres - - -10,779 -4,392 -15,608 -9,383
Note: a negative balance indicates an undersupply of floor space Source: Economic Associates estimates
Vacant Allotments within North Lakes MAC
Figure 9.14 shows the vacant allotments within North Lakes as of May 2013. There were 19 vacant allotments within the North Lakes MAC with a combined area of 79.2 hectares. There would appear to be sufficient space within the designated North Lakes MAC to accommodate the additional retail and commercial floor space demand to 2031.
Figure 9.14: Vacant Allotments, North Lakes MAC

Retail & Commercial Sectors Needs Assessment 111 24 June 2013 12047 Report Rev 0
9.3.3 Strathpine
There is demand for an additional 37,481m2 of retail floor space and 18,174m2 of commercial office floor space by 2031 within the Strathpine catchment. Within the Strathpine MAC, there is demand for an additional 29,694m2 of retail floor space and 10,904m2 of commercial office floor space.
Table 9.15 below shows the suggested distribution of additional retail and commercial floor space within the Strathpine catchment including the expansion of existing centres to higher order centres and the provision for the addition of new centres.
Table 9.15: Distribution of Additional Floor Space Demand, Strathpine (sqm)
Existing Supply Additional Demand 2021 Additional Demand 2031 Retail Commercial Retail Commercial Retail Commercial
Strathpine 82,906 26,259 -22,220 -11,170 -37,481 -18,174 Strathpine MAC 77,699 25,516 -13,044 -6,702 -26,694 -10,904 Lincoln Centre 2,520 955 -1,305 -1,257 -1,535 -2,045 Sandalwood Shopping Village 158 158 -82 -207 -96 -337 Bell's Corner 1,313 585 -680 -770 -800 -1,253 Eatons Hill Hotel & Function Centres 3,095 - -1,603 0 -1,885 -
New Centres - - -5,505 -2,234 -6,472 -3,635
Note: a negative balance indicates an undersupply of floor space Source: Economic Associates estimates
Vacant Allotments within the Strathpine MAC
There was one vacant allotment identified within the Strathpine MAC with an area of 3.1 hectares. There was also an underutilised allotment identified, with approximately one-third of the allotment vacant. Figure 9.15 below shows the vacant allotments within the Strathpine MAC. There might be potential therefore for the expansion of existing centres and introduction of new centres within the Strathpine MAC to accommodate future floor space demand.

Retail & Commercial Sectors Needs Assessment 112 24 June 2013 12047 Report Rev 0
Figure 9.15: Vacant Allotments, Strathpine MAC
9.3.4 Central Pine West
Within the Central Pine West catchment, there is demand for an additional 35,923m2 to 49,197m2 of retail floor space and 1,935m2 to 8,262m2 of commercial office floor space over the period 2021 to 2031.

Retail & Commercial Sectors Needs Assessment 113 24 June 2013 12047 Report Rev 0
The Central Pine West catchment is a relatively high growth area (population growth rate of 2.3% per annum) and currently has low provision of retail and commercial floor space (13,149m2). Table 9.16 indicates that there is a high level of projected future need for centre activities within Central Pine West. Because of the significant projected future need and the importance of centre locations in anchoring the urban form, it is recommended that the identification of new centre sites in Central Pine West is the subject of detailed planning.
Table 9.16 below shows the suggested distribution of additional retail and commercial floor space within the Central Pine West catchment including the expansion of existing centres to higher order centres and the provision for the addition of new centres.
Table 9.16: Distribution of Additional Floor Space Demand, Central Pine West (sqm)
Existing Supply Additional Demand 2021 Additional Demand 2031 Retail Commercial Retail Commercial Retail Commercial
Central Pine West 11,042 2,107 -35,923 -3,925 -49,197 -8,262 Warner Village 8,248 1,298 -10,733 -1,935 -14,699 -4,072 Bunya Park Drive Convenience Centre 1,829 571 -2,380 -851 -3,260 -1,791 Eatons Hill Convenience Centre 965 238 -1,256 -355 -1,720 -747 New Centres - - -21,554 -785 -29,518 -1,652
Note: a negative balance indicates an undersupply of floor space Source: Economic Associates estimates
Vacant Allotments within Warner Village District Centre
While there were no vacant allotments identified within the Warner Village designated centre, there are a number of underutilised allotments that could potentially accommodate additional retail and commercial floor space demand to 2031. Figure 9.16 below shows the centre boundary for the Warner Village district centre.
Figure 9.16: Warner Village District Centre

Retail & Commercial Sectors Needs Assessment 114 24 June 2013 12047 Report Rev 0
10 RECOMMENDATIONS & STRATEGY
10.1 Background & Context
Having derived a preferred future activity centres network on the basis of projected need and demand, it is necessary to ensure issues of statutory compliance, alignment and composition are observed in identifying a consistent statutory planning implementation framework.
This section outlines an implementation framework for the recommendations of the Moreton Bay Regional Council Retail and Commercial Sector Needs Study. The approaches recommended are cognisant of the need for statutory compliance, consistency and the alignment of centres policy at regional, district and local levels, while also adhering to the mandatory content and structure requirements of the Queensland Planning Provisions (QPP). Recognising the progressive evolution in the QPP as encapsulated within draft Version 3 and its likely adoption in advance of the finalisation of the Moreton Bay Regional Planning Scheme, this version has been used as the recognised reference informing planning scheme content and drafting.
10.2 Guiding Principles
The guiding principles outlined in Chapter 3 of this study are those of specific relevance to the manner in which key retail, commercial and centres recommendations of the study are implemented. At the outset, it must be noted that the planning implementation mechanisms suggested as a vehicle to implement key study outcomes comprise only one of a number of potential implementation approaches which achieve QPP compliance.
10.3 Drafting Principles
Version 3.0 of the QPP is predicated on a series of Planning Scheme drafting principles (pp. 1-2). In deriving these principles the Queensland Government has sought to ensure planning schemes remain efficient by:
“........
• keeping the planning scheme focused as a statutory instrument for strategic land use planning and development assessment. Supporting documents are used as mechanisms for assisting with interpretation, explaining the basis for decision-making and explaining how the planning scheme operates, but do not form part of the planning scheme;
• reflecting and integrating state planning instruments such as regional plans and state planning polices;
• using land use allocation (i.e. zoning) as the base layer for assigning assessment categories and assessment criteria;
• incorporating overlay provisions where it is necessary to:
– be sensitive to the effects of development;
– constrain land or development;
– identify valuable resources;

Retail & Commercial Sectors Needs Assessment 115 24 June 2013 12047 Report Rev 0
– present opportunities for development;
• including local plans where finer grained planning is required at the local or district level;
• ensuring that the strategic framework is reflected and enabled by the scheme elements—zones and where used, overlays and local plans;
• using the level of assessment tables as the structural focus of the planning scheme by incorporating within them critical information for users, assessment categories and relevant assessment criteria.
...........”
The Drafting Principles nominated by the QPP are as follows:
DP1 Achieving ecological sustainability, coordination and integration—users readily understand how the planning scheme measures seek to achieve ecological sustainability and how the matters dealt with by the planning scheme have been coordinated and integrated.
DP2 Applying and interpreting the planning scheme—users readily understand how to apply and interpret the planning scheme.
DP3 Focus on outcomes—planning schemes focus on the land use outcomes sought to be achieved both generally and specifically in the local government area.
DP4 Complying with and using the Sustainable Planning Act 2009 (the Act) operational rules—planning schemes comply with and effectively use the operational rules established by the Act.
DP5 Minimising regulation—assessment categories limit regulation to the minimum practicable to achieve the outcomes and level of community involvement sought.
DP6 Consistency of scheme structure and language—there is an appropriate degree of consistency of planning scheme structure and language within the State.
DP7 State planning instruments—the scheme includes measures to facilitate incorporation of state interests in the planning scheme.
The drafting principles inform the more detailed mandatory requirements of the QPP dealing with planning scheme composition, structure, formatting and drafting. The planning approaches and mechanisms recommended in section 10.5 below seek to provide an efficient and QPP compliant framework within which the commercial and retail recommendations can ultimately be implemented through the Moreton Bay Regional Council SPA Planning Scheme.
10.4 Alignment of Recommended Planning Approach with SEQ Regional Plan
10.4.1 The “Activity Centres Concept”
In simple terms, an Activity Centre can be defined as an identifiable concentration or focus of human activity, with such activity being derived from a synergistic mix of living, business, employment, service provision and social interaction opportunities.
The Activity Centre concept advanced under the SEQ Regional Plan represented a deliberate attempt to broaden the focus of centres planning policy beyond a traditional hierarchy of retail centres to recognise, foster and encourage the development of multi-functional centres which:

Retail & Commercial Sectors Needs Assessment 116 24 June 2013 12047 Report Rev 0
• Provided a foundation for economic growth through the synergistic co-location of a diverse mix of uses, the achievement of economies of agglomeration, and the more efficient concentration of goods and services;
• Provided a focus for government investment in major public transport, health, education cultural and entertainment facilities;
• Provided a focus for community and social interaction;
• Managed private travel demand by encouraging multi-purpose trips of lower frequency and less duration;
• Provided enhanced opportunities for land use and transport integration particular in respect of pedestrian, bicycle and public transport networks; and
• Provided interesting and diverse mixed-use residential environments.
Generally activity centres are distinguishable by the order, mix, size and intensity of their component uses, their location on the major nodes of the public transport system and their ability to attract high volumes of people and trips.
At the time of its preparation, the regional approach to planning for Activity Centres in SEQ purposefully sought to move towards a network-based approach to centres planning in preference to more traditional approaches based on a hierarchy of retail centres. This was in recognition of the following inherent benefits of a network-based approach to centres planning:
• Consumer Behaviour and Private Travel Demand Management: A hierarchy and more specifically a “retail orientated” hierarchy implies a rigid order and scale of facilities with consumers making use of a selected group of facilities at each level in the hierarchy. A network approach suggests consumers will make use of a number of facilities at each individual level of the centres network. This is more compatible with the notion of multi-function, mixed-use centres that encourage multi-purpose trips thereby more effectively managing private travel demand.
• Non-Retail Uses: A network-based approach was seen as more conducive to the concept of certain centres potentially having a primary non-retail function or role. In this context the economic contribution of specialist and emerging activity centres was sought to be actively recognised at the regional level.
• Land Use and Transport Integration: A network-based approach placed heightened emphasis on the interdependence of centres and the importance of linkages between centres of both similar and differing functional order and composition. From this perspective, a network approach more positively reinforces the integration of land use and transport, and specifically emphasises the importance of efficient and effective public transport networks within and between centres.
• Relationship between Centres: In addition to broadening the functional diversity of centres, a network-based approach recognised the desirability of promoting synergistic relationships between centres of different functional composition and role at the sub-regional level. In this way, centres of alternative functional emphasis emerge and are complemented by centres having a different functional emphasis. (e.g. Alternative primary function may include Retail, Commercial, Tourist/Entertainment, Medical, Education/Research etc).

Retail & Commercial Sectors Needs Assessment 117 24 June 2013 12047 Report Rev 0
• The Role of Retail in determining Centre Function and Role: A network-based approach recognised retail as one, rather than the primary or only determinant of the centre order and function.
10.4.2 Planning Scheme Preparation Methodology
The methodology employed in the preparation of the Moreton Bay Regional Planning Scheme (MBRCPS) has purposefully sought to:
• adopt a regional interpretation of the SEQ Place Model (SPM);
• secure policy alignment with the SEQ Regional Plan 2009 – 2031 (SEQRP); and
• achieve compliance with the mandatory planning scheme format, content and drafting requirements of the Queensland Planning Provisions (QPP).
The Desired Regional Outcomes (DROs) of the SEQ Regional Plan have been interpreted and applied at a strategic level in respect of individual place types under the SEQ Place Model. The DROs have therefore provided a categorisation typology used to draft specific outcomes for each place type under the Strategic Framework.
10.4.3 Alignment of SEQ Regional Plan, Place Model and QPP Zoning Structure
Unquestionably, the plan preparation methodology employed in MBRC (which is briefly outlined in section 10.4.2) has many inherent benefits in terms of vertically aligning Council’s strategic planning policy with the key outcomes of the SEQ Regional Plan. Notwithstanding this, there are some intrinsic limitations associated with effectively translating the place based model into the more rigid zoning and code based structure mandated by the Queensland Planning Provisions (QPP).
The Activity Centre concept advocated and advanced at the SEQ Regional Plan level, can be seen to readily encompass two SEQ “place types” namely the “Activity Centre Place Type” and the “Enterprise and Employment Place Type”. For instance, the concept of the “Specialist Activity Centre” under SEQRP primarily identified regionally significant activity centres that had a non-retail/commercial focus, but which, notwithstanding, were key focal points of employment, investment or social significance to the community (e.g. major educational institutions etc).
The QPP mandates a more traditional zoning structure which requires land to be zoned to reflect its current or intended predominant use. The Centre Zones, which form part of the standard suite of zones namely:
• Principal Centre;
• Major Centre;
• District Centre;
• Local Centre; and
• Neighbourhood Centre
cater principally for activity centres with a primary retail and/or commercial focus, and encourage a functional hierarchy of those centres rather than emphasising a network approach, which was

Retail & Commercial Sectors Needs Assessment 118 24 June 2013 12047 Report Rev 0
more evident under the SEQRP. Recognising this framework the scope of the Retail and Commercial Sector Needs Study has necessarily sought to inform the future need for retail and commercial services in terms of a recommended hierarchy of Activity Centres.
Recommendations in section 10.6, further address how Activity Centres with a primary non-retail/commercial focus could be best accommodated through the QPP implementation framework. These non-retail/commercial activity centres may include some areas recognised as Enterprise or Employment Place types under the SEQ Place Model.
10.5 Planning Scheme Components
10.5.1 Introduction
The following section outlines a QPP compliant approach for the implementation of the key recommendations of the Retail and Commercial Sector Needs Assessment under the Draft Moreton Bay Regional Planning Scheme.
10.5.2 Strategic Framework
The QPP Version 3 (p. 14) notes as follows with respect to the Strategic Framework:
“The Strategic Framework:
• sets the policy position for the whole of the planning scheme area;
• identifies the future development intent for the planning scheme area;
• implements the regional plan (where relevant);
• is used in the assessment of impact assessable development;
• is used where the development does not comply with the applicable code(s).
The State’s interests are identified up front in the strategic framework and are expressed at the regional level through a regional plan and through state planning policies.”
The requirements of the QPP mandate the following section structure:
• strategic intent;
• theme;
• strategic outcomes;
• elements;
• specific outcomes;
• land use strategies.
Acknowledging the mandatory QPP requirements applicable to the Strategic Framework, the following matters are noted (with particular reference to Activity Centres):
• The Strategic Intent at section 3.2 of the draft strategic framework is QPP compliant but could benefit from being integrated with The Vision at section 3.1.2 of the draft strategic framework;

Retail & Commercial Sectors Needs Assessment 119 24 June 2013 12047 Report Rev 0
• The Themes at section 3.1.3 of the draft strategic framework correlate with the Desired Environmental Outcomes of the SEQ Regional Plan, and are therefore QPP compliant.
• Strategic Outcomes and Elements in sections 3.4 – 3.12 of the draft strategic framework are QPP compliant.
• Specific Outcomes in sections 3.14.2 – 3.14.14 of the draft strategic framework are QPP compliant.
• The Strategic Framework does not presently include Land Use Strategies. Land Use Strategies are a mandatory component of the Strategic Framework.
• In respect of Activity Centres, it is recommended that land use strategies articulated under the Strategic Framework could address items such as:
– Reinforcing the recommended Activity Centres Hierarchy and ensuring that the role, use, composition and intensity of development within individual centres accords with the applicable hierarchy level;
– Ensuring centres remain permeable and legible in order to maximise connectivity between key centre elements;
– Maximising non-motorised access to the centre (pedestrian and bicycle links);
– Providing direction on the preferred location, density and form of in-centre residential uses;
– Availability and accessibility to public transport;
– Use continuity and activity etc;
• It is recommended that Urban Structure Plans presently outlined in Part 2 of the MBRC Strategic Framework are referenced but not retained in the Strategic Framework. Alternatively it is recommended that they are integrated into the draft planning scheme as standalone Local Plans complying with Part 7 of the QPP.
10.5.3 Definitions
Use and Administrative definitions are required to comply with the mandatory suite of definitions outlined under Schedule 1 of the QPP.
It is recommended that Council utilise the scope provided under Schedule 1 of the QPP to cluster land use definitions into activity group clusters. Adopting the “Business activities” definitions cluster for example provides a means to minimise the unnecessary regulatory burden by ensuring that inconsequential changes in compatible commercial and retail uses occur without the need for subsequent development (MCU) approval. This is discussed further in section 10.5.4.
10.5.4 Tables of Assessment
Tables of Assessment are required to comply with mandatory requirements Part 5 of the QPP.
It is recommended that the assignment of assessment categories and use based thresholds within Activity Centres has due regard to maximising the “substitutability” or “interchangeability” of compatible commercial and retail uses via the exempt development or self-assessment categories

Retail & Commercial Sectors Needs Assessment 120 24 June 2013 12047 Report Rev 0
of the planning scheme. Subject to necessarily obvious variations related to centre order and function, uses which are readily interchangeable within centre precincts with minimal or no need for a subsequent MCU application could include:
• Car Park;
• Food and Drink Outlet;
• Garden Centre;
• Health Care Services;
• Office;
• Outdoor Sales;
• Sales Office;
• Service Industry;
• Shop;
• Showroom; and
• Veterinary Services.
10.5.5 Zones and Precincts
Part 6 of the QPP (p. 35) provides that Zones are:
“........ the primary organising layer of the planning scheme and all land within the planning scheme area must be included within a zone, with the exception of roads and Waterways”.
The QPP includes a “standard suite of zones”, and stipulates that only zones from the standard suite of zones can be used in the planning scheme.
The effective implementation of the recommended Activity Centres hierarchy is therefore predicated on utilising the Level 2 Centre Zones of the QPP which includes the following zones:
• Principal Centre Zone;
• Major Centre Zone;
• District Centre Zone;
• Local Centre Zone; and
• Neighbourhood Centre Zone.
Table 10.2 provides a comparison current and future centres classification taking into account:
• Existing MBRC Planning Schemes;
• SEQ Regional Plan (SEQRP);
• Queensland Planning Provisions (QPP); and
• Recommendations of the MBRC Retail and Commercial Sector Needs Study.
It is recommended that the Activity Centres Hierarchy derived under MBRC Retail and Commercial Sector Needs Study is adopted in the preparation of the MBRC SPA planning

Retail & Commercial Sectors Needs Assessment 121 24 June 2013 12047 Report Rev 0
scheme. This includes the reclassification of specified centres (as highlighted in Table 10.2 of the scheme).
Section 6.3 of QPP allows Precincts to be used within Zones to provide further refinement for specific areas within the Zone. We contend that the use of precincts may provide MBRC with a viable means of conveying “place based” variations in the preferred nature, character and intensity of development across centres zoned at one level of the hierarchy, but for which subtle variations in character are warranted. Precinct controls could be used for example to convey difference in the assessment status for individual uses, or variations to development standards between in a rural local centre and a coastal local centre.
Section 10.4 canvassed the potential difficulties arising from the application of the QPP in achieving alignment between the SEQ Regional Plan and SEQ Place Model. This relates to a subtle but significant difference in the approach to planning for activity centres. The SEQ Regional Plan advocated a network of activity centres where not all centres had a primary retail /commercial focus. Conversely however, the QPP mandates a more traditional zoning structure which requires land to be zoned to reflect its current or intended predominant use. The Centre Zones, which form part of the standard suite of zones namely:
• Principal Centre;
• Major Centre;
• District Centre;
• Local Centre; and
• Neighbourhood Centre
cater principally for activity centres with a primary retail and/or commercial focus, and encourage a functional hierarchy of those centres rather than emphasising a network approach. In the context of the SEQRP certain activity centres were recognised as “specialist centres”. These traditionally did not have a predominate retail/commercial focus, but nonetheless comprised significant focal concentrations of employment and/or investment and were key trip generators. Certain locations in MBRC some of which are encapsulated in the “Enterprise and Employment Place Type”, may warrant recognition as activity centres, albeit not retail and commercial activity centres (the key focus of this study). Having regard to the available mechanisms under the QPP, it is recommended that further consideration is given to the use of “Innovation Zone” or the “Specialised Centre Zone” as a means of adequately recognising these centres, and more effectively regulating development within them.
As noted in section 10.5.2, it is recommended that Structure Plans presently forming part of the Strategic Framework are included as standalone Local Area Plans. In this respect we recommend against incorporating structure plans into zone codes (an approach employed is some SPA Planning Schemes), as this adds unnecessary complexity to zone codes and diminishes the transparency and clarity of the underlying planning intent for the Zone concerned.
10.5.6 Local Plans
It is recommended that Urban Structure Plans presently outlined in Part 2 of the MBRC Strategic Framework are referenced but not retained in the Strategic Framework. Alternatively it is recommended that these are integrated into the draft planning scheme as standalone Local Plans complying with Part 7 of the QPP.

Retail & Commercial Sectors Needs Assessment 122 24 June 2013 12047 Report Rev 0
10.5.7 Overlays
Overlays have no direct relevance or beneficial application to centres planning other than regulating non centre-related constraints that may indirectly influence the nature or intensity of development within centres (e.g. building height within a centre precinct may be curtails by airport related obstacle considerations).
Part 8 of the QPP provides the scope to use overlays to identify areas of opportunity as well as constraints. Most notably the standard suite of overlays provides the opportunity for an Overlay to identify Transit Orientated Development (TOD) opportunities.
The use of such an overlay is not recommended for the purpose of identifying in-centre TOD opportunities, but rather it is suggested that such opportunities are conveyed under the Local Plans foreshadowed in section 10.5.6.
10.6 Planning and Implementation Recommendations
This section has sought to recommend a range of actions designed to effectively implement the key economic recommendations of the Retail and Commercial Sector Needs Study, in a manner that achieves compliance with the mandatory format, content and structural requirements of the Queensland Planning provisions.
Key statutory planning implementation recommendations may be summarised as follows:
10.6.1 Strategic Framework
The Strategic Framework is amended to:
• incorporate the mandatory inclusion of Land Use Strategies for Centre Precincts;
• remove the Urban Structure Plans presently outlined in Part 2 of the MBRC Strategic Framework and integrate them into the draft planning scheme as standalone Local Plans complying with Part 7 of the QPP. When recast as Local Plans they should be referenced in the Strategic Framework.
10.6.2 Definitions
It is recommended that Council utilise the scope provided under schedule 1 of the QPP to cluster land use definitions into activity group clusters, and in particular utilise the “Business activities” definitions cluster to reduce unnecessary regulatory burden in centres by ensuring that inconsequential changes in compatible commercial and retail uses can occur without the need for subsequent development (MCU) approval (i.e. using the exempt or self assessable provisions when changing from one business activity to another).
10.6.3 Tables of Assessment
It is recommended that the assignment of assessment categories and use based thresholds within Activity Centres has due regard to maximising the “substitutability” or “interchangeability” of compatible commercial and retail uses via the exempt development or self assessment categories of the planning scheme.
Retail & Commercial Sectors Needs Assessment 123 24 June 2013 12047 Report Rev 0
10.6.4 Zones and Precincts
It is recommended that the revised QPP compliant activity centres hierarchy recommended under Section 5.2 is adopted. This includes the reclassification of specified centres.
It is recommended that “Precincts” are used under individual zones to convey localised or “place based” variations in land use intent in terms of the preferred nature, character and intensity of development across centres zoned at one level of the hierarchy, where subtle variations in character are warranted. Precinct controls could be used to convey difference in the assessment status for individual uses, or variations to development standards between for example a rural local centre and a coastal local centre.
In the circumstance that Council elects to broaden its activity centres network to include activity centres that do not have a dominant retail/commercial focus, utilise the Innovation Zone and/or Specialised Centre Zones under the QPP to give practical effect to this outcome.
10.6.5 Local Plans
It is recommended that Urban Structure Plans presently outlined in Part 2 of the MBRC Strategic Framework are referenced but not retained in the Strategic Framework. Alternatively it is recommended that are integrated into the draft planning scheme as standalone Local Plans complying with Part 7 of the QPP.
10.6.6 Overlays
The use of an Overlay to identify Transit Orientated Development opportunities is not recommended. Rather it is suggested that such opportunities are conveyed under the foreshadowed Local Plans (being the recast Structure Plans).
10.6.7 Codes
It is recommended that a degree of discipline is applied in the typology used to identify the primary elements addressed under different code types (i.e. Zone, Overlay, Development, Local Area Plan). With respect to the codification of requirements applicable to centres, it is recommended that centre zones codes focus on those matters unique to zones, and that a Centre Design Code is prepared to address design issues uniformly applicable to all centres. This approach is recommended as a means of avoiding unnecessary duplication, and improving the clarity and efficiency of the planning scheme as a regulatory instrument.
10.6.8 Recommendations for Existing Centres
Table 10.1 below summarises the recommendations for existing centres.
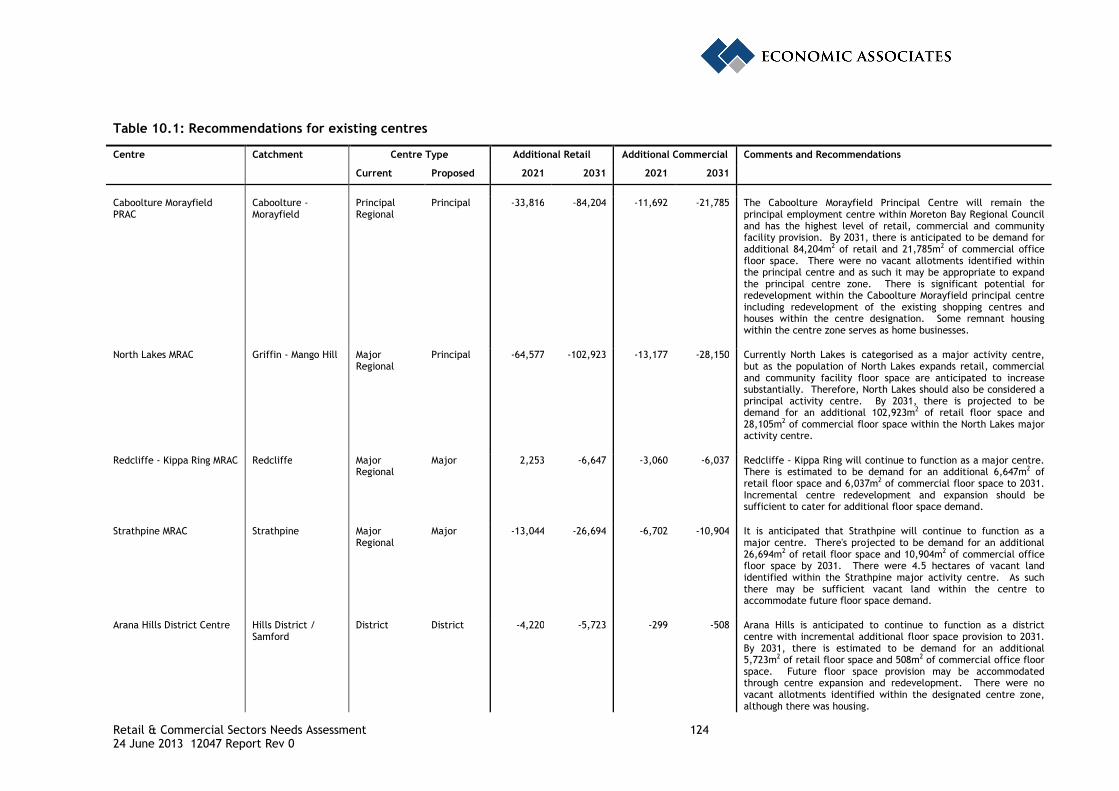
Retail & Commercial Sectors Needs Assessment 124 24 June 2013 12047 Report Rev 0
Table 10.1: Recommendations for existing centres
Centre Catchment Centre Type Additional Retail Additional Commercial Comments and Recommendations
Current Proposed 2021 2031 2021 2031
Caboolture Morayfield PRAC
Caboolture - Morayfield
Principal Regional
Principal -33,816 -84,204 -11,692 -21,785 The Caboolture Morayfield Principal Centre will remain the principal employment centre within Moreton Bay Regional Council and has the highest level of retail, commercial and community facility provision. By 2031, there is anticipated to be demand for additional 84,204m2 of retail and 21,785m2 of commercial office floor space. There were no vacant allotments identified within the principal centre and as such it may be appropriate to expand the principal centre zone. There is significant potential for redevelopment within the Caboolture Morayfield principal centre including redevelopment of the existing shopping centres and houses within the centre designation. Some remnant housing within the centre zone serves as home businesses.
North Lakes MRAC Griffin - Mango Hill Major Regional
Principal -64,577 -102,923 -13,177 -28,150 Currently North Lakes is categorised as a major activity centre, but as the population of North Lakes expands retail, commercial and community facility floor space are anticipated to increase substantially. Therefore, North Lakes should also be considered a principal activity centre. By 2031, there is projected to be demand for an additional 102,923m2 of retail floor space and 28,105m2 of commercial floor space within the North Lakes major activity centre.
Redcliffe - Kippa Ring MRAC Redcliffe Major Regional
Major 2,253 -6,647 -3,060 -6,037 Redcliffe - Kippa Ring will continue to function as a major centre. There is estimated to be demand for an additional 6,647m2 of retail floor space and 6,037m2 of commercial floor space to 2031. Incremental centre redevelopment and expansion should be sufficient to cater for additional floor space demand.
Strathpine MRAC Strathpine Major Regional
Major -13,044 -26,694 -6,702 -10,904 It is anticipated that Strathpine will continue to function as a major centre. There's projected to be demand for an additional 26,694m2 of retail floor space and 10,904m2 of commercial office floor space by 2031. There were 4.5 hectares of vacant land identified within the Strathpine major activity centre. As such there may be sufficient vacant land within the centre to accommodate future floor space demand.
Arana Hills District Centre Hills District / Samford
District District -4,220 -5,723 -299 -508 Arana Hills is anticipated to continue to function as a district centre with incremental additional floor space provision to 2031. By 2031, there is estimated to be demand for an additional 5,723m2 of retail floor space and 508m2 of commercial office floor space. Future floor space provision may be accommodated through centre expansion and redevelopment. There were no vacant allotments identified within the designated centre zone, although there was housing.

Retail & Commercial Sectors Needs Assessment 125 24 June 2013 12047 Report Rev 0
Centre Catchment Centre Type Additional Retail Additional Commercial Comments and Recommendations
Current Proposed 2021 2031 2021 2031
Albany Creek District Centre
Albany Creek District District -7,942 -11,006 -939 -1,772 Albany Creek is anticipated to continue to function as a district centre with incremental additional floor space provision to 2031. By 2031, there is estimated to be demand for an additional 11,006m2 of retail floor space and 1,772m2 of commercial office floor space. There were no vacant allotments identified within the designated centre zone, as such additional floor space provision would be accommodated through redevelopment of existing centres and / or expanding the centre zone.
Warner Village Central Pine West District District -10,733 -14,699 -1,935 -4,072 Warner Village is anticipated to function as a district centre as the population of the Central Pine West catchment grows and there is additional demand for retail and commercial floor space, and community facilities. By 2031, there is anticipated to be demand for an additional 14,699m2 of retail floor space and 4,072m2 of commercial office floor space. There were underutilised allotments identified within the Warner Village catchment that would potentially be able to accommodate future retail and commercial floor space demand. Given the additional floor space demand within the Central Pine West Catchment, the catchment and particularly Warner Village should be the subject of detailed planning.
Kallangur District Centre Dakabin-Kallangur-Murrumba Downs
District District -3,416 -5,332 -1,128 -1,496 Kallangur district centre will continue to function as a district centre with incremental increases in floor space provision. By 2031, there is projected to be demand for an additional 5,332m2 of retail floor space and 1,496m2 of commercial office floor space. There is limited capacity for centre expansion within the Kallangur district centre and as such it may be appropriate to expand the centre zone. The centre zone is currently a linear strip of approximately 1.15km along Anzac Avenue, Kallangur. It may be appropriate that any expansion to the centre zone be to the depth of the centre rather than the length. Alternatively, the old Tulip Town site could be considered for additional floor space provision.
Deception Bay Shopping Centre
Rothwell - Deception Bay
District District 4,593 1,557 -1,059 -1,360 The Deception Bay Shopping Centre is likely to continue to function as a district centre. There estimated to be sufficient provision of retail floor space within Deception Bay Shopping Centre zone.
Burpengary District Centre Burpengary - Narangba
District District 404 -7,787 -1,658 -5,557 The Burpengary district centre is likely to continue to function as a district centre. By 2031, there is anticipated to be demand for an additional 7,787m2 of retail floor space and 5,557m2 of commercial office floor space within the Burpengary district centre. There were two vacant allotments identified within the Burpengary district centre and as such there is potential for the expansion of existing centre and / or new centres.
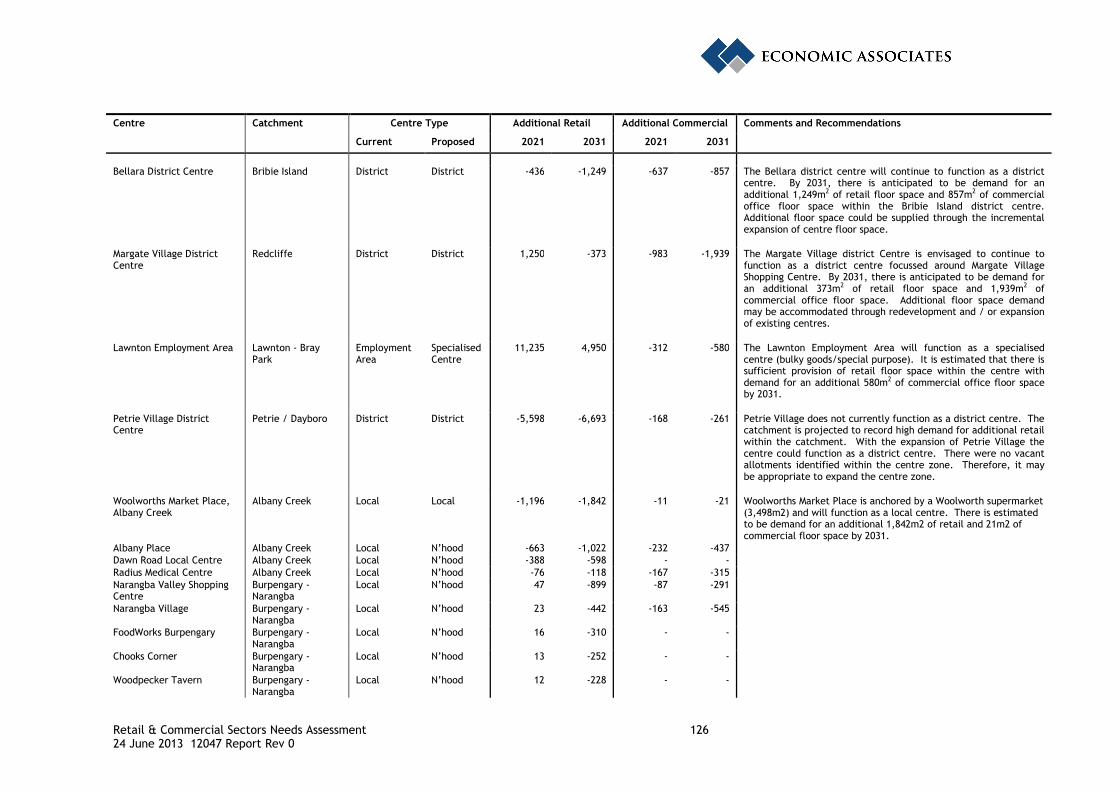
Retail & Commercial Sectors Needs Assessment 126 24 June 2013 12047 Report Rev 0
Centre Catchment Centre Type Additional Retail Additional Commercial Comments and Recommendations
Current Proposed 2021 2031 2021 2031
Bellara District Centre Bribie Island District District -436 -1,249 -637 -857 The Bellara district centre will continue to function as a district
centre. By 2031, there is anticipated to be demand for an additional 1,249m2 of retail floor space and 857m2 of commercial office floor space within the Bribie Island district centre. Additional floor space could be supplied through the incremental expansion of centre floor space.
Margate Village District Centre
Redcliffe District District 1,250 -373 -983 -1,939 The Margate Village district Centre is envisaged to continue to function as a district centre focussed around Margate Village Shopping Centre. By 2031, there is anticipated to be demand for an additional 373m2 of retail floor space and 1,939m2 of commercial office floor space. Additional floor space demand may be accommodated through redevelopment and / or expansion of existing centres.
Lawnton Employment Area Lawnton - Bray Park
Employment Area
Specialised Centre
11,235 4,950 -312 -580 The Lawnton Employment Area will function as a specialised centre (bulky goods/special purpose). It is estimated that there is sufficient provision of retail floor space within the centre with demand for an additional 580m2 of commercial office floor space by 2031.
Petrie Village District Centre
Petrie / Dayboro District District -5,598 -6,693 -168 -261 Petrie Village does not currently function as a district centre. The catchment is projected to record high demand for additional retail within the catchment. With the expansion of Petrie Village the centre could function as a district centre. There were no vacant allotments identified within the centre zone. Therefore, it may be appropriate to expand the centre zone.
Woolworths Market Place, Albany Creek
Albany Creek Local Local -1,196 -1,842 -11 -21 Woolworths Market Place is anchored by a Woolworth supermarket (3,498m2) and will function as a local centre. There is estimated to be demand for an additional 1,842m2 of retail and 21m2 of commercial floor space by 2031.
Albany Place Albany Creek Local N’hood -663 -1,022 -232 -437 Dawn Road Local Centre Albany Creek Local N’hood -388 -598 - - Radius Medical Centre Albany Creek Local N’hood -76 -118 -167 -315 Narangba Valley Shopping Centre
Burpengary - Narangba
Local N’hood 47 -899 -87 -291
Narangba Village Burpengary - Narangba
Local N’hood 23 -442 -163 -545
FoodWorks Burpengary Burpengary - Narangba
Local N’hood 16 -310 - -
Chooks Corner Burpengary - Narangba
Local N’hood 13 -252 - -
Woodpecker Tavern Burpengary - Narangba
Local N’hood 12 -228 - -

Retail & Commercial Sectors Needs Assessment 127 24 June 2013 12047 Report Rev 0
Centre Catchment Centre Type Additional Retail Additional Commercial Comments and Recommendations
Current Proposed 2021 2031 2021 2031
Narangba Station Plaza Burpengary -
Narangba Local N’hood 4 -75 -182 -609
Oakey Flat Road Burpengary - Narangba
Local N’hood 1 -25 - -
Wamuran Caboolture Midwest Local Local -5,784 -7,524 -476 -1,014 There is anticipated to be demand for an additional 7,524m2 of retail floor space and 1,014m2 of commercial office floor space within Wamuran. Given the significant demand for additional retail floor space Wamuran should be viewed as a local centre.
Elimbah Caboolture Midwest Local Local -2,700 -3,512 - - A number of vacant tenancies were identified within Elimbah. There is projected to be demand for an additional 3,512m2 of retail floor space within the centre. As such, there may be scope for expansion for the centre so that is functions as a local centre.
Excelsior Park Village Caboolture Midwest Local Local -2,320 -3,019 - - There is projected to be demand for an additional 3,019m2 of retail floor space within Excelsior Park Village. There may be scope for expansion on the centre so that is functions as a local centre.
Lilly Brook Shopping Village Dakabin-Kallangur-Murrumba Downs
Local Local -1,100 -1,717 -69 -91 Lilly Brook Shopping Centre is anchored by a Coles supermarket and is anticipated to function as a local centre. There is anticipated to by demand for an additional 1,717m2 of retail floor space and limited commercial office floor space to 2031.
Murrumba Downs Shopping Centre
Dakabin-Kallangur-Murrumba Downs
Local Local -821 -1,281 -193 -256 Murrumba Downs Shopping Centre is anchored by Coles supermarket. There is demand for an additional 1,281m2 of retail and 256m2 of commercial office floor space. The centre will function as a local centre.
Castle Hill Centre Dakabin-Kallangur-Murrumba Downs
Local N’hood -396 -618 -43 -57
Anzac Avenue Local Centre Dakabin-Kallangur-Murrumba Downs
Local N’hood -245 -383 - -
Dakabin Village Dakabin-Kallangur-Murrumba Downs
Local N’hood -133 -207 - -
Kallangur Village Shopping Centre
Dakabin-Kallangur-Murrumba Downs
Local N’hood -57 -89 - -
Samford Village Main Street Retailing
Hills District / Samford
Local Local -1,133 -1,537 -261 -445 Samford Village aims to cater for the day to day needs of a rural catchment. As such the centre will function as a local centre. There is demand for an additional 1,537m2 of retail floor space and 445m2 of commercial office floor space to 2031.
Ferny Way South Hills District / Samford
Local N’hood -574 -779 -157 -268

Retail & Commercial Sectors Needs Assessment 128 24 June 2013 12047 Report Rev 0
Centre Catchment Centre Type Additional Retail Additional Commercial Comments and Recommendations
Current Proposed 2021 2031 2021 2031
Everton Hills Shopping Centre
Hills District / Samford
Local Local -3,102 -4,207 -215 -365 Everton Hills Shopping Centre currently (2012) functions as a neighbourhood centre with a 714m2 IGA. There is demand for new centres within the Hills District / Samford catchment. However, it is recommended to expand the existing Everton Hills Shopping Centre to a local centre.
Samford Valley Hills District / Samford
Local N’hood -474 -643 -26 -45
Samford Central Hills District / Samford
Local N’hood -444 -602 -39 -67
Everton Shopping Village Hills District / Samford
Local N’hood -280 -380 -30 -51
Fernlands Village Hills District / Samford
Local Local -2,830 -3,839 -227 -386 The centre currently (2012) functions as a neighbourhood centre. However, there is demand for additional centres within the catchment and as such there may be scope for the centre to transition to a supermarket anchored local centre with demand for 3,839m2 of retail floor space and 386m2 of commercial floor space by 2031.
Samford Country Centre Hills District / Samford
Local N’hood -178 -241 -21 -36
Chinook Street Local Centre
Hills District / Samford
Local N’hood -159 -215 - -
170 Patricks Road Hills District / Samford
Local N’hood -135 -183 -36 -61
Arlington Court Hills District / Samford
Local N’hood -121 -164 - -
Ferny Way Local Centre Hills District / Samford
Local N’hood -105 -142 - -
Mt Glorious Hills District / Samford
Local N’hood -54 -73 -12 -20
Dayboro Petrie / Dayboro Local District -7,571 -9,052 -447 -693 Dayboro caters for the day to day needs of a geographically large rural catchment. Based on the additional floor space demand within the catchment, Dayboro could function as a district centre.
Beeville Road Local Centre Petrie / Dayboro Local N’hood -1,174 -1,403 -18 -28 Central Lakes Shopping Village
Caboolture - Morayfield
Local Local -1,572 -2,400 -1,071 -1,996 Central Lakes Shopping Village is anchored by a Woolworths supermarket and is anticipated to function as a local centre. There is projected to be demand for an additional 2,400m2 of retail and 1,996m2 of commercial office floor space.
Lear Jet Centre Caboolture - Morayfield
Local N’hood -856 -1,307 -276 -515
The Hub Convenience Centre
Caboolture - Morayfield
Local N’hood -757 -1,155 -2,159 -4,023
Trader Dukes Centre Caboolture - Morayfield
Local N’hood -663 -1,012 - -
Glenwood Drive Centre Caboolture - Morayfield
Local N’hood -414 -632 - -

Retail & Commercial Sectors Needs Assessment 129 24 June 2013 12047 Report Rev 0
Centre Catchment Centre Type Additional Retail Additional Commercial Comments and Recommendations
Current Proposed 2021 2031 2021 2031
Parkridge Shopping Village Caboolture -
Morayfield Local N’hood -348 -531 -190 -354
Bellmere Shopping Centre Caboolture - Morayfield
Local N’hood -291 -445 - -
Hillcrest Gardens Shopping Centre
Caboolture - Morayfield
Local N’hood -187 -286 -200 -373
The Big Fish Tavern Caboolture - Morayfield
Local Local -161 -246 - - The Big Fish Tavern is the site for the Sungate Business Park which will have an estimated 50,000m2 of floor space including retail, commercial and industrial and will be anchored by Woolworths.
Argyll Street Centre Caboolture - Morayfield
Local N’hood -95 -145 - -
Tullawong Corner Store Caboolture - Morayfield
Local N’hood -51 -79 - -
Lincoln Centre Strathpine Local N’hood -1,305 -1,535 -1,257 -2,045 Sandalwood Shopping Village
Strathpine Local N’hood -82 -96 -207 -337
Bell's Corner Strathpine Local N’hood -680 -800 -770 -1,253 Eatons Hill Hotel and Function Centre
Strathpine Local N’hood -1,603 -1,885 - -
Astley Parade Local Centre Griffin - Mango Hill Local Local -5,464 -7,912 -4,059 -8,672 Astley Parade Local Centre is anchored by an IGA supermarket (2,506m2) and is likely to function as a local centre. There is demand for an additional 7,912m2 of retail floor space and 8,672m2 of commercial office floor space by 2031.
North Lakes Convenience Centre
Griffin - Mango Hill Local Local -1,722 -2,494 -333 -711 Northlakes Convenience Centre currently functions as a neighbourhood centre. By 2031 there is projected to be demand for an additional 2,494m2 of retail floor space and 711m2 of commercial office floor space. There may be scope to expand the centre so that it will function as a local supermarket anchored centre.
Bunya Park Drive Convenience Centre
Central Pine West Local Local -2,380 -3,260 -851 -1,791 The centre currently (2012) functions as a neighbourhood centre. There may be scope for the centre to transition to a supermarket anchored local centre with demand for 3,260m2 of retail floor space and 1,791m2 of commercial floor space by 2031.
Eatons Hill Convenience Centre
Central Pine West Local N’hood -1,256 -1,720 -355 -747
Redcliffe IGA Redcliffe Local N’hood 337 -101 -328 -648 Landsborough Avenue Local Centre
Redcliffe Local N’hood 334 -100 -456 -899
Clontarf Bayside Plaza Redcliffe Local N’hood 155 -46 -184 -364 Redcliffe Coastal Strip Retail
Redcliffe Local N’hood 126 -37 -33 -65
Midways Convenience Centre
Redcliffe Local N’hood 99 -29 -18 -35
Mariners Plaza Redcliffe Local N’hood 84 -25 -21 -41
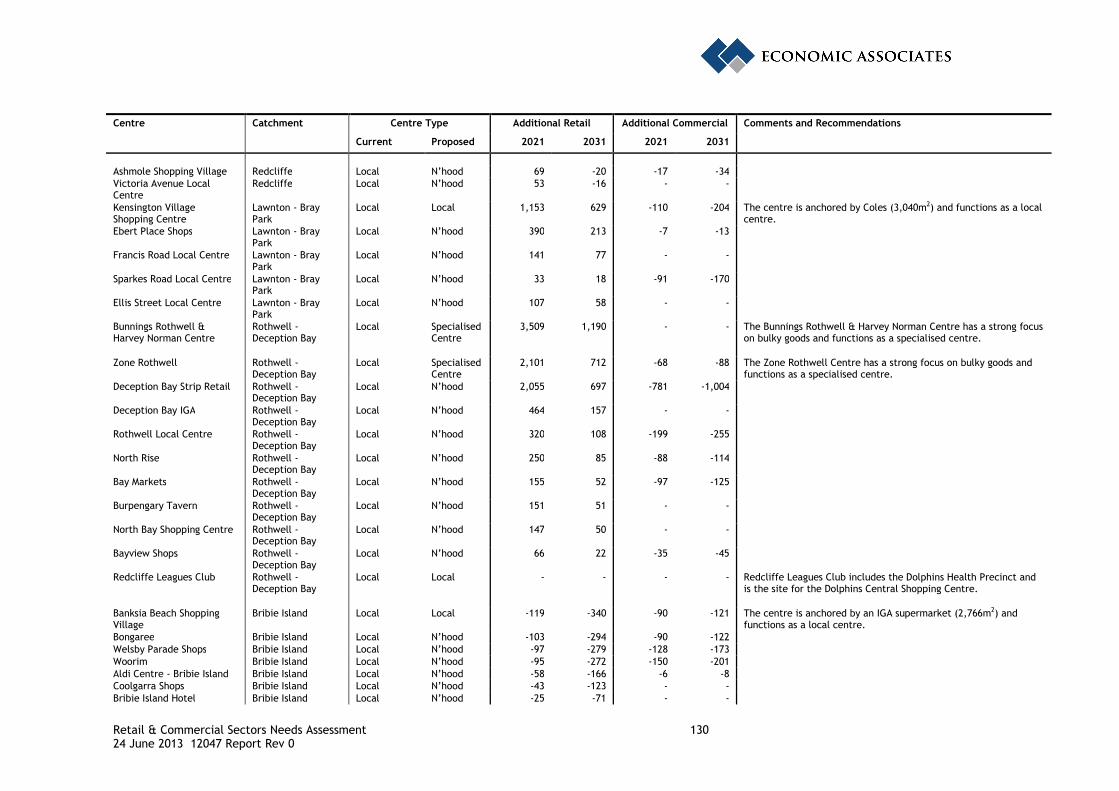
Retail & Commercial Sectors Needs Assessment 130 24 June 2013 12047 Report Rev 0
Centre Catchment Centre Type Additional Retail Additional Commercial Comments and Recommendations
Current Proposed 2021 2031 2021 2031
Ashmole Shopping Village Redcliffe Local N’hood 69 -20 -17 -34 Victoria Avenue Local Centre
Redcliffe Local N’hood 53 -16 - -
Kensington Village Shopping Centre
Lawnton - Bray Park
Local Local 1,153 629 -110 -204 The centre is anchored by Coles (3,040m2) and functions as a local centre.
Ebert Place Shops Lawnton - Bray Park
Local N’hood 390 213 -7 -13
Francis Road Local Centre Lawnton - Bray Park
Local N’hood 141 77 - -
Sparkes Road Local Centre Lawnton - Bray Park
Local N’hood 33 18 -91 -170
Ellis Street Local Centre Lawnton - Bray Park
Local N’hood 107 58 - -
Bunnings Rothwell & Harvey Norman Centre
Rothwell - Deception Bay
Local Specialised Centre
3,509 1,190 - - The Bunnings Rothwell & Harvey Norman Centre has a strong focus on bulky goods and functions as a specialised centre.
Zone Rothwell Rothwell - Deception Bay
Local Specialised Centre
2,101 712 -68 -88 The Zone Rothwell Centre has a strong focus on bulky goods and functions as a specialised centre.
Deception Bay Strip Retail Rothwell - Deception Bay
Local N’hood 2,055 697 -781 -1,004
Deception Bay IGA Rothwell - Deception Bay
Local N’hood 464 157 - -
Rothwell Local Centre Rothwell - Deception Bay
Local N’hood 320 108 -199 -255
North Rise Rothwell - Deception Bay
Local N’hood 250 85 -88 -114
Bay Markets Rothwell - Deception Bay
Local N’hood 155 52 -97 -125
Burpengary Tavern Rothwell - Deception Bay
Local N’hood 151 51 - -
North Bay Shopping Centre Rothwell - Deception Bay
Local N’hood 147 50 - -
Bayview Shops Rothwell - Deception Bay
Local N’hood 66 22 -35 -45
Redcliffe Leagues Club Rothwell - Deception Bay
Local Local - - - - Redcliffe Leagues Club includes the Dolphins Health Precinct and is the site for the Dolphins Central Shopping Centre.
Banksia Beach Shopping Village
Bribie Island Local Local -119 -340 -90 -121 The centre is anchored by an IGA supermarket (2,766m2) and functions as a local centre.
Bongaree Bribie Island Local N’hood -103 -294 -90 -122 Welsby Parade Shops Bribie Island Local N’hood -97 -279 -128 -173 Woorim Bribie Island Local N’hood -95 -272 -150 -201 Aldi Centre - Bribie Island Bribie Island Local N’hood -58 -166 -6 -8 Coolgarra Shops Bribie Island Local N’hood -43 -123 - - Bribie Island Hotel Bribie Island Local N’hood -25 -71 - -

Retail & Commercial Sectors Needs Assessment 131 24 June 2013 12047 Report Rev 0
Centre Catchment Centre Type Additional Retail Additional Commercial Comments and Recommendations
Current Proposed 2021 2031 2021 2031
Marine Parade Bribie Island Local N’hood -11 -31 - - Currong Shops Bribie Island Local N’hood -16 -46 - - Cotterill Shops Bribie Island Local N’hood -7 -19 - - Bellara Corner Store Bribie Island Local N’hood -3 -10 - - Elkhorn Avenue Bribie Island Local N’hood -3 -9 - - The Village Sandstone Point Caboolture East Local N’hood -1,113 -1,323 -70 -85 Beachmere Plaza Caboolture East Local N’hood -1,002 -1,191 -61 -74 Ningi Caboolture East Local N’hood -512 -609 -53 -65 Toorbul Caboolture East Local N’hood -229 -273 - - Donnybrook Caboolture East Local N’hood -89 -106 -16 -20 Woodford Shopping Centre Caboolture
Hinterland Local Local -223 -1,771 - - Woodford Shopping Centre is anchored by Woolworths (3,668m2)
and functions as a local centre. There might be scope to expand the centre with an additional 1,771m2 of retail floor space demand by 2031.
Woodford Strip Retail Caboolture Hinterland
Local N’hood -206 -1,633 -414 -864
Woodford Central Shopping Centre
Caboolture Hinterland
Local N’hood -88 -698 - -
D'Aguilar Caboolture Hinterland
Local N’hood -50 -398 - -
Note: Neighbourhood centre (n’hood) Note: a negative balance indicates an undersupply of floor space

Retail & Commercial Sectors Needs Assessment 132 24 June 2013 12047 Report Rev 0
10.7 Recommendations for Moderate and High Need Catchments
Section 9 of this report made allowances for the allocation of future floor space demand to new centres in moderate and high need catchments. This section of the report makes recommendations regarding the potential location of new centres within moderate and high need catchments. Recommendations pertain only to new Local Centres. It is recommended that the location of neighbourhood centres be left to market forces. This is because neighbourhood centres serve localised catchments and have limited impacts on infrastructure and the centres network more broadly.
10.7.1 Albany Creek
Need for additional floor space in the Albany Creek catchment is projected to increase from 13,631m2 by 2021 to 21,661m2, including need for 5,2361m2 of new centres by 2021 increasing to 8,303m2 in 2031 (Refer to Table 9.7), or one additional Local Centre by 2021.
In investigating the potential location of new centres, Moreton Bay Regional Council should consider locations that are highly accessible (e.g. along or adjacent to Old North Road and Albany Creek Road). Alternatively, Albany Place could be expanded to function as a local centre.
Figure 10.1: Albany Creek Catchment Centres

Retail & Commercial Sectors Needs Assessment 133 24 June 2013 12047 Report Rev 0
10.7.2 Burpengary – Narangba
There is need for 2,118m2 of floor space including 549m2 of new floor space by 2021. By 2031, there is anticipated to be need for an additional 26,701m2 of floor space including 9,680m2 of new centre floor space, or one new Local Centre by 2031.
Figure 10.2 below shows the centres within the Burpengary – Narangba catchment including the provision of new centres. Within the Narangba East Strategy, there is a recommendation for a new ‘Local Centre’ on Callaghan Road. The location of the recommended new centre fills a gap in the existing centres network. The new ‘Local Centre’ is described in the Narangba East Local Development Area Plan (LDAP) as having 1,000m2 of mixed commercial and retail floor space, which under the proposed centres hierarchy in this report (Section 5.4) is classified as a Neighbourhood Centre. The new ‘Local Centre’ as defined in the Narangba East LDAP would meet the need for new centre floor space to 2021. It is recommended that the new centre should transition to a Local Centre (as defined in Section 5.4) to meet the need for new centre floor space by 2031 (9,680m2).
The Narangba East LDAP also identifies a District Centre at the Narangba Rail Station with a total floor space of 17,000m2 split evenly between retail and commercial uses. Based on the preceding analysis there is probably not sufficient need to warrant a District Centre until well after 2021.
Figure 10.2: Burpengary – Narangba Catchment Centres
Note: Location of new centres are based on the Narangba East Local Development Area Plan and are indicative only.

Retail & Commercial Sectors Needs Assessment 134 24 June 2013 12047 Report Rev 0
10.7.3 Caboolture Midwest
The Caboolture Midwest catchment covers a geographically large area with moderate need for additional floor space. There is need for an additional 18,686m2 of floor space by 2021 including 7,407m2 of new centre floor space, or need for a new Local Centre. By 2031, there is estimated to be need for 24,874m2 of total floor space including 9,805m2 of new centre floor space, or one – two new Local Centres (Refer to Table 9.9).
It is recommended that the existing centres of Wamuran, Elimbah and Excelsior Park Village become Local Centres that provide a rural service centre function. Hence, these centres may provide some higher order facilities in recognition of this service centre function. These three centres currently function as neighbourhood centres. The Caboolture Midwest catchment includes the Caboolture West Master Plan Area. This report does not consider the implications of developing the Caboolture West Master Plan Area. Recommendations pertaining to the Caboolture West Master Plan Area are provided in the Caboolture West Master Planned Area: Centres Hierarchy Options report.
Figure 10.3: Caboolture Midwest Catchment Centres
10.7.4 Dakabin – Kallangur – Murrumba Downs
Figure 10.4 below shows the centres within the Dakabin – Kallangur – Murrumba Downs catchment. There is need for an additional 12,667m2 of total floor space in the catchment by 2021 increasing to 19,212m2 by 2031(Refer to Table 9.10). Need is estimated at 5,067m2 of new

Retail & Commercial Sectors Needs Assessment 135 24 June 2013 12047 Report Rev 0
centre floor space by 2021 increasing to 7,685m2 by 2031, or need for one additional Local Centre.
The Dakabin Local Area Plan (LAP) recommends locations for new centres on Alma Road. The new centre identified to the northern side of Alma Road at its western end has a maximum floor area of 500m2. The centre is anticipated to include a small convenience store (250m2) and approximately 250m2 of other specialty tenancies. The second centre identified in the Dakabin LAP located on the south-western corner of the Old Gympie Road and Alma Road intersection has a maximum floor area of 1,000m2. The centre is anticipated to include a small convenience store (450m2) and specialty tenancies (550m2). Under the proposed centres hierarchy (Section 5.4) the centres would be classified as Neighbourhood Centres.
Based on the needs assessment, these two new centres are recommended to remain at a Neighbourhood Centre level until after 2021.
Figure 10.4: Dakabin – Kallangur – Murrumba Downs Catchment Centres
Note: Location of new centres are based on the Narangba East Local Development Area Plan and are indicative only.

Retail & Commercial Sectors Needs Assessment 136 24 June 2013 12047 Report Rev 0
10.7.5 Hills District / Samford
The Hills District / Samford catchment covers a geographically large area and is projected to have moderate need for additional floor space to 2031. Need is estimated at an additional 15,615m2 of total floor space and 6,110m2 of new centre floor space by 2021, increasing to 21,647m2 of total floor space and 8,428m2 of new centre floor space by 2031 (Refer to Table 9.11).
The key recommendation for this catchment is that the Everton Hills Shopping Centre and Fernlands Village centres (currently Neighbourhood Centres) transition to function as Local Centres. Fernlands Village is located on Woodhill Road, Ferny Hills and Everton Hills Shopping Centre is located on the corner of Queens and South Pine Roads, Everton Hills.
Figure 10.5: Hills District / Samford Catchment Centres
10.7.6 Petrie / Dayboro
Figure 10.6 below shows the centres within the Petrie / Dayboro catchment. Petrie Village currently does not function as a district centre. However, there is anticipated to be moderate need for additional floor space within the catchment, 14,975m2 of total floor space in 2021 including 5,927m2 of new centre floor space (Refer to Table 9.12). With expansion of Petrie Village it is anticipated to function as a District Centre. Petrie has long been expected to operate as a District Centre but has failed to do so. Its ability to fulfil this role in the future may ultimately rely on significant redevelopment of the centre.
Dayboro caters for the day to day needs of a geographically large rural catchment. Based on the needs analysis for the catchment, Dayboro could function as a District Centre.

Retail & Commercial Sectors Needs Assessment 137 24 June 2013 12047 Report Rev 0
Figure 10.6: Petrie / Dayboro Catchment Centres
10.7.7 Caboolture – Morayfield
Within the Caboolture – Morayfield catchment, there is anticipated to be need for an additional 66,791m2 of total floor space including 11,990m2 of new centres floor space by 2021, or one to two new Local Centres. By 2031, there is estimated to be need for an additional 141,105m2 of total floor space including 19,618m2 of new centres floor space, or two to three new Local Centres (Refer to Table 9.13). It is recommended that a new Local Centre be located on Oakey Flat Road. Oakey Flat Road has high exposure and the site was identified in the Moreton Bay Regional Council Draft Strategic Framework.
The Caboolture – Morayfield catchment can be expected to host a number of new Neighbourhood Centres as residential areas are taken up and rural residential areas infill.

Retail & Commercial Sectors Needs Assessment 138 24 June 2013 12047 Report Rev 0
Figure 10.7: Caboolture – Morayfield Catchment Centres
Note: Location of new centres are based on the Moreton Bay Regional Council Draft Strategic Framework and are indicative only.
10.7.8 Griffin – Mango Hill
Within the Griffin – Mango Hill catchment there is projected to be high need for additional floor space of approximately 104,505m2 by 2021, including 15,172m2 of new centre floor space, or two to three Local Centres. By 2031, there is estimated to be demand for 175,853m2 of total floor space and 24,991m2 of new centre floor space, or three to four new Local Centres (see Table 9.14).
Figure 10.8 below shows the recommended new centre locations for the Griffin – Mango Hill catchment. New centres within the Griffin – Mango Hill catchment follow the Griffin Location Area Plan (LAP) and the Mango Hill Local Area Plan (LAP).
In the Mango Hill LAP there are four local centres identified, namely:
• Mango Hill Village Centre: located in the vicinity of the intersection of Kinsellas Road West, Lamington Street and Chelmsford Road. The centre is to have a gross leasable area of 700m2 with no individual tenancy larger than 500m2;
• Halpine Drive Centre: located on the eastern side of Halpine Drive and south of the Mango Hill Ring Road. The centre is to have a combined maximum of 2,500m2 gross leasable area with a maximum individual tenancy size of 1,000m2;

Retail & Commercial Sectors Needs Assessment 139 24 June 2013 12047 Report Rev 0
• Kinsella Heights Centre: located around the intersection of the Mango Hill Ring Road. The centre will have a combined maximum gross leasable area of 3,000m2 of retail uses with a maximum individual tenancy size of 1,000m2; and
• Convenience Centre – Southern Centre: located near the North – South Urban Arterial Road. The centre is intended to contain convenience uses and a 24-hour service station. The centre will have a combined maximum of 600m2 gross leasable area with a maximum individual tenancy size of 300m2.
In the Griffin LAP there are two local centres identified, namely:
• LA-1: located to the north of Brays Road in close proximity to the North – South Urban Arterial Road. Maximum gross floor area of 1,800m2 including a small convenience store of approximately 500m2 and specialty retail of 1,300m2; and
• LA-2: located to the northern side of Dohles Rocks Road, close to the Bruce Highway. Maximum gross floor area of 1,800m2 including a small convenience store of approximately 500m2 and specialty retail of 1,300m2.
Each of the local centres identified in the Mango Hill and Griffin LAPs are considered Neighbourhood Centres under the proposed centres hierarchy (Section 5.4). It is recommended that some of these Neighbourhood Centres transition to Local Centres by 2021, including:
• Halpine Drive Centre located on the eastern side of Halpine Drive and south of the Mango Hill Ring Road;
• Kinsella Heights Centre located around the intersection of the Mango Hill Ring Road; and
• LA-1 located to the north of Brays Road in close proximity to the North – South Urban Arterial Road.

Retail & Commercial Sectors Needs Assessment 140 24 June 2013 12047 Report Rev 0
Figure 10.8: Recommended location of new centres, Griffin – Mango Hill catchment
Note: Locations of new centres are based on the Griffin LAP and the Mango Hill LAP and are indicative only.
10.7.9 Strathpine
Figure 10.9 below shows the recommended location for the addition of a local centre within the Strathpine catchment. Need is estimated at an additional 33,390m2 of total floor space including 7,739m2 of new centres floor space by 2021, or one new Local Centre (Refer to Table 9.15). By 2031, there is anticipated to be need for 55,655m2 of total floor space and 10,107m2 of new centre floor space, or one to two new Local Centres.
The recommended site for the location of a new centre is in the vicinity of the intersection of Samsonvale Road and Livingstone Street, Strathpine, to the west of Gympie Road. Samsonvale Road provides an overpass for the railway line and a signalised intersection on Gympie Road. The site was identified in the Moreton Bay Regional Council Draft Strategic Framework.

Retail & Commercial Sectors Needs Assessment 141 24 June 2013 12047 Report Rev 0
Figure 10.9: Recommended location of new centres, Strathpine catchment
Note: Locations of new centres are based of the Moreton Bay Regional Council Draft Strategic Framework and are indicative only.
10.7.10 Central Pine West
Within the Central Pine West catchment there is estimated to be need for an additional 39,848m2 of total floor space including 22,339m2 of new centre floor space by 2021, or three to four new Local Centres (Refer to Table 9.16).
The Central Pine West catchment is a relatively high growth area (population growth rate of 2.3% per annum) and currently has low provision of retail and commercial floor space (13,149m2). Because of the significant projected future need and the importance of centre locations in anchoring the urban form, it is recommended that the identification of new centre sites in Central Pine West is the subject of detailed planning.

Retail & Commercial Sectors Needs Assessment 142 24 June 2013 12047 Report Rev 0
Figure 10.10: Central Pine West Catchment Centres

Retail & Commercial Sectors Needs Assessment 143 24 June 2013 12047 Report Rev 0
11 REFERENCES
Australian Bureau of Statistics (2011a) Population by Age and Sex, Regions of Australia, Catalogue No. 3235.0
Australian Bureau of Statistics (2011b) Household Expenditure Survey, Australia: Summary of Results, 2009-10, Catalogue No. 6530.0
Australian Bureau of Statistics (2012a) 2011 Census of Population and Housing, 2nd release data, Catalogue No. 2001.0
Australian Bureau of Statistics (2012b) Counts of Australian Businesses, including entries & exits, Catalogue No. 8165.0
Australian Bureau of Statistics (2012c) Regional Population Growth, Australia 2011, Catalogue No. 3218.0
Department of Employment & Workplace Relations (various years) Small Area Labour Market data, unsmoothed series
Department of State Development, Infrastructure & Planning (2009) South East Queensland Regional Plan, 2009-2031
Department of State Development, Infrastructure & Planning (2011) Next Generation Planning: A handbook for planners, designers and developers in South East Queensland
Growth Management Queensland (2011) Draft Queensland Planning Provisions Version 3.0, October 2011
Moreton Bay Regional Council (2010) Moreton Bay Regional Council Economic Development Strategy Report
Moreton Bay Regional Council (2011a) Moreton Bay Region Community Plan, 2011-2021
Moreton Bay Regional Council (2011b) The Redcliffe City Planning Scheme: 2005
Moreton Bay Regional Council (2011c) Mango Hill Infrastructure Development Control Plan
Moreton Bay Regional Council (2012a) Planning Assumptions Specification – October 2012
Moreton Bay Regional Council (2012b) The Moreton Bay Regional Council Draft Strategic Framework
Moreton Bay Regional Council (2012c) Moreton Bay Regional Council Corporate Plan, 2012-2017
Moreton Bay Regional Council (2012d) Caboolture ShirePlan: 2005
Moreton Bay Regional Council (2012e) PineRiversPlan: 2006
Office of Economic and Statistical Research (2011) Queensland Government Population Projections: Queensland and Statistical Divisions, medium series
Office of Economic and Statistical Research (2012) Household and Dwelling Projections, Queensland
Property Council of Australia (2012) Queensland Shopping Centre Directory 2012

Retail & Commercial Sectors Needs Assessment 144 24 June 2013 12047 Report Rev 0
APPENDIX A
LITERATURE REVIEW

Retail & Commercial Sectors Needs Assessment 145 24 June 2013 12047 Report Rev 0
MBRC Corporate Plan
The MBRC Corporate Plan 2012-2017 sets out Moreton Bay Regional Council’s mission, which is as follows:
We will serve the community to create a region of opportunity and a vibrant lifestyle, while focussing on excellence and sustainability.
The MBRC Corporate Plan also highlights the five main values of Council, these being:
• Respect;
• Service;
• Integrity;
• Teamwork; and
• Sustainability
Figure A.1 below outlines how Moreton Bay Regional Council upholds its values.
Figure A.1: Values of Moreton Bay Regional Council
Source: Moreton Bay Regional Council Corporate Plan, 2012-2017

Retail & Commercial Sectors Needs Assessment 146 24 June 2013 12047 Report Rev 0
The Corporate Plan identifies service targets within the following areas:
• Business development; • Tourism; • Land use and infrastructure planning; • Community safety; • Disaster management; • Community capacity building; • Community support services; • Office of the CEO; • Customer services; • Legal; • Development assessment; • Building and plumbing services; • Local laws; • Public health services; • Environmental initiatives; • Waste collection, reduction and recycling; • Roads and transport; • Stormwater infrastructure; • Waterways and coastal facilities;; • Parks; • Sport and recreation; • Community facilities; • Libraries; • Cultural services; • Events; • Infrastructure support; • Infrastructure delivery; • Building and facilities; • Fleet; • Communications; • Corporate finance; • Financial services; • Human resources; • Information management; • Information technology; and • Property services.
MBRC Community Plan
The Moreton Bay Region Community Plan 2011 - 2021 (p. 3) provides a ten year vision for Moreton Bay Regional Council. The vision statement for the region is as follows:
“A thriving region of opportunity where our communities enjoy a vibrant lifestyle. Our vision is for:
• A region of opportunity for all;
• A region with safe, strong and inclusive communities; and
• A region that celebrates our vibrant lifestyle.”
Under the three broad visions, a number of targets have been defined as follows:

Retail & Commercial Sectors Needs Assessment 147 24 June 2013 12047 Report Rev 0
A region of opportunity for all Target 1: Increase the overall value of the regional economy; Target 2: Increase the number of Moreton Bay residents working within the region; Target 3: Three out of four Moreton Bay Region residents will hold trade, training or tertiary qualifications; Target 4: Promote affordable living and diversity of housing choice; Target 5: Improve regional planning and development outcomes; Target 6: Aim for new dwelling targets as stated in the South East Queensland Regional Plan; Target 7: Increase the number of households with a broadband internet connection; Target 8: Increase the online web presence of local businesses; and Target 9: Increase the number of households using broadband internet to transact and engage with Moreton Bay Regional Council.
A region with safe, strong and inclusive communities
Target 10: Reduce the instance of crime in the region per capita; Target 11: Increase public awareness of personal safety; Target 12: Increase the resilience of communities and businesses to a disaster; Target 13: Cut by one third obesity, smoking, heavy drinking and unsafe sun exposure; Target 14: Improve the socio-economic profile of local communities; Target 15: Increase by fifty percent the proportion of residents involved in their communities as volunteers; Target 16: Increase residents’ overall satisfaction with Council; Target 17: Ensure the ongoing financial sustainability of Council; and Target 18: Promote a sense of community pride in the region.
A region that celebrates our vibrant lifestyle
Target 19: Improve the condition and extent of high-value vegetation and protect native species; Target 20: Increase the health and resilience of waterways and coastal areas; Target 21: Increase the recovery of resources from waste per capita; Target 22: Cut by one third Moreton Bay Region’s carbon footprint per household; Target 23: Increase use of public transport; Target 24: Increase walking and cycling as methods of transport; Target 25: Promote a safe and effective road network in the region; Target 26: Improve the provision and maintenance of accessible and connected networks of open space; Target 27: Sustainable use of open space including parks and sporting fields; Target 28: Increase the number of Moreton Bay residents undertaking physical activity; and Target 29: Increase the number of people participating in events and cultural activity.
For each target, the Community Plan outlines the lead agencies, measure/s available to track progress (including the baseline data sources for each measure), first steps required to meet the target, risks and opportunities associated with each target and reporting progress.
Figure A.2 below highlights how the Community Plan relates to Council’s Integrated Corporate Reporting Structure.

Retail & Commercial Sectors Needs Assessment 148 24 June 2013 12047 Report Rev 0
FigureA.2: Integrated Corporate Reporting Structure of Moreton Bay Regional Council
Source: Moreton Bay Region Community Plan, 2011-2021
MBRC Economic Development Strategy
The MBRC Economic Development Strategy provides long-term strategic direction for the economic growth and vitality of the Moreton Bay Region.
The MBRC Economic Development Strategy identified five specific growth opportunities for the Moreton Bay Region with high value adding activity, as follows:

Retail & Commercial Sectors Needs Assessment 149 24 June 2013 12047 Report Rev 0
Building product manufacturing • Metal product manufacturing; • Cement, lime, plaster and concrete manufacturing; • Pre-fabricated building manufacturing;
Machinery and equipment manufacturing • Industrial M&E manufacturing; • Medical device manufacturing; • Professional equipment manufacturing; • Speciality transportation equipment manufacturing; • Solar manufacturing;
Food and beverage manufacturing • Baked goods; • Processed foods; • Beverages;
Professional services • Professional services; • Back office/processing centres; • Business customer service centres; • Training centres;
Transport and logistics • Distribution centres; and • Logistics operations
The document highlights the rationale for the identification of these opportunities but does not detail a strategy to specifically target these sectors.
The vision for the Moreton Bay Region, as outlined in the Economic Development Strategy is as follows:
To foster a vibrant, sustainable and knowledge-driven economy that creates valuable employment for residents, protects the region’s high quality of life and provides a prosperous future for all residents.
Figure A.3 below outlines the vision, economic development directives and goals of the Moreton Bay Regional Council Economic Development Strategy.

Retail & Commercial Sectors Needs Assessment 150 24 June 2013 12047 Report Rev 0
Figure A.3: Vision, Economic Development Directives and Goals of the MBRC Economic Development Strategy
Source: Moreton Bay Regional Council Economic Development Strategy
State Level Planning Documents
South East Queensland Regional Plan 2009-2031
The South East Queensland Regional Plan (SEQRP) 2009-2031 is the Queensland State Government’s statutory document to guide growth and development in South East Queensland until 2031. The SEQ Regional Plan reflects and informs state planning policy and priorities and informs local government plans and policies. The document identifies a spatial framework for South East Queensland that defines a regional land use pattern for medium and long-term growth.
Centre Hierarchy/Network Methodology
The SEQ Regional Plan operates an ‘Activity Centres Network’. The network of centres consists of the following elements:
• Primary Activity Centre
• Principal regional activity centres
• Major regional activity centres
• Specialist activity centres

Retail & Commercial Sectors Needs Assessment 151 24 June 2013 12047 Report Rev 0
• Principal rural activity centres
• Major rural activity centres
Centre Attributes
The Activities Centres include the following attributes:
• Primary Activity Centre - The Brisbane central business district (CBD) is the region’s primary activity centre. It has a state-wide function; it is the key focus of government administration, retail, commercial, and specialised personal and professional services. It accommodates cultural, entertainment, health and education facilities of a state, national, and international significance.
• Principal regional activity centres - Serve catchments of regional significance and accommodate key employment concentrations. They provide a secondary administrative focus. They serve as a key focal point for regional employment and in-centre regional development. They have existing dedicated public transport and development densities should be around 40-120 dwellings per hectare.
• Major regional activity centres – are centres that complement the principal regional activity centre by serving catchments of sub-regional significance and accommodates key employment concentrations. These centres are located around key suburban public transport stops. Residential development should be 30-80 dwellings per hectare or greater.
• Specialist activity centres - are centres of regional economic significance. They provide a primary focus for specialised economic activity, employment or education rather than having a retail function.
• Principal rural activity centres – are important service and community hubs in rural areas. They have excellent road and basic public transport links.
• Major rural activity centres - are rural towns that provide more than one function to the surrounding rural catchment. They provide concentrated retail, commercial, community and some government services. They have excellent road connections and possibly public transport services.
Relevance to the Moreton Bay Regional Council region
• The SEQRP is a statutory document and the provisions of the SEQRP must be considered in the development of the MBRC Planning Scheme.
• The SEQRP identifies Caboolture, Morayfield, Redcliffe, North Lakes and Strathpine as ‘Major Regional Activity Centres’.
Centres Regulation
• The SEQRP regulates centres planning through the ‘South East Queensland Regional Plan 2009-2031 State Planning regulatory provisions’. The Regulatory provisions only apply to land outside the “Urban Footprint”.

Retail & Commercial Sectors Needs Assessment 152 24 June 2013 12047 Report Rev 0
Implications for MBRC Retail & Commercial Sectors Needs Assessment
• The SEQRP is a statutory document and the MBRC Planning Scheme must ensure centres design provisions within the new scheme align with the elements of the SEQRP.
• The SEQRP identifies the following as Major Regional Activity Centres
– Caboolture,
– Morayfield,
– Redcliffe; and
– North Lakes
Draft Queensland Planning Provisions v3
The Queensland Planning Provisions (QPP) are the standard planning scheme provisions made under the Sustainable Planning Act 2009 (SPA) that provide a consistent format and structure for local government planning schemes across Queensland. The QPP is to be used to guide local governments in the preparation of their new SPA compliant Planning Scheme(s).
Centre Hierarchy/Network Methodology
• The QPP operates a ‘Hierarchy’ Centres Methodology. The hierarchy of centres consists of the following elements:
– Principal Centre
– Major Centre
– District Centre
– Local Centre
– Neighbourhood Centre
Centre Attributes
• The Activities Centres include the following attributes:
– Principal Centre – is to provide for the largest and most diverse mix of uses and activities to form that forms the core of an urban settlement. It includes key concentrations of high-order retail, commercial, administrative, community, cultural, recreational and entertainment activities which are capable of servicing the planning scheme area.
– Major Centre – is to provide for a mix of uses and activities. It includes key concentrations of higher order retail, commercial, offices, residential, administrative and health services, community, cultural and entertainment facilities which are capable of servicing a subregion in the planning scheme area.
– District Centre – is to provide for a mix of uses and activities. It includes a concentration of land uses including retail, commercial, residential, offices, administrative and health services, community, small-scale entertainment and recreational facilities capable of servicing a district.

Retail & Commercial Sectors Needs Assessment 153 24 June 2013 12047 Report Rev 0
– Local Centre – is to provide for a limited range of land uses and activities to service local needs. It includes local shopping, local employment nodes, commercial, cafes and dining, entertainment, community services and residential development where it can integrate and enhance centre activity but it is not the predominant use.
– Neighbourhood Centre – is to provide for a small mix of land uses to service residential neighbourhoods. It includes small-scale convenience shopping, professional offices, community services and other uses which directly support the immediate community.
Relevance to the Moreton Bay Regional Council region
• The QPP provides a guide for Local Governments in the preparation of their SPA compliant planning schemes and contains mandatory components which the local government, including MBRC, must use.
• The QPP includes a ‘Centre Zones Category’ which sets out the types of centre zones which must be incorporated in the MBRC Planning Scheme.
• As part of the Strategic Framework (and in conjunction with QPP) MBRC has identified:
– Caboolture Morayfield - principal activity centre;
– Strathpine, Redcliffe/Kippa-Ring and North Lakes - major activity centres, and
– Arana Hills, Albany Creek, Warner, Petrie, Kallangur, Margate, Deception Bay. Burpengary, and Bellara – district activity centres
Centres Regulation
• Chapter six of the QPP outlines the mandatory components with regard to ‘Zones’. ‘Zones’ are the primary organising layer of the planning scheme and all land within the planning scheme area must be included within a zone. The QPP includes a ‘Centre Zones Category’ which sets out the types of centre zones which must be included.
Centres Design
The Centres zones category in the QPP sets out design outcomes for centres including:
• Development is established in accessible and well-connected locations;
• Development is designed to incorporate sustainable practices including energy efficiency, water conservation and public/active transport; and,
• Development is reflective of and responsive to environmental constraints.
Implications for MBRC Retail & Commercial Sectors Needs Assessment
• The QPP provides a guide for Local Governments in the preparation of their SPA compliant planning schemes and contains mandatory components which the local government, including MBRC, must use.
• The QPP includes a ‘Centre Zones Category’ which sets out the types of centre zones which must be incorporated in the MBRC Planning Scheme.
• As part of the Strategic Framework (and in conjunction with QPP provisions) MBRC has identified:

Retail & Commercial Sectors Needs Assessment 154 24 June 2013 12047 Report Rev 0
– Principal activity centre
o Caboolture;
o Morayfield;
– Major activity centres
o Strathpine;
o Redcliffe/Kippa-Ring; and
o North Lakes;
– District activity centres
o Arana Hills;
o Albany Creek;
o Warner;
o Petrie;
o Kallangur;
o Margate;
o Deception Bay;
o Burpengary, and
o Bellara.
Next Generation Planning – A Handbook for Planners 2011
The Next Generation Planning handbook provides a framework of new ways for planning for the suburbs, towns and cities of South East Queensland. The handbook provides a practical resource for planners, designers and developers to implement the concepts in planning schemes. The Handbook uses ‘Place Model’ to provide a framework to articulate strategic outcomes for Planning Scheme.
Centre Hierarchy/Network Methodology
• The Next Generation Planning handbook operates a ‘Hierarchy’ Centres Methodology. The hierarchy of centres consists of the following elements:
– Centres of Activity
– CBDs
Centre Attributes
• The Activities Centres include the following attributes:
– Centres of Activity – have concentrations of non-residential activities such as shopping, employment, higher education and entertainment. They vary in scale from local to district and regional. They are a focus of transport networks, and a hub for public transport and pedestrian/cycling systems. Housing is contained within the centres of activity,

Retail & Commercial Sectors Needs Assessment 155 24 June 2013 12047 Report Rev 0
predominately as apartments. Buildings have little to no setback to the street and the street layout is usually grid-based.
– CBDs – are the centres of cities and are the largest centres. They have the widest range and greatest intensity of activity within cities. They are laid out in in a grid and are at the centre of transport networks for public transport, cycling and pedestrians. These centres are key focal points for the community, providing employment, business and entertainment and area are important to the economy of the city.
Relevance to the Moreton Bay Regional Council region
• Moreton Bay Regional Council have used the SEQ Place Model within the Next Generation Planning handbook as the base model for the Region’s Draft Strategic Framework; and
• MBRC have identified the following centres of activity:
– Principal activity Principal activity centre
o Caboolture;
o Morayfield;
– Major activity centres
o Strathpine;
o Redcliffe/Kippa-Ring; and
o North Lakes;
– District activity centres
o Arana Hills;
o Albany Creek;
o Warner;
o Petrie;
o Kallangur;
o Margate;
o Deception Bay;
o Burpengary, and
o Bellara.
• It is noted that the MBRC has only incorporated Activity Centres as part of the Draft Strategic Framework and has not identified CBDs
Centres Design
• Housing is contained within the centres of activity, predominately as apartments.
• Buildings have little to no setback to the street and the street layout is usually grid-based.
• CBDs act as a focal place for the region

Retail & Commercial Sectors Needs Assessment 156 24 June 2013 12047 Report Rev 0
• Centres of activity are focal places outside of the CBD and a range of housing types can be found within a 400m catchment of the mixed use core
• Higher order public transport corridors and other movement types directly link the CBD and Centres of Activity
Implications for MBRC Retail & Commercial Sectors Needs Assessment
• The MBRC has used the ‘Place Model’ to underpin the strategies within the Draft Strategic Framework.
• The Place Model positively reflects the provisions and intentions of the QPP and SEQRP.
• The MBRC Planning Scheme may need to consider the addition of a CBD Activity Centre into the provisions of the planning scheme.
Local Level Planning Documents
The Moreton Bay Regional Council Draft Strategic Framework 2011
The Draft Strategic Framework (SF) is a spatial development plan for the Moreton Bay Regional Council. The SF forms part of the new Moreton Bay Regional Council planning scheme and sets the policy direction for the scheme. The primary purpose of the plan is to set out the strategy for the future settlement pattern and location of economic activity for the region, including the associated infrastructure to provide for development, whilst enhancing and protecting the region’s natural resources.
Centre Hierarchy/Network Methodology
• The Draft Strategic Framework operates an ‘Activity Centres Network.’ The network of centres has been based on the principles of the ‘Next Generation Planning handbook’ and its associated ‘Place Model’. The network consists of the following element:
– Element 10 – The Activity Centres Place Type
o Principal Activity Centre
o Major Activity Centre
o District Activity Centre
Centre Attributes
• The Activities Centres Place Type include the following attributes:
– The Activity Centres Place Type – are places with a high mix of different but compatible uses within a compact form. This provides for vibrant centres with opportunities for social and economic exchange and are highly accessible. The combination of uses would span some or all of the primary urban land use categories of retail, office employment, residential, civic and community uses. Densities may vary, but generally most of the buildings in a mixed use business centre would be multi- storey with little or no single dwelling detached housing. Residential accommodation would be in multi-unit buildings, many of which would have other uses at ground level and perhaps on other

Retail & Commercial Sectors Needs Assessment 157 24 June 2013 12047 Report Rev 0
levels as well. Mixed use business centres are predominantly of a fine grain and generally do not have industrial land uses or any significant amount of warehousing or storage buildings.
• Activity centres are designed around a main street central core which provides the focus of the centre’s employment and business activity.
• The principal activity centre and major activity centres may have multiple central cores which may contain different specialisations but provide complementary functions;
• The central core is readily identifiable with a fine grained intensively developed, mix of complementary uses;
• The activity centre’s core will be framed and supported by complementary uses in a fringe area within an 800 metre walkable catchment including medium to high-intensity residential accommodation and commercial uses;
• Activity centres have a much higher density and scale to the surroundings and a strong vertical and horizontal mix of uses and activities with a high proportion of non residential activities such as retail, commercial, health, community, entertainment and educational uses;
Relevance to the Moreton Bay Regional Council region
• The Draft Strategic Framework forms a strategic planning document imbedded in the Planning Scheme;
• The Draft Strategic Framework has incorporated the SEQ Place Model as the base model for the framework;
• The district centre is recognised as a central focus of activity for the district community;
• The major centre is recognised as the central focus of activity for a sub-regional community; and
• The principal activity centre is recognised as the central focus of activity of the regional community;
• The Draft Strategic Framework identifies:
– Principal Principal activity Principal activity centre
o Caboolture;
o Morayfield;
– Major activity centres
o Strathpine;
o Redcliffe/Kippa-Ring; and
o North Lakes;
– District activity centres
o Arana Hills;
o Albany Creek;
o Warner;

Retail & Commercial Sectors Needs Assessment 158 24 June 2013 12047 Report Rev 0
o Petrie;
o Kallangur;
o Margate;
o Deception Bay;
o Burpengary, and
o Bellara.
Centres Regulation
• The Draft Strategic Framework regulates development through a series of specific outcomes
• The Specific Outcomes consist of the following elements
– Sustainability and Climate Change;
– Natural Environment and Landscape;
– Strong Communities;
– Settlement Pattern and Urban Form;
– Employment Location; and
– Integrated Transport etc
Centres Design
• The activity centre’s core will be framed and supported by complementary uses in a fringe area within an 800 metre walkable catchment;
• Activity centres have a much higher density and scale to the surroundings and a strong vertical and horizontal mix of uses
Implications for MBRC Retail & Commercial Sectors Needs Assessment
• The Draft Strategic Framework (SF) forms a strategic planning document imbedded in the Planning Scheme and the SF must align with the provisions of the SEQRP and the QPP.
• The Draft Strategic Framework has incorporated the SEQ Place Model as the base model for the framework.
The Caboolture Shire Planning Scheme 2005
The Caboolture Shire Plan is the planning scheme that set out to manage the growth to occur between 2005 and 2015 in the Caboolture district. The plan took effect from December 2005 and has recently been amended on 15 October 2012.
Centre Hierarchy/Network Methodology
• The Caboolture Shire Plan operates a ‘Hierarchy’ Centres Strategy.
• The hierarchy of centres within the Caboolture Shire consists of the following elements:
– District Centre Zone
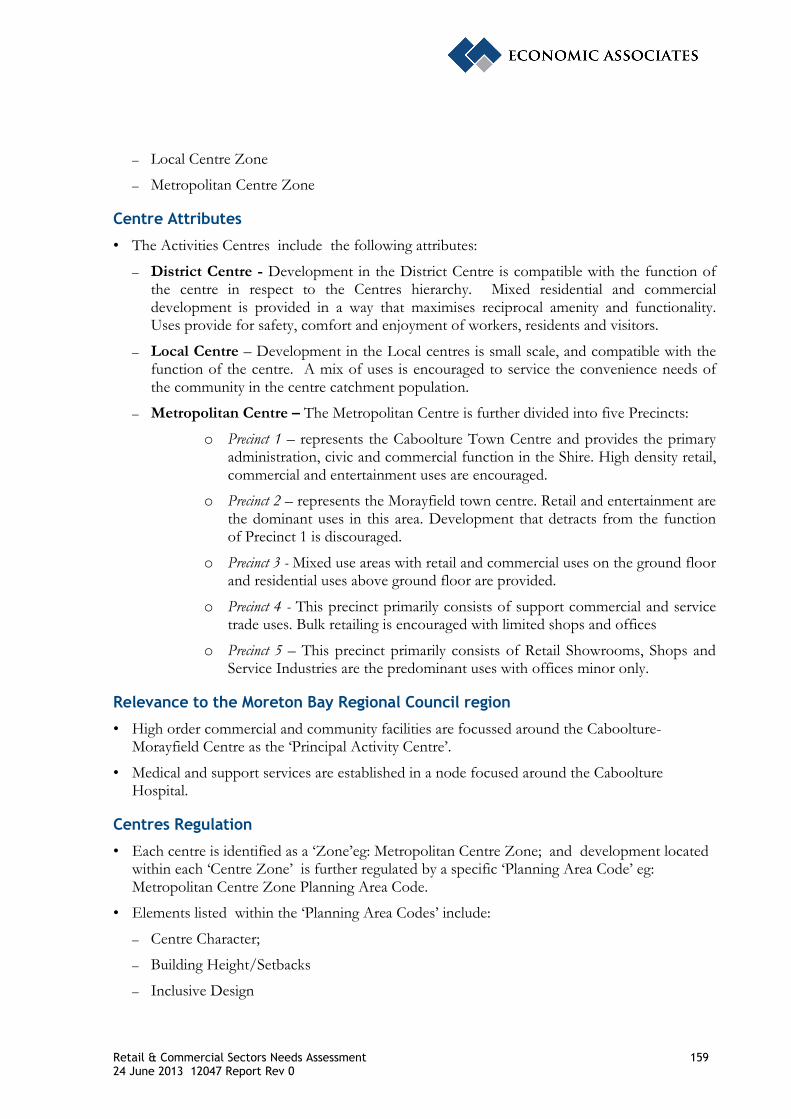
Retail & Commercial Sectors Needs Assessment 159 24 June 2013 12047 Report Rev 0
– Local Centre Zone
– Metropolitan Centre Zone
Centre Attributes
• The Activities Centres include the following attributes:
– District Centre - Development in the District Centre is compatible with the function of the centre in respect to the Centres hierarchy. Mixed residential and commercial development is provided in a way that maximises reciprocal amenity and functionality. Uses provide for safety, comfort and enjoyment of workers, residents and visitors.
– Local Centre – Development in the Local centres is small scale, and compatible with the function of the centre. A mix of uses is encouraged to service the convenience needs of the community in the centre catchment population.
– Metropolitan Centre – The Metropolitan Centre is further divided into five Precincts:
o Precinct 1 – represents the Caboolture Town Centre and provides the primary administration, civic and commercial function in the Shire. High density retail, commercial and entertainment uses are encouraged.
o Precinct 2 – represents the Morayfield town centre. Retail and entertainment are the dominant uses in this area. Development that detracts from the function of Precinct 1 is discouraged.
o Precinct 3 - Mixed use areas with retail and commercial uses on the ground floor and residential uses above ground floor are provided.
o Precinct 4 - This precinct primarily consists of support commercial and service trade uses. Bulk retailing is encouraged with limited shops and offices
o Precinct 5 – This precinct primarily consists of Retail Showrooms, Shops and Service Industries are the predominant uses with offices minor only.
Relevance to the Moreton Bay Regional Council region
• High order commercial and community facilities are focussed around the Caboolture-Morayfield Centre as the ‘Principal Activity Centre’.
• Medical and support services are established in a node focused around the Caboolture Hospital.
Centres Regulation
• Each centre is identified as a ‘Zone’eg: Metropolitan Centre Zone; and development located within each ‘Centre Zone’ is further regulated by a specific ‘Planning Area Code’ eg: Metropolitan Centre Zone Planning Area Code.
• Elements listed within the ‘Planning Area Codes’ include:
– Centre Character;
– Building Height/Setbacks
– Inclusive Design

Retail & Commercial Sectors Needs Assessment 160 24 June 2013 12047 Report Rev 0
– Landscaping; and
– Pedestrian Networks
Implications for MBRC Retail & Commercial Sectors Needs Assessment
• Although the Caboolture Scheme is now outdated, its centres strategies with respect to Metropolitan, Local and District Centres similarly align with the provisions of the QPP.
• The Caboolture Scheme is an example where centres are not heavily regulated.
The Pine Rivers Plan 2005
The Pine Rivers Plan is the planning scheme for the former Pine Rivers Shire that acts as a framework to manage the growth and developed within the former Pine Rivers Shire. The plan took effect from December 2005 and has recently been amended on 15 October 2012.
Centre Hierarchy/Network Methodology
• The Pine Rivers Plan operates a ‘Hierarchy’ Centres Strategy.
• The hierarchy of centres within the Pine Rivers Plan consists of the following elements:
– Major Employment Centres Locality;
– Urban Locality;
– Village Locality; and
– North Lakes Locality (is managed under the Mango Hill Development Control Plan)
Centre Attributes
• The Localities include the following attributes:
– Major Employment Centres Locality – is a major centre including a range of retailing services including comparison shopping and showroom and speciality merchandising activity. This locality provides a broad range of compatible employment opportunities, general industries and mixed business and industry uses including community services and facilities, business, industry and commercial services; and intensive recreation, entertainment, community and cultural facilities and services. Strathpine, Brendale and North Lakes Town Centres are identified as multi-purpose, integrated centres. Strathpine is the major centre for the former shire.
• The Major Employment Centres Locality is further divided into the following ‘Zones’
– Central Business Zone - Forms the retail core of the Strathpine business area and provides a range of shopping, commercial and office facilities appropriate to service the major district/sub-regional catchment. The Central Business Zone accommodates retail, commercial, entertainment, recreational and leisure facilities. It also includes a single major shopping centre, smaller scale convenience retail developments, including supermarkets and shop front retailing, provide variety and choice within the central area.
– Commercial Zone – provides a wide range of activities that complement, service and support the principal and high order functioning of the Central Business zone, and the town centre precinct at North Lakes e.g: car oriented showrooms, service stations, vehicle

Retail & Commercial Sectors Needs Assessment 161 24 June 2013 12047 Report Rev 0
sales etc. The Commercial Zone accommodates community and institutional facilities and provides a mix of business to business activities that are mutually supportive and service other business activities e.g: including small businesses co-located and interacting in multi-purpose premises etc
– Local Business Zone - Provides a mix and range of local neighbourhood retail/community facilities serving a local market and passing trade and integrated with the open space areas and the road transport networks in a conveniently accessible location. Land uses and activities are co-located and designed to integrate with other premises forming a centre for local shopping and community services.
– Urban Locality - The Urban Locality is used principally for residential purposes, including medium density residential development, and also for non-residential uses such as business and community centres containing shopping and office facilities.
• The Urban Locality is further divided into the following ’Zones’
– Central Business Zone - forms the retail area of the District Centre and includes a major shopping complex, showrooms, convenience and specialty retail developments, supermarket and shop front retailing. The Central Business Zone accommodates a range of retail, commercial, office, entertainment, community, recreational and leisure facilities required to service a wide cross-section of the community.
– Commercial Zone – provides a wide range of activities that complement service and support the principal and high order functioning of the Central Business zone e.g: car oriented showrooms, service stations, vehicle sales etc. The Commercial Zone accommodates community and institutional facilities and provides a mix of business to business activities that are mutually supportive and service other business activities e.g: including small businesses co-located and interacting in multi-purpose premises etc.
– Local Business Zone - Provides a mix and range of local neighbourhood retail/community facilities serving a local market and passing trade and integrated with the open space areas and the road transport networks in a conveniently accessible location. Land uses and activities are co-located and designed to integrate with other premises forming a centre for local shopping and community services.
– Village Locality - includes the Samford and Dayboro Villages which are predominantly urban in nature and include urban residential development, semi-urban residential development, local shopping, commercial, and industrial and community facilities. The Village Locality includes small scale uses which service tourist/day tripper activities and development while achieves a high standard of amenity for residents and neighours and maintains or enhances the low intensity and small scale village character of the locality;
• The Village Locality is further divided into the following ’Zones’
– Village Centre Zone - Development consolidates and reinforces the village centre as the community and commercial service centres for the western areas of the Shire. Development is designed, located and of a scale that enhances village character; and local shopping, commercial, community and recreation facilities and short term visitor/tourist accommodation are the predominant forms of development.

Retail & Commercial Sectors Needs Assessment 162 24 June 2013 12047 Report Rev 0
Relevance to the Moreton Bay Regional Council region
• The Pine Rivers Plan addresses and promotes a network of multipurpose activity centres ranging from major employment centres serving the region to local business convenience centres and village centres
• The Caboolture-Morayfield Principal Activity Centre is the intended Principal Activity Centre for retail, commercial, recreational, community and cultural uses in the former Pine Rivers Shire area
• Strathpine, Brendale and North Lakes Town Centres are identified as multi-purpose, integrated centres.
• Strathpine is the major centre for the former shire.
Centres Regulation
• Each Locality is regulated by ‘Overall Outcomes’ of a “Locality Code” eg: Village Locality Code;
• The Overall Outcomes of a ‘Locality Code’ include:
– The role of the Locality;
– Land uses envisaged for the Locality;
– Form and nature of development etc
• A development is also regulated further by the Overall Outcomes of a “Zone Code” eg: Village Centre Zone Code
• The Overall Outcomes of a ‘Zone Code’ include:
– The role of the Zone;
– Land uses envisaged within the Zone;
– Bulk and form of development within the zone etc
• Development located within a Locality is further regulated by the specific Design Codes
• These include:
– Setbacks Code;
– Landscape Code;
– Access and Parking Code.
Implications for MBRC Retail & Commercial Sectors Needs Assessment
• The Caboolture-Morayfield Principal Activity Centre is the intended Principal Activity Centre for retail, commercial, recreational, community and cultural uses in the former Pine Rivers Shire area
• Strathpine, Brendale and North Lakes Town Centres are identified as multi-purpose, integrated centres.
• Strathpine is the major centre for the shire.

Retail & Commercial Sectors Needs Assessment 163 24 June 2013 12047 Report Rev 0
• The Pine Rivers Plan is an example of a plan that is highly prescriptive and without a focus on outcomes.
The Redcliffe City Planning Scheme 2005
The Redcliffe City Planning Scheme manages future development in Redcliffe by identifying the preferred locations for land uses. The scheme took effect from December 2005 and was amended on 17 October 2011.
Centre Hierarchy/Network Methodology
• The Redcliffe City Planning Scheme operates a ‘Hierarchy’ Centres Strategy.
• The hierarchy of centres within the Redcliffe City consists of the following elements:
– Retail Core Zone
– Frame Business Zone
Centre Attributes
• The Activities Centres include the following attributes:
– Retail Core Zone - has the city’s highest order and most intense retail and commercial uses. The Retail Core Centre provides a range of commercial and retail facilities with integrated accommodation, community uses and entertainment. Buildings are of a medium scale and density.
• The Retail Core Zone is further divided into ‘Preferred Use Areas’
• The Preferred Use Areas for the Retail Core Zone include the following:
– Preferred Use Area 5 - Redcliffe Seaside Village provides a specialist and convenience retail area and caters for the leisure and entertainment needs of local residents, workers and visitors.
– Preferred Use Area 6 - Kippa-Ring Village is the City’s primary retail node catering mainly for convenience and comparison retailing.
– Preferred Use Area 7 – Margate Village provides the higher order retail and commercial role of a centre serving mainly City residents.
– Preferred Use Area 8 – Scarborough Seaside Village is a centre providing a strong leisure and entertainment focus catering to both residents and visitors.
– Preferred Use Area 9 – Woody Point Village is a centre serving residents and visitors with a strong specialist role for arts and crafts.
• Frame Business Zone – has a lesser scale and intensity than the Retail Core Zone. A range of retail and commercial uses supports but does not diminish or directly compete with the Retail Core Zone. Where located in an urban village, Frame Business Zone businesses have a lesser scale and intensity than in the Retail Core Zone.
• The Frame Business Zone is further divided into ‘Preferred Use Areas’. The Preferred Use Areas for the Frame Business Zone include the following:

Retail & Commercial Sectors Needs Assessment 164 24 June 2013 12047 Report Rev 0
– Preferred Use Area 10 - Preferred Use Area 10 – Mixed Uses provides a mixture of business, commercial and residential uses and provide a vibrant, safe and interesting pedestrian environment.
– Preferred Use Area 11 Business and Offices: provides primarily business premises with a government or non-government function.
– Preferred Use Area 12 – Local Services: provides a wide variety of service trades and smaller industrial uses that serve local residents and workers.
– Preferred Use Area 13 – Showrooms: provides showrooms/ superstores where the individual tenancy has a gross floor area of 500m2 or more.
– Preferred Use Area 13A – Convenience retailing: entertainment and outdoor sales, provides convenience facilities, with the balance of the precinct used for outdoor sales premises.
– Preferred Use Area 14 – Automotive Based Business and Industry: provides a concentrated area for vehicle sales, servicing and repair activities, as well as shops, including showrooms / superstores (where the individual tenancy of the showroom / superstore is less than 500m2) and business premises.
Relevance to the Moreton Bay Regional Council region
• The Redcliffe City Scheme identifies :
– Redcliffe/Kippa Ring urban village - Major Activity Centre in accordance with the provisions of the SEQ Regional Plan.
Centres Regulation
• Each Zone is regulated by a specific ‘Zone Code’ eg: Retail Centre Core Zone Code
• Elements listed within the ‘Zone Codes’ include:
– Scale and Form; and
– Bulk and density requirements within each ‘Preferred use area.’
• Development located within the Retail Core Zone or the Frame Business Zone is further regulated by the ‘Business and Commercial Uses Code ‘.
• Elements listed within the Business and Commercial Uses Code include:
– Building Design
– Setbacks
– Carparking requirements
• The Business and Commercial Uses Code also provides design requirements for specific uses ie Service Station, Showrooms/Superstores etc.
Implications for MBRC Retail & Commercial Sectors Needs Assessment
• The Redcliffe City Scheme identifies :

Retail & Commercial Sectors Needs Assessment 165 24 June 2013 12047 Report Rev 0
– Redcliffe/Kippa Ring urban village - Major Activity Centre in accordance with the provisions of the SEQ Regional Plan.
• The Redcliffe Scheme probably has too many levels of hierarchy with respect to the number of precincts etc.
Mango Hill Infrastructure Development Control Plan 1998
The Mango Hill Infrastructure Development Control Plan (DCP) provides a mechanism for planning and managing development to that part of North Lakes currently being developed as the North Lakes Estate. The DCP together with the subsequent precinct and sector plans provide the basis for all assessment and development approval within the North Lakes Estate.
Centre Hierarchy/Network Methodology
• The Mango Hill DCP operates a ‘Hierarchy’ Centres Strategy.
• Through the structure plan, the DCP area is broadly divided into a number of land use structural elements:
– Town Centre Core;
– Town Centre Frame; and
– Mixed Industry and Business Area (MIBA)
Centre Attributes
• The Key structural elements include the following attributes:
– Town Centre Core - The town centre core is intended to provide the focus for major retail, commercial, cultural, entertainment, leisure, and related development, possibly integrated with high density residential accommodation in either stand-alone buildings or as part of mixed use developments. The town centre core will become the focus for a Major Employment Centre in the northern growth corridor
– Town Centre Frame - The town centre frame is intended to provide for a wide range of support activities and services to the town centre core together with various forms of medium and high density residential. A primary focus of development in the town centre frame, like the town centre core, is to support the creation of a Major Employment Centre in the northern growth corridor of the Shire. The range of employment opportunities in the town centre frame is more likely to be oriented towards service and support activities rather than the higher order retailing and business activities found in the town centre core.
– Mixed Industry and Business Area (MIBA) - The MIBA is intended to provide a broad range of commercial and professional services, office services and service trades, technology manufacturing and servicing, tertiary level and other educational facilities, tourist and recreational facilities, and institutional and community uses, all in a managed landscaped environment enjoying high exposure and accessibility to the Bruce Highway. The form and intensity of MIBA development characteristically will be low to medium rise with the potential for occasional high rise, all developed within a landscaped garden setting.

Retail & Commercial Sectors Needs Assessment 166 24 June 2013 12047 Report Rev 0
Relevance to the Moreton Bay Regional Council region
• The Mango Hill DCP identifies the ‘Town Centre Core’ precinct as the major physical, social, commercial, and functional focus of the DCP.
• The Town Centre Frame of DCP provides the support services and facilities to the ‘Town Centre Core.’
• The Mango Hill addresses and promotes a network of multi-purpose activity centres
• The Mango Hill DCP recognises and encourages mixed use centres reflective of the SEQRP and QPP provisions.
Centres Regulation
• Each ‘Land Use Element is regulated by Desired Environmental Outcomes (DEOs) and Planning intent for each specific ‘Land Use Element’ eg. Town Centre Core
• ‘Development Intent’ for the specific Land Use Element includes:
– Development Character; and
– Administrative and Commercial;
– Recreation, Entertainment and Leisure;
– Residential
– Public Transport Corridor
• Development located within the Town Centre Core, Town Centre Frame or MIBA is further regulated by ‘Design and Siting Measures‘.
• Elements listed within the ‘Design and Siting Measures include:
– Site Coverage
– Setbacks
– Landscaping
– Signage;
– Carparking requirements etc
• Where a matter is not dealt with under the DCP, the provisions of the Pine Rivers Shire Plan take precedence.
Implications for MBRC Retail & Commercial Sectors Needs Assessment
• The Mango Hill DCP recognises and encourages mixed use centres reflective of the SEQRP and QPP provisions.
Mango Hill Local Area Plan
The Mango Hill Local Area Plan is a policy development by the former Pine Rivers Shire Council to provide detailed planning provisions for the future development of land located within Mango Hill. The Plan is one of three (3) Local Area Plans prepared as part of the ‘Northern Growth Corridor’ Planning Project.

Retail & Commercial Sectors Needs Assessment 167 24 June 2013 12047 Report Rev 0
This Plan was prepared as an interim step towards the subsequent development and adoption of a Structure Plan under the SEQ Regional Plan, one of the principal instruments for establishing the desired use of land and the preferred timing of development within the Urban Footprint. As such, it establishes a broad structure, layout, appropriate land uses and infrastructure corridors required for future development and community needs within the Mango Hill Local Area Plan Area.
Centre Hierarchy/Network Methodology
• The Mango Hill Local Area Plan operates a ‘Networks’ Centres Strategy.
• The network of centres within the Mango Hill LAP consists of the following Precincts:
– Mango Hill Village;
– Kinsella Heights
– Halpine Lake
– Halpine Drive and Employment Centre
Centre Attributes
• The Precincts include the following attributes:
– Mango Hill Village - Local Centre focused on the intersection of Kinsellas Road West with Lamington Street and Chelmsford Road. A combined maximum of 700m2 gross leasable area of retail uses are intended within this Local Centre, with a maximum individual tenancy size of retail uses of not more than 500m2 gross leasable area. The centre is to be limited to one supermarket/ mini-major/ grocery store. Additional commercial, community uses may be located within or adjoining this centre providing a combined maximum of 1,500m2 gross leasable area of retail/commercial /community uses.
– The Kinsella Heights - Local Centre is focussed around the intersection of the Mango Hill Ring Road with the Collector/Bus Collector to form an integrated centre. A combined maximum of 3,000m2 gross leasable area of retail uses are intended to be provided within this Local Centre, with a maximum individual tenancy size of retail/ commercial uses of not more than 1,000m2 gross leasable area. The centre is not intended to contain more than one supermarket/ mini-major/ grocery store.
– Halpine Lakes –Local Centre is located near the North-South Urban Arterial Road and is intended to contain convenience uses and a 24-hour service station to service passing trade along the arterial road. A combined maximum of 600m2 gross leasable area of retail/commercial/service station uses is intended within this Convenience Centre.
– The Halpine Drive Local Centre is located on the eastern side of Halpine Drive and south of the Mango Hill Ring Road and is to contain mixed use development with building heights of up to three stories. A combined maximum of 2,500m2 gross leasable area of retail/ commercial uses are intended within this Local Centre with a maximum individual tenancy size of retail/ commercial uses of not more than 1,000m2 gross leasable area. The Local Centre is not intended to contain more than one supermarket/ mini-major/ grocery store.

Retail & Commercial Sectors Needs Assessment 168 24 June 2013 12047 Report Rev 0
Relevance to the Moreton Bay Regional Council region
• The provisions of the Pine Rivers Shire Plan prevail over any assessment of development within the Mango Hill Local Area Plan.
• The centres are to provide a local function that does not compete with the North Lakes Major Centre, and contain a range of uses (i.e. are not entirely comprised of retail/ food retailing uses).
Centres Design
• Local Centres generally serve neighbourhoods of 1,000–3,000 households and provide for traditional convenience shopping trips.
• Local centres have total gross leasable areas for retail uses of between 600m2 –3,000m2.
Implications for MBRC Retail & Commercial Sectors Needs Assessment
• The Mango Hill LAP is outdated as it was introduced as an interim step towards the development and adoption of the SEQRP.
Griffin Local Area Plan
The Griffin Local Area Plan is a policy development by the former Pine Rivers Shire Council to provide detailed planning provisions for the future development of land located within Griffin. The Plan is one of three (3) Local Area Plans prepared as part of the ‘Northern Growth Corridor’ Planning Project. The plan was prepared as an interim step prior to the adoption of the Strategic Plan under the SEQ Regional Plan. The Local Area Plan is used by Council in assessing applications for development located within Griffin.
Centre Hierarchy/Network Methodology
• The Griffin Local Area Plan operates a ‘Network’ Centres Strategy.
• The network of centres within the Griffin LAP consists of the following local activity centres:
– Local Activity Centre A1
– Local Activity Centre A2
Centre Attributes
• The Local Activity Centres include the following attributes:
– Local Activity Centre (LA 1) - is located on the north side of Brays Road, close to the North-South Urban Arterial Road
– Local Activity Centre (LA 2) – is located northern side of Dohles Rocks Road, close to the Bruce Highway
• The Local centres area intended to primarily provide for the daily convenience needs of local residents. The centres would also be expected to draw patronage from public transport or private vehicle travellers passing the respective sites for other travel purposes.
• The local activity centres are not intended to attain a size or range of functions that would either draw a high proportion of custom or act as a draw for special purpose trips from

Retail & Commercial Sectors Needs Assessment 169 24 June 2013 12047 Report Rev 0
outside of the local convenience catchment. A maximum retail gross floor area of 1,800 m2 applies to each of the centres unless the need for a larger centre is demonstrated to the satisfaction of Council through a retail needs assessment study.
Relevance to the Moreton Bay Regional Council region
• Local activity centres are intended to provide for the daily convenience needs of local residents.
• The centres are not intended to attain a size or range of functions that would draw custom from outside of the local convenience catchment.
Centres Regulation
• The local activity centres are to be ‘master planned’ and incorporate key design elements such as:
– building orientation;
– positioning of doors and windows;
– weather protection;
– pedestrian movement paths and levels;
– outdoor seating and service access; and
– creation of integrated centre characters.
• The provisions of the Pine Rivers Shire Plan prevail over any assessment of development within the Griffin Local Area Plan.
• The Griffin Local Area Plan applies to all development regulated by the Pine Rivers Shire Plan which is located with the local plan area
Implications for MBRC Retail & Commercial Sectors Needs Assessment
• The Griffin LAP is outdated as it was introduced as an interim step towards the development and adoption of the SEQRP.
Dakabin Local Area Plan
The Dakabin Local Area Plan is a policy development by the former Pine Rivers Shire Council to provide detailed planning provisions for the future development of land located within Dakabin. The Plan is one of three (3) Local Area Plans prepared as part of the ‘Northern Growth Corridor’ Planning Project. The plan was prepared as an interim step prior to the adoption of the Strategic Plan under the SEQ Regional Plan. The Local Area Plan was used by Council in assessing applications for development located within Dakabin.
Centre Hierarchy/Network Methodology
• The Dakabin Local Area Plan operates a ‘Network’ Centres Strategy.
• The network of centres within the Dakabin LAP consists of the following Precincts:
– Dakabin West (LA-1)

Retail & Commercial Sectors Needs Assessment 170 24 June 2013 12047 Report Rev 0
– Dakabin Central (LA-2)
Centre Attributes
• The Precincts include the following attributes:
– Dakabin West (LA-1) – Local Activity Centre is located on the northern side of Alma Road at its western end. The location of this centre anticipates the relocation of the Dakabin Railway Station to an adjacent position. A maximum gross floor area of 500m2 of retail space applies to the centre. It is intended that a small convenience store will use approximately 250m2 of this space with the other 250m2 intended for other tenancies such as video hire, takeaway food, off-licence bottle shop or similar.
– Dakabin Central (LA-2) - Local Activity Centre is located on the south-western corner of the Old Gympie Road – Alma Road intersection. This centre is expected to be more vehicle-orientated in its design and character and may allow for a service station on the same site. A maximum gross floor area of 1,000 m2 of retail space applies to the centre. This is expected to take the form of a small convenience store of approximately 450m with the remaining 550m to be taken up by with other retail tenancies such as video hire, takeaway food, off-licence bottle shop. Other complementary community or non-retail commercial services may also be established at the centre.
Relevance to the Moreton Bay Regional Council region
• Local activity centres are intended to provide for the daily convenience needs of local residents.
• The centres are not intended to attain a size or range of functions that would draw custom from outside of the local convenience catchment.
Centres Regulation
• The provisions of the Pine Rivers Shire Plan prevail over any assessment of development within the Dakabin Local Area Plan.
• The Dakabin Local Area Plan applies to all development regulated by the Pine Rivers Shire Plan which is located within the local plan area.
Implications for MBRC Retail & Commercial Sectors Needs Assessment
• The Dakabin LAP is outdated as it was introduced as an interim step towards the development and adoption of the SEQRP.
Centres Network Benchmarking
A review of other approaches to centres networks and hierarchies was prepared to inform the identification of an appropriate centres network for Moreton Bay Regional Council.
Regional Level Hierarchies
Moves towards the development of regional plans in addition to local level planning have resulted in the establishment of a variety of regional hierarchies around Australia. Figure A.4

Retail & Commercial Sectors Needs Assessment 171 24 June 2013 12047 Report Rev 0
below provides an overview of various major metropolitan based hierarchies identified by regional planning instruments.
A snapshot of the various levels within the activity centres hierarchy planned for SEQ, Sydney, Melbourne, Perth, Adelaide and the Australian Capital Territory indicate that hierarchies typically contain a range from higher order activity centres through to lower order activity centres. Categories such as specialised activity centres and stand-alone shopping centres do not fit in conventional hierarchies, but are a recognition that new types of activity clusters have emerged. Notably, the SEQ Regional Plan hierarchy chooses not to identify lower order centres, apparently preferring to leave this to local level planning instruments.
Figure A.4: Activity Centre Hierarchies in Australia-Regional Planning Hierarchies
Hierarchy SEQ Sydney Melbourne Perth Adelaide ACT
Higher order
Primary Activity Centre
Global Sydney Melbourne Central Activity Centre
Perth Central Area
Adelaide City Centre
City Centre
Principal Activity Centre
Regional City Central Activity Centre
Primary Centre
Regional Centre
Town Centre
Major Activity Centre
Major Centre Principal Activity Centre
Strategic Centre
Major District Centre
Group Centre
Specialist Activity Centre
Specialised Centre
Major Activity Centre
Regional Centre
District Centre Local Centre
Town Centre Specialised Activity Centre
District Centre Bulky Goods Centre
Stand Alone Shopping Centre
Neighbourhood Activity Centre
Neighbourhood Centre
Specialist Centre
Village Local Centre Neighbourhood Centre
Small Village Local Centre
Lower order
Neighbourhood Centre
Table A.1 below provides a brief summary of centre hierarchy approaches across a variety of local government areas across Australia. The table provides a diverse range of community types to allow for a more holistic comparison. The table attempts to categories centres from other communities into a hierarchy similar to that set out by the Queensland Planning Provisions. The centres described in the table below are not meant to be definitive, rather they are discussed as examples.
Table A.1: Comparison of Centre Hierarchies - Local Government Level
Local Government Principal Activity Centre Major Activity Centres District Activity Centres
Ipswich
Forms part of the western growth corridor of SEQ and is anticipated to experience high levels of population growth. Has traditionally suffered from significant
Ipswich CBD: historic service centre for Ipswich residents. Provides a broad range of uses, including shopping, offices, government services, hospital, etc. Recent major centre investment include Riverlink Shopping Centre, Ikon office
Goodna: currently limited to a collection of disconnected retail and commercial developments. The Goodna Town Centre Masterplan outlines the future growth for the Town Centre (~40,000m2). Ripley: Designated centre to
Centres are located at Redbank, Redbank Plains, Booval, Brassall, Karalee, Yamanto and Walloon. The focus of these centres is to cater for the day-today needs of their host communities, however the scale of these centres varies significantly with some

Retail & Commercial Sectors Needs Assessment 172 24 June 2013 12047 Report Rev 0
expenditure and employment leakage to Brisbane. Ipswich has two Principal Activity Centres
development and proposed redevelopment of Ipswich Mall. Springfield: Existing facilities include: Orion Springfield, a 23,000m2 shopping centre anchored by a discount department store and a supermarket; Education City, an educational precinct incorporating campuses of the University of Southern Queensland and the Bremer Institute of TAFE and approximately 15,000m2 of office floor space. The Springfield Town Centre Concept Plan identifies a range of maximum floor spaces for the Town Centre including some 200,000m2 of office (town and special business), 150,000m2 of retail and bulky goods, 140,000m2 of service trade facilities and 30,000m2 of health care facilities at completion.
service the needs of the emerging Ripley Valley population, located further to the west of Springfield. Town Centre (urban core) on completion is proposed to provide ~145,000m2 of retail floor space, as well as a significant office component of up to 52,000m2 along with other entertainment, leisure and residential facilities.
centres limited to be supermarket anchored centres while other host DDS’s and other forms of higher order retail, community and commercial functions.
Cairns
Cairns has above average per capita supply of retail floor space due to a significant tourist market. Population about 250,000 persons. Hierarchy as per FNQ Regional Plan.
Has a strong international function for some activities, especially the tourism sector. 150,000m2 retail floor space. Myer Department Store, Target DDS, Coles
Smithfield: 30,300m2 major sub-regional shopping centre with Kmart DDS, 2 Supermarkets. Bulky Goods and light industry/business park elements. Earlville: Stockland Cairns is the largest retail shopping complex in the region at almost 50,000m2, Big W and Target DDS, 2 Supermarkets.
District centres located at Redlynch, Mount Sheridan and Manunda. District centres range from between 5,000m2 and 15,000m2. Most are anchored by full line supermarkets although, Mt Sheridan has recently opened a DDS.
Mackay
Population of approximately 110,000 persons. Less obvious hierarchy of centres, largely associated with trends towards suburban shopping centres in 1980s. CBD remains dominant centre due to location of Canelands Plaza in CBD.
Has the region’s highest order retail, commercial and community service functions (including hospital, state government regional offices). Approximately 85,000m2 of retail floor space including Myer and two DDS’s and two supermarkets. Commercial functions have tended to locate along Nebo Road (major arterial into CBD)
Mt Pleasant: 22,000m2 of retail floor space including DDS and supermarket. Is the second largest enclosed shopping centre within Mackay behind Canelands Plaza (Located within CBD fringe). Mt Pleasant is framed by retail showrooms and bulky goods outlets.
Sarina: coastal community located approximately 35 km south of from Mackay CBD. Population of 3,500 persons, but provides services to other coastal communities. Approximately 11,000m2 of retail anchored by a Woolworths supermarket.
Canberra
Australia's largest inland city, with a
Large government administration sector, allied
Belconnen: 340,000m2 floor space, major regional
Queanbeyan: 20km from Canberra CBD, population

Retail & Commercial Sectors Needs Assessment 173 24 June 2013 12047 Report Rev 0
population of about 345,000 persons. Canberra has a very large government workforce and a highly structured distribution of centres with a clear hierarchy.
private services, 400,000m2 floor space, 2 Department Stores in a regional shopping centre. Pedestrian mall is the focus of the CBD. Major community facilities include convention centre, casino, park.
shopping centre with DS, DDS, supermarkets, bulky goods, cinema. Government and private offices, light industrial and community facilities surround shopping centre. Woden: 290,000m2 floor space, major regional shopping centre with DS, DDS, supermarkets, bulky goods, cinema. Offices, community facilities in frame Tuggeranong: Town Centre on lake and has 250,000m2 floor space, major regional centre with DS, DDS, supermarkets, cinemas, offices. College, arts centre, government offices, light industrial surround shopping centre
40,000. CBD plus smaller centres. CBD includes DDS, supermarkets, office, district hospital, council offices park council offices, clubs. Yass: 50km from Canberra, population 15,000. Centre comprises main street retail, council offices, district hospital, TAFE, library, offices
Launceston
Launceston has a population of approximately 65,000 persons. It is second largest population centre in Tasmania. It is the major service centre for Northern Tasmania, and major industries include retail, health, education and manufacturing. Launceston has a tiered hierarchy of activity centres
The CBD of Launceston comprises a mix of retailers and some higher order commercial services. The CBD hosts a number of department stores, including Harris Scarfe, DDS and Myer, and the total volume of retail floor space is in the order of 56,000m2. Includes pedestrian mall, hospital, parks, offices, library, TAFE, hotels
Launceston is supported by two district centres, in the suburbs of Kings Meadows and Mowbray, each supporting approximately 21,000m2 and 13,000m2 of retail floorspace respectively
Various small towns and villages, with centres only serving a local need.

Retail & Commercial Sectors Needs Assessment 174 24 June 2013 12047 Report Rev 0
APPENDIX B
DETAILED RETAIL EXPENDITURE TABLES

Retail & Commercial Sectors Needs Assessment 175 24 June 2013 12047 Report Rev 0
Table B.1: Weekly retail expenditure patterns of catchment area households, 2012-2031 (2011 dollars)
2012 2016 2021 2026 2031
Albany Creek Groceries & take home food $235.73 $239.28 $245.33 $251.52 $257.87 Dining & take-away food (incl. on-premise liquor) $123.78 $125.64 $128.82 $132.07 $135.40 Clothing, footwear & apparel $75.05 $76.18 $78.11 $80.08 $82.10 Personal & other goods $100.61 $102.12 $104.70 $107.35 $110.06 Core bulky goods $61.97 $62.90 $64.49 $66.12 $67.79 Ancillary bulky goods $83.17 $84.42 $86.55 $88.74 $90.98 Hardware $24.05 $24.41 $25.03 $25.66 $26.31 Takeaway liquor $28.54 $28.97 $29.71 $30.46 $31.23 Total Grocery & Specialty $563.71 $572.21 $586.65 $601.47 $616.66 Total Bulky Goods $169.19 $171.74 $176.08 $180.52 $185.08 Total $732.90 $743.95 $762.73 $781.99 $801.74 Bribie Island Groceries & take home food $188.70 $191.55 $196.39 $201.35 $206.43 Dining & take-away food (incl. on-premise liquor) $80.42 $81.64 $83.70 $85.81 $87.98 Clothing, footwear & apparel $51.49 $52.26 $53.58 $54.94 $56.32 Personal & other goods $64.08 $65.04 $66.68 $68.37 $70.09 Core bulky goods $40.27 $40.88 $41.91 $42.97 $44.06 Ancillary bulky goods $53.12 $53.92 $55.28 $56.68 $58.11 Hardware $15.82 $16.06 $16.46 $16.88 $17.31 Takeaway liquor $22.84 $23.19 $23.77 $24.37 $24.99 Total Grocery & Specialty $407.54 $413.68 $424.13 $434.84 $445.82 Total Bulky Goods $109.22 $110.86 $113.66 $116.53 $119.47 Total $516.75 $524.54 $537.79 $551.37 $565.29 Burpengary - Narangba Groceries & take home food $189.81 $192.68 $197.54 $202.53 $207.64 Dining & take-away food (incl. on-premise liquor) $92.60 $94.00 $96.37 $98.80 $101.30 Clothing, footwear & apparel $62.83 $63.78 $65.39 $67.04 $68.73 Personal & other goods $75.87 $77.01 $78.96 $80.95 $82.99 Core bulky goods $50.27 $51.02 $52.31 $53.63 $54.99 Ancillary bulky goods $68.53 $69.56 $71.32 $73.12 $74.96 Hardware $18.03 $18.30 $18.76 $19.23 $19.72 Takeaway liquor $23.20 $23.54 $24.14 $24.75 $25.37 Total Grocery & Specialty $444.31 $451.01 $462.39 $474.07 $486.04 Total Bulky Goods $136.82 $138.88 $142.39 $145.98 $149.67 Total $581.12 $589.89 $604.78 $620.05 $635.71 Caboolture East Groceries & take home food $188.88 $191.73 $196.57 $201.53 $206.62 Dining & take-away food (incl. on-premise liquor) $82.33 $83.57 $85.68 $87.85 $90.07 Clothing, footwear & apparel $53.27 $54.07 $55.43 $56.83 $58.27 Personal & other goods $65.92 $66.92 $68.61 $70.34 $72.12 Core bulky goods $41.84 $42.47 $43.54 $44.64 $45.77 Ancillary bulky goods $55.54 $56.37 $57.80 $59.26 $60.75 Hardware $16.17 $16.41 $16.82 $17.25 $17.68 Takeaway liquor $22.90 $23.24 $23.83 $24.43 $25.05 Total Grocery & Specialty $413.30 $419.53 $430.12 $440.98 $452.12 Total Bulky Goods $113.54 $115.25 $118.16 $121.15 $124.21 Total $526.84 $534.78 $548.29 $562.13 $576.33 Caboolture Hinterland Groceries & take home food $189.22 $192.07 $196.92 $201.90 $207.00 Dining & take-away food (incl. on-premise liquor) $86.10 $87.40 $89.61 $91.87 $94.19 Clothing, footwear & apparel $56.78 $57.63 $59.09 $60.58 $62.11

Retail & Commercial Sectors Needs Assessment 176 24 June 2013 12047 Report Rev 0
2012 2016 2021 2026 2031
Personal & other goods $69.58 $70.63 $72.41 $74.24 $76.11 Core bulky goods $44.93 $45.61 $46.76 $47.94 $49.16 Ancillary bulky goods $60.31 $61.22 $62.76 $64.35 $65.97 Hardware $16.85 $17.10 $17.54 $17.98 $18.43 Takeaway liquor $23.01 $23.35 $23.94 $24.55 $25.17 Total Grocery & Specialty $424.69 $431.09 $441.98 $453.14 $464.58 Total Bulky Goods $122.09 $123.93 $127.06 $130.27 $133.56 Total $546.78 $555.02 $569.04 $583.41 $598.14 Caboolture Midwest Groceries & take home food $189.81 $192.68 $197.54 $202.53 $207.64 Dining & take-away food (incl. on-premise liquor) $92.61 $94.01 $96.38 $98.82 $101.31 Clothing, footwear & apparel $62.84 $63.79 $65.40 $67.05 $68.74 Personal & other goods $75.88 $77.02 $78.97 $80.96 $83.00 Core bulky goods $50.27 $51.03 $52.32 $53.64 $55.00 Ancillary bulky goods $68.54 $69.57 $71.33 $73.13 $74.98 Hardware $18.03 $18.30 $18.76 $19.24 $19.72 Takeaway liquor $23.20 $23.55 $24.14 $24.75 $25.37 Total Grocery & Specialty $444.34 $451.04 $462.43 $474.10 $486.07 Total Bulky Goods $136.84 $138.90 $142.41 $146.01 $149.69 Total $581.18 $589.94 $604.84 $620.11 $635.77 Caboolture Morayfield Groceries & take home food $188.97 $191.82 $196.66 $201.63 $206.72 Dining & take-away food (incl. on-premise liquor) $83.34 $84.60 $86.73 $88.92 $91.17 Clothing, footwear & apparel $54.21 $55.02 $56.41 $57.84 $59.30 Personal & other goods $66.90 $67.91 $69.63 $71.38 $73.19 Core bulky goods $42.67 $43.31 $44.41 $45.53 $46.68 Ancillary bulky goods $56.81 $57.67 $59.13 $60.62 $62.15 Hardware $16.35 $16.60 $17.01 $17.44 $17.88 Takeaway liquor $22.93 $23.27 $23.86 $24.46 $25.08 Total Grocery & Specialty $416.35 $422.62 $433.30 $444.24 $455.45 Total Bulky Goods $115.83 $117.58 $120.54 $123.59 $126.71 Total $532.18 $540.20 $553.84 $567.83 $582.16 Central Pine West Groceries & take home food $225.12 $228.51 $234.28 $240.20 $246.26 Dining & take-away food (incl. on-premise liquor) $116.71 $118.46 $121.46 $124.52 $127.67 Clothing, footwear & apparel $72.35 $73.45 $75.30 $77.20 $79.15 Personal & other goods $95.02 $96.45 $98.89 $101.38 $103.94 Core bulky goods $59.38 $60.27 $61.79 $63.36 $64.96 Ancillary bulky goods $79.96 $81.16 $83.21 $85.32 $87.47 Hardware $22.68 $23.02 $23.61 $24.20 $24.81 Takeaway liquor $27.31 $27.72 $28.42 $29.14 $29.88 Total Grocery & Specialty $536.51 $544.60 $558.35 $572.45 $586.90 Total Bulky Goods $162.02 $164.46 $168.62 $172.87 $177.24 Total $698.53 $709.06 $726.96 $745.32 $764.14 Dakabin-Kallangur-Murrumba Downs Groceries & take home food $189.49 $192.34 $197.20 $202.18 $207.29 Dining & take-away food (incl. on-premise liquor) $89.02 $90.36 $92.65 $94.99 $97.38 Clothing, footwear & apparel $59.50 $60.39 $61.92 $63.48 $65.08 Personal & other goods $72.40 $73.49 $75.35 $77.25 $79.20 Core bulky goods $47.33 $48.04 $49.26 $50.50 $51.77 Ancillary bulky goods $64.00 $64.96 $66.60 $68.28 $70.01 Hardware $17.38 $17.64 $18.09 $18.54 $19.01 Takeaway liquor $23.09 $23.44 $24.03 $24.64 $25.26 Total Grocery & Specialty $433.50 $440.03 $451.14 $462.54 $474.22 Total Bulky Goods $128.70 $130.64 $133.94 $137.33 $140.79

Retail & Commercial Sectors Needs Assessment 177 24 June 2013 12047 Report Rev 0
2012 2016 2021 2026 2031
Total $562.20 $570.68 $585.09 $599.86 $615.01 Griffin-Mango Hill Groceries & take home food $193.47 $196.38 $201.34 $206.43 $211.64 Dining & take-away food (incl. on-premise liquor) $95.61 $97.05 $99.50 $102.02 $104.59 Clothing, footwear & apparel $64.31 $65.28 $66.93 $68.62 $70.35 Personal & other goods $78.36 $79.54 $81.55 $83.60 $85.72 Core bulky goods $51.65 $52.43 $53.75 $55.11 $56.50 Ancillary bulky goods $70.39 $71.45 $73.26 $75.11 $77.00 Hardware $18.60 $18.88 $19.36 $19.85 $20.35 Takeaway liquor $23.63 $23.99 $24.59 $25.21 $25.85 Total Grocery & Specialty $455.38 $462.25 $473.92 $485.88 $498.15 Total Bulky Goods $140.64 $142.76 $146.36 $150.06 $153.85 Total $596.02 $605.00 $620.28 $635.94 $652.00 Hills District/Samford Groceries & take home food $226.11 $229.52 $235.31 $241.25 $247.35 Dining & take-away food (incl. on-premise liquor) $117.36 $119.13 $122.14 $125.23 $128.39 Clothing, footwear & apparel $72.61 $73.70 $75.56 $77.47 $79.43 Personal & other goods $95.54 $96.98 $99.43 $101.94 $104.51 Core bulky goods $59.62 $60.52 $62.05 $63.61 $65.22 Ancillary bulky goods $80.26 $81.47 $83.53 $85.63 $87.80 Hardware $22.81 $23.15 $23.74 $24.34 $24.95 Takeaway liquor $27.43 $27.84 $28.54 $29.26 $30.00 Total Grocery & Specialty $539.04 $547.17 $560.99 $575.15 $589.67 Total Bulky Goods $162.69 $165.14 $169.31 $173.59 $177.97 Total $701.73 $712.31 $730.30 $748.74 $767.64 Lawnton - Bray Park Groceries & take home food $189.50 $192.36 $197.22 $202.20 $207.30 Dining & take-away food (incl. on-premise liquor) $89.17 $90.52 $92.80 $95.15 $97.55 Clothing, footwear & apparel $59.64 $60.53 $62.06 $63.63 $65.24 Personal & other goods $72.55 $73.64 $75.50 $77.41 $79.36 Core bulky goods $47.45 $48.17 $49.38 $50.63 $51.91 Ancillary bulky goods $64.19 $65.16 $66.80 $68.49 $70.22 Hardware $17.41 $17.67 $18.11 $18.57 $19.04 Takeaway liquor $23.10 $23.44 $24.04 $24.64 $25.27 Total Grocery & Specialty $433.95 $440.49 $451.62 $463.02 $474.71 Total Bulky Goods $129.05 $130.99 $134.30 $137.69 $141.17 Total $563.00 $571.48 $585.92 $600.71 $615.88 Petrie/Dayboro Groceries & take home food $199.95 $202.96 $208.09 $213.34 $218.73 Dining & take-away food (incl. on-premise liquor) $99.93 $101.44 $104.00 $106.62 $109.32 Clothing, footwear & apparel $65.96 $66.95 $68.64 $70.38 $72.16 Personal & other goods $81.77 $83.00 $85.10 $87.24 $89.45 Core bulky goods $53.23 $54.03 $55.40 $56.80 $58.23 Ancillary bulky goods $72.35 $73.44 $75.29 $77.20 $79.14 Hardware $19.44 $19.73 $20.23 $20.74 $21.26 Takeaway liquor $24.38 $24.75 $25.38 $26.02 $26.67 Total Grocery & Specialty $471.99 $479.10 $491.20 $503.60 $516.32 Total Bulky Goods $145.02 $147.20 $150.92 $154.73 $158.64 Total $617.00 $626.31 $642.12 $658.33 $674.96 Redcliffe Groceries & take home food $189.08 $191.93 $196.78 $201.75 $206.84 Dining & take-away food (incl. on-premise liquor) $84.56 $85.84 $88.00 $90.23 $92.50 Clothing, footwear & apparel $55.34 $56.18 $57.59 $59.05 $60.54 Personal & other goods $68.08 $69.11 $70.85 $72.64 $74.48

Retail & Commercial Sectors Needs Assessment 178 24 June 2013 12047 Report Rev 0
2012 2016 2021 2026 2031
Core bulky goods $43.67 $44.33 $45.45 $46.59 $47.77 Ancillary bulky goods $58.36 $59.24 $60.73 $62.26 $63.84 Hardware $16.57 $16.82 $17.24 $17.68 $18.13 Takeaway liquor $22.96 $23.31 $23.90 $24.50 $25.12 Total Grocery & Specialty $420.03 $426.36 $437.13 $448.17 $459.48 Total Bulky Goods $118.59 $120.38 $123.42 $126.54 $129.73 Total $538.63 $546.75 $560.55 $574.71 $589.22 Rothwell - Deception Bay Groceries & take home food $188.95 $191.80 $196.65 $201.61 $206.70 Dining & take-away food (incl. on-premise liquor) $83.15 $84.41 $86.54 $88.72 $90.96 Clothing, footwear & apparel $54.03 $54.84 $56.23 $57.65 $59.10 Personal & other goods $66.72 $67.72 $69.43 $71.19 $72.98 Core bulky goods $42.51 $43.15 $44.24 $45.36 $46.51 Ancillary bulky goods $56.57 $57.43 $58.88 $60.36 $61.89 Hardware $16.31 $16.56 $16.98 $17.41 $17.85 Takeaway liquor $22.92 $23.27 $23.85 $24.46 $25.07 Total Grocery & Specialty $415.78 $422.04 $432.70 $443.63 $454.83 Total Bulky Goods $115.40 $117.14 $120.10 $123.13 $126.24 Total $531.18 $539.18 $552.80 $566.76 $581.07 Strathpine Groceries & take home food $189.61 $192.47 $197.33 $202.31 $207.42 Dining & take-away food (incl. on-premise liquor) $90.39 $91.76 $94.07 $96.45 $98.89 Clothing, footwear & apparel $60.77 $61.69 $63.25 $64.84 $66.48 Personal & other goods $73.73 $74.84 $76.73 $78.67 $80.66 Core bulky goods $48.45 $49.19 $50.43 $51.70 $53.01 Ancillary bulky goods $65.73 $66.73 $68.41 $70.14 $71.91 Hardware $17.63 $17.89 $18.34 $18.81 $19.28 Takeaway liquor $23.13 $23.48 $24.07 $24.68 $25.30 Total Grocery & Specialty $437.64 $444.24 $455.46 $466.96 $478.75 Total Bulky Goods $131.82 $133.80 $137.18 $140.65 $144.20 Total $569.46 $578.04 $592.64 $607.61 $622.95
Source: Derived from ABS (2011a), Australian Bureau of Statistics (2011b) and the 2011 Census of Population & Housing.
Table B.2: Annual available retail expenditure within the trade areas, 2012-2031 ($M) (2011 dollars)
2012 2016 2021 2026 2031
Albany Creek Groceries & take home food $100.00 $107.45 $118.87 $128.23 $138.02 Dining & take-away food (incl. on-premise liquor) $52.51 $56.42 $62.42 $67.33 $72.47 Clothing, footwear & apparel $31.84 $34.21 $37.85 $40.83 $43.94 Personal & other goods $42.68 $45.86 $50.73 $54.73 $58.91 Core bulky goods $26.29 $28.25 $31.25 $33.71 $36.28 Ancillary bulky goods $35.28 $37.91 $41.94 $45.24 $48.70 Hardware $10.20 $10.96 $12.13 $13.08 $14.08 Takeaway liquor $12.11 $13.01 $14.39 $15.53 $16.71 Total Grocery & Specialty $239.13 $256.96 $284.27 $306.64 $330.06 Total Bulky Goods $71.77 $77.12 $85.32 $92.03 $99.06 Total $310.90 $334.08 $369.59 $398.68 $429.12 Bribie Island Groceries & take home food $97.76 $103.57 $109.51 $112.28 $115.12 Dining & take-away food (incl. on-premise liquor) $41.67 $44.14 $46.67 $47.85 $49.06 Clothing, footwear & apparel $26.67 $28.26 $29.88 $30.64 $31.41

Retail & Commercial Sectors Needs Assessment 179 24 June 2013 12047 Report Rev 0
2012 2016 2021 2026 2031
Personal & other goods $33.20 $35.17 $37.19 $38.13 $39.09 Core bulky goods $20.86 $22.10 $23.37 $23.96 $24.57 Ancillary bulky goods $27.52 $29.16 $30.83 $31.61 $32.41 Hardware $8.20 $8.68 $9.18 $9.41 $9.65 Takeaway liquor $11.83 $12.54 $13.26 $13.59 $13.93 Total Grocery & Specialty $211.13 $223.68 $236.51 $242.49 $248.61 Total Bulky Goods $56.58 $59.94 $63.38 $64.98 $66.62 Total $267.71 $283.62 $299.90 $307.47 $315.23 Burpengary - Narangba Groceries & take home food $93.35 $102.51 $125.41 $158.60 $196.18 Dining & take-away food (incl. on-premise liquor) $45.54 $50.01 $61.18 $77.38 $95.71 Clothing, footwear & apparel $30.90 $33.93 $41.51 $52.50 $64.94 Personal & other goods $37.31 $40.97 $50.13 $63.39 $78.41 Core bulky goods $24.72 $27.14 $33.21 $42.00 $51.95 Ancillary bulky goods $33.70 $37.01 $45.28 $57.26 $70.82 Hardware $8.86 $9.73 $11.91 $15.06 $18.63 Takeaway liquor $11.41 $12.53 $15.33 $19.38 $23.97 Total Grocery & Specialty $218.50 $239.94 $293.56 $371.25 $459.21 Total Bulky Goods $67.28 $73.89 $90.40 $114.32 $141.41 Total $285.78 $313.83 $383.96 $485.58 $600.61 Caboolture East Groceries & take home food $69.19 $72.48 $76.82 $79.05 $81.28 Dining & take-away food (incl. on-premise liquor) $30.16 $31.60 $33.49 $34.46 $35.43 Clothing, footwear & apparel $19.51 $20.44 $21.66 $22.29 $22.92 Personal & other goods $24.15 $25.30 $26.81 $27.59 $28.37 Core bulky goods $15.33 $16.06 $17.02 $17.51 $18.01 Ancillary bulky goods $20.34 $21.31 $22.59 $23.24 $23.90 Hardware $5.92 $6.20 $6.58 $6.77 $6.96 Takeaway liquor $8.39 $8.79 $9.31 $9.58 $9.85 Total Grocery & Specialty $151.40 $158.61 $168.10 $172.98 $177.87 Total Bulky Goods $41.59 $43.57 $46.18 $47.52 $48.86 Total $192.99 $202.18 $214.28 $220.50 $226.73 Caboolture Hinterland Groceries & take home food $32.16 $37.34 $43.40 $49.03 $56.35 Dining & take-away food (incl. on-premise liquor) $14.63 $16.99 $19.75 $22.31 $25.64 Clothing, footwear & apparel $9.65 $11.21 $13.02 $14.71 $16.91 Personal & other goods $11.82 $13.73 $15.96 $18.03 $20.72 Core bulky goods $7.64 $8.87 $10.31 $11.64 $13.38 Ancillary bulky goods $10.25 $11.90 $13.83 $15.63 $17.96 Hardware $2.86 $3.33 $3.86 $4.37 $5.02 Takeaway liquor $3.91 $4.54 $5.28 $5.96 $6.85 Total Grocery & Specialty $72.17 $83.82 $97.40 $110.04 $126.47 Total Bulky Goods $20.75 $24.10 $28.00 $31.63 $36.36 Total $92.92 $107.91 $125.40 $141.67 $162.82 Caboolture Midwest Groceries & take home food $54.39 $61.15 $70.63 $79.64 $89.24 Dining & take-away food (incl. on-premise liquor) $26.54 $29.83 $34.46 $38.86 $43.54 Clothing, footwear & apparel $18.00 $20.24 $23.38 $26.36 $29.54 Personal & other goods $21.74 $24.44 $28.23 $31.84 $35.67 Core bulky goods $14.40 $16.20 $18.71 $21.09 $23.64 Ancillary bulky goods $19.64 $22.08 $25.50 $28.76 $32.22 Hardware $5.17 $5.81 $6.71 $7.56 $8.48 Takeaway liquor $6.65 $7.47 $8.63 $9.73 $10.91 Total Grocery & Specialty $127.31 $143.14 $165.34 $186.43 $208.91 Total Bulky Goods $39.21 $44.08 $50.92 $57.41 $64.34

Retail & Commercial Sectors Needs Assessment 180 24 June 2013 12047 Report Rev 0
2012 2016 2021 2026 2031
Total $166.52 $187.22 $216.26 $243.84 $273.24 Caboolture Morayfield Groceries & take home food $205.13 $249.08 $285.72 $311.18 $355.24 Dining & take-away food (incl. on-premise liquor) $90.47 $109.85 $126.01 $137.24 $156.67 Clothing, footwear & apparel $58.84 $71.45 $81.96 $89.26 $101.90 Personal & other goods $72.62 $88.18 $101.15 $110.17 $125.77 Core bulky goods $46.32 $56.24 $64.51 $70.26 $80.21 Ancillary bulky goods $61.67 $74.88 $85.90 $93.55 $106.80 Hardware $17.75 $21.55 $24.72 $26.92 $30.73 Takeaway liquor $24.89 $30.22 $34.67 $37.75 $43.10 Total Grocery & Specialty $451.95 $548.79 $629.51 $685.61 $782.69 Total Bulky Goods $125.73 $152.67 $175.13 $190.74 $217.75 Total $577.68 $701.46 $804.64 $876.35 $1,000.43 Central Pine West Groceries & take home food $93.59 $109.80 $130.54 $151.50 $167.43 Dining & take-away food (incl. on-premise liquor) $48.52 $56.92 $67.67 $78.54 $86.80 Clothing, footwear & apparel $30.08 $35.29 $41.96 $48.69 $53.81 Personal & other goods $39.50 $46.34 $55.10 $63.94 $70.67 Core bulky goods $24.69 $28.96 $34.43 $39.96 $44.16 Ancillary bulky goods $33.24 $39.00 $46.37 $53.81 $59.47 Hardware $9.43 $11.06 $13.15 $15.26 $16.87 Takeaway liquor $11.35 $13.32 $15.84 $18.38 $20.31 Total Grocery & Specialty $223.05 $261.67 $311.10 $361.05 $399.03 Total Bulky Goods $67.36 $79.02 $93.95 $109.03 $120.50 Total $290.41 $340.69 $405.05 $470.08 $519.54 Dakabin-Kallangur-Murrumba Downs Groceries & take home food $121.49 $143.66 $167.15 $180.55 $186.86 Dining & take-away food (incl. on-premise liquor) $57.08 $67.49 $78.53 $84.82 $87.79 Clothing, footwear & apparel $38.14 $45.11 $52.48 $56.69 $58.67 Personal & other goods $46.42 $54.89 $63.87 $68.99 $71.40 Core bulky goods $30.34 $35.88 $41.75 $45.10 $46.67 Ancillary bulky goods $41.03 $48.52 $56.45 $60.98 $63.11 Hardware $11.14 $13.17 $15.33 $16.56 $17.14 Takeaway liquor $14.80 $17.51 $20.37 $22.00 $22.77 Total Grocery & Specialty $277.93 $328.65 $382.39 $413.04 $427.49 Total Bulky Goods $82.52 $97.58 $113.53 $122.63 $126.92 Total $360.45 $426.23 $495.92 $535.67 $554.41 Griffin-Mango Hill Groceries & take home food $90.18 $129.26 $165.36 $205.90 $225.93 Dining & take-away food (incl. on-premise liquor) $44.57 $63.88 $81.72 $101.76 $111.65 Clothing, footwear & apparel $29.98 $42.97 $54.97 $68.45 $75.10 Personal & other goods $36.52 $52.35 $66.97 $83.39 $91.50 Core bulky goods $24.07 $34.51 $44.14 $54.97 $60.31 Ancillary bulky goods $32.81 $47.03 $60.16 $74.91 $82.20 Hardware $8.67 $12.43 $15.90 $19.80 $21.72 Takeaway liquor $11.01 $15.79 $20.20 $25.15 $27.60 Total Grocery & Specialty $212.26 $304.26 $389.22 $484.65 $531.78 Total Bulky Goods $65.55 $93.97 $120.21 $149.68 $164.23 Total $277.82 $398.22 $509.43 $634.33 $696.02 Hills District/Samford Groceries & take home food $137.81 $148.54 $154.93 $161.94 $169.68 Dining & take-away food (incl. on-premise liquor) $71.53 $77.10 $80.42 $84.06 $88.07 Clothing, footwear & apparel $44.25 $47.70 $49.75 $52.00 $54.49 Personal & other goods $58.23 $62.77 $65.46 $68.43 $71.70

Retail & Commercial Sectors Needs Assessment 181 24 June 2013 12047 Report Rev 0
2012 2016 2021 2026 2031
Core bulky goods $36.34 $39.17 $40.85 $42.70 $44.74 Ancillary bulky goods $48.92 $52.73 $54.99 $57.48 $60.23 Hardware $13.90 $14.99 $15.63 $16.34 $17.12 Takeaway liquor $16.72 $18.02 $18.79 $19.64 $20.58 Total Grocery & Specialty $328.53 $354.13 $369.35 $386.06 $404.52 Total Bulky Goods $99.15 $106.88 $111.47 $116.52 $122.09 Total $427.69 $461.00 $480.82 $502.58 $526.60 Lawnton - Bray Park Groceries & take home food $60.11 $64.95 $69.12 $72.51 $77.57 Dining & take-away food (incl. on-premise liquor) $28.29 $30.56 $32.53 $34.12 $36.50 Clothing, footwear & apparel $18.92 $20.44 $21.75 $22.82 $24.41 Personal & other goods $23.01 $24.86 $26.46 $27.76 $29.70 Core bulky goods $15.05 $16.26 $17.31 $18.16 $19.42 Ancillary bulky goods $20.36 $22.00 $23.41 $24.56 $26.27 Hardware $5.52 $5.97 $6.35 $6.66 $7.12 Takeaway liquor $7.33 $7.92 $8.42 $8.84 $9.45 Total Grocery & Specialty $137.66 $148.73 $158.28 $166.04 $177.63 Total Bulky Goods $40.94 $44.23 $47.07 $49.37 $52.82 Total $178.59 $192.95 $205.35 $215.41 $230.46 Petrie/Dayboro Groceries & take home food $68.68 $73.41 $79.52 $83.77 $86.53 Dining & take-away food (incl. on-premise liquor) $34.33 $36.69 $39.74 $41.86 $43.25 Clothing, footwear & apparel $22.66 $24.22 $26.23 $27.63 $28.54 Personal & other goods $28.09 $30.02 $32.52 $34.26 $35.39 Core bulky goods $18.28 $19.54 $21.17 $22.30 $23.04 Ancillary bulky goods $24.85 $26.56 $28.77 $30.31 $31.31 Hardware $6.68 $7.14 $7.73 $8.14 $8.41 Takeaway liquor $8.38 $8.95 $9.70 $10.22 $10.55 Total Grocery & Specialty $162.13 $173.30 $187.70 $197.73 $204.26 Total Bulky Goods $49.81 $53.24 $57.67 $60.75 $62.76 Total $211.94 $226.54 $245.38 $258.49 $267.02 Redcliffe Groceries & take home food $230.06 $242.69 $261.24 $278.62 $294.21 Dining & take-away food (incl. on-premise liquor) $102.89 $108.54 $116.83 $124.61 $131.58 Clothing, footwear & apparel $67.33 $71.03 $76.46 $81.55 $86.11 Personal & other goods $82.84 $87.39 $94.06 $100.32 $105.94 Core bulky goods $53.13 $56.05 $60.33 $64.35 $67.95 Ancillary bulky goods $71.00 $74.90 $80.63 $85.99 $90.80 Hardware $20.16 $21.27 $22.89 $24.42 $25.78 Takeaway liquor $27.94 $29.47 $31.73 $33.84 $35.73 Total Grocery & Specialty $511.05 $539.12 $580.32 $618.93 $653.56 Total Bulky Goods $144.29 $152.22 $163.85 $174.75 $184.53 Total $655.34 $691.34 $744.18 $793.69 $838.09 Rothwell - Deception Bay Groceries & take home food $117.63 $132.52 $145.80 $153.18 $161.31 Dining & take-away food (incl. on-premise liquor) $51.77 $58.32 $64.16 $67.41 $70.99 Clothing, footwear & apparel $33.64 $37.89 $41.69 $43.80 $46.12 Personal & other goods $41.54 $46.79 $51.48 $54.09 $56.96 Core bulky goods $26.47 $29.82 $32.80 $34.46 $36.29 Ancillary bulky goods $35.22 $39.68 $43.65 $45.86 $48.30 Hardware $10.16 $11.44 $12.59 $13.23 $13.93 Takeaway liquor $14.27 $16.08 $17.69 $18.58 $19.57 Total Grocery & Specialty $258.84 $291.61 $320.82 $337.05 $354.95 Total Bulky Goods $71.84 $80.94 $89.05 $93.55 $98.52 Total $330.68 $372.54 $409.87 $430.60 $453.46

Retail & Commercial Sectors Needs Assessment 182 24 June 2013 12047 Report Rev 0
2012 2016 2021 2026 2031
Strathpine Groceries & take home food $75.74 $83.16 $91.25 $97.46 $101.47 Dining & take-away food (incl. on-premise liquor) $36.11 $39.65 $43.50 $46.46 $48.38 Clothing, footwear & apparel $24.27 $26.65 $29.25 $31.24 $32.52 Personal & other goods $29.45 $32.34 $35.48 $37.90 $39.46 Core bulky goods $19.35 $21.25 $23.32 $24.90 $25.93 Ancillary bulky goods $26.26 $28.83 $31.63 $33.79 $35.18 Hardware $7.04 $7.73 $8.48 $9.06 $9.43 Takeaway liquor $9.24 $10.14 $11.13 $11.89 $12.38 Total Grocery & Specialty $174.81 $191.94 $210.61 $224.94 $234.21 Total Bulky Goods $52.65 $57.81 $63.43 $67.75 $70.54 Total $227.46 $249.75 $274.04 $292.68 $304.75 Total Groceries & take home food $1,647.26 $1,861.58 $2,095.27 $2,303.42 $2,502.42 Dining & take-away food (incl. on-premise liquor) $776.57 $878.00 $989.09 $1,089.06 $1,183.53 Clothing, footwear & apparel $504.69 $571.04 $643.80 $709.45 $771.35 Personal & other goods $629.12 $711.41 $801.61 $882.93 $959.64 Core bulky goods $403.29 $456.30 $514.49 $567.08 $616.56 Ancillary bulky goods $542.09 $613.49 $691.94 $762.97 $829.68 Hardware $151.66 $171.46 $193.14 $212.64 $231.07 Takeaway liquor $200.22 $226.29 $254.72 $280.06 $304.28 Total Grocery & Specialty $3,757.86 $4,248.32 $4,784.49 $5,264.93 $5,721.23 Total Bulky Goods $1,097.04 $1,241.26 $1,399.56 $1,542.69 $1,677.31 Total $4,854.90 $5,489.57 $6,184.06 $6,807.61 $7,398.54
Source: Derived from Table 6.1 and Table B.1

Retail & Commercial Sectors Needs Assessment 183 24 June 2013 12047 Report Rev 0
APPENDIX C
SUPPORTABLE FLOOR SPACE

Retail & Commercial Sectors Needs Assessment 184 24 June 2013 12047 Report Rev 0
Table C.1: Supportable Floor Space generated within Retail Catchments, 2012-2031 (sqm)
2012 2016 2021 2026 2031
Albany Creek Groceries & take home food 10,588 11,378 12,587 13,577 14,614 Dining & take-away food (incl. on-premise liquor) 7,351 7,899 8,739 9,426 10,146 Clothing, footwear & apparel 4,245 4,561 5,046 5,443 5,859 Personal & other goods 6,639 7,134 7,892 8,513 9,163 Core bulky goods 4,507 4,843 5,357 5,779 6,220 Ancillary bulky goods 5,292 5,687 6,291 6,786 7,304 Hardware 2,857 3,070 3,396 3,663 3,943 Takeaway liquor 1,715 1,843 2,039 2,200 2,368 Total Grocery & Specialty 30,538 32,815 36,303 39,160 42,150 Total Bulky Goods 12,655 13,599 15,044 16,228 17,467 Total 43,194 46,414 51,347 55,388 59,618 Bribie Island Groceries & take home food 11,214 11,880 12,562 12,879 13,204 Dining & take-away food (incl. on-premise liquor) 7,708 8,166 8,635 8,853 9,076 Clothing, footwear & apparel 5,335 5,652 5,976 6,127 6,282 Personal & other goods 6,824 7,229 7,644 7,837 8,035 Core bulky goods 5,365 5,684 6,010 6,162 6,318 Ancillary bulky goods 6,192 6,560 6,936 7,112 7,291 Hardware 3,033 3,213 3,397 3,483 3,571 Takeaway liquor 1,923 2,037 2,154 2,209 2,264 Total Grocery & Specialty 33,004 34,964 36,971 37,905 38,862 Total Bulky Goods 14,590 15,457 16,344 16,756 17,179 Total 47,593 50,421 53,315 54,661 56,041 Burpengary - Narangba Groceries & take home food 10,433 11,457 14,017 17,726 21,926 Dining & take-away food (incl. on-premise liquor) 8,197 9,001 11,013 13,928 17,227 Clothing, footwear & apparel 5,836 6,409 7,841 9,916 12,266 Personal & other goods 7,462 8,194 10,025 12,679 15,682 Core bulky goods 6,003 6,592 8,065 10,200 12,617 Ancillary bulky goods 7,161 7,864 9,621 12,168 15,050 Hardware 3,191 3,505 4,288 5,422 6,707 Takeaway liquor 1,806 1,983 2,426 3,069 3,796 Total Grocery & Specialty 33,734 37,044 45,323 57,318 70,897 Total Bulky Goods 16,356 17,961 21,974 27,790 34,374 Total 50,089 55,005 67,297 85,108 105,270 Caboolture East Groceries & take home food 7,937 8,314 8,812 9,068 9,324 Dining & take-away food (incl. on-premise liquor) 5,580 5,845 6,195 6,375 6,555 Clothing, footwear & apparel 3,902 4,088 4,333 4,459 4,585 Personal & other goods 4,964 5,200 5,512 5,672 5,832 Core bulky goods 3,941 4,129 4,376 4,503 4,630 Ancillary bulky goods 4,577 4,795 5,082 5,230 5,377 Hardware 2,191 2,295 2,433 2,503 2,574 Takeaway liquor 1,363 1,428 1,513 1,557 1,601 Total Grocery & Specialty 23,746 24,876 26,365 27,130 27,897 Total Bulky Goods 10,710 11,220 11,891 12,236 12,582 Total 34,456 36,096 38,256 39,366 40,478 Caboolture Hinterland Groceries & take home food 3,689 4,284 4,978 5,624 6,463 Dining & take-away food (incl. on-premise liquor) 2,707 3,144 3,653 4,127 4,744 Clothing, footwear & apparel 1,930 2,241 2,604 2,942 3,382 Personal & other goods 2,430 2,823 3,280 3,706 4,259

Retail & Commercial Sectors Needs Assessment 185 24 June 2013 12047 Report Rev 0
2012 2016 2021 2026 2031
Core bulky goods 1,964 2,280 2,650 2,994 3,441 Ancillary bulky goods 2,306 2,678 3,112 3,516 4,041 Hardware 1,059 1,230 1,430 1,615 1,856 Takeaway liquor 635 738 857 969 1,113 Total Grocery & Specialty 11,391 13,229 15,373 17,368 19,961 Total Bulky Goods 5,329 6,189 7,192 8,125 9,338 Total 16,720 19,418 22,565 25,493 29,299 Caboolture Midwest Groceries & take home food 6,238 7,014 8,102 9,135 10,236 Dining & take-away food (incl. on-premise liquor) 4,909 5,519 6,375 7,189 8,055 Clothing, footwear & apparel 3,601 4,049 4,677 5,273 5,909 Personal & other goods 4,469 5,024 5,804 6,544 7,333 Core bulky goods 3,704 4,164 4,810 5,424 6,078 Ancillary bulky goods 4,419 4,968 5,738 6,470 7,250 Hardware 1,911 2,149 2,482 2,799 3,136 Takeaway liquor 1,080 1,214 1,403 1,581 1,772 Total Grocery & Specialty 20,297 22,820 26,360 29,722 33,305 Total Bulky Goods 10,034 11,281 13,031 14,693 16,464 Total 30,331 34,102 39,391 44,415 49,770 Caboolture Morayfield Groceries & take home food 23,530 28,571 32,774 35,694 40,749 Dining & take-away food (incl. on-premise liquor) 16,737 20,323 23,312 25,390 28,985 Clothing, footwear & apparel 11,768 14,290 16,392 17,852 20,380 Personal & other goods 14,928 18,126 20,793 22,646 25,852 Core bulky goods 11,910 14,462 16,589 18,068 20,626 Ancillary bulky goods 13,876 16,849 19,327 21,050 24,030 Hardware 6,566 7,973 9,146 9,961 11,372 Takeaway liquor 4,044 4,911 5,633 6,135 7,004 Total Grocery & Specialty 71,007 86,221 98,904 107,718 122,969 Total Bulky Goods 32,352 39,284 45,063 49,079 56,028 Total 103,359 125,505 143,967 156,796 178,997 Central Pine West Groceries & take home food 10,736 12,594 14,973 17,377 19,206 Dining & take-away food (incl. on-premise liquor) 8,976 10,530 12,519 14,529 16,058 Clothing, footwear & apparel 6,016 7,058 8,391 9,738 10,763 Personal & other goods 8,120 9,526 11,326 13,144 14,527 Core bulky goods 6,348 7,447 8,854 10,275 11,356 Ancillary bulky goods 7,480 8,775 10,432 12,107 13,381 Hardware 3,489 4,093 4,867 5,648 6,242 Takeaway liquor 1,845 2,164 2,573 2,987 3,301 Total Grocery & Specialty 35,693 41,873 49,783 57,776 63,855 Total Bulky Goods 17,317 20,315 24,152 28,030 30,979 Total 53,010 62,187 73,936 85,806 94,834 Dakabin-Kallangur-Murrumba Downs Groceries & take home food 13,221 15,633 18,190 19,648 20,335 Dining & take-away food (incl. on-premise liquor) 9,703 11,473 13,350 14,420 14,924 Clothing, footwear & apparel 6,781 8,019 9,330 10,078 10,430 Personal & other goods 8,768 10,368 12,063 13,031 13,486 Core bulky goods 6,936 8,201 9,543 10,307 10,668 Ancillary bulky goods 8,206 9,704 11,291 12,196 12,622 Hardware 3,788 4,479 5,212 5,630 5,827 Takeaway liquor 2,282 2,699 3,140 3,392 3,511 Total Grocery & Specialty 40,756 48,193 56,073 60,568 62,687 Total Bulky Goods 18,930 22,385 26,045 28,133 29,117 Total 59,686 70,577 82,118 88,701 91,803

Retail & Commercial Sectors Needs Assessment 186 24 June 2013 12047 Report Rev 0
2012 2016 2021 2026 2031
Griffin-Mango Hill Groceries & take home food 10,079 14,447 18,481 23,013 25,251 Dining & take-away food (incl. on-premise liquor) 8,022 11,499 14,710 18,317 20,098 Clothing, footwear & apparel 5,663 8,117 10,383 12,929 14,186 Personal & other goods 7,305 10,470 13,394 16,678 18,300 Core bulky goods 5,847 8,380 10,721 13,349 14,647 Ancillary bulky goods 6,972 9,994 12,785 15,919 17,468 Hardware 3,121 4,474 5,724 7,127 7,820 Takeaway liquor 1,744 2,500 3,198 3,982 4,369 Total Grocery & Specialty 32,812 47,033 60,167 74,919 82,204 Total Bulky Goods 15,940 22,849 29,229 36,396 39,935 Total 48,752 69,881 89,396 111,314 122,139 Hills District/Samford Groceries & take home food 14,591 15,728 16,404 17,146 17,966 Dining & take-away food (incl. on-premise liquor) 10,014 10,794 11,258 11,768 12,330 Clothing, footwear & apparel 5,900 6,360 6,633 6,933 7,265 Personal & other goods 9,058 9,764 10,183 10,644 11,153 Core bulky goods 6,229 6,714 7,003 7,320 7,670 Ancillary bulky goods 7,337 7,909 8,249 8,622 9,034 Hardware 3,893 4,196 4,376 4,574 4,793 Takeaway liquor 2,368 2,552 2,662 2,783 2,916 Total Grocery & Specialty 41,932 45,198 47,141 49,274 51,629 Total Bulky Goods 17,459 18,819 19,628 20,516 21,497 Total 59,391 64,017 66,769 69,790 73,126 Lawnton - Bray Park Groceries & take home food 6,719 7,259 7,725 8,104 8,670 Dining & take-away food (incl. on-premise liquor) 5,092 5,501 5,855 6,141 6,570 Clothing, footwear & apparel 3,573 3,861 4,109 4,310 4,611 Personal & other goods 4,603 4,973 5,292 5,551 5,939 Core bulky goods 3,656 3,950 4,203 4,409 4,717 Ancillary bulky goods 4,327 4,675 4,975 5,219 5,583 Hardware 1,988 2,147 2,285 2,397 2,565 Takeaway liquor 1,160 1,253 1,334 1,399 1,497 Total Grocery & Specialty 21,146 22,847 24,315 25,505 27,287 Total Bulky Goods 9,970 10,772 11,464 12,025 12,865 Total 31,117 33,618 35,778 37,531 40,153 Petrie/Dayboro Groceries & take home food 7,878 8,421 9,121 9,608 9,925 Dining & take-away food (incl. on-premise liquor) 6,350 6,788 7,352 7,745 8,001 Clothing, footwear & apparel 4,531 4,844 5,246 5,527 5,709 Personal & other goods 5,773 6,171 6,684 7,041 7,274 Core bulky goods 4,702 5,026 5,443 5,734 5,923 Ancillary bulky goods 5,592 5,977 6,474 6,820 7,045 Hardware 2,470 2,640 2,860 3,013 3,112 Takeaway liquor 1,361 1,455 1,576 1,660 1,715 Total Grocery & Specialty 25,894 27,678 29,979 31,581 32,623 Total Bulky Goods 12,764 13,643 14,777 15,567 16,080 Total 38,658 41,321 44,757 47,148 48,704 Redcliffe Groceries & take home food 25,712 27,124 29,197 31,140 32,882 Dining & take-away food (incl. on-premise liquor) 18,520 19,537 21,030 22,429 23,684 Clothing, footwear & apparel 12,719 13,417 14,443 15,404 16,265 Personal & other goods 16,567 17,477 18,813 20,065 21,187 Core bulky goods 12,904 13,612 14,653 15,627 16,502

Retail & Commercial Sectors Needs Assessment 187 24 June 2013 12047 Report Rev 0
2012 2016 2021 2026 2031
Ancillary bulky goods 15,088 15,916 17,133 18,273 19,295 Hardware 7,258 7,656 8,242 8,790 9,282 Takeaway liquor 4,424 4,667 5,023 5,357 5,657 Total Grocery & Specialty 77,941 82,222 88,506 94,394 99,676 Total Bulky Goods 35,249 37,185 40,027 42,690 45,078 Total 113,190 119,407 128,533 137,085 144,754 Rothwell - Deception Bay Groceries & take home food 13,147 14,812 16,296 17,120 18,029 Dining & take-away food (incl. on-premise liquor) 9,318 10,498 11,549 12,133 12,778 Clothing, footwear & apparel 6,353 7,158 7,875 8,273 8,712 Personal & other goods 8,307 9,359 10,296 10,817 11,391 Core bulky goods 6,428 7,241 7,967 8,370 8,814 Ancillary bulky goods 7,484 8,432 9,276 9,745 10,263 Hardware 3,656 4,119 4,532 4,761 5,014 Takeaway liquor 2,259 2,545 2,800 2,942 3,098 Total Grocery & Specialty 39,385 44,371 48,817 51,285 54,008 Total Bulky Goods 17,568 19,792 21,775 22,876 24,091 Total 56,953 64,163 70,592 74,161 78,099 Strathpine Groceries & take home food 8,242 9,050 9,930 10,605 11,043 Dining & take-away food (incl. on-premise liquor) 6,138 6,740 7,395 7,898 8,224 Clothing, footwear & apparel 4,316 4,738 5,199 5,553 5,782 Personal & other goods 5,563 6,108 6,702 7,158 7,453 Core bulky goods 4,424 4,857 5,330 5,692 5,927 Ancillary bulky goods 5,251 5,766 6,327 6,757 7,036 Hardware 2,394 2,628 2,884 3,080 3,207 Takeaway liquor 1,424 1,564 1,716 1,833 1,908 Total Grocery & Specialty 25,683 28,200 30,942 33,048 34,410 Total Bulky Goods 12,069 13,252 14,540 15,530 16,170 Total 37,752 41,452 45,483 48,577 50,580 Total Groceries & take home food 183,952 207,965 234,148 257,465 279,822 Dining & take-away food (incl. on-premise liquor) 135,322 153,257 172,941 190,668 207,455 Clothing, footwear & apparel 92,470 104,861 118,478 130,758 142,386 Personal & other goods 121,780 137,947 155,704 171,725 186,867 Core bulky goods 94,865 107,584 121,574 134,214 146,154 Ancillary bulky goods 111,560 126,547 143,050 157,989 172,071 Hardware 52,866 59,869 67,553 74,467 81,020 Takeaway liquor 31,435 35,555 40,050 44,054 47,890 Total Grocery & Specialty 564,959 639,585 721,321 794,670 864,420 Total Bulky Goods 259,291 294,000 332,177 366,670 399,245 Total 824,250 933,585 1,053,498 1,161,340 1,263,666
Source: Derived from Table B.2 and Economic Associates estimates

Retail & Commercial Sectors Needs Assessment 188 24 June 2013 12047 Report Rev 0
APPENDIX D
DEVELOPMENT APPROVALS

Retail & Commercial Sectors Needs Assessment 189 24 June 2013 12047 Report Rev 0
Development Approvals
Between 2005 and 2013, there have been 93 development approvals within Moreton Bay RC including up to 117,246m2 of retail floor space and up to 28,657m2 of commercial floor space. The most significant catchments in terms of the number of approvals were:
• Caboolture – Morayfield: 41 approvals;
• Burpengary – Narangba: 12 approvals; and
• Bribie Island: 10 approvals.
Table D.1 below shows the development approvals within Moreton Bay Regional Council.

Retail & Commercial Sectors Needs Assessment 190 24 June 2013 12047 Report Rev 0
Table D.1: Development Approvals, Moreton Bay Regional Council, 2005-2013
Address District Retail
Floor
Space (m2)
Commercial
Floor
Space (m2)
Total
GFA (m2)
Lot 4 Old Northern Road, Albany Creek Albany Creek 84 840 924 703 & 705 Albany Creek Road, Albany Creek Albany Creek - 457 457 138-150 Goodwin Drive, Bongaree Bribie Island 320 320
229-231 Goodwin Drive, Bongaree Bribie Island 78 - 78 Lot 190 Marina Drive, Lot 183 Seaside Drive and Lot 205 Sunderland Drive, Banksia Beach
Bribie Island 2,000 - 2,000
12-40 Foley Street, Bongaree Bribie Island 97 - 97 71 Dolphin Drive, Bongaree Bribie Island 1,504 - 1,504 22 Ferguson Road, Bongaree Bribie Island - 10 10 1-5 Coolgarra Avenue, Bongaree Bribie Island 400 - 400 4 Eucalypt Street, Bellara Bribie Island 110 - 110 21 First Avenue, Bongaree Bribie Island - 65 65 37 Charlotte Avenue, Bongaree Bribie Island - 250 250 115-117 Buckley Road, Burpengary Burpengary - Narangba 2,360 2,100 4,270 175, 177 & 181-183 Station Road, 11 & 15 North Shore Drive and Lot 10, 23-31 Progress Road, Burpengary
Burpengary - Narangba 7,706 - 7,706
Lot 10, 23-31 Progress Road, Burpengary Burpengary - Narangba 49 Progress Road, Burpengary Burpengary - Narangba - 425 425 157-159 Station Road, Burpengary Burpengary - Narangba - 610 610 20 North Shore Drive, Burpengary Burpengary - Narangba - 419 419 20 Young Road and 1 Marshman Road, Narangba Burpengary - Narangba - 258 258 238 Young Road, Narangba Burpengary - Narangba 1,200 1,200 30 Main Street, Narangba Burpengary - Narangba - 56 56 27-33 Boundary Road, Narangba Burpengary - Narangba 4,785 - 4,785 28 Main Street, Narangba Burpengary - Narangba 400 300 700 49 Golden Wattle Drive, Narangba Burpengary - Narangba 360 185 545 Lot 986 Pettigrew Street, Caboolture Caboolture - Morayfield 4,000 - 4,000 21-25 Bertha Street, Caboolture Caboolture - Morayfield - 796 796 20 George Street, Caboolture Caboolture - Morayfield - 1,900 1,900 41 Kiara Close, Caboolture Caboolture - Morayfield - 307 307 6-12 Dickson Road, Morayfield Caboolture - Morayfield 2,852 - 2,852 70-86 Michael Avenue, Caboolture South Caboolture - Morayfield 2,866 - 2,866 343 Morayfield Rd, Morayfield Caboolture - Morayfield 11,830 - 11,830 168-172 Morayfield Rd, Morayfield Caboolture - Morayfield 3,261 - 3,261 1 Adrossan Road, Caboolture Caboolture - Morayfield 3,790 - 3,790 15 Graham Road, Morayfield Caboolture - Morayfield 491 491

Retail & Commercial Sectors Needs Assessment 191 24 June 2013 12047 Report Rev 0
Address District Retail
Floor
Space (m2)
Commercial
Floor
Space (m2)
Total
GFA (m2)
1 Church Street, Caboolture South Caboolture - Morayfield - 218 218 42, 44 & 42A Beerburrum Road, Caboolture Caboolture - Morayfield 2,606 - 2,606 158-166 Morayfield Road, Morayfield Caboolture - Morayfield 332 472 804 265 Morayfield Road, Morayfield Caboolture - Morayfield 5,273 - 5,273 423-479 Pumicestone Road, Caboolture Caboolture - Morayfield 1,022 622 1,644 Unit 5 64 William Berry Drive, Morayfield Caboolture - Morayfield - 234 234 42-68 Manley Street, Caboolture Caboolture - Morayfield - 654 654 Lot 11 King Street, Caboolture Caboolture - Morayfield - 2,399 2,399 Lot 972 Pettigrew Street, Caboolture Caboolture - Morayfield 3,850 1,510 5,360 11-13 Bertha Street, Caboolture Caboolture - Morayfield - 1,500 1,500 10-20 Walkers Road, Morayfield Caboolture - Morayfield 494 494 67-73 Morayfield Road, Caboolture South Caboolture - Morayfield 374 251 625 171 and 177-189 Morayfield Road, Morayfield Caboolture - Morayfield 347 - 347 78-80 William Berry Drive, Morayfield Caboolture - Morayfield 840 - 840 46 Beerburrum Road, Caboolture Caboolture - Morayfield 45 - 45 20 Beerburrum Road, Caboolture Caboolture - Morayfield 413 - 413 92 Morayfield Road, Caboolture South Caboolture - Morayfield 176 - 176 65-75 Bellmere Road, Bellmere Caboolture - Morayfield - 165 165 24 George Street, Caboolture Caboolture - Morayfield - 142 - 369 Morayfield Road, Morayfield Caboolture - Morayfield 8,958 - - 50 Beerburrum Road, Caboolture Caboolture - Morayfield 243 - 243 22-28 Rowe Street, Caboolture Caboolture - Morayfield 261 - 261 44-54 Pasturage Road, Caboolture Caboolture - Morayfield 679 471 1,150 321 and 343 Morayfield Road and 29-33 Station Road, Morayfield
Caboolture - Morayfield 9,288 - 9,288
1-5 Oakey Flat Road, Morayfield Caboolture - Morayfield 2,727 2,727 2,727 312-344 Morayfield Road, Morayfield Caboolture - Morayfield 5,000 - 5,000 201-205 Morayfield Road, Morayfield Caboolture - Morayfield - 100 100 80-90 Morayfield Road and 6-8 Frank Street, Caboolture South
Caboolture - Morayfield 1,173 1,532 2,705
423-479 Pumicestone Road, Caboolture Caboolture - Morayfield 4,000 1,100 5,100 4 Blue Gum Terrace, Caboolture South Caboolture - Morayfield - 154 154 17 Concorde Place, Caboolture Caboolture - Morayfield 954 - 954 544Beachmere Road, Beachmere Caboolture East - 163 163 754-756 Bestmann Road, Ningi Caboolture East 160 - 2-10 James Road, Beachmere Caboolture East 800 750 - 102-12 Archer Street, Woodford Caboolture Hinterland 649 - 649 98 ArcherStreet, WOODFORD Caboolture Hinterland 45 - 45 2011 D'Aguilar Highway, D'AGUILAR Caboolture Hinterland 1,193 - 1,193

Retail & Commercial Sectors Needs Assessment 192 24 June 2013 12047 Report Rev 0
Address District Retail
Floor
Space (m2)
Commercial
Floor
Space (m2)
Total
GFA (m2)
1381-1387 Anzac Avenue, Kallangur Dakabin - Kallangur - Murrumba Downs
366 - 366
6 Oxley Street, North Lakes Griffin - Mango Hill 550 - 550 4-10 Burke Crescent and 5-7 Wills Street, North Lakes Griffin - Mango Hill 7,270 300 7,770 18-20 Burke Crescent, North Lakes Griffin - Mango Hill 1,680 - 1,680 Lot 74 Endeavour Boulevard, North Lakes Griffin - Mango Hill 504 504 504 Lot 822 Ferny Way, Ferny Hills Hills District / Samford 477 477 477 125 McKenzie Street, Dayboro Petrie / Dayboro - 51 51 564 Oxley Avenue, Scarborough Redcliffe - 196 196 6 Silvyn Street, Redcliffe Redcliffe 1,000 4 Oasis Court, Clontarf Redcliffe 374 - 374 99 Anzac Avenue, Redcliffe Redcliffe - 55 55 11 Boardman Road, Kippa-Ring Redcliffe - 124 124 31 Ashmole Road, Redcliffe Redcliffe - 129 129 743-757 Deception Bay Road, Rothwell Rothwell / Deception Bay - 153 153 1-7 Mariner Boulevard, Deception Bay Rothwell / Deception Bay 82 - 82 99-101 Esplanade, Deception Bay Rothwell / Deception Bay 178 178 424-438 Deception Bay Road and Lot 7 Flegg Street, Deception Bay
Rothwell / Deception Bay 1,525 - 1,525
661-675 Deception Bay Road, Deception Bay Rothwell / Deception Bay - 250 250 1-45 Bay Avenue, Deception Bay Rothwell / Deception Bay 1,075 - 1,075 25 Zammit Street, Deception Bay Rothwell / Deception Bay - 135 135 Lot 1 Gympie Road, Strathpine Strathpine 1,441 - 1,441 518-520 Gympie Road, Strathpine Strathpine - 470 470
Source: Information provided by Moreton Bay Regional Council