Retail Background Paper - Nottinghamgossweb.nottinghamcity.gov.uk/dave/dawn/new/Retail.pdf · The...
38
Nottingham City Council Retail Background Paper Background Paper to the Land and Planning Policies Development Plan Document (Local Plan Part 2) November 2015
Transcript of Retail Background Paper - Nottinghamgossweb.nottinghamcity.gov.uk/dave/dawn/new/Retail.pdf · The...

Nottingham City Council
Retail Background Paper
Background Paper to the Land and Planning
Policies Development Plan Document
(Local Plan Part 2)
November 2015

1
CONTENTS
1. Introduction
2. National Policy and Guidance
3. Nottingham Aligned Core Strategy (2014)
4. Evidence Base
5. Retail Designations
6. Hierarchy of Centres
7. Nottingham City Centre
City Centre Boundary
City Centre Primary Shopping Area
City Centre Primary Shopping Frontages
City Centre Quarters
Independent Retail Clusters
8. Development in ‘out of centre’ and ‘edge of centre’ locations
9. New and Enhanced Floorspace
City Centre
Outside the City Centre
10. Food and Drink Uses
11. Hot Food Takeaways
12. Markets
13. Conclusions APPENDICES APPENDIX 1: Nottingham City Centre Survey 2012 / 2013 APPENDIX 2: Citywide Centres Survey, Hierarchy and Ranking 2009/ 2011
APPENDIX 3: City Centre Survey July 2014 APPENDIX 4: City Centre Vacancy May 2015 APPENDIX 5: City Centre Distribution of Uses May 2015

1
1. Introduction 1.1 The purpose of this paper is to consider Nottingham City Council’s policy approach to supporting the vitality of its City, Town, Local and District Centres and smaller Centres of Neighbourhood Importance with a particular focus on retail policy. 2. National Policy and Guidance National Planning Policy Framework and National Planning Practice Guidance 2.1 The National Planning Policy Framework (NPPF) published in March 2012 and supporting Planning Practice Guidance published in March 2014 (PPG) establishes an updated national position in relation to retail / town centre planning policy, which in broad terms carries forward the key principles of national policy previously set out in Planning Policy Statement (PPS) 4 and the accompanying Practice Guidance on Planning for Town Centres. The NPPF requires Local Planning Authorities (LPA) to apply its overarching principles at a local level by drawing up positive local planning policies to support sustainable town centres. 2.2 The golden thread at the heart of the NPPF, running through both plan-making and decision-taking, is a presumption in favour of sustainable development. In retail terms, the fundamental emphasis is that LPAs should prepare positive policies that promote competitive town centre environments, recognising that they lie at the heart of the community. Through an appropriate framework of policies LPAs should help to support the management and growth of centres over the plan period, and their overall vitality and viability. 2.3 A key policy requirement is the need to define a network and hierarchy of centres that is resilient to future economic changes, with clearly delineated centre boundaries and appropriately defined primary and secondary frontages that have corresponding policies which promote suitable uses. Policies should also help to support customer choice, a diverse retail offer and reflect the individuality of town centres. The retention and enhancement of existing markets should be supported, along with the re-introduction or creation of new markets, where appropriate.
2.4 It is necessary to allocate a range of sites to meet the scale and type of retail, leisure, commercial, office, tourism, cultural, community and residential development needed in town centres, ensuring that needs are not compromised by limited site availability. Where suitable and viable town centre sites are not available, appropriate edge of centre sites for main town centre uses that are well connected to the town centre should be allocated to meet any identified need.
2.5 Policies should be set for the consideration of main town centre uses, including a requirement for them to be located in town centres, then edge of centre locations and only if suitable sites are not available should out of centre
2
sites be considered. The sequential and impact tests should be applied for main town centre uses that are not in-centre and do not accord with the plan. The submission of an impact assessment is, however, only required if the development is over a proportionate, locally set floorspace threshold (if there is no locally set threshold, the default threshold is 2500sq m). 2.6 The NPPG sets out that local planning authorities should ensure that health and wellbeing, and health infrastructure are considered in local and neighbourhood plans and in planning decisions – including promotion of opportunities for healthy eating. This is particularly relevant in considering policies relating to local centres with accessible services and in considering policies for food retailing. The NPPG also sets out that consultation should take place with the Director of Public Health and Clinical Commissioning Groups. Changes to Permitted Development Rights
2.7 In addition to the NPPF and NPPG, the policies reflect subsequent changes to retail policy made by Government. These include changes to Permitted Development rights so that planning permission in now required for change to Pay Day Loan shops. Planning permission is also now required for change of use/development of public houses which are Assets of Community Value in recognition of the potential harm that such developments may have to local communities and the value placed on some public houses by local residents. These aspects are addressed in the Local Services and Healthy Lifestyles section of the Local Plan Part 2. Government has also extended permitted development rights so that changes of use from retail to other non-retail uses do not require planning permission.
3. Nottingham Aligned Core Strategy (2014)
3.1 The Nottingham Aligned Core Strategy (Core Strategy - adopted in September 2014) was prepared in conjunction with neighbouring authorities within the conurbation. The Core Strategy replaces the strategic elements of the ‘saved’ policies within the Nottingham Local Plan 2005, the more detailed aspects being addressed through policies within the Local Land and Planning Development Plan Document (LAPP), upon which this background paper focuses. 3.2 The Core Strategy sets the strategic planning policy framework for retail development and associated main town centre uses. Policy 5 sets out policies to maintain, promote and enhance Nottingham City Centre’s role as the region’s principal shopping, leisure and cultural destination. Policy 6 sets out a network and hierarchy of retail centres, whilst Policy 7 of the Core Strategy, Regeneration, provides for a range of supporting main town centre uses as part of a number of predominantly residential, employment and office led development across key sites within the Can, Eastside and Waterside Regeneration Zones).

3
4. Evidence Base 4.1 The development of the publication version policies has been informed by a range of data sources and studies, many of which have also been drawn upon in the preparation of the policies within the aligned Core Strategy. This paper concentrates primarily on those elements of additional data and analysis that have specifically informed the preparation of the Publication Version LAPP allocations, designations and policies. 4.2 This paper supplements a previous Retail Background Paper that accompanied the Core Strategy publication version in June 2012, which also provided a partial update to one of the components of the evidence base documents for both documents – the Greater Nottingham Retail Study 2008. 4.3 The following documents are particularly relevant:
Broxtowe, Gedling, Nottingham and Rushcliffe Retail Study (Carter Jonas 2015)
This study updates the previous Greater Nottingham Retail Survey (2008 – DTZ) and makes an assessment of the soundness of the retail hierarchy, It includes centre health checks, and is informed by a shoppers survey and provides an analysis of forecast retail capacity across the plan period.
The Nottingham City Centre Time and Place Plan Produced by Nottingham City Council, this is particularly relevant to policies relating to the City Centre. The plan focuses on how the various areas of the City Centre can be used in different ways to meet the needs of the whole community. The plan seeks to maximise the potential of the City Centre by creating a place that people want to use for shopping, work and leisure, being well managed and used throughout the day and evening. City Centre Quarters with distinctive characteristics have been identified and the policies within the LAPP seek to enhance these unique areas.
Nottingham City Centre Surveys Nottingham City Council undertakes an annual survey of vacancy and uses in the City Centre Area. Comprehensive surveys were undertaken in 2013 and 2014. To inform this background paper an early ‘light touch’ survey was also undertaken in May 2015. The 2013 and 2014 surveys are appended alongside plans from the May 2015 survey which indicate vacancy and distribution of uses.
City Wide Centre Surveys, Hierarchies and Rankings 2009/11 This comprehensive survey of 55 Centres informed the retail hierarchy of Town, District and Local Centres along with a lower tier of Centres of Neighbourhood Importance. A summary of the results of the survey is set out in Appendix 1.

4
Local Strategies The policies have been prepared with regard to the Nottingham Plan to 2020 (Sustainable Community Strategy), the Nottingham Growth Plan 2012, and the Nottingham City Centre Retail Strategy 2013. They have also been prepared to align, where relevant, with other emerging documents including the draft Health and Wellbeing Strategy 2013 -16, the Nottingham City Council Licensing Statement 2015 and other established strategies for evening economy management, crime reduction and licensing. 4.4 The formulation of policies, designations and allocations has also been informed by a broader shared evidence base that underpins other strategic documents such as the Nottingham City Centre Retail Strategy, including data and analysis commissioned from Experian in June 2012 in relation to catchment size, spend profile, demographics, shopping trends, market share and leakage, unit size and retail mix, car parking provision and retail yields. 4.5 In formulating the content of the publication version, regard has been given to the views and information gathered during on-going consultation and engagement with relevant stakeholders in connection with the preparation of the LAPP and other strategic documents. Comments received from stakeholders at the earlier stages of the LAPP are summarised in the Report of Consultation which can be viewed at www.nottinghamcity.gov.uk/localplan 5. Retail designations 5.1 The LAPP publication version designations have been established in accordance with the requirements of the NPPF and are consistent with the adopted Core Strategy. The designations are based upon analysis of the current pattern of retail provision and main town centre uses, along with the retail and other growth requirements identified for the City with the objective of reinforcing and enhancing the vitality and viability of centres within the hierarchy of centres established in the Core Strategy. The designations within the City Centre seek to support its role as a major retail and commercial centre of regional and national importance. The designations, listed below, can be viewed on the Policies map.
City Centre Boundary
Town, District and Local Centres
Primary Shopping Areas (PSA)
Primary Frontages
Retail Opportunity Areas
Independent Retail Clusters

5
City Centre Quarters: Castle Quarter, Canal Quarter, Creative Quarter, Royal Quarter
Centres of Neighbourhood Importance (CONIs) 6. Hierarchy of Centres 6.1 The LAPP encompasses the retail hierarchy set out in the Core Strategy, and additionally designates 38 Centres of Neighbourhood Importance (CONI). It also defines boundaries for all Centres within the hierarchy and their respective PSAs. The Core Strategy hierarchy is set out below:
a) City Centre:
Nottingham City Centre
b) Town Centres: Bulwell c) District Centres:
Clifton, Hyson Green and Sherwood
d) Local Centres:
Alfreton Road, Aspley Lane, Beckhampton Road, Bracebridge Drive, Bramcote Lane, Bridgeway Centre, Carrington, Mansfield Road, Nuthall Road, Robin Hood Chase, Sneinton Dale and Strelley Road.
e) Centres of Neighbourhood Importance: the Core Strategy sets out that
these will be defined in part 2 Local Plans. 6.2 The detailed hierarchy, centre boundaries and shopping areas, land allocations and development management policies were informed by the evidence base supporting the Core Strategy supplemented by additional survey work, data collection and analysis that is updated on a regular basis. 6.3 As part of the process of preparing the publication version, a survey of all Centres was undertaken in 2011, the results of which (in terms of rankings) are shown in Appendix 1. In addition to providing refreshed Centre rankings in line with previous 2009 methodology, the outcome of the survey was used to help assess the validity of designation of Centres within the specified tiers of the hierarchy, to inform the definition of centre boundaries and primary shopping areas, and to help guide the drafting of development management policies appropriate to each tier within the hierarchy. Detailed reports were also prepared for Bulwell Town Centre, Clifton District Centre, Hyson Green District Centre and Sherwood District Centre (which were subsequently published within the Greater Nottingham Retail Background Paper June 2012).

6
6.4 The publication version defines the physical extent of all Centres within the hierarchy, informed by the citywide centre survey and on-going monitoring of land uses and performance and the 2015 Retail Study. It also defines the PSA and Primary Frontages (for some Centres, it is considered appropriate that the PSA boundary follows that of the Centre boundary). In order to address minor anomalies in terms of property extents and uses, there has been numerous minor changes to many of the Centre boundaries compared to those within the 2005 Local Plan. The more significant changes include:
extension of boundaries to incorporate Joint Service Centres at Bulwell, Clifton, Hyson Green and Robin Hood Chase;
extension of the Hyson Green boundary to include properties to the north and south, broadly in line with historical extent of the boundary within the 1997 Local Plan, reflecting recent growth and expansion, including reversion of some relatively recent residential conversions back to previous retail uses;
removal of south western block of properties from Carlton Road South and inclusion within Sneinton Independent Retail Designation (as within City Centre);
expand the Bramcote Lane Centre boundary to the north-east to include the new Sainsbury's Local development;
create a new CONI called Woodborough Road North, between Mapperley Rise and Woodthorpe Road; and,
minor extensions and contractions of several boundaries to add in new shops and take out residential conversions of fringe properties where contraction has occurred;
6.5 This Centre hierarchy was reviewed as part of the Public Examination of the Core Strategy. The hierarchy was found sound and the Core Strategy adopted in September 2014. To ensure the continued appropriateness of the hierarchy a review was also undertaken by Carter Jonas as part of the 2015 Retail Study. 7. Nottingham City Centre 7.1 Nottingham City Centre is the primary commercial centre within the East Midlands and has considerable potential for further growth across a range of sectors. The Nottingham Growth Plan 2012 identifies that key to transforming the City’s economy is ensuring that at its heart lies a strong, sustainable, vibrant city centre supported by a thriving retail and leisure offer. It also acknowledges that although the City Centre continues to be one of the most important retail destinations in the UK., given pressure from competitors and difficult trading conditions for retailers over recent years, an appropriate

7
strategy is needed to enhance its retail offer and its broader attraction as a leisure and business destination. 7.2 Policy 5 of the Core Strategy reaffirms the City Centre as the region’s principal shopping, leisure and cultural destination and sets out a strategy for future enhancement of this role. A major element of this strategy is the maintenance of a prosperous, compact and accessible retail centre by:
significantly increasing the retail and leisure floorspace of the City Centre, to promote and strengthen current north-south and east-west shopping patterns and permeability through the mixed-use redevelopment and expansion of the Broadmarsh and the Victoria Centres;
safeguarding the Primary Shopping Frontages as the focus for City Centre retail development, to reinforce the north-south and east-west shopping patterns and connect the main retail destinations in the City;
ensuring that other new retail development is well integrated and closely linked with the Primary Shopping Frontages in terms of proximity, continuity of function and ease of access; and
ensuring that the Primary Shopping Frontages remain predominantly in retail and shopping use (Use Class A1).
7.3 The Core Strategy also identifies the City Centre as a focus for new offices, along with the Southside and Eastside Regeneration Zones (now the Canal and Creative Quarters) and the eastern part of the Waterside. Office development of a lesser scale is promoted in Bulwell. 7.4 The strategic framework within the Core Strategy supports the creation of an inclusive and safe City Centre by enhancing its appeal to pedestrians, cyclists and public transport users, supporting leisure and cultural facilities that appeal to the conurbation's population, and managing the scale, concentration and regulation of licensed premises, hot food takeaways and taxi ranks. 7.5 The City Centre forms the focus of public transport and sustainable transport modes, with major infrastructure schemes connected to NET Phase Two and improvements to Nottingham Railway Station. The Core Strategy proposes a series of other measures including promoting replacement bus stations and improving other interchange facilities, enhanced bus stop capacity, parking provision to support vitality and viability of the City Centre, and a series of further transport improvements with an emphasis on public transport and pedestrian routes. 7.6 The Core Strategy makes it clear that main town centre uses should be located in centres, and that development should be appropriate in scale and nature to the role and function of the centre in which it is located. Further, if no
8
suitable sites are available in centres then edge of centre locations should be used before out of centre sites are considered. Proposals for edge of centre and out of centre sites will also be required to show how the development will not have an adverse impact on any Centre. It sets out that thresholds for the submission of retail impact assessments will be set out in the LAPP. 7.7 The Nottingham Retail Strategy 2013 sets out a framework for future growth with three clear priorities:
Strengthening Nottingham’s retail and leisure offer in the City Centre, by growing the size and variety of both the comparison goods and independent sectors, and in doing so increase the number of visitors from the catchment.
Improving the Nottingham visitor experience, offering variety, quality and a joined up approach to leisure and retail and therefore increase the level of spending within the city centre.
Improving the physical environment and infrastructure within the City Centre, so that it meets the future needs of retailers and provides an attractive and welcoming place to visit.
7.8 The above Retail Strategy is accompanied by a series of specific actions linked to each of the priorities. Amongst these actions there are objectives concerned with improving the quality of shopping centres and ensuring a thriving independent retail/leisure sector in the City Centre based on a clear understanding of where the core retail areas are, supporting the development of better visitor attractions and improving the use of public spaces. City Centre Boundary 7.9 A minor amendment has been made to City Centre boundary as compared to that included in the Local Plan 2005. The eastern edge of the boundary has been slightly extended, close to the Sneinton side of the City Centre Boundary to rationalise the boundary and accommodate City Centre uses within its scope. The publication version policies promote the wider City Centre, beyond the PSA, as the main focus for office, leisure, and culture and tourism based developments. This is consistent with the strategic framework set out in the Core Strategy, and seeks to exploit the high level of accessibility of the City Centre that is continually improving through major investment in projects such as the Nottingham Station transport interchange and NET Phase Two, along with its significant cultural assets and identified capacity for growth. City Centre Primary Shopping Area 7.10 The mix and distribution of ground floor uses within the central part of the City Centre is illustrated by the plan at Appendix 4. The survey information, compiled by Nottingham City Council in May 2015, has been presented to show the distribution of different planning use classes within

9
ground floor units. This is broadly consistent with the previous comprehensive survey undertaken in July 2014 at Appendix 3. 7.11 The PSA incorporates the majority of the existing shopping provision within the City Centre together with a diverse range of complementary town centre uses including restaurants, bars, commercial, cultural and entertainment venues. As illustrated the highest concentration of shops comprise a clear retail core formed along a strong and well defined north/south axis that stretches from the Broadmarsh area in the south to the Victoria Centre in the north, and incorporating the traditional shopping streets connecting them. This robust shopping core, which is the main focus for comparison retail stores, is reinforced by a series of historic east-west streets that provide pedestrian linkages to tourist areas and independent retail clusters at the Castle and Derby Road to the west, and the Lace Market and Hockley to the East. 7.12 The PSA designation includes a number of modifications to that currently defined within Interim Retail Planning Guidance adopted in November 2010. The main changes are a western boundary extension to incorporate the Chapel Bar area, and contraction of the boundary to omit the area to the west of North Church Street, land and buildings to the east of Glasshouse Street, and the cluster of independent shops on the western side of Mansfield Road, north of Peachey Street. 7.13 As shown in the table below vacancy rates within the central part of the City Centre, as indicated within City Council data from May 2015 are reported at approximately 16.2% which shows a downward trend in vacancy from previous years. Whilst a significant proportion of vacancies can be attributed to protracted delays in development proposals at Broadmarsh, and other clusters of vacancies linked to small scale units located off the main pedestrian routes that do not benefit from high levels of visual prominence or footfall, it is judged that a modest reduction in the extent of the PSA is justified in order to help reinforce and promote the City Centre shopping core as the focus for retail led investment and to avoid the risk of increased vacancies within the heart of the centre due to floorspace expansion in fringe locations. This approach is consistent with the NPPF, the City Centre Retail Strategy 2013, Nottingham Growth Plan 2012 goals and Core Strategy policies.

10
Table 1 Table showing trends in vacancy rates from February 2009 to May 2015
City Centre Primary Shopping Frontages 7.14 The key streets within the retail core have been designated as Primary Frontages. The frontages reflect a move towards more leisure based characteristics and uses within the streets to the west of the Old Market Square and the western section of Upper Parliament Street through their omission from the Primary Frontages designation. 7.15 The Retail Study 2015 suggests consideration of some changes to the primary and secondary frontages. It is suggested that Milton Street, although close to Victoria Centre, is not primary frontage. However this is a street with strong footfall, high profile occupiers, low levels of vacancy and where activity is set to increase with the refurbishment and extension of the Victoria Centre. Similarly the study suggests Carrington Street, between the Nottingham Station Hub and the Broadmarsh Centre, should also be secondary frontage. The Policies Map identifies only the northern most part of Carrington Street as primary frontage. This has seen recent investment and reduction in vacancies and is close to Broadmarsh Centre where major investment and improvements to the shopping environment is planned. Secondary frontage is also suggested for Wheeler Gate, however, this is a key pedestrian route linking the Broadmarsh Centre to the Market Square and is performing well with low levels of vacancy.
Survey Date Total Units
Surveyed
Total Vacancy
Number
Total Vacancy
Percentage
February 2009 1117 171 15.3%
May 2009 1117 191 17.1%
August 2009 1117 197 17.6%
November 2009 1117 171 15.3%
February 2010 1117 192 17.2%
May 2010 1117 190 17.0%
August 2010 1117 190 17.0%
March 2011 1117 181 16.2%
September 2011 1117 191 17.1%
March 2012 1117 197 17.6%
September 2012 1298 235 18.1%
February 2013 1292 235 18.1%
August 2013 1310 219 16.7%
May 2014 1365 228 16.7%
May 2015 1428 231 16.2%
11
City Centre Quarters 7.16 City Centre Quarters comprise new area based designations that are accompanied by positively framed policies to support and steer growth and investment in line with the regeneration strategy for each of the respective areas as noted earlier in the paper. 7.17 These Quarters contain a significant number of land allocations. Whilst primarily non-retail uses are promoted on these sites, the development principles accompanying several of the allocations allow for an auxiliary retail component as shown in Appendix 5 of the LAPP. The indicative floorspace parameters for retail use is contingent upon the delivery of other main uses on the site. Independent Retail Clusters 17.18 The Independent Retail Cluster designation formally recognises the existence of five main groups of independent shops on Derby Road, Mansfield Road, Angel Row/Market Street, Carlton Street/Goosegate/Hockley,Sneinton Market, and Carrington Street. Most of these clusters are located at the edge and beyond the Primary Shopping Area and this policy seeks to safeguard and support their continued enhancement. 17.19 The five clusters are shown on the Policies Map. In line with the Nottingham Retail Strategy, the independent retail outlets within the PSA are encouraged and supported by the retail policy. Additionally, the relevant Quarter policies are supportive of independent retail outlets where they are of a modest scale that is complementary to other uses such as creative industries and tourism. 8. Development in ‘out of centre’ and ‘edge of centre’ locations 8.1 For the purposes of assessing applications for retail and main town centre uses in out of and edge of Centre locations, the Local Plan sets out the NPPF definition of out of Centre and edge of Centre. In line with the NPPF, all proposals for retail or other main town centre uses that are not located within a Centre will need to demonstrate that there is no other more sequentially preferable site available. 8.2 Where there is no locally set floorspace threshold for Impact Assessments, the NPPF sets a default threshold of 2,500sqm. The Retail Study (2015) concluded that a local threshold of 1,000sqm gross and above was appropriate for retail proposals in edge of City centre and out of City centre locations. Whilst a lower threshold of 500sqm was recommended for smaller Centres, it is considered that a threshold of 1,000sqm (gross) is reasonable and practicable for all edge of and out of centre locations throughout the City. In applying this threshold the City Council considers that this would equate, in most cases, to gross to net ratio of approximately 70% or 700sqm.

12
8.3 This is considered to be a suitable and proportionate approach to enable informed consideration of major proposals. It is recognised, however, that in certain circumstances the carrying out of an impact assessment may also be prompted in the case of smaller scale developments where an applicant is seeking to demonstrate that a proposal would not cause significant adverse impact. In all cases, the absence of a specified need for an impact assessment would not imply that such schemes falling below the threshold would automatically be considered as acceptable. 9. New and Enhanced Floorspace City Centre 9.1 Substantial additional floorspace at the Broadmarsh Centre and adjoining land was treated as a commitment within the Greater Nottingham Retail Study 2008, which also identified capacity for approximately 30,000 square metres of net comparison floorspace over and above the Broadmarsh commitment up to 2021. 9.2 A partial update of the Greater Nottingham Retail Study 2008 suggested that there is likely to be scope for significant additional retail floorspace within the City Centre over the plan period. The report recommended that the phasing of new major indoor retail space and improvements to existing centres be carefully considered to ensure that the retail focus within the City Centre is balanced and to avoid the over-dominance of one area and to avoid detriment to the traditional shopping streets between the main indoor centres. 9.3 The Retail Study (2015) provides an updated assessment of forecast capacity across the City for convenience and comparison goods taking into account planned and committed developments. A summary of the capacity forecasts are set out below:
Table 2
a) Forecast Convenience Floorspace
Convenience Floorspace Capacity
(sqm net) Food store format
Year
2019 2024 2028
City Centre
367
695
969
Bulwell
155
292
413
Clifton
413
778
1,110
Hyson Green
319
599
856
Sherwood
49
91
132
Local Centres (all)
393
739
1,054
13
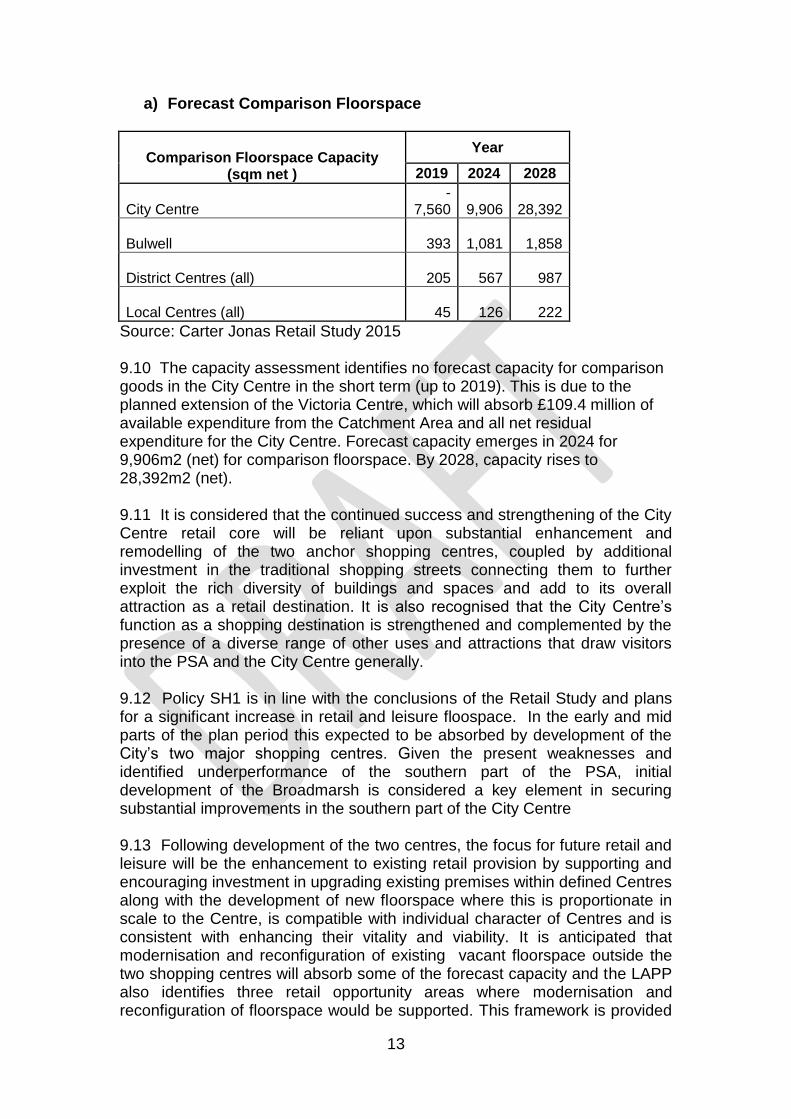
a) Forecast Comparison Floorspace
Comparison Floorspace Capacity (sqm net )
Year
2019 2024 2028
City Centre -
7,560
9,906
28,392
Bulwell
393
1,081
1,858
District Centres (all)
205
567
987
Local Centres (all)
45
126
222
Source: Carter Jonas Retail Study 2015 9.10 The capacity assessment identifies no forecast capacity for comparison goods in the City Centre in the short term (up to 2019). This is due to the planned extension of the Victoria Centre, which will absorb £109.4 million of available expenditure from the Catchment Area and all net residual expenditure for the City Centre. Forecast capacity emerges in 2024 for 9,906m2 (net) for comparison floorspace. By 2028, capacity rises to 28,392m2 (net).
9.11 It is considered that the continued success and strengthening of the City Centre retail core will be reliant upon substantial enhancement and remodelling of the two anchor shopping centres, coupled by additional investment in the traditional shopping streets connecting them to further exploit the rich diversity of buildings and spaces and add to its overall attraction as a retail destination. It is also recognised that the City Centre’s function as a shopping destination is strengthened and complemented by the presence of a diverse range of other uses and attractions that draw visitors into the PSA and the City Centre generally. 9.12 Policy SH1 is in line with the conclusions of the Retail Study and plans for a significant increase in retail and leisure floospace. In the early and mid parts of the plan period this expected to be absorbed by development of the City’s two major shopping centres. Given the present weaknesses and identified underperformance of the southern part of the PSA, initial development of the Broadmarsh is considered a key element in securing substantial improvements in the southern part of the City Centre 9.13 Following development of the two centres, the focus for future retail and leisure will be the enhancement to existing retail provision by supporting and encouraging investment in upgrading existing premises within defined Centres along with the development of new floorspace where this is proportionate in scale to the Centre, is compatible with individual character of Centres and is consistent with enhancing their vitality and viability. It is anticipated that modernisation and reconfiguration of existing vacant floorspace outside the two shopping centres will absorb some of the forecast capacity and the LAPP also identifies three retail opportunity areas where modernisation and reconfiguration of floorspace would be supported. This framework is provided

14
through Centre designations accompanied by land allocations and development management policies appropriate to those designations.
9.14 In terms of convenience floorspace, the study identifies capacity of 367m2 (net) of superstore format floorspace in 2019; increasing to 695m2 (net) in 2024. By 2028 there is an identified forecast for 969m2 (net) of convenience floorspace in the City Centre. The study suggests that this level of forecast convenience floorspace could support an extension to an existing foodstore or up to two new ‘local’ format foodstores. Appendix 5 of the LAPP sets out the potential allocations which may include an element of retail floorspace. These areas have been identified via City Centre surveys as appropriate areas for improvement. Outside the City Centre 9.15 The capacity assessment (see Table 2 above) identifies a modest amount of forecast superstore format floorspace for Bulwell Town Centre over the plan period (up to 2028). This could support an extension to existing foodstores in the Town Centre or support a new ‘local’ format foodstore in the short to long term (2024 to 2028). Alternatively there is forecast capacity for 551m2 of new supermarket or deep discount format floorspace in 2024; increasing to 919m2 by 2028. This could support a small supermarket (e.g. Budgens, Co-operative, etc.) in the short to long term. Should the site at Linby Street/Filey Street be delivered this would absorb all forecast capacity for the centre.
9.16 For comparison goods, there is forecast capacity for 393m2 (net) of new comparison goods capacity in 2019. By 2024, forecast capacity more than doubles to 1,081m2 (net); increasing further to 1,858m2 (net) in 2028.
9.17 Retail capacity is more limited for the three District Centres and network of Local Centres, which reflects the more limited shopping role of smaller centres in the retail hierarchy. Modest capacity is also identified in Clifton District Centre but it is noted that with the Sustainable Urban Extension in adjacent Rushcliffe Borough, the PSA may need to expand. 9.18 The study supports the previous retail study’s conclusion regarding the current limitation in qualitative convenience provision to serve the City’s western estates and Waterside subject to the sequential test and impact assessment.
9.19 Consideration was given to the potential suitable land allocations to accommodate retail use, although the majority were discounted at a very early stage (preferred option version) due to their out of centre locations and greater suitability for other uses such as housing. LAPP Appendix 5 sets out those locations which are considered suitable (including existing planning permissions) for retail use and also set out those sites where an element of retail use is considered appropriate as part of more comprehensive development proposals. Site allocations PA34 (Former Beechdale Baths) and PA84 (Daleside Road, Eastpoint) have the potential to address deficiencies

15
identified in the study for the Western Estates and Waterside whilst PA58 (Fairham House) in Clifton also has potential for retail use. 10. Food and Drink Uses 10.1 Alongside retail planning, the publication version incorporates a policy framework for the consideration of food and drink uses and other leisure venues. Such uses form a significant component of the mix of uses within the City Centre, making an important and valuable contribution to the economy, extending dwell time and adding vibrancy during the daytime and evenings. However, food and drink uses can, depending on their nature, size, location and management, have adverse impacts on the City Centre environment. The publication version policies (SH6 and LS1) recognise that the numbers, distribution and potential effects of such uses require appropriate regulation and management. The need for robust criteria based policies is supported by evidence of the effects of concentrations of licensed premises and other food and drink outlets including takeaways in terms of incidents of crime, anti-social behaviour, noise and amenity issues, and is also consistent with strategic policies in relation to licensing, crime reduction, health and well-being. This approach is consistent with and complements the approach taken to licensing of premises set out in the Nottingham Licensing Statement 2015. 10.2 There are specific food, drink and entertainment venues policies, which are proposed to be considered alongside any relevant Quarter and PSA policies that are applicable to specific sites. Whilst all of the Quarter policies are broadly supportive of a proportionate element of leisure and food and drink uses where they are of a scale and character that complements the overall development strategy for the area, the Royal Quarter policy in particular provides a positive framework for the enhancement of such uses, especially in the area around the Corner House and the Royal Centre, whilst the Canal Quarter policy promotes such uses in the vicinity of the canal. 10.3 In seeking to support the planned and managed growth of such uses in specific locations, the aim of the policies is to build upon their established strengths as entertainment locations in order to achieve overall enhancement of the City Centre’s appeal to a wider range of leisure visitors, whilst at the same time incorporating measures to avoid the potential negative effects of such uses through appropriate safeguarding measures. In all cases, relevant policies will be considered together, and the promotion of uses in specified locations will not preclude assessment against the generic food and drink, and entertainment venues policies. However, where there is evidence that strong and co-ordinated management arrangements are in place in such locations, this may assist in demonstrating strong performance of a proposal in relation to the relevant assessment criteria.

16
11. Hot Food Takeways 11.1 Hot Food Takeaways can make a positive contribution to the vitality and viability of centres. However, in other circumstances an over-domination of such uses can have a harmful impact on the Centres' environment and detract from their retail function, particularly where there is a concentration of outlets that do not trade throughout the day. 11.2 Food and drink outlets can also result in harmful impacts in terms of noise and disturbance, litter, anti-social behaviour and crime, both through the activities associated with their use and also by providing a focal point for informal gathering. In some circumstances they may also have an undermining impact on the achievement of broader health and well-being objectives. 11.3 In relation to A5 takeway uses, research evidence shows a relationship between obesity and low fruit and vegetable intake, and the distribution of fast food outlets. The NPPG refers to and provides a link to ‘Healthy people, healthy place briefing. Obesity and the environment regulating the growth of fast food outlets’ Public Health England - March 2014. This briefing outlines actions available to Local Authorities in tackling obesity through the regulation of fast food outlets – such as restricting their development close to schools. This is also supported by NICE public health guidance ‘Prevention of Cardiovascular Disease’ June 2010 which recommends that planning authorities should set limits for the number of takeaways and other food outlets in a given area with directives to specify the distance from schools. Case law also confirms that where appropriate, impacts on health can be a material consideration in determining planning applications for land use.
11.4 The density of fast food outlets in Nottingham is high relative to many other local authorities in England, Nottingham being ranked 41st out of 324 local authorities for fast food outlet density (Public Health England). Two thirds of the City’s schools have a fast food outlet within 400metres, with the average number within this radius being 5 outlets. The Children and Young People’s Health Benchmarking Tool (2013/14) found that 37.8% of 10 to 11 year olds in Nottingham were obese compared to the English average of 32.2%.
11.5 In order to support wider policy objectives for public health, the City Council consider it appropriate to restrict the provision of new hotfood takeways outside established Centres and within 400m of schools unless it is clearly demonstrated that the proposal will not have a negative impact on health and well-being (400m being an acceptable distance for convenient walking). 12. Markets 12.1 There is potential to expand upon the profile of existing markets, including fixed markets and occasional markets. As well as adding local character, markets can also provide affordable places for developing

17
businesses to trade and be a source of more affordable goods, especially food. A policy has therefore been included to support on-going enhancement of markets as an important component of the retail offer and contributor to Centres' character.
13. Conclusions
13.1 The publication version designations, allocations and development management policies are considered to represent a sound and justified approach to retail planning within Nottingham City based on available evidence. The policy approach will continue to be reviewed in the light of subsequent consultation, on-going monitoring and evidence gathering.

18
APPENDIX 1: Nottingham City Centre Survey September 2012 / February 2013
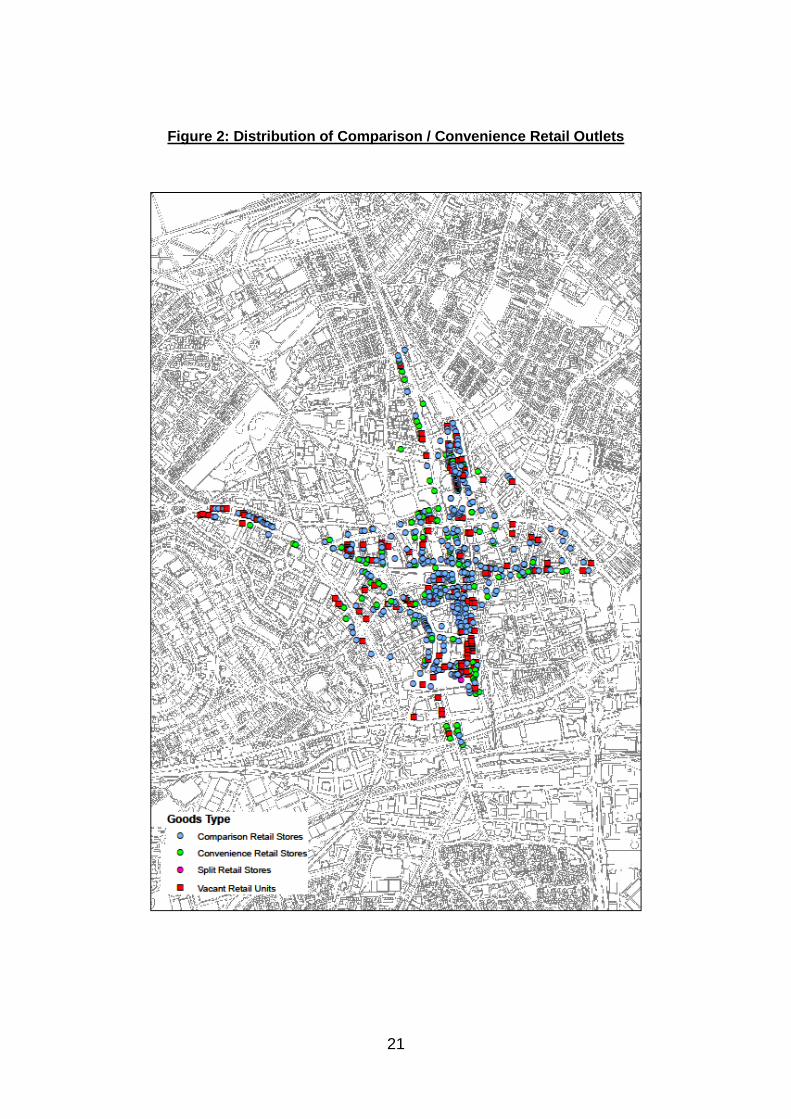
Survey Overview and Methodology In September 2012 and February 2013, comprehensive surveys of just under 1,300 ground floor units covering the central part of the City Centre were undertaken in order to build upon and update existing data relating to the distribution of ground floor uses and vacancy rates. The surveys recorded data for all ground floor units within the survey area shown in Figure 1 below, which as well as covering the core shopping streets within the City Centre, also extends beyond the currently defined Primary Shopping Area and includes clusters of independent units on the routes leading out of the City Centre towards neighbouring residential areas. Tabular summaries showing the key results of the surveys for both the full survey area and also for the area currently designated as Primary Shopping Area are presented within Appendix 1b. Maps illustrating the broad spatial distribution of uses and vacancies based on the 2013 survey data only are shown in Appendices 1c– 1g. Figure 1: City Centre Survey Area

19
Table 1: Percentage Split between Town Planning Use Classes in Full Survey Area
Class* Number Sept 2012
Percentage Sept 2012
Number Feb 2013
Percentage Feb 2013
A1 625 48% 621 48%
A2 86 6% 85 6%
A3 115 9% 114 9%
A4 77 6% 68 5%
A5 23 2% 23 2%
Other** 371 (including Vacant)
29%
381 (including Vacant)
30%
Vacant 235 18% 235 18%
Total 1297 100% 1292 100%
Table 2: Percentage Split between Town Planning Use Classes in Primary Shopping Area
Class* Number Sept 2012
Percentage Sept 2012
Number Feb 2013
Percentage Feb 2013
A1 546 51% 542 51%
A2 75 7% 73 7%
A3 94 9% 92 9%
A4 60 6% 55 5%
A5 18 2% 18 2%
Other** 274 (of which 184 Vacant)
25% 281 (of which 187 Vacant)
26%
Vacant 184 17% 184 17%
Total 1067 100% 1061 100%
Table 3: Percentage Split between Broad Use Types in Full Survey Area
Type Number Sept 2012
Percentage Sept 2012
Number Feb 2013
Percentage Feb 2013
Convenience 108 8% 109 8%
Comparison 408 32% 404 31%
Split 1 0% 1 0%
Service 296 23% 296 23%
Leisure incl. Food & Drink
245 19% 242 19%
Miscellaneous 4 0% 4 0%
Vacant 235 18% 235 18%
Total 1297 100% 1292 100%

20
Table 4: Percentage Split between Broad Use Types in Primary Shopping Area
* Use Class definitions are as set out in the Town and Country Planning (Use Classes Order) 1987, as amended ** ‘Other’ includes the following Use Classes B1, C1, C3, D1, D2, Sui Generis and Vacant. The increase in units within the ‘Other’ category between the two survey dates is largely attributable to incorrect classification of a number of nightclubs as bars in the 2012 survey. Broad Use Types:
Split - where the division between convenience and comparison is unclear.
Service – includes premises where a service is provided to customers such as retail banks, estate and recruitment agencies, offices, launderettes and hair dressers.
Leisure – as well as bookmakers and amusement arcades, this includes pubs, clubs, bars and restaurants, coffee shops and fast food sellers but not sandwich shops which form part of convenience goods.
Miscellaneous – includes non-commercial premises such as houses.
Type Number Sept 2012
Percentage Sept 2012
Number Feb 2013
Percentage Feb 2013
Convenience 91 9% 92 9%
Comparison 365 34% 361 34%
Split 1 0% 1 0%
Service 224 21% 220 21%
Leisure inc. Food & Drink
199 19% 197 18%
Miscellaneous 3 0% 3 0%
Vacant 184 17% 187 18%
Total 1067 100% 1061 100%
21
Figure 2: Distribution of Comparison / Convenience Retail Outlets

22
Figure 3: Distribution of National / Independent Outlets

23
Figure 4: Distribution of Retail / Leisure / Service Outlets

24
Figure 5: Distribution of Food and Drink Outlets

25
Figure 6: Distribution of Vacant Units

26
APPENDIX 2: Citywide Centres Survey, Hierarchy and Ranking 2009 / 2011 Centre Hierarchy and Rankings 2009 and 2011: Survey Methodology
Background and Approach In 2009 a survey of designated Centres identified within the ‘saved’ Nottingham Local Plan 2005 was undertaken. The 2009 Survey was prompted by a need to supplement existing data and analysis, including that contained within the Greater Nottingham Retail Study 2007, in order to support policy development within the emerging Core Strategy and the making of informed development management decisions. The survey covered 55 Centres - 4 defined as District Centres and 51 categorised as Local Centres. The survey information was used to inform a new retail hierarchy with a number of defined Town, District and Local Centres, along with a lower tier of unspecified Centres of Neighbourhood Importance (CONIs) within the emerging Core Strategy. Details of this new hierarchy were also incorporated within Interim Retail Planning Guidance approved in 2010, which in addition to the Centres defined in the Core Strategy also identified specific Centres of Neighbourhood Importance. A copy of the Summary Report from the 2009 Survey is incorporated as an appendix to the 2010 Interim Planning Guidance, a link to which is provided at the end of this document. To monitor and maintain the accuracy of available evidence, a further survey was undertaken in 2011, using the same methodology as the 2009 Survey in order to aid comparison. Full details of this methodology are contained within the 2009 Summary Report. The survey looked at quantitative and qualitative information for the following and a scoring system was applied in order to rank the Centres within the hierarchy. Factors that were considered were:
Pedestrian flows
Transport
Parking
Environment
Potential for expansion
Sustaining vitality
Proportion of vacant street level properties
Unit detail Findings The outcome of the two surveys in terms of rankings is presented in the table in Appendix 2b below. The summary table shows overall stability in the Centre rankings over the period, with the notable exception of Berridge Road which emerged with a higher scoring than Beckhampton Road and the Bridgeway Centre in 2011. This change in respect of Berridge Road is mainly attributable to a number of properties within the Centre being omitted from the earlier 2009 survey.

27
The colour coding within the table reflects the retail hierarchy set out in the 2010 Interim Retail Planning Guidance. The emerging Core Strategy do not specify CONIs. The respective colours equate to the following tiers of the hierarchy, definitions of which are included within the glossary at the end of this document: Blue – Town Centre Green – District Centre Yellow – Local Centre Purple – Centre of Neighbourhood Importance
Centre Hierarchy and Rankings 2009 and 2011
2009 2011
Centre Name Centre Name
Bulwell Bulwell Town
Sherwood Sherwood
Hyson Green Hyson Green
Alfreton Road Alfreton Road
Clifton Clifton
Mansfield Road Mansfield Road
Bracebridge Drive Sneinton Dale
Aspley Lane Bramcote Lane
Sneinton Dale Strelley Road
Nuthall Road Bridgeway Centre
Bramcote Lane Aspley Lane
Strelley Road Bracebridge Drive
Carrington Nuthall Road
Robin Hood Chase Carrington
Beckhampton Road Berridge Road
Bridgeway Centre Robin Hood Chase
Top Valley Way Beckhampton Road
Lenton Sands Aspley Lane/Glencairn Drive
Lenton Boulevard Carlton Road
Derby Road/Arnesby Road Middleton Boulevard
Middleton Boulevard Beechdale Road
Carlton Road Oakdale Road
Beechdale Road Hucknall Road/Valley Road
Berridge Road Derby Road/Arnesby Road
Farnborough Road Top Valley Way
Broxtowe Lane/Coleby Road Farnborough Road
Arnold Road Trowell Road
Highbury Road/Broomhill Lenton Boulevard
Hucknall Road/Valley Road Lenton Sands
Ilkeston Road West Highbury Road/Broomhill
Rise Park Broxtowe Lane/Coleby Road
Carlton Road South Rise Park
Haydn Road Arnold Road
Woodside Road Woodside Road
Trowell Road Sellers Wood Drive
Oakdale Road Hermitage Square
Aspley Lane/Glencairn Drive Bobbersmill
Hermitage Square Varney Road
Highbury Road/Bedford Grove Highbury Road/Bedford Grove

28
Woodborough Road Haydn Road
Beech Avenue Sneinton Boulevard
Daybrook Ilkeston Road West
Varney Road Beech Avenue
Sellers Wood Drive Woodborough Road
Hartley Road Carlton Road South
Bobbersmill Daybrook
Old Farm Road Old Farm Road
Broxtowe Lane Hartley Road
Church Square Broxtowe Lane
Derby Road Top Hucknall Road/Carrington
Sneinton Boulevard Derby Road Top
Broxtowe Lane/Sherborne Road Broxtowe Lane/Sherborne Road
Monksway Church Square
Hucknall Road/Carrington Mill Road/Bagnall Road
Mill Road/Bagnall Road Monksway

29
APPENDIX 3: City Centre Survey July 2014 Purpose of Report:
The purpose of this report is to provide the Portfolio Holder with the
preliminary findings of the City Centre Vacancy Survey as undertaken by the
Policy and Research Team in May 2014. This report is ahead of the release of
vacancy statistics gathered by the LDC (Local Data Company). The report will
provide an overview of the facts and figures that were obtained from this
survey, and summarise any initial patterns that might exist with the data. A
brief exploration of trends is given, but a further detailed analysis will follow
when figures are adjusted to include information from partner intelligence.
Background:
The City Centre Vacancy survey is performed biannually by Nottingham City
Council using a mobile device whereby the database used in the last survey
(August) is updated. This particular survey was conducted during the month of
May 2014.
Each unit that lies within the Business Improvement District (BID) is surveyed
at face value to ascertain whether the unit is occupied or vacant, the nature of
current/previous use (if occupied), and the appearance to potential walking
trade. The data is attached to units as defined by the official addressing
Gazetteer (the LLPG) at a local scale, which contributes to the NLPG
(National Gazetteer). The survey also benefits the update of these gazetteers.
The boundary of the survey was extended following September 2012 and has
expanded each consecutive year to include units situated on;
- Mansfield Road
- Huntingdon Street
- Fletcher Gate
- Station Street.
- Cobden Chambers
- Station Street
In total 55 extra units were included in this survey.
Preliminary Findings:
The last survey performed in August 2013 by Nottingham City Council and the
LDC produced overall vacancy rates of 16.7% and 17.8% respectively. The
summary statistics of the Policy and Research Team’s May 2014 survey are
as detailed in table 1 below, and the distribution of vacancies displayed
visually in a map at the end of this document.
30
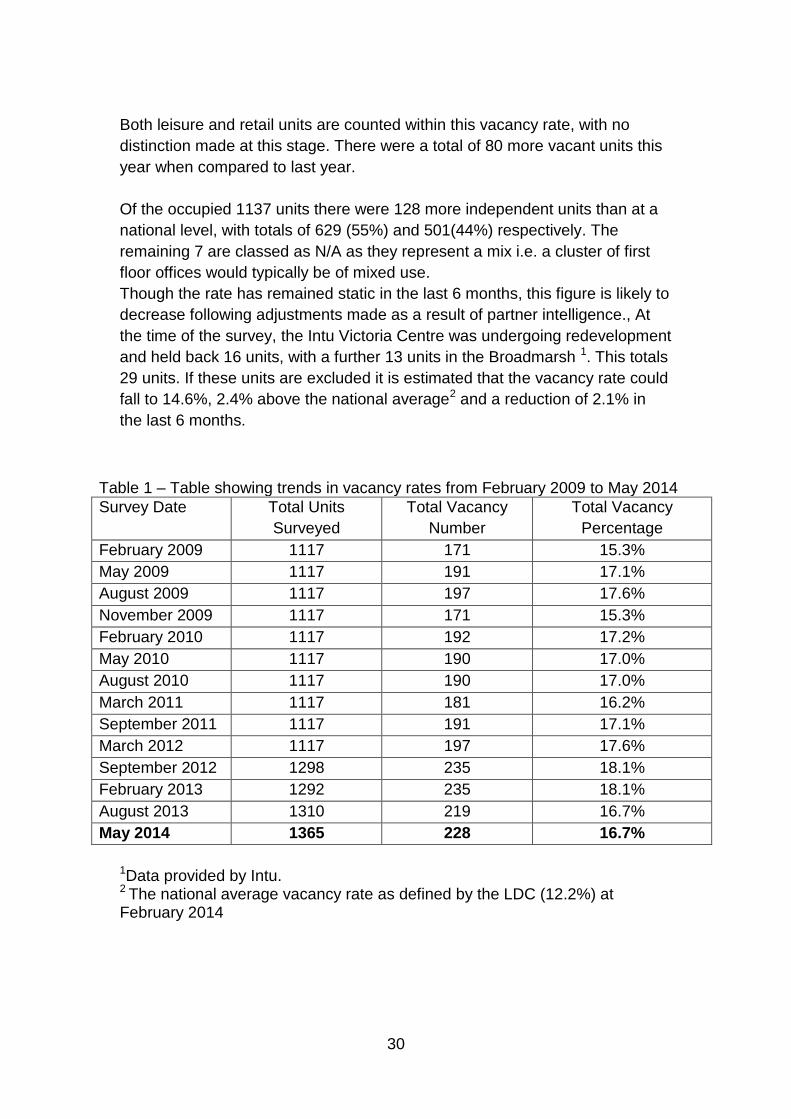
Both leisure and retail units are counted within this vacancy rate, with no
distinction made at this stage. There were a total of 80 more vacant units this
year when compared to last year.
Of the occupied 1137 units there were 128 more independent units than at a
national level, with totals of 629 (55%) and 501(44%) respectively. The
remaining 7 are classed as N/A as they represent a mix i.e. a cluster of first
floor offices would typically be of mixed use.
Though the rate has remained static in the last 6 months, this figure is likely to
decrease following adjustments made as a result of partner intelligence., At
the time of the survey, the Intu Victoria Centre was undergoing redevelopment
and held back 16 units, with a further 13 units in the Broadmarsh 1. This totals
29 units. If these units are excluded it is estimated that the vacancy rate could
fall to 14.6%, 2.4% above the national average2 and a reduction of 2.1% in
the last 6 months.
1Data provided by Intu. 2 The national average vacancy rate as defined by the LDC (12.2%) at February 2014
Table 1 – Table showing trends in vacancy rates from February 2009 to May 2014
Survey Date Total Units
Surveyed
Total Vacancy
Number
Total Vacancy
Percentage
February 2009 1117 171 15.3%
May 2009 1117 191 17.1%
August 2009 1117 197 17.6%
November 2009 1117 171 15.3%
February 2010 1117 192 17.2%
May 2010 1117 190 17.0%
August 2010 1117 190 17.0%
March 2011 1117 181 16.2%
September 2011 1117 191 17.1%
March 2012 1117 197 17.6%
September 2012 1298 235 18.1%
February 2013 1292 235 18.1%
August 2013 1310 219 16.7%
May 2014 1365 228 16.7%

31
Other areas that are considered vacancy hot spots are also subject to current
redevelopment, e.g. Glasshouse Street whilst there is a visible occupancy of 1
less unit (total of 8 vacant units as at August 2013) the remaining 6 are being
held for redevelopment leaving a remaining 1 unit that is genuinely vacant.
Elsewhere in the City Centre, other traditional vacancy ‘hot spots’ detailed in
table 2, are showing signs of improvement with 9 out of 14 identified last year
showing a reduction in vacancies and 1 showing no change. Though Derby
Road remains a significant hotspot for vacancies, there is currently a
programme of activity ongoing, aimed at increasing occupancy as a result of
the Portas High Street Innovation Fund.
There is also a marked improvement in occupancy rates is seen on Lower
Parliament Street and the West End Arcade. Lower Parliament Street
reductions are potentially related to the refurbishment and imminent future
expansion of the Victoria Centre. The West End Arcade has seen much
improvement since February 2013 and continues to improve following
investment from the City Council to tackle high vacancy rates. The previous
poor occupancy was due to the quality of the Arcade and lack of walking
trade. However, rising rates elsewhere may have contributed to the
movement of trade to this area as rates within the Arcade remain
comparatively low.
Long Row and Huntingdon Street show the highest increase in vacancies
since August 2013. It is possible that Long Row may exhibit such a trend
simply due to slow recovery from the economic downturn. It is situated directly
in the centre of town where rates are highest – and the upper end of Long
Row does not have particularly high volumes of walking trade. Possible
indications for the trend seen in Huntingdon Street is that situated on the
periphery of the central core, again it suffers from lack of walking trade. This is
further exacerbated by the Victoria Centre refurbishment acting as a further
barrier to walking trade.
It should be noted that units are classed as vacant based on observations at
street level as appearing at that moment in time and these figures will be
altered following a more in depth analysis. The high occurrence of
independents that are able to easily alter their opening times/days may
contribute to errors in the recording process.
It is suggested that occupation in the Eastern/North Eastern section of the
City will increase as a result of initiatives which form part of the Creative
Quarter business innovation designation. From the map it is evident that a
cluster of vacant units exist both within and in close proximity to the Creative
Quarter’s boundary. Positive effects of the scheme were already seen in the

32
occupied buildings around Convent Street and Beck Street where an historic
building was converted into a seemingly thriving hub of independent specialist
retailers, and a business innovation learning centre.
Table 2 – A table to compare August 2013 and May 2014 vacancies in vacancy ‘hot spots’ identified from the NCC August 2013 survey ordered by level of improvement.
Street
Vacancy
Hotspots (as
reported in
Aug 2013)
May 2014
update
Difference in
vacancy reported
1 Main Marian Way 10 7 -3
2 Upper Parliament
Street 9 6 -3
3 West End Arcade 7 4 -3
4 Lower Parliament
Street 7 4
-3
5 Heathcoat Street 6 3 -3
6 Glasshouse Street 8 7 -1
7 Goose Gate 5 4 -1
8 Bridlesmith Walk 5 4 -1
9 Wheeler Gate 4 3 -1
10 Carrington Street 7 7 0
11 Derby Road 13 14 +1
12 Mansfield Road 8 9 +1
13 Huntingdon Street 5 7 +2
14 Long Row 5 7 +2
Overall Conclusions In summary, the main conclusions to be drawn as a result of the latest survey conducted by the Policy and Research Team are;
- Of the 1365 units surveyed, 228 were considered vacant, producing a
vacancy rate of 16.7%. This figure is 4.5% above the national average
as was calculated in February 2014 by the LDC.
- There were 80 new vacancies in the recent May 2014 survey when
compared to August 2013 data.
- 9 of the top 14 traditional vacancy ‘hot spots’ showed improvement though the magnitude of change remained low, with 1 hotspot remaining static.
- Vacancy rates remained static at 16.7% since August 2013, a rate which is expected to change to 14.6% once units held for regeneration in the Intu Victoria and Broadmarsh Centres are taken into account. This 14.6% rate will decrease further when other units being

33
regenerated are taken into account, bringing the figure closer to the 12.2% national average.
- Of the occupied 1137 units there were 128 more independent units
than at a national level, with totals of 629 (55%) and 501(44%)
respectively.
- The effects of investment are beginning to be seen in the Creative
Quarter and it is hoped that the positive effect will spread to the cluster
of vacancies in the North Eastern section of the City. Positive effects of
regeneration schemes are also being seen around the Victoria Centre,
West End Arcade, and Derby Road - all of which are traditional
vacancy hot spots.

34
APPENDIX 3 CONTINUED: City Centre Vacancy July 2014

35
APPENDIX 4: City Centre Vacancy May 2015

36
APPENDIX 5: City Centre Distribution of Uses May 2015