RESULTS PRESENTATION THIRD QUARTER
30
RESULTS PRESENTATION THIRD QUARTER October 27, 2021
Transcript of RESULTS PRESENTATION THIRD QUARTER

RESULTSPRESENTATIONTHIRD QUARTEROctober 27, 2021

| 2
RESULTS PRESENTATION THIRD QUARTER 2021
www.avangrid.com
Legal Notice
FORWARD LOOKING STATEMENTS
Certain statements in this release may relate to our future business and financial performance and future events or developments involving us and our subsidiaries that are not purely
historical and may constitute “forward-looking statements” within the meaning of the Private Securities Litigation Reform Act of 1995. Forward-looking statements may be identified by
the use of forward-looking terms such as “may,” “will,” “should,” “would,” “could,” “can,” “expect(s),” “believe(s),” “anticipate(s),” “intend(s),” “plan(s),” “estimate(s),” “project(s),”
“assume(s),” “guide(s),” “target(s),” “forecast(s),” “are (is) confident that” and “seek(s)” or the negative of such terms or other variations on such terms or comparable terminology. Such
forward-looking statements include, but are not limited to, statements about our plans, objectives and intentions, outlooks or expectations for earnings, revenues, expenses or other
future financial or business performance, strategies or expectations, or the impact of legal or regulatory matters on business, results of operations or financial condition of the business
and other statements that are not historical facts. Such statements are based upon the current reasonable beliefs, expectations, and assumptions of our management and are subject
to significant risks and uncertainties that could cause actual outcomes and results to differ materially. Important factors are discussed and should be reviewed in our Form 10-K and
other subsequent filings with the SEC. Specifically, forward-looking statements include, without limitation: the future financial performance, anticipated liquidity and capital
expenditures; actions or inactions of local, state or federal regulatory agencies; the ability to recruit and retain a highly qualified and diverse workforce in the competitive labor market;
changes in amount, timing or ability to complete capital projects; adverse developments in general market, business, economic, labor, regulatory and political conditions including,
without limitation, the impacts of inflation, deflation, supply-chain interruptions, and changing prices and labor costs; the impacts of climate change, fluctuations in weather patterns
and extreme weather events; technological developments; the impact of extraordinary external events, such as any cyber breaches or other incidents, grid disturbances, acts of
war or terrorism, civil or social unrest, natural disasters, pandemic health events or other similar occurrences; the impact of any change to applicable laws and regulations including
those subject to referendums affecting the ownership and operations of electric and gas utilities and renewable energy generation facilities, respectively, including, without limitation,
those relating to the environment and climate change, taxes, price controls, regulatory approval and permitting; our ability to close the proposed Merger, the anticipated timing and
terms of the proposed Merger, our ability to realize the anticipated benefits of the proposed Merger and our ability to manage the risks of the proposed Merger; the COVID-19
pandemic, its impact on business and economic conditions and the pace of recovery from the pandemic; the implementation of changes in accounting standards; adverse publicity or
other reputational harm; and other presently unknown unforeseen factors.
Should one or more of these risks or uncertainties materialize, or should any of the underlying assumptions prove incorrect, actual results may vary in material respects from those
expressed or implied by these forward-looking statements. You should not place undue reliance on these forward-looking statements. We do not undertake any obligation to update or
revise any forward-looking statements to reflect events or circumstances after the date of this report, whether as a result of new information, future events or otherwise, except as may
be required under applicable securities laws. Other risk factors are detailed from time to time in our reports filed with the SEC, and we encourage you to consult such disclosures.
About AVANGRID: AVANGRID, Inc. (NYSE: AGR) aspires to be the leading sustainable energy company in the United States. Headquartered in Orange, CT with approximately $39
billion in assets and operations in 24 U.S. states, AVANGRID has two primary lines of business: Avangrid Networks and Avangrid Renewables. Avangrid Networks owns eight electric
and natural gas utilities, serving more than 3.3 million customers in New York and New England. Avangrid Renewables owns and operates a portfolio of renewable energy generation
facilities across the United States. AVANGRID employs approximately 7,000 people and has been recognized by Forbes and Just Capital as one of the 2021 JUST 100 companies - a
list of America's best corporate citizens - and was ranked number one within the utility sector for its commitment to the environment and the communities it serves. The company
supports the U.N.’s Sustainable Development Goals and was named among the World’s Most Ethical Companies in 2021 for the third consecutive year by the Ethisphere Institute. For
more information, visit www.avangrid.com.

| 3
RESULTS PRESENTATION THIRD QUARTER 2021
www.avangrid.com
Legal Notice
Use of Non-U.S. GAAP Financial Measures
To supplement our consolidated financial statements presented in accordance with generally accepted accounting principles in the United States (“GAAP”), we consider adjusted net
income, adjusted earnings per share, adjusted EBITDA and adjusted EBITDA with Tax Credits as non-GAAP financial measures that are not prepared in accordance with GAAP. The
non-GAAP financial measures we use are specific to AVANGRID and the non-GAAP financial measures of other companies may not be calculated in the same manner. We use these
non-GAAP financial measures, in addition to GAAP measures, to establish operating budgets and operational goals to manage and monitor our business, evaluate our operating and
financial performance and to compare such performance to prior periods and to the performance of our competitors. We believe that presenting such non-GAAP financial measures is
useful because such measures can be used to analyze and compare profitability between companies and industries by eliminating the impact of certain non-cash charges. In addition,
we present non-GAAP financial measures because we believe that they and other similar measures are widely used by certain investors, securities analysts and other interested parties
as supplemental measures of performance.
We define adjusted net income as net income adjusted to exclude restructuring charges, mark-to-market earnings from changes in the fair value of derivative instruments, accelerated
depreciation derived from repowering of wind farms, a legal settlement, costs incurred related to the PNMR Merger and the impact of the global coronavirus (COVID-19) pandemic. We
believe adjusted net income is more useful in understanding and evaluating actual and projected financial performance and contribution of AVANGRID core lines of business and to
more fully compare and explain our results. The most directly comparable GAAP measure to adjusted net income is net income. We define adjusted earnings per share, or adjusted
EPS, as adjusted net income converted to an earnings per share amount. We define adjusted EBITDA as adjusted net income adjusted to fully exclude the effects of net (loss) income
attributable to noncontrolling interests, income tax expense (benefit), depreciation and amortization, interest expense, net of capitalization, other (income) expense and (earnings) losses
from equity method investments. We further define adjusted EBITDA with tax credits as adjusted EBITDA adding back the effect of retained Production Tax Credits (PTCs) and
Investment Tax Credits (ITCs) and PTCs allocated to tax equity investors. The most directly comparable U.S. GAAP measure to adjusted EBITDA and adjusted EBITDA with tax credits
is net income.
The use of non-GAAP financial measures is not intended to be considered in isolation or as a substitute for, or superior to, AVANGRID’s GAAP financial information, and investors are
cautioned that the non-GAAP financial measures are limited in their usefulness, may be unique to AVANGRID, and should be considered only as a supplement to AVANGRID’s GAAP
financial measures. The non-GAAP financial measures may not be comparable to other similarly titled measures of other companies and have limitations as analytical tools.
Non-GAAP financial measures are not primary measurements of our performance under GAAP and should not be considered as alternatives to operating income, net income or any
other performance measures determined in accordance with GAAP.
We use the following non-GAAP metrics in our presentation, which are reconciled to their closest GAAP financial measure in the Appendix: Adjusted net income, adjusted
EPS, adjusted EBITDA and adjusted EBITDA with Tax Credits.
Investors and others should note that AVANGRID routinely posts important information on its website and considers the Investor Relations section,
www.avangrid.com/wps/portal/avangrid/Investors,a channel of distribution.

www.avangrid.com | 4
RESULTS PRESENTATION THIRD QUARTER 2021
3Q ’21 Highlights
Dennis ArriolaAVANGRID CEO

| 5
RESULTS PRESENTATION THIRD QUARTER 2021
www.avangrid.com
• Executing New York rate plan
• Achieved customer service metric milestones & filed to remove CMP ROE adjustment
• Completed PNM Resources merger testimony & hearings; New Mexico Commission decision pending & expected 4Q approval & close
Executive Summary
EXCELLENT EARNINGS GROWTH FOR 9M ’21
CONTINUED EXECUTION ON FINANCIAL & STRATEGIC INITIATIVES
AVANGRID
RENEWABLES
NETWORKS
Net Income +28% 3Q ’21 +31% 9M ’21STRONG RESULTS VERSUS ’20
Affirming Earnings Outlook for ’21(2)
Adjusted Net Income(1) +33% 3Q ’21 +40% 9M ’21
• Vineyard Wind 1 achieved financial close & started construction; Commonwealth Wind bid up to 1.2 GW in MA offshore RFP
• Reached agreement to restructure offshore wind leases with partner; 4.9 GW AVANGRID lease areas, including Kitty Hawk (2.5 GW)
• 1.4 GW onshore PPAs with ~1 GW under construction
• On target with $2.9B capital investments plan for ’21
• Strengthened leadership team with appointments at CMP & Renewables business
• Inaugural ESG+F Webinar launched on AVANGRID website
• Executed AVANGRID’s first utility Green Bonds totaling $625M
(1) Please see Appendix for reconciliation of Adjusted Net Income to Net Income.
(2) Outlook assumes the close of the PNM Resources merger at the end of 2021 and does not include PNM Resources financial results or closing costs related to the merger.

| 6
RESULTS PRESENTATION THIRD QUARTER 2021
www.avangrid.com
• Leak prone gas pipeline main replacement (NY, CT, MA)
• AMI & DSIP (NY)
• NERC Transmission Reliability (NY & ME)
• Metro-North Railroad (CT – FERC T)
• Ongoing replacement & repair of aging infrastructure
• Planning for New York Resiliency Bill (pending Governor’s signature)
Networks Improves Performance
FOCUSED ON OPERATIONAL EXCELLENCE
GROWING RATE BASE & NEW RATE PLANS DRIVE FUTURE EARNINGS GROWTHTARGETED RESILIENCY SPENDING (e.g. VEGETATION MANAGEMENT, EQUIPMENT
MODERNIZATION) HELPS IMPROVE EARNED ROES OVER TIME
Implementing rate plans & agreements
Improving safety, reliability & resiliency through investment plans
Successful execution of storm planning & restoration during Tropical Storm Henri & Hurricane Ida
Driving continuous improvement at all utilities to help address affordability

| 7
RESULTS PRESENTATION THIRD QUARTER 2021
www.avangrid.com
Networks Updates
SAFE, RELIABLE OPERATIONS IN THE CLEAN ENERGY TRANSITION FOR THE BENEFIT OF OUR
CUSTOMERS & STAKEHOLDERS
• New CMP leadership with President & CEO
Joe Purington
• Deferring COVID-19 costs in NY
& CT(1)
• Construction is ongoing; >75% line cleared &
(1) Regulatory Asset; NY: can defer as long as not in earnings sharing for each rate year; CT Gas Cos.: deferable for any amounts over the uncollectible threshold in rates.
~100 poles installed (NECEC &
related network upgrades); ~80%
converter station site development &
Segment 3 network upgrades
complete
• Continued strong customer
service emphasis & performance
– e.g., filed to remove CMP’s 100
bp ROE adjustment
CONTINUED FOCUS ON THE CUSTOMER NECEC UPDATE
• Established Customer Listening
Council at each utility
• First towns received tax
payments tied to project
• Grass roots campaign underway
to support successful November
referendum outcome

| 8
RESULTS PRESENTATION THIRD QUARTER 2021
www.avangrid.com
PNM Resources Merger Update
FINAL APPROVALS & CLOSING EXPECTED IN 4Q ’21
NM
TX
PNM Resources
Operations
Combined AVANGRID &
PNM Resources Operations
REGULATORY APPROVALS
• New Mexico Public Regulatory Commission pending
• Received all other major approvals & clearances
• 23 of 24 intervenors either support or don’t oppose the merger
COMBINED COMPANY HIGHLIGHTS
• 10 regulated utilities in 6 states; operations in 24 states
• Pro forma rate base of >$14B
• Aligned ESG+F commitments, including carbon reduction
MERGER BENEFITS
• Increases consolidated regulated business mix to ~85%
• Regulated & renewables growth opportunities
• >3% accretive in first full year in ’22
REGULATORY APPROVALS
COMBINED COMPANY HIGHLIGHTS
MERGER BENEFITS
| 9
RESULTS PRESENTATION THIRD QUARTER 2021
www.avangrid.com
Renewables Updates
STRENGTHENING LEADERSHIP & FOCUS ON KEY BUSINESS SEGMENTSPROGRESSING ON EXISTING PROJECTS
NEW RENEWABLES ORGANIZATION PROJECTS WITH PPAs ~1.4 GW
Decades of experience in Renewable Energy
(1) Formally referenced as Bakeoven II.
(2) Short-listed or in bi-lateral negotiations (not including the 1.4 GW with PPAs).
Dennis Arriola
CEO
Jose Antonio Miranda
Co-CEO & President
Onshore of
Avangrid Renewables
Bill White
Co-CEO & President
Offshore of
Avangrid Renewables
Washington
Lund Hill 194 MW
Illinois
Midland 106 MW
Oregon
Golden Hills 201 MW
California
Camino 57 MW
+11 MW battery
New York
Mohawk 130 MW
Ohio
Great Bear 64 MW
Solar Project 210 MW
~18 GW ONSHORE PIPELINE (~2.5 GW NEAR-TERM(2))
Bakeoven 80 MW
Daybreak(1) 189 MW
Montague 211 MW
Under Construction ~1 GW
| 10
RESULTS PRESENTATION THIRD QUARTER 2021
www.avangrid.com
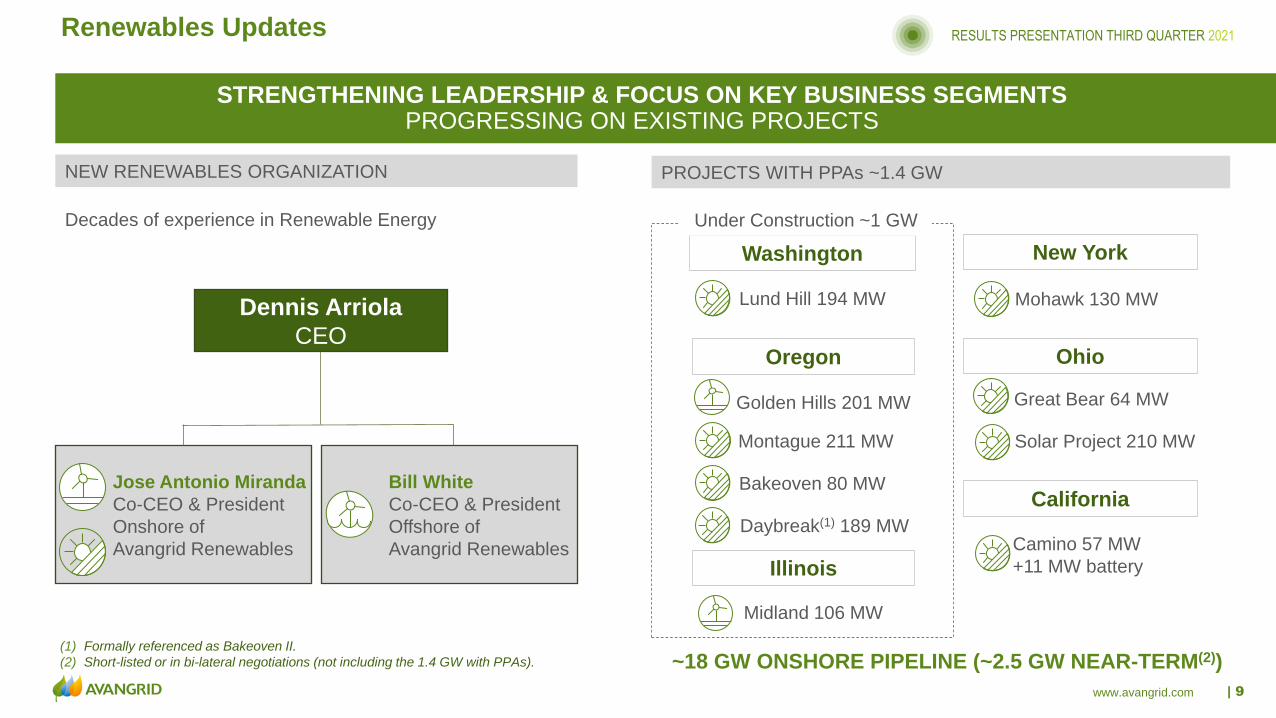
Offshore Wind Highlights
VINEYARD WIND 1 CLOSES FINANCING & STARTS CONSTRUCTIONCOMMONWEALTH WIND BID IN MA’S RFP FOR UP TO 1.2 GW
VINEYARD WIND 1 PROJECT COMMONWEALTH WIND PROJECT
• $2.3B Construction & Term Loan September ’21
• FIRST commercial-scale offshore wind project in U.S.
to reach financial close
• Started construction September ’21
(substation & onshore export cable route in Barnstable, MA)
• 100% of capex contracted
• Creating 3,600 job years over the project period & pledging
long-term economic development initiatives
Project Milestones
Offshore construction start: 1H ’22
Onshore construction started: Sept. ’21
COD: ’24
1st turbine commissioned: ’23
• 800 MW & 1,200 MW bids in MA RFP with strong
social/economic benefits
• First in nation partnership with Energy New England to allow
Municipal Light Plants to purchase offshore wind energy not
purchased by the EDCs
• Partnership with Salem, MA & Crowley Maritime Corporation
to transform Salem Harbor into offshore wind port
• Selection scheduled Dec. 17th

| 11
RESULTS PRESENTATION THIRD QUARTER 2021
www.avangrid.com
AVANGRID Offshore Wind Lease Areas(1)
RESTRUCTURED PARTNERSHIP AGREEMENT POSITIONS COMPANY FOR INDUSTRY LEADERSHIP
AVANGRID LEASE AREAS OF 4.9 GW
(1) Post-restructuring of New England lease areas with joint venture partner Copenhagen Infrastructure Partners (CIP).
COMMONWEALTHWI ND
PAR K CI TY WI ND
NEW ENGLAND(1)Vineyard Wind 1 LLC (50% CIP / 50% AGR)
OCS-A 0501
800 MW Vineyard Wind 1 (AGR 400 MW)
Avangrid Renewables LLC (100% AGR)
OCS-A 0534
804 MW Park City Wind
Avangrid Renewables LLC (100% AGR)
OCS-A 0534
800-1,200 MW Commonwealth Wind bids
2.4 GW
(1.2 GW with PPAs)
NC/VA
2.5 GW
Avangrid Renewables LLC (100% AGR)
OCS-A 0508
2,500 MW capacity Kitty Hawk
KI TTY HAWK OFFSHOR E

| 12
RESULTS PRESENTATION THIRD QUARTER 2021
www.avangrid.com
Significant & Proven Offshore Success
AVANGRID & IBERDROLA TEAMS WITH STRONG EXPERIENCE & DEEP BENCH STRENGTH
AVANGRID IS UNIQUELY POSITIONED IBERDROLA HAS A TRACK RECORD
• AVANGRID has built a strong U.S. team with significant U.S.
onshore & offshore experience
• U.S. team & global affiliates have deep technical knowledge &
engineering experience
• U.S.-specific expertise gained in developing & permitting the
first U.S. commercial scale offshore wind project
• Leveraging Iberdrola team’s knowledge & experience with well
developed supply chain, relationships & purchasing power
• Benefiting from Iberdrola’s global experience constructing &
managing offshore O&M
Wikinger (350 MW)
East Anglia ONE (714 MW)
West of Duddon Sands (389 MW)
IN DEVELOPMENT /
CONSTRUCTION
• 2.9 GW
GLOBAL OFFSHORE PIPELINE • ~23 GW
INSTALLED
• 1.5 GW
VW1 & Park City (1,604 MW)
San Brieuc (496 MW)
Baltic Eagle & Windanker (784 MW)
| 13
RESULTS PRESENTATION THIRD QUARTER 2021
www.avangrid.com
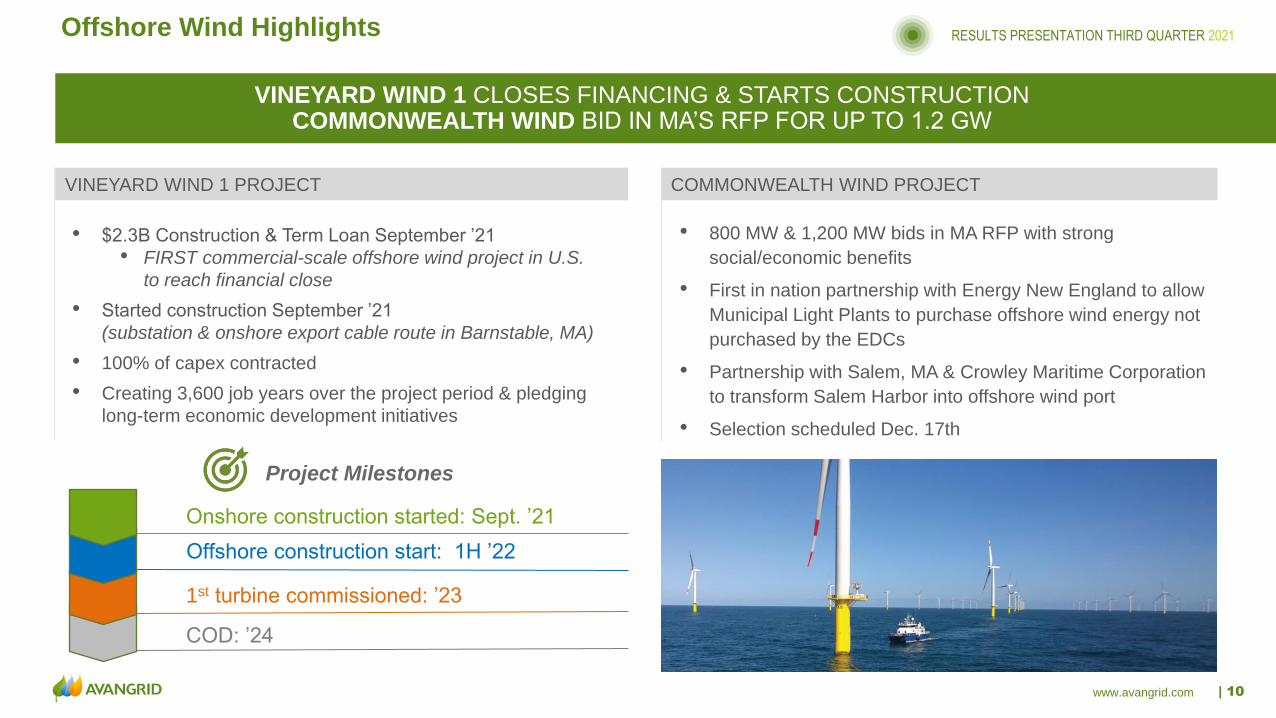
ESG + F = Sustainable Value
FOCUSED ON BEING THE LEADING SUSTAINABLE ENERGY COMPANY IN THE U.S.
LAUNCHED INAGUARAL SUSTAINABILITY WEBINAR KEY ESG+F GOALS
HIGHLIGHTS AVANGRID’S KEY ESG+F SUSTAINABLE
VALUE PROPOSITION
To enjoy this first-in-the-series 30-minute webinar,
please click on the hyperlinked image below or visit the
IR homepage of our website www.avangrid.com
Renewables’ installed capacity >100% by ’25 vs. ’15
Scope 1(1) GHG emissions intensity 35% by ’25 vs. ’15
Scope 1 carbon neutral by ’35
60% of fleet converted to cleaner energy vehicles by ’30(2)
• Enhance supplier sustainability
• Increase annual supplier diversity spend to $300M by ’25
• >35,000/yr employee volunteer hrs. by ’25
• Strengthen diversity on leadership team & provide
unconscious bias training enterprise-wide
Deliver sustainable shareholder value$
(1) Scope 1: GHG emissions from electricity generation, CH4 leaks, SF6 fugitive emissions, fuel consumption in buildings & Company vehicles.
(2) Subject to regulatory approval & availability of vehicles & charging equipment.

www.avangrid.com | 14
RESULTS PRESENTATION THIRD QUARTER 2021
3Q’21 Financial Results
Doug StuverAVANGRID CFO

| 15www.avangrid.com
RESULTS PRESENTATION THIRD QUARTER 2021
($M) 3Q ’21 3Q ’20 Δ 9M ’21 9M ’20 Δ
Adj. Net Income
Networks$130 $99 +31% $467 $379 +23%
Adj. Net Income
Renewables$18 $32 -44% $182 $108 +68%
Adj. EBITDA w/
Tax Credits(1) $136 $153 -13% $589 $473 +25%
3Q ’21 Financial Results
STRONG FINANCIAL RESULTS DRIVEN BY EXECUTION & PLANNED INVESTMENTS
(1) See Appendix for reconciliation of Adjusted Net Income to Net Income and Adjusted EBITDA with Tax Credits to Net Income.
(2) Accrual basis (Consolidated is Networks plus Renewables).
Amounts may not add due to rounding.
NET INCOME
$100
$434
$133
$609
ADJUSTED NET INCOME(1)
$87
$415
$111
$543
3Q ’20 3Q ’21 9M ’219M ’20 3Q ’20 3Q ’21 9M ’219M ’20
+28%
+31%
+33%
+40%
INVESTMENTS(2) ($M)
$1,128
$1,503
$747
$616
9M '20
9M '21Networks
Renewables
$2,119
$1,875
+13%

| 16www.avangrid.com
RESULTS PRESENTATION THIRD QUARTER 20219M ’21 Key Drivers
NETWORKS RATE PLANS DRIVE GROWTH
RENEWABLES NEW CAPACITY & STRONG OPERATIONS REDUCED BY LOW WIND
(1) See Appendix for reconciliation of Adjusted Net Income to Net Income.
(2) Includes impact of strong operations in February weather event.
Amounts may not add due to rounding.
9M ADJUSTED EPS(1) KEY DRIVERS
Adjusted EPS
9M ’20
Adjusted EPS
9M ’21
Other
Networks,
Renewables,
Corporate
May Share
Issuance
Thermal &
Asset
Management
Other
Renewables(2)Networks
Rate Plans
Networks
Financial
Income
Networks
Depreciation
Wind
Production
| 17www.avangrid.com
RESULTS PRESENTATION THIRD QUARTER 2021Renewables Production
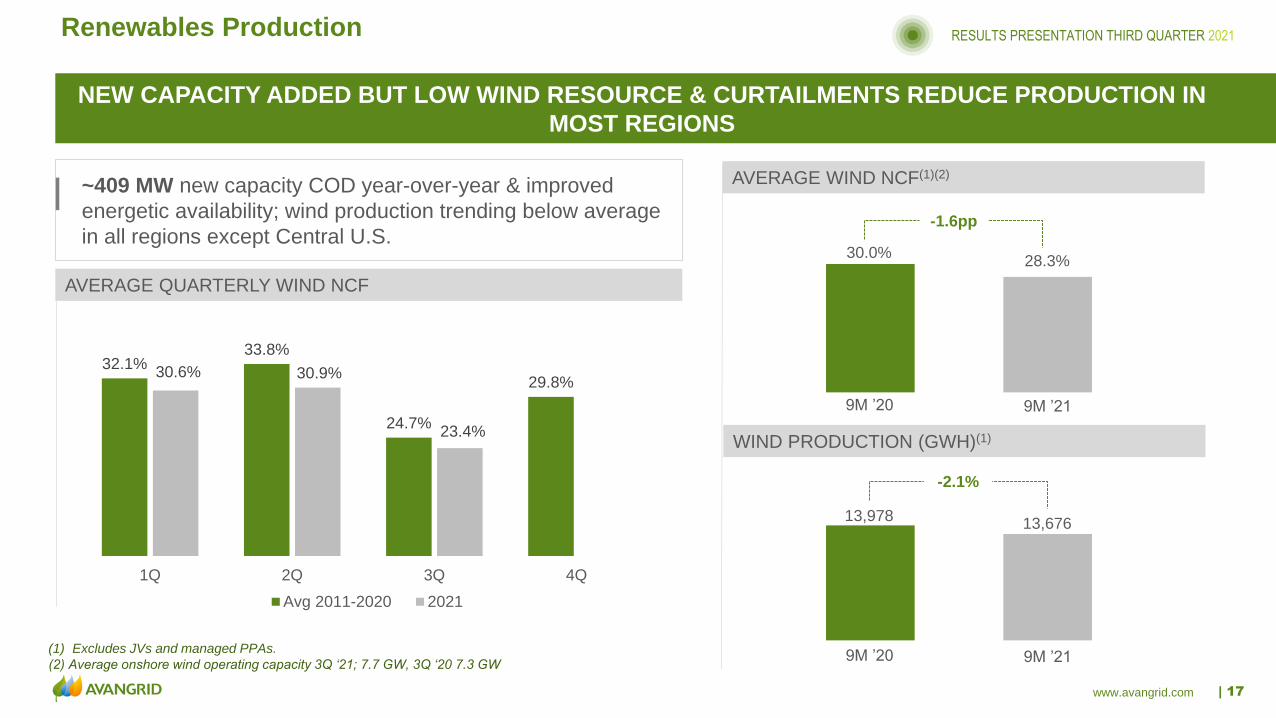
NEW CAPACITY ADDED BUT LOW WIND RESOURCE & CURTAILMENTS REDUCE PRODUCTION IN
MOST REGIONS
~409 MW new capacity COD year-over-year & improved
energetic availability; wind production trending below average
in all regions except Central U.S.
32.1%33.8%
24.7%
29.8%30.6% 30.9%
23.4%
1Q 2Q 3Q 4Q
Avg 2011-2020 2021
(1) Excludes JVs and managed PPAs.
(2) Average onshore wind operating capacity 3Q ‘21; 7.7 GW, 3Q ‘20 7.3 GW
AVERAGE QUARTERLY WIND NCF
AVERAGE WIND NCF(1)(2)
WIND PRODUCTION (GWH)(1)
13,97813,676
28.3%30.0%
9M ’20 9M ’21
9M ’20 9M ’21
-2.1%
-1.6pp

| 18www.avangrid.com
RESULTS PRESENTATION THIRD QUARTER 2021Outlook
AFFIRMING OUTLOOK WITH STRONG FOCUS ON EXECUTION
(1) Outlook assumes the close of the PNM Resources merger at the end of 2021 and does not include PNM Resources financial results or closing costs related to the merger.
(2) Reflects increase in weighted average shares to 358M for full year 2021 vs. 309.5M for full year 2020.
(3) See Appendix for reconciliation of Adjusted Net Income to Net Income and Adjusted EPS to EPS.
Amounts may not add due to rounding.
’21 Net Income ’21 EPS(2)
$700M-$765M $1.95 - $2.14
’21 Adjusted Net Income(3) ’21 Adjusted EPS(2)(3)
$730M-$795M $2.04 - $2.22
• Strong 9M ’21 performance
• Executing on Networks investment plan
• Trending to authorized ROEs
• Larger than anticipated Networks system interruption frequency,
impacting SAIFI
$625$696
$763
Feb. 24 Initial
Outlook
October 27
Outlook
• Effective asset management & operations in Renewables,
enabling strong performance in February weather event
• Improvement in Renewables energetic availability
• Wind resource vs. historical averages
• # shares outstanding increased with May ’21 issuance(2)
’21 OUTLOOK(1)
KEY DRIVERS
+10%
’21 ADJUSTED NET INCOME(1) OUTLOOK MIDPOINTS ($M)
’20 Actual
Results
+22%

| 19www.avangrid.com
RESULTS PRESENTATION THIRD QUARTER 2021Inflation & Commodity Impacts
POSITIVE BENEFIT FROM IBERDROLA PURCHASING POWER (~$10B/YEAR CAPITAL SPEND)
NO MATERIAL IMPACT EXPECTED
MONITORING GLOBAL MARKETS & ACTIVELY MANAGING IMPACTS ON THE BUSINESS
Offshore Wind:
• Vineyard Wind: ~100% capex contracted; 2.5% annual escalator in PPAs
• Park City Wind: Expect to secure capex in ‘23; 2.5% annual escalator in PPAs
Onshore Wind:
• Capex contracted for projects through ’23
Solar:
• Framework module agreements signed for projects through ’22
• In process of managing ’23+ exposure
• Along with rest of industry, monitoring potential tariff changes
Exposure to inflation is primarily mitigated through storage, hedging; fuel costs are a pass through
NECEC (steel): The majority of equipment has already been purchased & impacts are minor & within project expectations;
2% annual escalator in contract
RENEWABLES
NETWORKS

| 20www.avangrid.com
RESULTS PRESENTATION THIRD QUARTER 2021New England Gas Prices
NETWORKS MITIGATES IMPACTS OF RISING GAS PRICES WITH PLANNING & HEDGING
FOCUS ON CUSTOMER IMPACT
• Fuel costs are a pass-through
• Do not anticipate gas supply issues this winter
• Supply procured through commodity, transportation & storage contracts; NY also uses financial hedges
ELECTRIC BUSINESSES
NYSE
G &
RG&E
CMP
&
MNG
BGC
UI, CNG,
SCG
Avangrid Networks
states of operation
• Commodity costs are a pass through
• In NY & CT, supply is purchased in advance through laddered wholesale power contracts;
ME has a state-run procurement process
GAS BUSINESSES
• Monitoring global markets & actively managing impacts on the business
• Focusing on opportunities to mitigate impacts through efficiencies
• Stakeholder & community outreach & education efforts are a key initiative
LONG-STANDING COMMODITY PROCUREMENT PROGRAM CONSISTENT WITH REGULATORY POLICY & GUIDANCE

| 21www.avangrid.com
RESULTS PRESENTATION THIRD QUARTER 2021Access To Sustainable Capital & Financing
SOLID LIQUIDITY, CREDIT RATINGS & RECOGNITION AS A LEADING ENERGY COMPANY
STRONG LIQUIDITY
$2B
$0.5B
CP (Backed by $2.5B
Sustainability-Linked
Credit Facility)
Iberdrola Credit Facility
BBB+ S&P
Baa2 Moody’s
Fitch$1.4B Cash balance 9/30/2021
SOLID CREDIT RATINGS
BBB+
FINANCING
• Vineyard Wind 1 reached financial close in
September with $2.3B construction & term loan
financing
• Commitment to sustainable financing (Currently
#9 U.S. issuer (#4 utility) of Green, Social &
Sustainability bonds with $2.45B outstanding)(1)
• Executed first Green Bonds at the utilities ($990M
in bonds; including $625M in Green Bonds)
Company $M Green Bond
NYSEG $350
UI $150
RG&E $125
$125
CMP $200
SCG $40
(1) Source: Bloomberg (only adds NYSEG $350M, which was issued in September; RG&E $125M and UI $150M were executed and closed, but will fund in December, increasing Green, Social &
Sustainability bonds to $2.7B).
• S&P Global added AGR to Index in October rebalancing
• Selected as one of 75 global beneficiaries of the low-
carbon transition with long-term growth potential & a
sustainable approach
S&P GLOBAL CLEAN ENERGY INDEX

| 22www.avangrid.com
Q&A with Management

www.avangrid.com | 23
RESULTS PRESENTATION THIRD QUARTER 2021
Closing Remarks
Dennis ArriolaAVANGRID CEO

| 24www.avangrid.com
RESULTS PRESENTATION THIRD QUARTER 2021
Clean generation portfolio:
✓ Generation portfolio 90% renewables
✓ Scope 1 Carbon Neutrality Goal by ’35
Why AVANGRID?
UNIQUELY POSITIONED TO BE THE LEADING SUSTAINABLE ENERGY COMPANY IN THE U.S.
Industry ESG+F Leadership
(1) Long Term Outlook as of November 5, 2020.
(2) Includes PNM Resources; based on Long Term Outlook as of November 5, 2020.
Customer Service • Execution • Delivering On Our Commitments
• 6-8% CAGR ’21-’25(1), including merger with PNM Resources
• $20B of regulated(2) & contracted investments through ’25
• Attractive business mix > 85% regulated Networks(2)
• Unique offshore wind, onshore renewables & transmission opportunities, aligned with state & federal
clean energy policies
• Reliable dividend & commitment to solid investment grade credit ratings

| 25www.avangrid.com
RESULTS PRESENTATION THIRD QUARTER 2021
APPENDIX
| 26www.avangrid.com
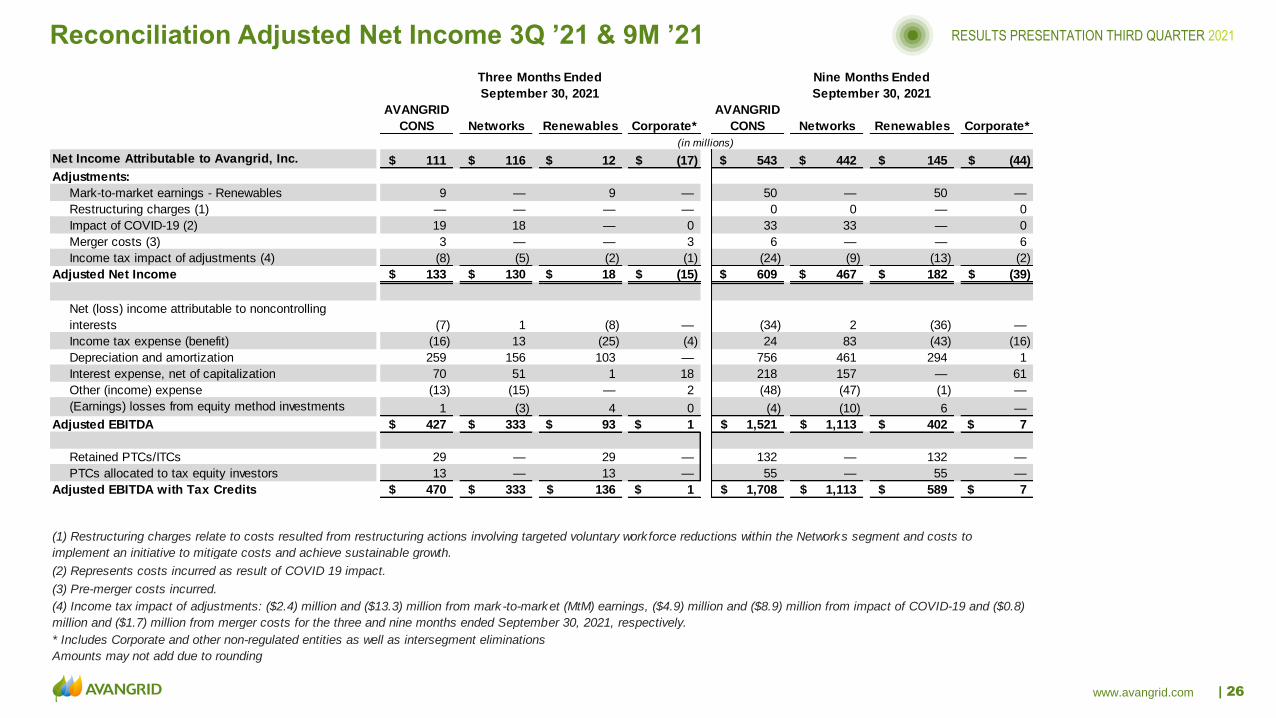
RESULTS PRESENTATION THIRD QUARTER 2021Reconciliation Adjusted Net Income 3Q ’21 & 9M ’21
AVANGRID
CONS Networks Renewables Corporate*
AVANGRID
CONS Networks Renewables Corporate*
Net Income Attributable to Avangrid, Inc. 111$ 116$ 12$ (17)$ 543$ 442$ 145$ (44)$
Adjustments:
Mark-to-market earnings - Renewables 9 — 9 — 50 — 50 —
Restructuring charges (1) — — — — 0 0 — 0
Impact of COVID-19 (2) 19 18 — 0 33 33 — 0
Merger costs (3) 3 — — 3 6 — — 6
Income tax impact of adjustments (4) (8) (5) (2) (1) (24) (9) (13) (2)
Adjusted Net Income 133$ 130$ 18$ (15)$ 609$ 467$ 182$ (39)$
Net (loss) income attributable to noncontrolling
interests (7) 1 (8) — (34) 2 (36) —
Income tax expense (benefit) (16) 13 (25) (4) 24 83 (43) (16)
Depreciation and amortization 259 156 103 — 756 461 294 1
Interest expense, net of capitalization 70 51 1 18 218 157 — 61
Other (income) expense (13) (15) — 2 (48) (47) (1) —
(Earnings) losses from equity method investments 1 (3) 4 0 (4) (10) 6 —
Adjusted EBITDA 427$ 333$ 93$ 1$ 1,521$ 1,113$ 402$ 7$
Retained PTCs/ITCs 29 — 29 — 132 — 132 —
PTCs allocated to tax equity investors 13 — 13 — 55 — 55 —
Adjusted EBITDA with Tax Credits 470$ 333$ 136$ 1$ 1,708$ 1,113$ 589$ 7$
* Includes Corporate and other non-regulated entities as well as intersegment eliminations
Amounts may not add due to rounding
(3) Pre-merger costs incurred.
(4) Income tax impact of adjustments: ($2.4) million and ($13.3) million from mark-to-market (MtM) earnings, ($4.9) million and ($8.9) million from impact of COVID-19 and ($0.8)
million and ($1.7) million from merger costs for the three and nine months ended September 30, 2021, respectively.
(in millions)
(1) Restructuring charges relate to costs resulted from restructuring actions involving targeted voluntary work force reductions within the Networks segment and costs to
implement an initiative to mitigate costs and achieve sustainable growth.
(2) Represents costs incurred as result of COVID 19 impact.
Three Months Ended Nine Months Ended
September 30, 2021 September 30, 2021

| 27www.avangrid.com
RESULTS PRESENTATION THIRD QUARTER 2021Reconciliation Adjusted Net Income 3Q ’20 & 9M ’20
AVANGRID
CONS Networks Renewables Corporate*
AVANGRID
CONS Networks Renewables Corporate*
Net Income (Loss) Attributable to Avangrid, Inc. 87$ 94$ 25$ (31)$ 415$ 363$ 107$ (55)$
Adjustments:
Mark-to-market earnings - Renewables 7 — 7 — (9) — (9) —
Restructuring charges (1) 1 1 0 — 5 3 1 0
Accelerated depreciation from repowering (2) 3 — 3 — 9 — 9 —
Impact of COVID-19 (3) 8 7 1 0 21 18 1 2
Income tax impact of adjustments (4) (5) (2) (3) (0) (7) (6) (0) (1)
Adjusted Net Income 100$ 99$ 32$ (31)$ 434$ 379$ 108$ (53)$
Net (loss) income attributable to noncontrolling
interests (6) 1 (7) — (28) 2 (30) —
Income tax expense (benefit) 20 22 (4) 2 28 81 (53) (0)
Depreciation and amortization 252 151 101 — 739 446 292 1
Interest expense, net of capitalization 86 63 (1) 24 251 199 (1) 53
Other (income) expense (16) (14) (5) 3 (15) (14) (10) 9
(Earnings) losses from equity method investments (1) (3) 2 — 3 (8) 11 —
Adjusted EBITDA 435$ 319$ 118$ (2)$ 1,412$ 1,085$ 318$ 9$
Retained PTCs/ITCs 22 — 22 — 111 — 111 —
PTCs allocated to tax equity investors 14 — 14 — 45 — 45 —
Adjusted EBITDA with Tax Credits 471$ 319$ 153$ (2)$ 1,567$ 1,085$ 473$ 9$
(3) Represents costs incurred as result of COVID 19 impact.
* Includes Corporate and other non-regulated entities as well as intersegment eliminations
Amounts may not add due to rounding
(1) Restructuring charges relate to costs resulted from restructuring actions involving targeted voluntary work force reductions within the Networks segment and costs to
implement an initiative to mitigate costs and achieve sustainable growth.
(2) The amount of accelerated depreciation derived from repowering of windfarms in Renewables.
(4) Income tax impact of adjustments: ($1.6) million and $2.5 million from mark-to-market (MtM) earnings, ($0.3) million and ($1.4) million from restructuring charges, $(0.7)
million and ($2.3) million from accelerated depreciation, ($1.9) million and ($5.4) million from impact of COVID-19 for the three and nine months ended September 30, 2020,
respectively.
(in millions)
Three Months Ended Nine Months Ended
September 30, 2020 September 30, 2020

| 28www.avangrid.com
RESULTS PRESENTATION THIRD QUARTER 2021Reconciliation Adjusted EPS
2021 2020 '21 vs '20 2021 2020 '21 vs '20
Networks 0.30$ 0.30$ (0.00)$ 1.27$ 1.17$ 0.10$
Renewables 0.03 0.08 (0.05) 0.42 0.35 0.07
Corporate* (0.04) (0.10) 0.06 (0.13) (0.18) 0.05
GAAP Earnings Per Share 0.29$ 0.28$ 0.01$ 1.56$ 1.34$ 0.22$
Adjustments:
Restructuring charges - 0.00 (0.00) 0.00 0.02 (0.02)
Mark-to-market earnings - Renewables 0.02 0.02 0.00 0.14 (0.03) 0.17
Accelerated depreciation from repowering - 0.01 (0.01) - 0.03 (0.03)
Impact of COVID-19 0.05 0.02 0.02 0.10 0.07 0.03
Merger costs 0.01 - 0.01 0.02 - 0.02
Income tax impact of adjustments** (0.02) (0.02) (0.01) (0.07) (0.02) (0.05)
Adjusted Earnings Per Share 0.34$ 0.32$ 0.02$ 1.75$ 1.40$ 0.35$
Weighted-avg # of Shares (M): 387.3 309.5 348.3 309.5
Amounts may not add due to rounding
* Includes Corporate and other non-regulated entities as well as intersegment eliminations
Adjusted
2021
Adjusted
2020
Adjusted
'21 vs '20
Adjusted
2021
Adjusted
2020
Adjusted
'21 vs '20
Networks 0.34$ 0.32$ 0.01$ 1.34$ 1.22$ 0.12$
Renewables 0.05 0.10 (0.06) 0.52 0.35 0.17
Corporate* (0.04) (0.10) 0.06 (0.11) (0.17) 0.06
Adjusted Earnings Per Share 0.34$ 0.32$ 0.02$ 1.75$ 1.40$ 0.35$
Weighted-avg # of Shares (M): 387.3 309.5 348.3 309.5
Amounts may not add due to rounding
* Includes Corporate and other non-regulated entities as well as intersegment eliminations
Non-U.S. GAAP Adjusted Earnings (Loss) Per Share
Three Months ended September 30, Nine Months ended September 30,
** 2021: EPS Income tax impact of adjustments: ($0.01) and ($0.04) from mark-to-market (MtM) earnings - Renewables and ($0.01) and ($0.03) from
impact of COVID-19 - Networks, for the three and nine months ended September 30, 2021, respectively.
** 2020: EPS Income tax impact of adjustments: $0 and $0.01 from mark-to-market (MtM) earnings, ($0.01) and ($0.01) from accelerated depreciation -
Renewables, and ($0.01) and ($0.02) from impact of COVID-19, for the three and nine months ended September 30, 2020, respectively.
Nine Months ended September 30,
Avangrid, Inc.
Reconciliation of Non-U.S. GAAP Adjusted Earnings (Loss) Per Share (EPS)
(Unaudited)
Three Months ended September 30,

| 29www.avangrid.com
RESULTS PRESENTATION THIRD QUARTER 2021Reconciliation Adjusted Net Income
& Adjusted EPS Outlook for ’21
As of 10/27/21
$M, except per share data
Net Income $700 - $765
Adjustments:
Mark-to-market adjustments $7 - $11
COVID-19 $13 - $17
Merger costs $6 - $10
Adjusted Net Income $730 - $795
U.S. GAAP EPS $1.95 - $2.14
Adjustments:
Mark-to-market adjustments $0.02 - $0.03
COVID-19 $0.04 - $0.05
Merger costs $0.02 - $0.03
Adjusted EPS $2.04 - $2.22
Assumes approx. 358 million shares outstanding.
Avangrid, Inc.
Reconciliation of Non-U.S. GAAP Adjusted 2021 Outlook - Estimated EPS
Amounts may not add due to rounding.
| 30www.avangrid.com
RESULTS PRESENTATION THIRD QUARTER 2021
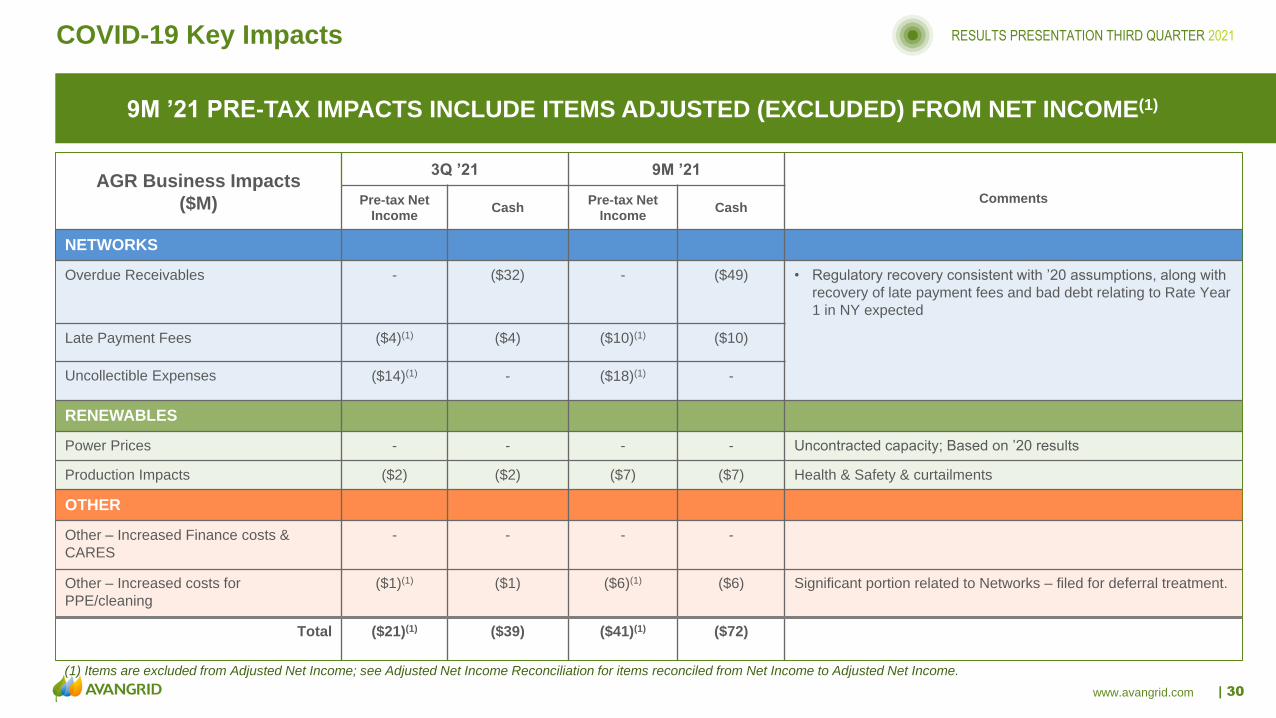
AGR Business Impacts
($M)
3Q ’21 9M ’21
Pre-tax Net Income
CashPre-tax Net
IncomeCash
Comments
NETWORKS
Overdue Receivables - ($32) - ($49) • Regulatory recovery consistent with ’20 assumptions, along with
recovery of late payment fees and bad debt relating to Rate Year
1 in NY expected
Late Payment Fees ($4)(1) ($4) ($10)(1) ($10)
Uncollectible Expenses ($14)(1) - ($18)(1) -
RENEWABLES
Power Prices - - - - Uncontracted capacity; Based on ’20 results
Production Impacts ($2) ($2) ($7) ($7) Health & Safety & curtailments
OTHER
Other – Increased Finance costs &
CARES
- - - -
Other – Increased costs for
PPE/cleaning
($1)(1) ($1) ($6)(1) ($6) Significant portion related to Networks – filed for deferral treatment.
Total ($21)(1) ($39) ($41)(1) ($72)
9M ’21 PRE-TAX IMPACTS INCLUDE ITEMS ADJUSTED (EXCLUDED) FROM NET INCOME(1)
COVID-19 Key Impacts
(1) Items are excluded from Adjusted Net Income; see Adjusted Net Income Reconciliation for items reconciled from Net Income to Adjusted Net Income.