Results of the Initial Analysis - Entergy...
25
Preliminary Results -- Subject to Change Additional Scenarios Contemplated 1 Results of the Initial Analysis EAI Technical Conference September 23, 2010
Transcript of Results of the Initial Analysis - Entergy...
Preliminary Results -- Subject to ChangeAdditional Scenarios Contemplated
1
Results of the InitialAnalysis
EAI Technical ConferenceSeptember 23, 2010
Preliminary Results -- Subject to ChangeAdditional Scenarios Contemplated
2
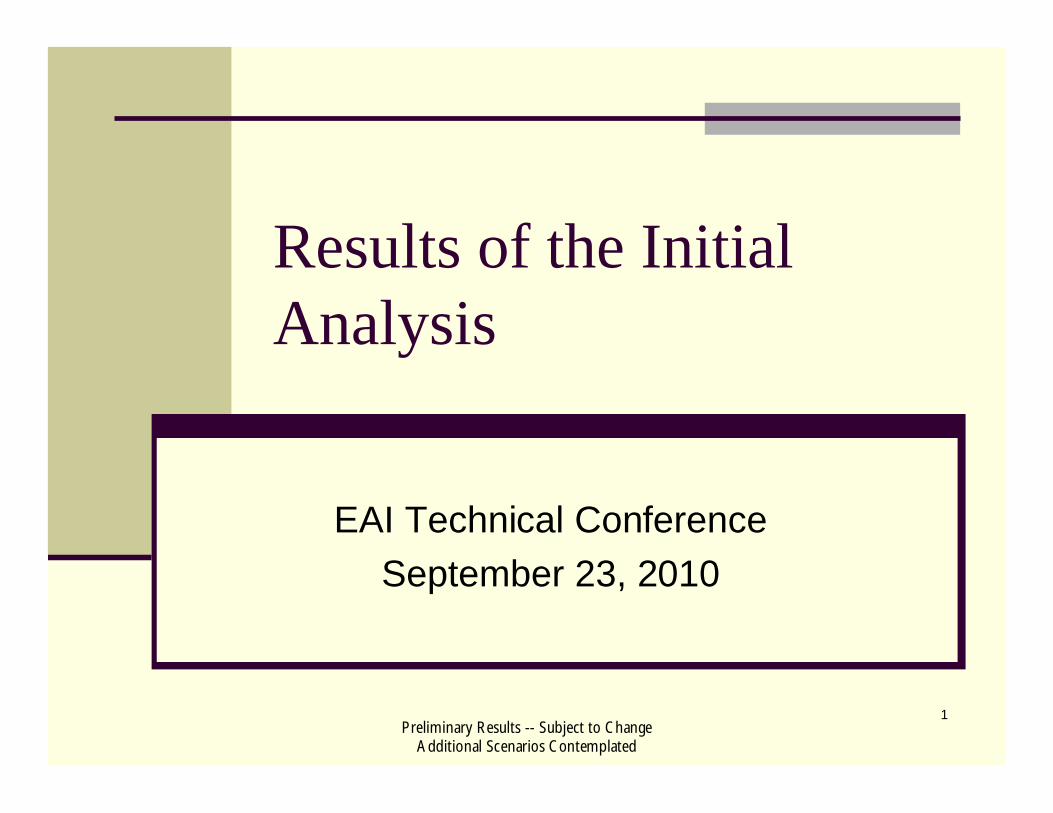
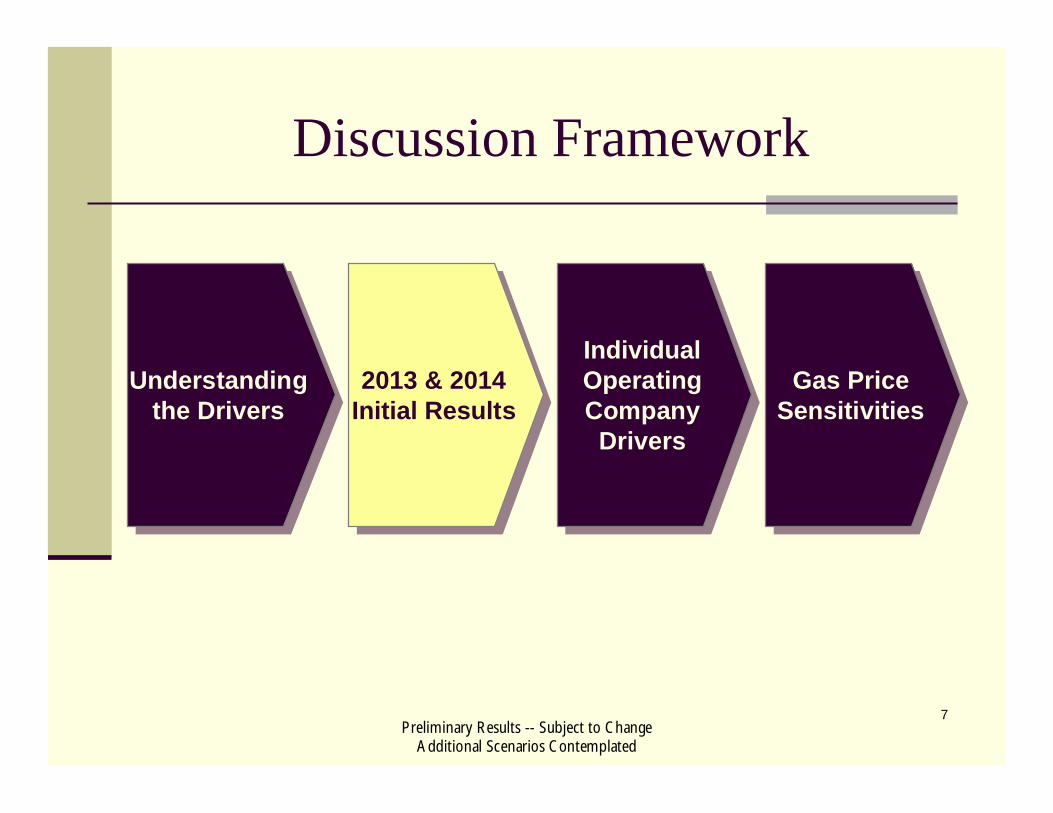
Discussion Framework
PRIVILEGED AND CONFIDENTIALAttorney Client Privileged CommunicationAttorney Work Product
Understandingthe Drivers
Understandingthe Drivers
2013 & 2014Initial Results2013 & 2014
Initial Results
IndividualOperatingCompany
Drivers
IndividualOperatingCompany
Drivers
Gas PriceSensitivitiesGas Price
Sensitivities
Preliminary Results -- Subject to ChangeAdditional Scenarios Contemplated
3
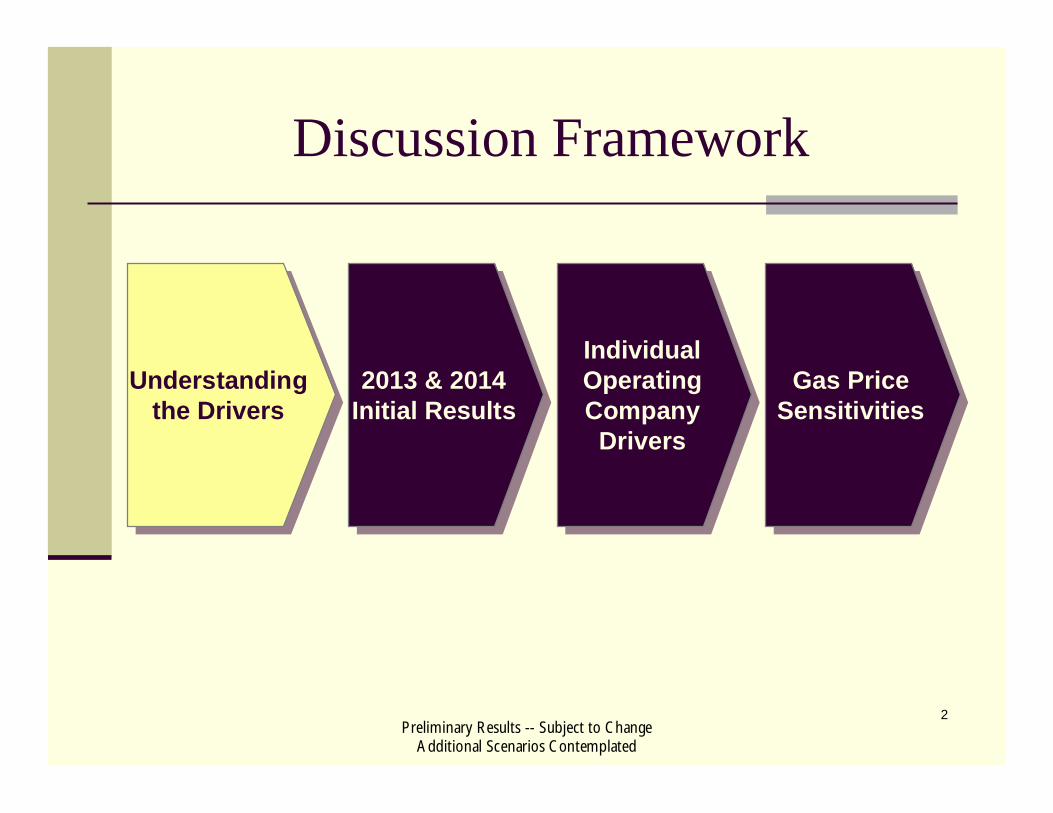
The main difference in this initial analysis between CODA and theSystem Agreement revolves around the allocation of flexibleenergy costs
Flexible energy costs refer to the costs that correspond to the provision of flexibility forthe SystemFlexible energy costs are not unique to CODA -- they are as much a part of the SystemAgreement as they are of CODACODA and the System Agreement allocate flexible energy costs very differently
The System Agreement allocates flexible energy costs regardless of an OPCO’s“flex” position (i.e. if it has excess flexibility or is short flexibility)CODA allocates flexible energy costs based on an OPCO’s flex positionThe largest impact relates to different allocations of the flexible energy costs oflegacy gas/oil units as the cost of these unit are usually much higher than newergas and coal units -- i.e. $100/MWh versus $65-75/MWh
The following charts highlight how the CODA and System Agreement structures differ,using three portrayals that are indicative of circumstances faced by the OPCOs
Preliminary Results -- Subject to ChangeAdditional Scenarios Contemplated
4
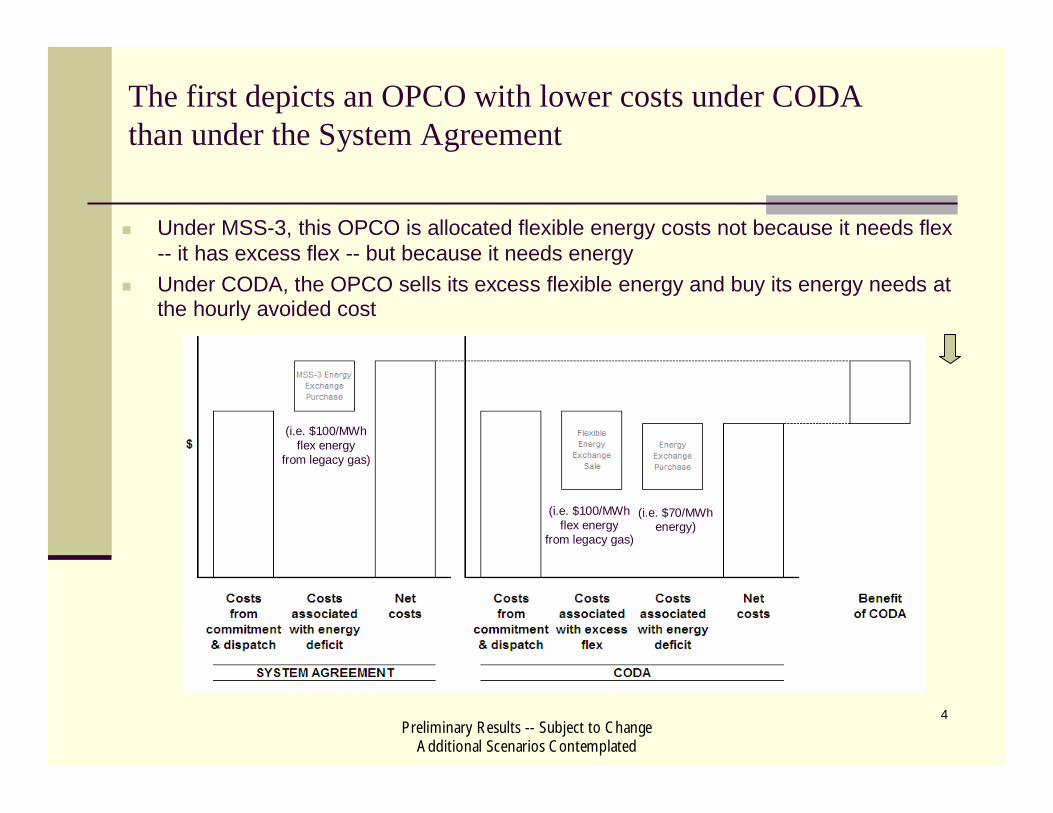
The first depicts an OPCO with lower costs under CODAthan under the System Agreement
(i.e. $100/MWhflex energy
from legacy gas)
(i.e. $70/MWhenergy)
Under MSS-3, this OPCO is allocated flexible energy costs not because it needs flex-- it has excess flex -- but because it needs energyUnder CODA, the OPCO sells its excess flexible energy and buy its energy needs atthe hourly avoided cost
(i.e. $100/MWhflex energy
from legacy gas)
Preliminary Results -- Subject to ChangeAdditional Scenarios Contemplated
5
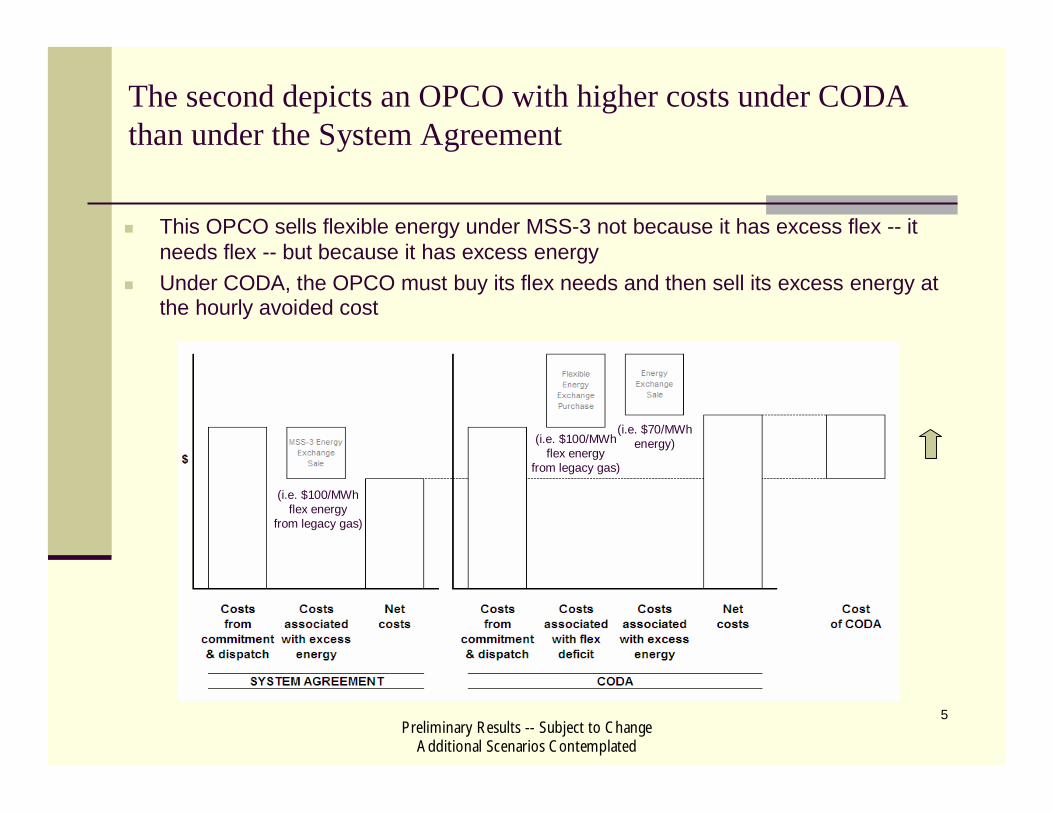
The second depicts an OPCO with higher costs under CODAthan under the System Agreement
This OPCO sells flexible energy under MSS-3 not because it has excess flex -- itneeds flex -- but because it has excess energyUnder CODA, the OPCO must buy its flex needs and then sell its excess energy atthe hourly avoided cost
(i.e. $100/MWhflex energy
from legacy gas)
(i.e. $100/MWhflex energy
from legacy gas)
(i.e. $70/MWhenergy)
Preliminary Results -- Subject to ChangeAdditional Scenarios Contemplated
6
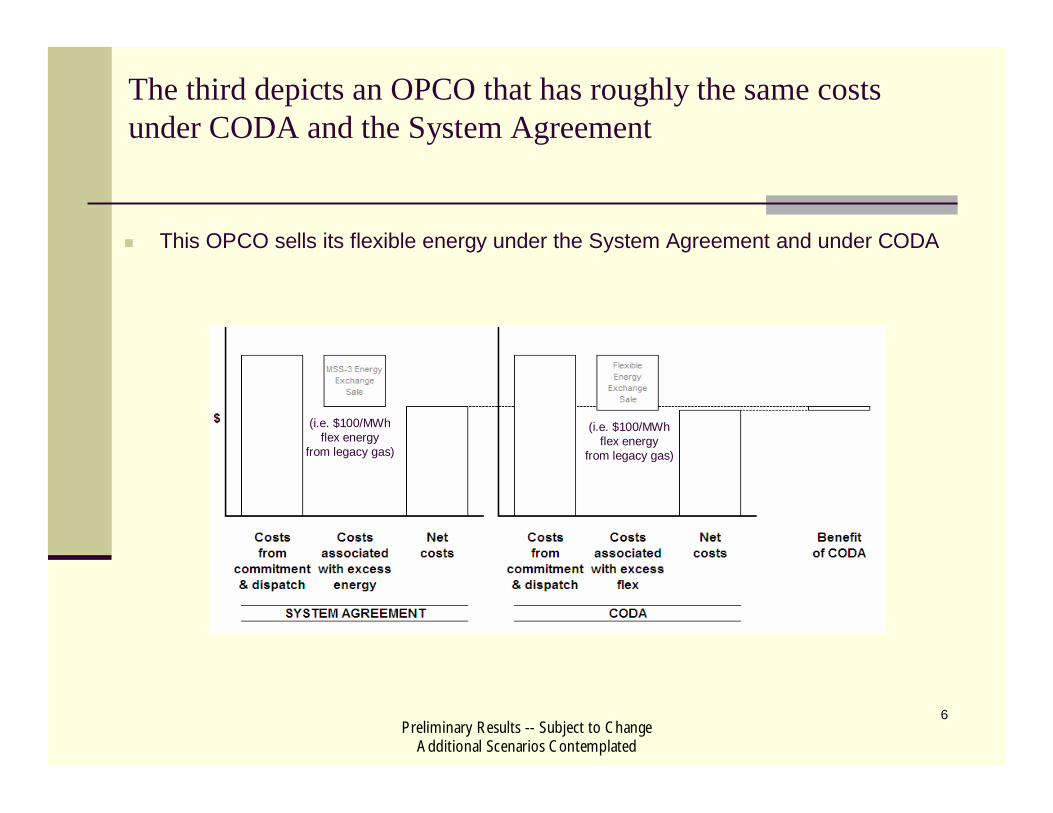
The third depicts an OPCO that has roughly the same costsunder CODA and the System Agreement
This OPCO sells its flexible energy under the System Agreement and under CODA
(i.e. $100/MWhflex energy
from legacy gas)
(i.e. $100/MWhflex energy
from legacy gas)
Preliminary Results -- Subject to ChangeAdditional Scenarios Contemplated
7
Discussion Framework
PRIVILEGED AND CONFIDENTIALAttorney Client Privileged CommunicationAttorney Work Product
Understandingthe Drivers
Understandingthe Drivers
2013 & 2014Initial Results2013 & 2014
Initial Results
IndividualOperatingCompany
Drivers
IndividualOperatingCompany
Drivers
Gas PriceSensitivitiesGas Price
Sensitivities
Preliminary Results -- Subject to ChangeAdditional Scenarios Contemplated
8
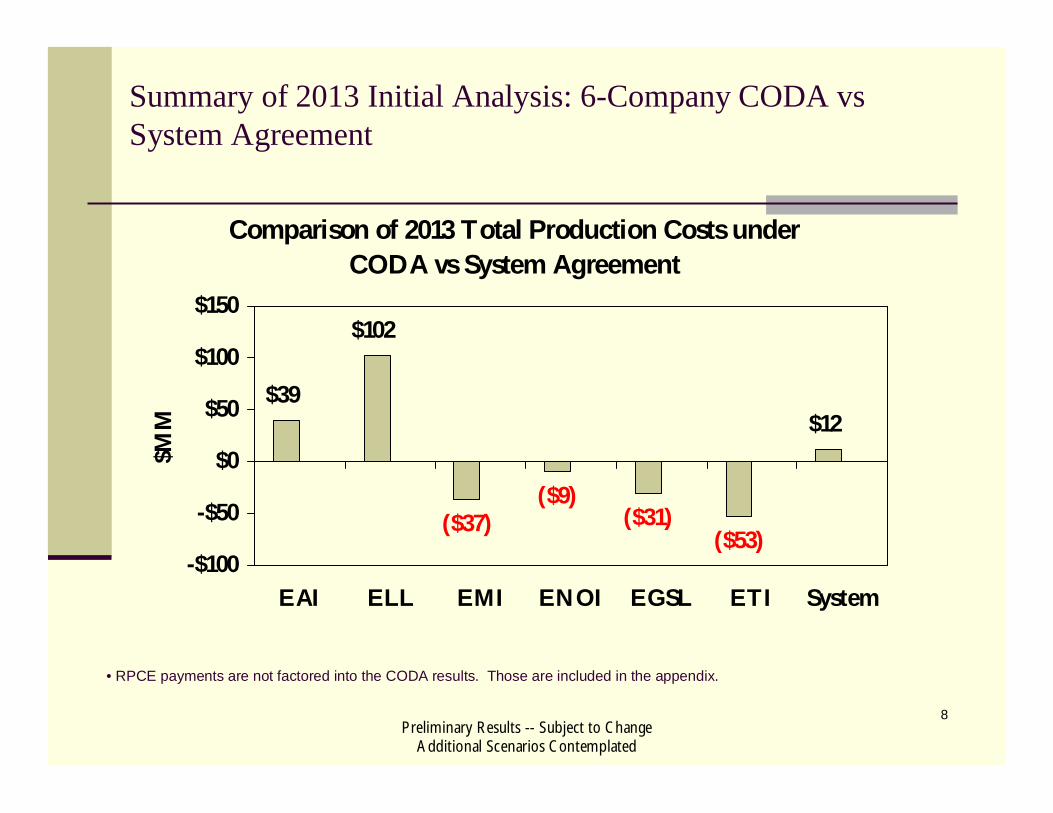
Summary of 2013 Initial Analysis: 6-Company CODA vsSystem Agreement
Comparison of 2013 Total Production Costs underCODA vs System Agreement
$39
$102
($37)($9)
($31)($53)
$12
-$100
-$50
$0
$50
$100
$150
EAI ELL EMI ENOI EGSL ETI System
$MM
• RPCE payments are not factored into the CODA results. Those are included in the appendix.

Preliminary Results -- Subject to ChangeAdditional Scenarios Contemplated
9
For 2013, the 6-Company CODA results in a shift of fuelcosts among the operating companies and produces non-fuelsavings
Breakdown of 2013 Production Cost Savings by Fueland Non-Fuel under CODA vs System Agreement
-$100
-$50
$0
$50
$100
$150
EAI ELL EMI ENOI EGSL ETI System
$MM
Fuel & Purch Pwr Non-Fuel
• RPCE payments are not factored into the CODA results. Those are included in the appendix.
Preliminary Results -- Subject to ChangeAdditional Scenarios Contemplated
10
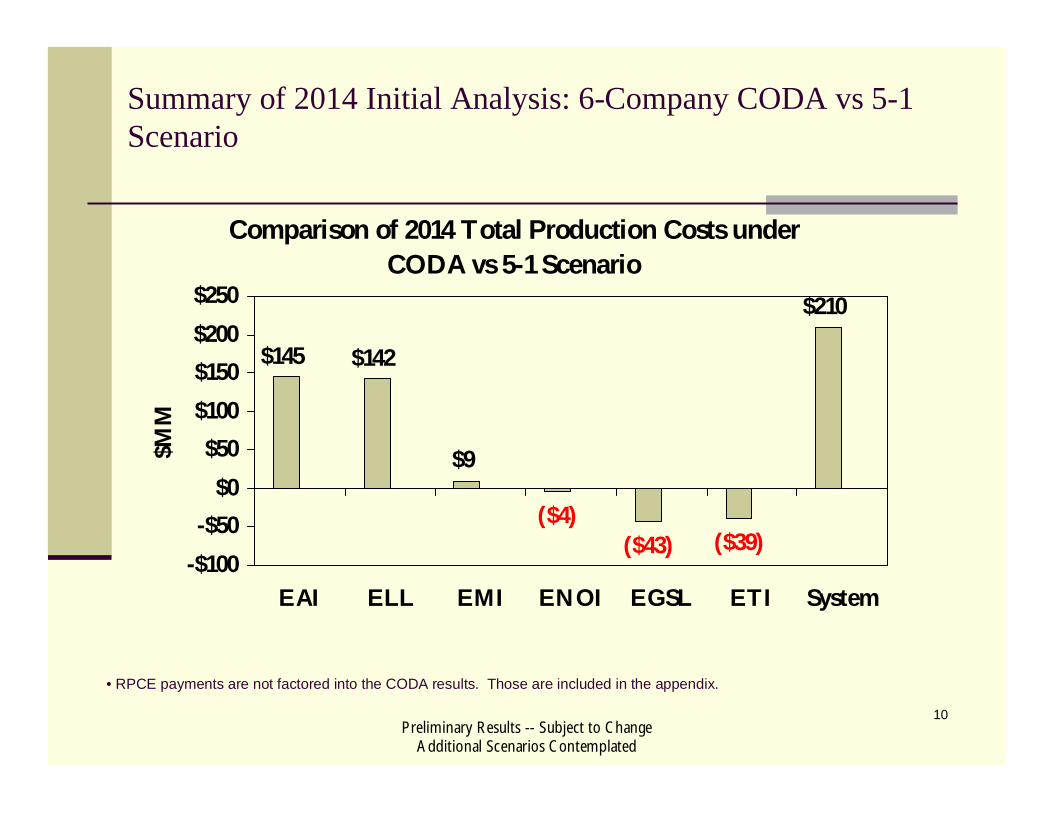
Summary of 2014 Initial Analysis: 6-Company CODA vs 5-1Scenario
Comparison of 2014 Total Production Costs underCODA vs 5-1 Scenario
($4)($43) ($39)
$9
$142$145
$210
-$100
-$50$0
$50
$100
$150
$200
$250
EAI ELL EMI ENOI EGSL ETI System
$MM
• RPCE payments are not factored into the CODA results. Those are included in the appendix.

Preliminary Results -- Subject to ChangeAdditional Scenarios Contemplated
11
Breakdown of 2014 Production Cost Savings by Fueland Non-Fuel under CODA vs 5-1 Scenario
-$100
-$50
$0
$50
$100
$150
EAI ELL EMI ENOI EGSL ETI System
$MM
Fuel & Purch Pwr Non-Fuel
For 2014, the 6-Company CODA produces both fuel and non-fuel savings for the combined companies
• RPCE payments are not factored into the CODA results. Those are included in the appendix.

Preliminary Results -- Subject to ChangeAdditional Scenarios Contemplated
12
Discussion Framework
PRIVILEGED AND CONFIDENTIALAttorney Client Privileged CommunicationAttorney Work Product
Understandingthe Drivers
Understandingthe Drivers
2013 & 2014Initial Results2013 & 2014
Initial Results
IndividualOperatingCompany
Drivers
IndividualOperatingCompany
Drivers
Gas PriceSensitivitiesGas Price
Sensitivities

Preliminary Results -- Subject to ChangeAdditional Scenarios Contemplated
13
Summary of differences between EAI’s costs under CODAversus the 5-1 scenario in 2014
While the allocation of flexible energy costs is a large component of the change, thecapacity plan associated with EAI standalone operations is even more significant.
EAI
1,450
1,500
1,550
1,600
1,650
1,700
1,750
SA ProductionCost
Capacity Planand C&D
Differences
Flex CostAllocation
Differences
OtherDifferences
CODA ProductionCost
$MM

Preliminary Results -- Subject to ChangeAdditional Scenarios Contemplated
14
Summary of differences between ELL’s costs under CODAversus the 5-1 scenario in 2014
The largest impact relates to the allocation of flexible energy costs.
ELL
2,650
2,700
2,750
2,800
2,850
2,900
SA ProductionCost
Capacity Planand C&D
Differences
Flex CostAllocationDifferences
Other Differences CODA ProductionCost
$MM
Preliminary Results -- Subject to ChangeAdditional Scenarios Contemplated
15
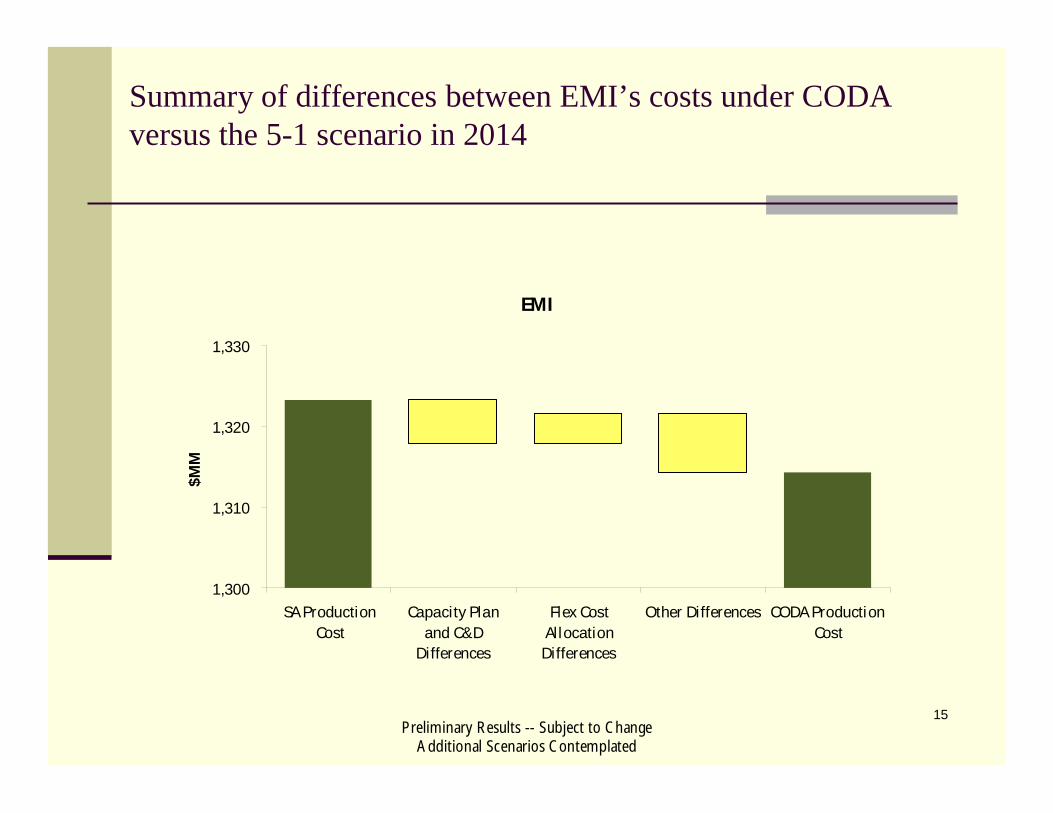
Summary of differences between EMI’s costs under CODAversus the 5-1 scenario in 2014
EMI
1,300
1,310
1,320
1,330
SA ProductionCost
Capacity Planand C&D
Differences
Flex CostAllocation
Differences
Other Differences CODA ProductionCost
$MM

Preliminary Results -- Subject to ChangeAdditional Scenarios Contemplated
16
Summary of differences between EGSL’s costs under CODAversus the 5-1 scenario in 2014
The largest impact relates to the allocation of flexible energy costs.
EGSL
1,740
1,760
1,780
1,800
1,820
1,840
1,860
SA ProductionCost
Capacity Plan andC&D Differences
Flex CostAllocation
Differences
Other Differences CODA ProductionCost
$MM
Preliminary Results -- Subject to ChangeAdditional Scenarios Contemplated
17
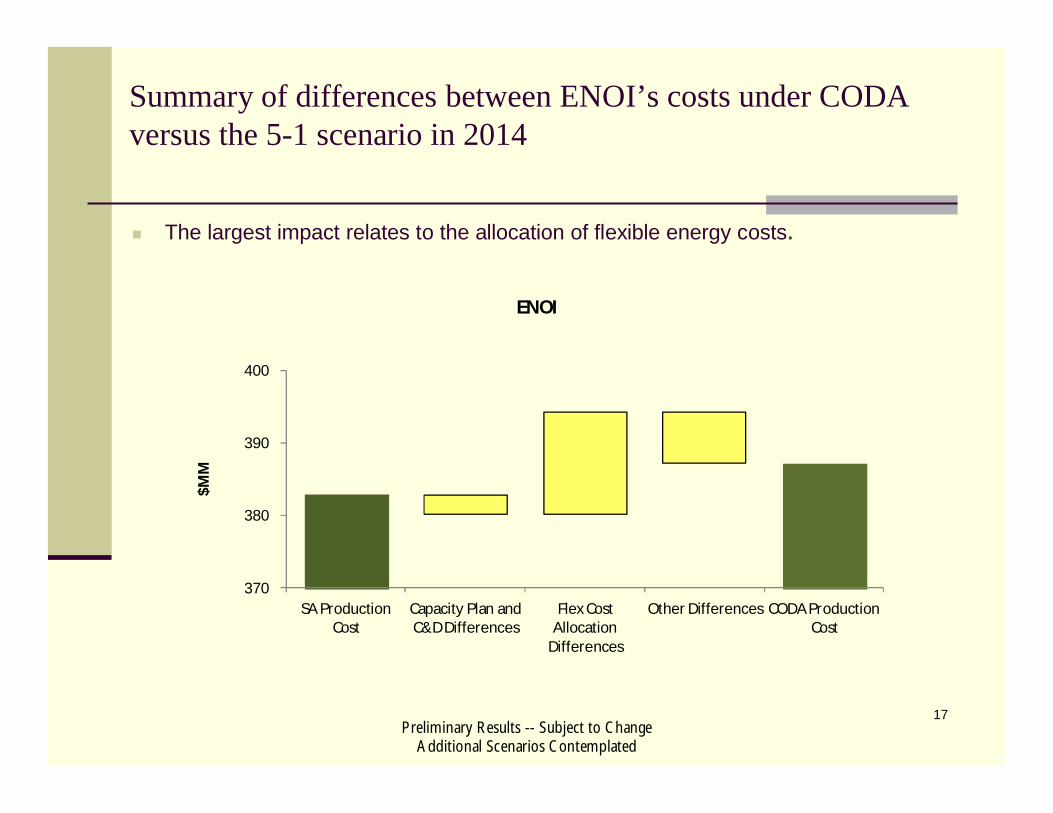
Summary of differences between ENOI’s costs under CODAversus the 5-1 scenario in 2014
The largest impact relates to the allocation of flexible energy costs.
370
380
390
400
SA ProductionCost
Capacity Plan andC&D Differences
Flex CostAllocation
Differences
Other Differences CODA ProductionCost
$MM
ENOI

Preliminary Results -- Subject to ChangeAdditional Scenarios Contemplated
18
Summary of differences between ETI’s costs under CODAversus the 5-1 scenario in 2014
The largest impact relates to the allocation of flexible energy costs.
ETI
1,670
1,680
1,690
1,700
1,710
1,720
1,730
1,740
1,750
1,760
SA ProductionCost
Capacity Planand C&D
Differences
Flex CostAllocation
Differences
Other Differences CODA ProductionCost
$MM
Preliminary Results -- Subject to ChangeAdditional Scenarios Contemplated
19
Discussion Framework
PRIVILEGED AND CONFIDENTIALAttorney Client Privileged CommunicationAttorney Work Product
Understandingthe Drivers
Understandingthe Drivers
2013 & 2014Initial Results2013 & 2014
Initial Results
IndividualOperatingCompany
Drivers
IndividualOperatingCompany
Drivers
Gas PriceSensitivitiesGas Price
Sensitivities

Preliminary Results -- Subject to ChangeAdditional Scenarios Contemplated
20
Key forecasts based on 2010 Business Plan
Low Reference High
Gas Price ($/MMBtu) $5.30 $7.37 $9.18
Market Price ($/MWh) $60 $71 $77
Preliminary Results -- Subject to ChangeAdditional Scenarios Contemplated
21
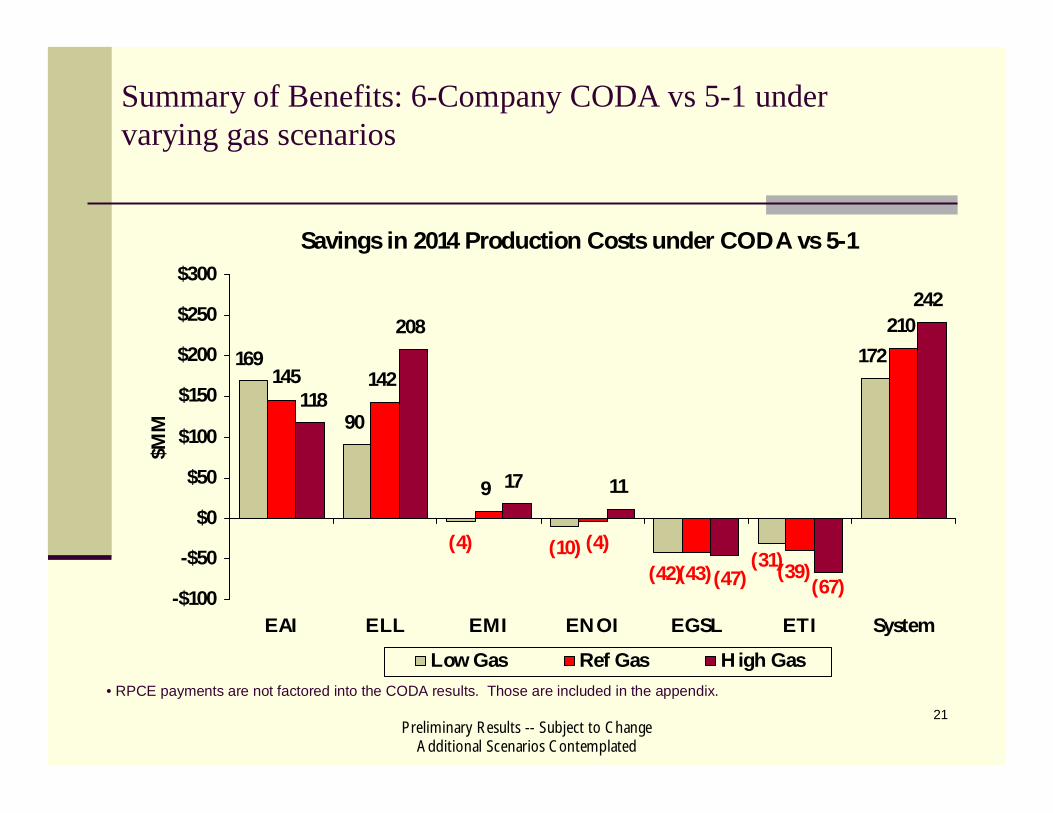
Summary of Benefits: 6-Company CODA vs 5-1 undervarying gas scenarios
Savings in 2014 Production Costs under CODA vs 5-1
90
(4) (10)
172142
9
210208
17 11
242
(42)(31)
169
(39)(43)(4)
145
(67)(47)
118
-$100
-$50
$0
$50
$100
$150
$200
$250
$300
EAI ELL EMI ENOI EGSL ETI System
$MM
Low Gas Ref Gas High Gas• RPCE payments are not factored into the CODA results. Those are included in the appendix.

Preliminary Results -- Subject to ChangeAdditional Scenarios Contemplated
22
Appendix
Preliminary Results -- Subject to ChangeAdditional Scenarios Contemplated
23
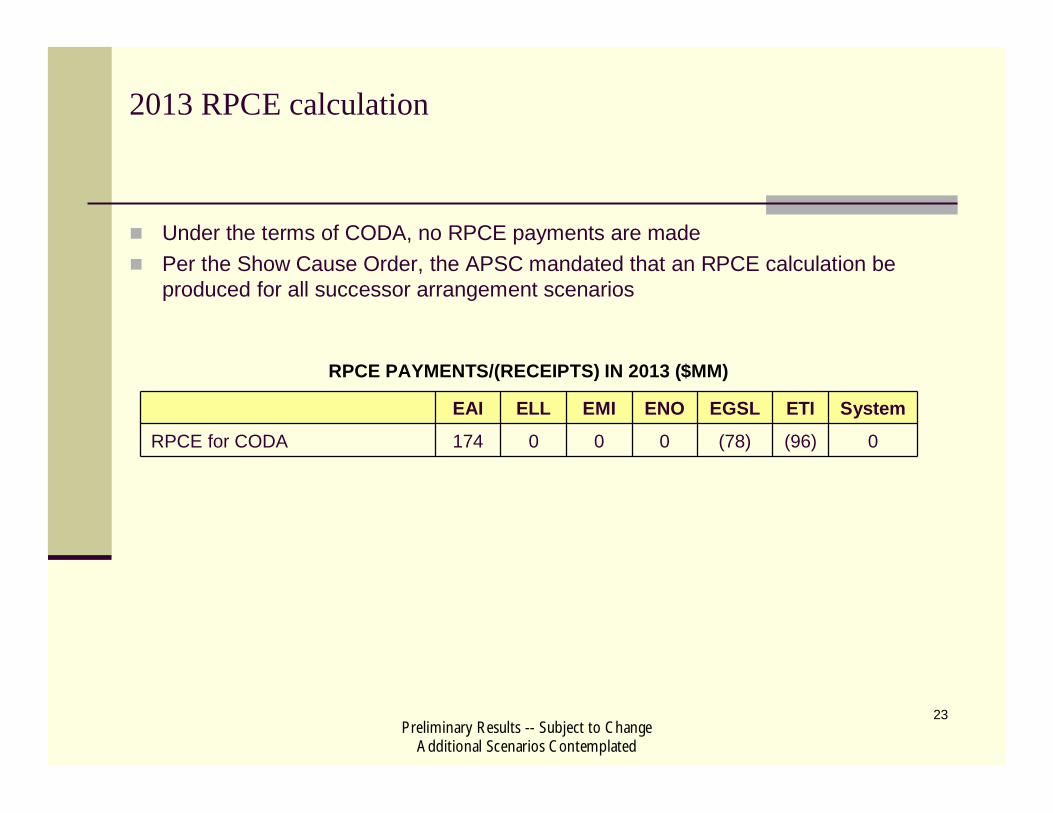
2013 RPCE calculation
RPCE PAYMENTS/(RECEIPTS) IN 2013 ($MM)
EAI ELL EMI ENO EGSL ETI System
RPCE for CODA 174 0 0 0 (78) (96) 0
Under the terms of CODA, no RPCE payments are madePer the Show Cause Order, the APSC mandated that an RPCE calculation beproduced for all successor arrangement scenarios

Preliminary Results -- Subject to ChangeAdditional Scenarios Contemplated
24
2014 RPCE calculation
RPCE PAYMENTS/(RECEIPTS) IN 2014 ($MM)
EAI ELL EMI ENO EGSL ETI System
RPCE for CODA 141 0 (1) 0 (54) (86) 0
Under the terms of CODA, no RPCE payments are madePer the Show Cause Order, the APSC mandated that an RPCE calculation beproduced for all successor arrangement scenarios

Preliminary Results -- Subject to ChangeAdditional Scenarios Contemplated
25
2014 RPCE calculation – Gas Price Scenarios
RPCE PAYMENTS/(RECEIPTS) UNDER GAS PRICE SCENARIOS ($MM)
EAI ELL EMI ENO EGSL ETI System
RPCE for CODA – Low Gas 15 0 0 0 0 (15) 0
RPCE for CODA – High Gas 227 0 (8) 0 (91) (128) 0