
Results of Icarus-9 Experiments Run at IMRA Europe · RESULTS OF ICARUS 9 EXPERIMENTS RUN AT IMRA...
8
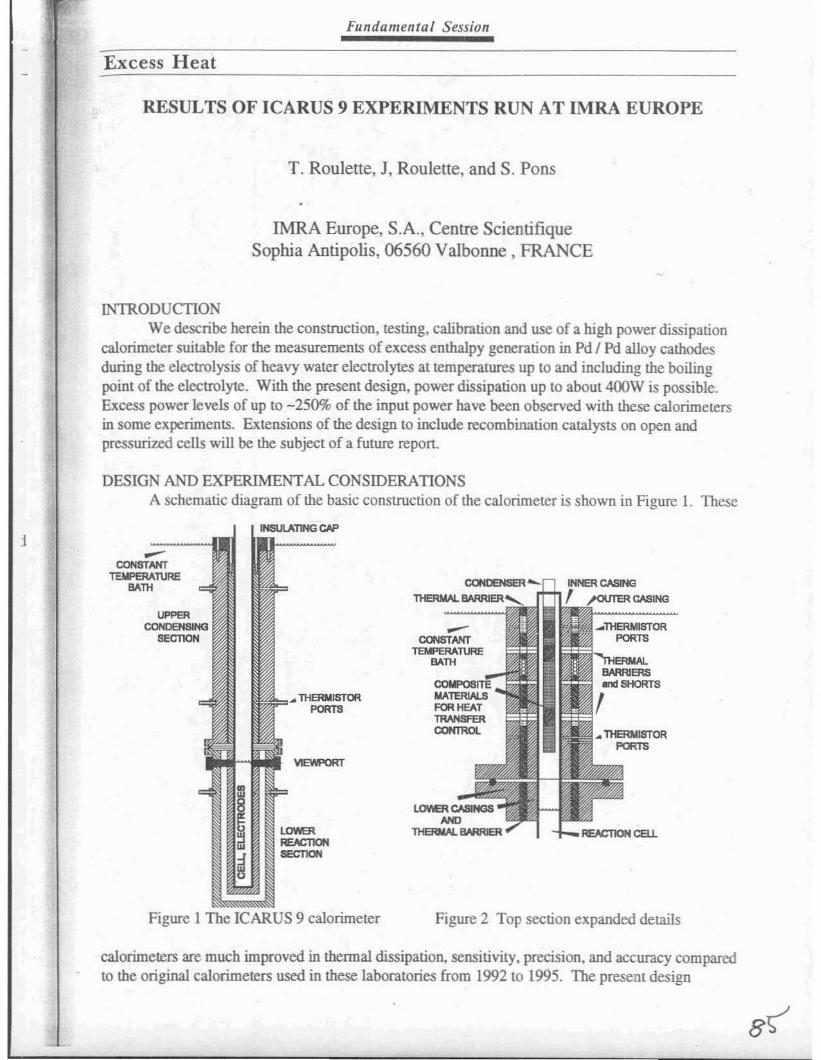
Fundamental Session Excess Heat RESULTS OF ICARUS 9 EXPERIMENTS RUN AT IMRA EUROPE T. Roulette, J, Roulette, and S. Pons IMRA Europe, S.A., Centre Scientifique Sophia Antipolis, 06560 Valbonne , FRANCE INTRODUCTION We describe herein Ihe construction, testing, calibration and use of a high power dissipation calorimeter suitable for the measurements of excess enthalpy generation in Pd I Pd alloy cathodes during the electrolysis of heavy water electrolytes at temperatures up to and including the boiling point of the electrolyte. With the present design, power dissipation up to about 400W is possible. Excess power levels of up to -250% of the input power have been observed with these calorimeters in some experiments. Extensions of the design to include recombination catalysts on open and pressurized cells will be the subject of a future repon. DESIGN AND EXPERIMENTAL CONSIDERAnONS A schematic diagram of the basic construction of the calorimeter is shown in Figure 1. These j -- CONSTAHT ruFEAA1\JRE BATH "" THERMISTOR PORTS \IIEWPORT Figure I The ICARUS 9 calorimeter Figure 2 Top section expanded details calorimeters are much improved in thermal dissipation, sensitivily, precision, and accuracy compared lO the original calorimeters used in these laboralories from 1992 LO 1995. The present design
Transcript of Results of Icarus-9 Experiments Run at IMRA Europe · RESULTS OF ICARUS 9 EXPERIMENTS RUN AT IMRA...
Fundamental Session
Excess Heat
RESULTS OF ICARUS 9 EXPERIMENTS RUN AT IMRA EUROPE
T. Roulette, J, Roulette, and S. Pons
IMRA Europe, S.A., Centre ScientifiqueSophia Antipolis, 06560 Valbonne , FRANCE
INTRODUCTIONWe describe herein Ihe construction, testing, calibration and use of a high power dissipation
calorimeter suitable for the measurements of excess enthalpy generation in Pd I Pd alloy cathodesduring the electrolysis of heavy water electrolytes at temperatures up to and including the boilingpoint of the electrolyte. With the present design, power dissipation up to about 400W is possible.Excess power levels of up to -250% of the input power have been observed with these calorimetersin some experiments. Extensions of the design to include recombination catalysts on open andpressurized cells will be the subject of a future repon.
DESIGN AND EXPERIMENTAL CONSIDERAnONSA schematic diagram of the basic construction of the calorimeter is shown in Figure 1. These
j -CONSTAHTruFEAA1\JRE
BATH
"" THERMISTORPORTS
\IIEWPORT
Figure I The ICARUS 9 calorimeter Figure 2 Top section expanded details
calorimeters are much improved in thermal dissipation, sensitivily, precision, and accuracy comparedlO the original calorimeters used in these laboralories from 1992 LO 1995. The present design
Fundamental Session
Excess Heat
incorporates better seals at all liquid I casing interfaces. and at the thermistor inlet ports. The viewingports are also more robust and clear. The heat transfer characteristics can now be easily be modifiedat various vertical positions in the inner casing. the inner insulator, and the internal condenser to givemore controllable overlap between the various sensitivity zones, Figure 2. The resulting heal transfercharacteristics are now more linear in the radial direction than in previous designs. Foam rise in thecalorimeter at the boiling-temperature bas been minimized.
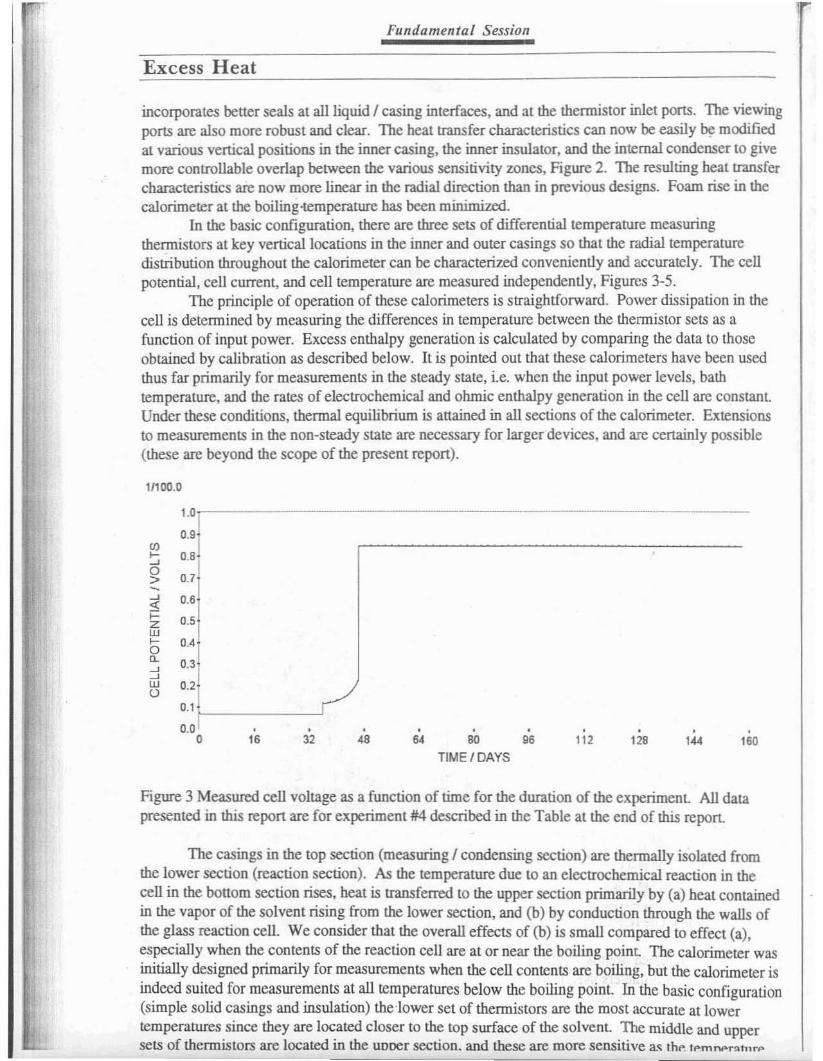
[0 the basic configuration. there are three sets of differential temperature measuringthermistors at key vertical locations in the inner and outer casings so that the radial temperaturedistribution throughout the calorimeter can be characterized conveniently and accurately_ The cellpotential, cell current, and cell temperature are measured independently. Figures 3-5.
The principle of operation of these calorimeters is straightforward. Power dissipation in thecell is determined by measuring the differences in temperature between the thermistor selS as afunction of input power. Excess enthalpy generation is calculated by comparing the data to thoseobtained by calibration as described below. It is pointed out that these calorimeters have been usedthus far primarily for measuremenlS in the steady state, i.e. when the input power levels, bathtemperature, and the rates of electrochemical and ohmic enthalpy generation in the cell are constant.Under these conditions, thennal equilibrium is attained in all sections of the calorimeter. Extensionsto measurements in the non-steady state are necessary for larger devices. and are certainly possible(these are beyond the scope of the present repen).
1/100.0
1.01
0.9'00.... 0.8~
00.7>-~ 0.6,;;....0.'z
w.... 0.40"- 0.3~~
w 0.2()
0.'
0.00
.16 32
.48
. . .64 80 96
TIME/DAYS
.112
.,,. .144
.160
Figure 3 Measured cell voltage as a function of time for the duration of the experiment. All datapresented in this report are for experiment #4 described in the Table at the end of this report.
The casings in the top section (measuring I condensing section) are thennally isolated fromthe lower section (reaction section). ~ the temperature due to an electrochemical reaction in thecell in the bottom section rises, heat is transferred to the upper section primarily by (a) heat containedin the vapor of the solvent rising from the lower section, and (b) by conduction through the walls ofthe glass reaction cell. We consider that the overall effects of (b) is small compared to effect (a),especially when the contenlS of the reaction cell are at or near the boiling point The calorimeter wasinitially designed primarily for measurements when the cell contents are boiling, but the calorimeter isindeed suited for measurements at all temperatures below the boiling point. In the basic configuration(simple solid casings and insulation) the· lower set of thennistors are the most accurate at lowertemperatures since they are located closer to the lap surface of the solvent. The middle and uppersets of thermistors are located in the uoocr section. and these are more sensitive ao;. the:. IpmnPr~hlrp
I c
Fundamental Session
Excess Heat
ng rises towards boiling.d
c,1.0'
..._-0.9-
"'w0.8jO'
w"-
07j"'" 0.6>-z 0.'wO' o4~O'=>u 0.3i-'-' 0.2
1wu
0"1, . .0.0 .
0 16 32 48 64 60 96 112 126 ,.... 16ll
TIME/DAYS
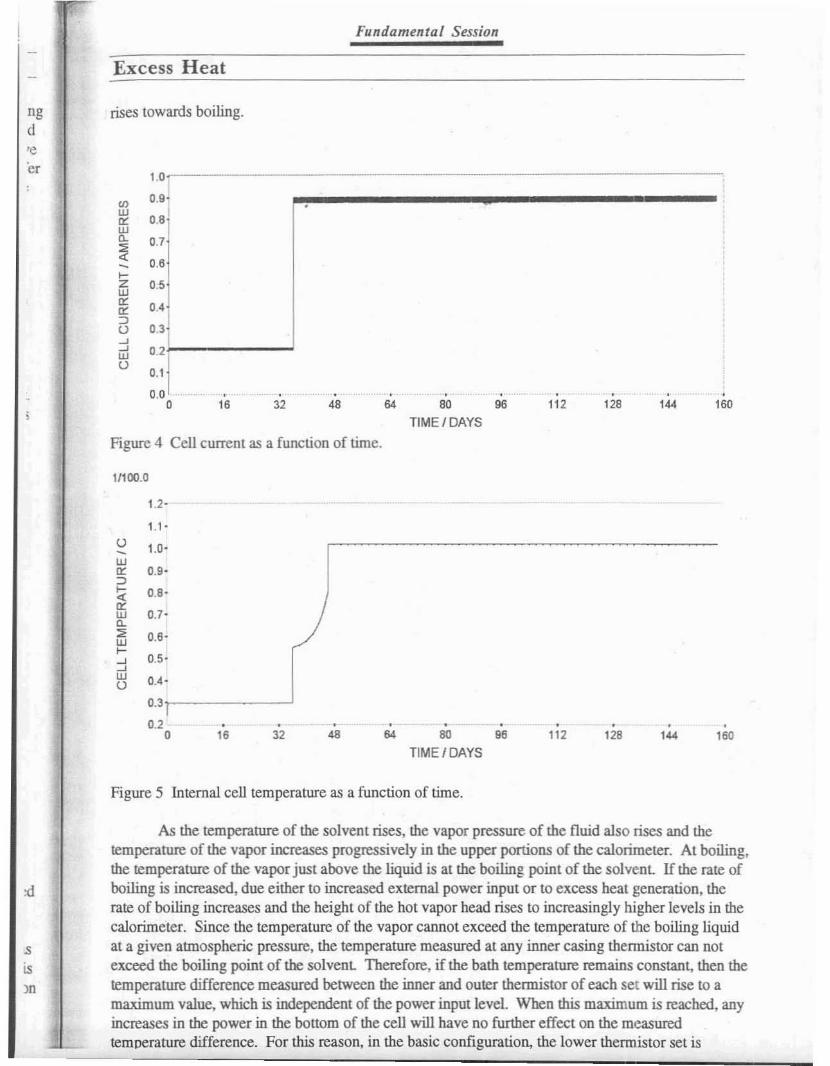
Figure 4 Cell current as a function of time.
1/100.0
1.2-
1.1 -
U- 1.0-wO' 0.9-=>:;: O.s-O'
0.7-w"-
" 0.6-w>--' 0.5--'w 004-U
031
0.2 . . . . . . . . .0 16 32 48 64 80 96 112 128 1.... 160
TIME/ DAYS
Figure 5 mtemal cell temperature as a function of time.
:d
•is'0
As the temperature of the solvent rises, the vapor pressure of the fluid also rises and thetemperature of the vapor increases progressively in the upper portions of the calorimeter. At boiling,the temperature of the vapo' just above the liquid is at the boiling point of the solvent U the rate ofboiling is increased, due either to increased external power input or to excess heat generation, therate of boiling increases and the height of the hOl vapor head rises to increasingly higher levels in thecalorimeter. Since the temperature of the vapor cannot exceed the temperature of the boiling liquidat a given atmospheric pressure, the temperature measured at any inner casing thermistor can notexceed the boiling point of the solvenL Therefore, if the bath temperature remains constant, then thetemperature difference measured between the inner and outer thermistor of each set will rise to amaximum value, which is independent of the power input leveL When this maximum is reached, anyincreases in the power in the bonom of the cell will have no further effect on the measured
'!L.... te_m~oe_ra_t_u_re_d_if_'_e_'e_"_c_e_. _F_O_'_tllls_'_re_a_S_O_",_i_"_th_e_b_as_ic_co_of_,g_u_ra_ll_'O_"_,_th_e_lo_w_e_'_th_e_lffi_is_t_o_'_se_t_is _

Fundamental Session
Excess Heat
sensitive only at low temperatures (up to about 30 watts of power dissipation in the reaction cell). Athigher powers, there is no further changes in the temperature difference at this lower set ofthermistors. The middle set of thermistors then become more sensitive, and at very high powerdissipation rates, the upper set of thermistors become more sensitive. In other configurations, it ispossible to modify the sensitivity of each thermistor set by changing the materials and construction ofthe internal condenser plug ancVor the inner casing, as well as placing annular ring insulators atvarious heights of the inner casing, andlor thermal shorting devices between the inner and outersection casings. Finally, similar enhancements are obtained by changing the materials in, and thegeometry of the insulating barrier between the inner and outer casings, Figure 2.
Due to these operating characteristics, it will be noticed in some of the figures that there arehigh or low calculated rates of excess enthalpy generation at very low power inputs, especially at themiddle and upper thennistor sets. These data must be ignored since they are due to the systematicerrors described further below.
The calorimeter.; are calibrated by several methods, including (a) the electrolysis of (i) lightwater or (ii) heavy water using Pt cathodes, and (b) encapsulated and open platinum resistor heaters.At thermal equilibrium, the input power and the temperature differences at each set of thermistors ismeasured over a long time period. The procedure for calibration calls for the application of fixedinput powers to the cell for approximately 12 bours. The time constant of the calorimeter isconsiderably less than this time period, so one obtains a large number of steady state calibrationpoints from which a good statistical average value can be obtained. Gaussian statistics are used todetermine histograms and probability functions on each set of input power and temperature differencedata sets for each point and for eacb thermistor set Non-steady state values at short times after theinput power is changed are rejected on the basis of their contribution to the known determinate error(the non-steady state). Rejection of data is continued (up to about 10% of the entire data set) until azero slope linear fit is found for the temperature difference as a function of input power. Theintercept of this line then gives the "best" temperature difference value. Confidence limits andprediction limits are then determined for each set of data. Inflection points for the confidence andprediction curves are then determined, which gives a "best" value of the input power. Gaussianhistograms and cumulative curves are additionally determined, from which the "best" mean value ofboth the temperature difference values and the input power values. If these are in agreement with thevalues determined by the previous method, then they are accepted. If not, they are rejected and themeasurements are repeated. Generally, calibrations are always very reliable at power inputs aboveabout 3W. When the calorimeter is serviced after each experiment, the calibration curves arecarefully checked by re-calibration at several input powers to assure that the calibrations have notchanged during the prior operating or servicing period.
Following this procedure, calibrations curves are constructed over the entire input powerrange of the calorimeter for each of the thennistor sets. For simplicity in on-line data monitoring,best fit curves are calculated by linear and non-linear regression analysis over various sections of thecalibration data. We use a variety of basis trial models such as Soltzman, multiple exponential,sigmoidal Gompenz, sigmoidal logistical, Weibull, Richards, and Hill functions. The calibrationcurves shown in this report were obtained from such composite best fit curves through all of theexperimental calibration power I temperature data, and then plotted at integer values of the inputpower. Segments to these curves are almost always added to these curves for very low values (<23W) of input power since the error between the actual values and fitted curves were about 5%.
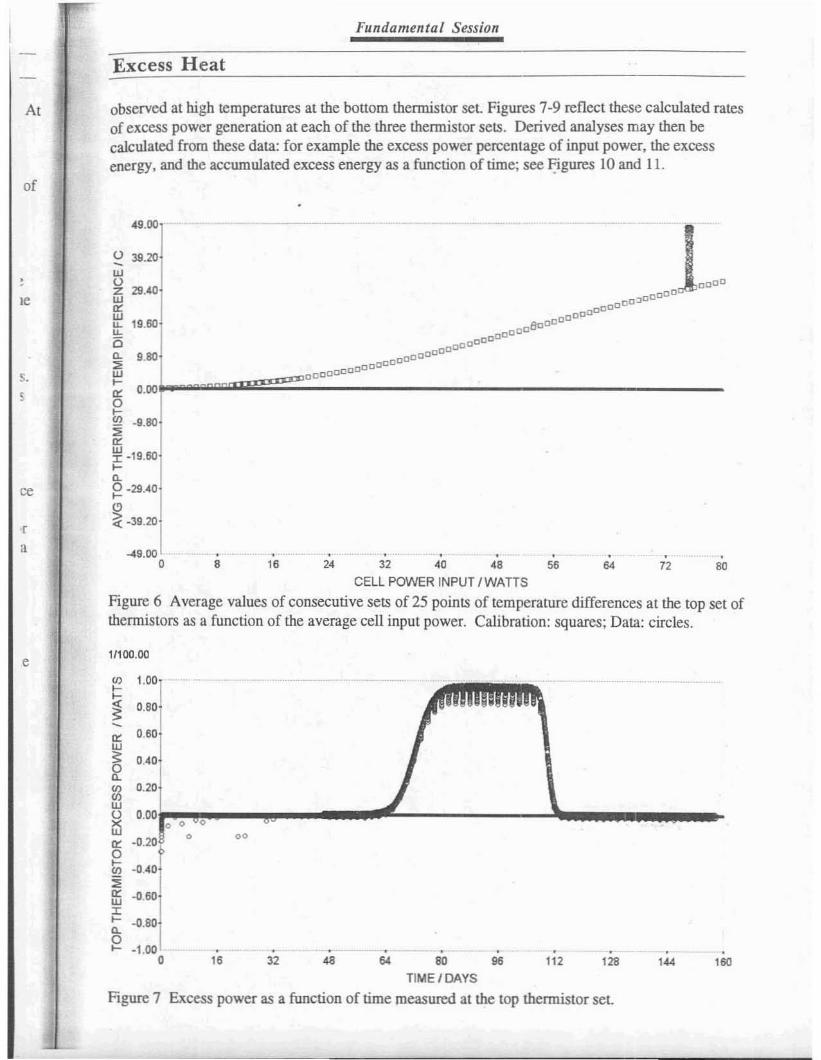
During an experiment, measurements identical to those used in the calibration method aremade, and the temperature differences between the three sets of thermistors are compared with thoseof the blanks, at the same input power level, see. for example, Figure 6. If there are any excessenthalpy effects, then the data points will fall above the input power - thermistor differencetemperature calibration lines. lbe horizontal distance from a high data point to the calibration line tothe riJlht Jlives the value of the excess enthalpy generation rate. Excess enthalnv effprl<: ,.~ ... "". """
Fundamental Session
Excess Heat
observed at high temperatures at the bottom thennistor set. Figures 7·9 reflect these calculated fatesof excess power generation at each of the three thermistor sets. Derived analyses may then becalculated from these data: for example the excess power percentage of input power, the excessenergy. and the accumulated excess energy as a function oftime; see I:igures 10 and 11.
.80
.7264
."24
,,.•....9.00o
49001 1~ 3920
1aaaa
Wz 29.40 0000
ooJO0::: 0000W 000u. 19.60 0000u. OOBD
0- 000000
0 000n. 9 80 aaaa
. 0 00~ ooocoW I"_",,",,,,,,r;e~~~a~a~a:a:aa:a:a _~ 0.00'
~- -9.80
"0:WI·HI.60....n.8 -29.40
'"~ -39.20
, ,32 40 48
CELL POWER INPUT I WATTS
Figure 6 Average values of consecutive sets of 25 points of temperature differences at the lOp set ofthermistors as a function of the average cell input power. Calibration: squares; Data: circles.
of
a
co
Al
,r
s.,
e 11100.00
CI} 1.00
~ 0.80-
'50.''''129112.s
.6432
00
.16
0.20
0.40
o.oo""",:~_~ .-----...Ii _r;; 0 0
o-0.20
•0.801-1.00
o
0
0.4°1-0.60
et:: 0.60
~~~0:
8"':;0:W:I:....n.8
80
TIME I DAYS
Figure 7 Excess power as a function of time Jl1easured at the lOp thennistor set.
Fundamental Session
Excess Heat
1/100.00
.160
,,..,128
,112
,96
.64
.48
.32
,
",
80
TIME/DAYS
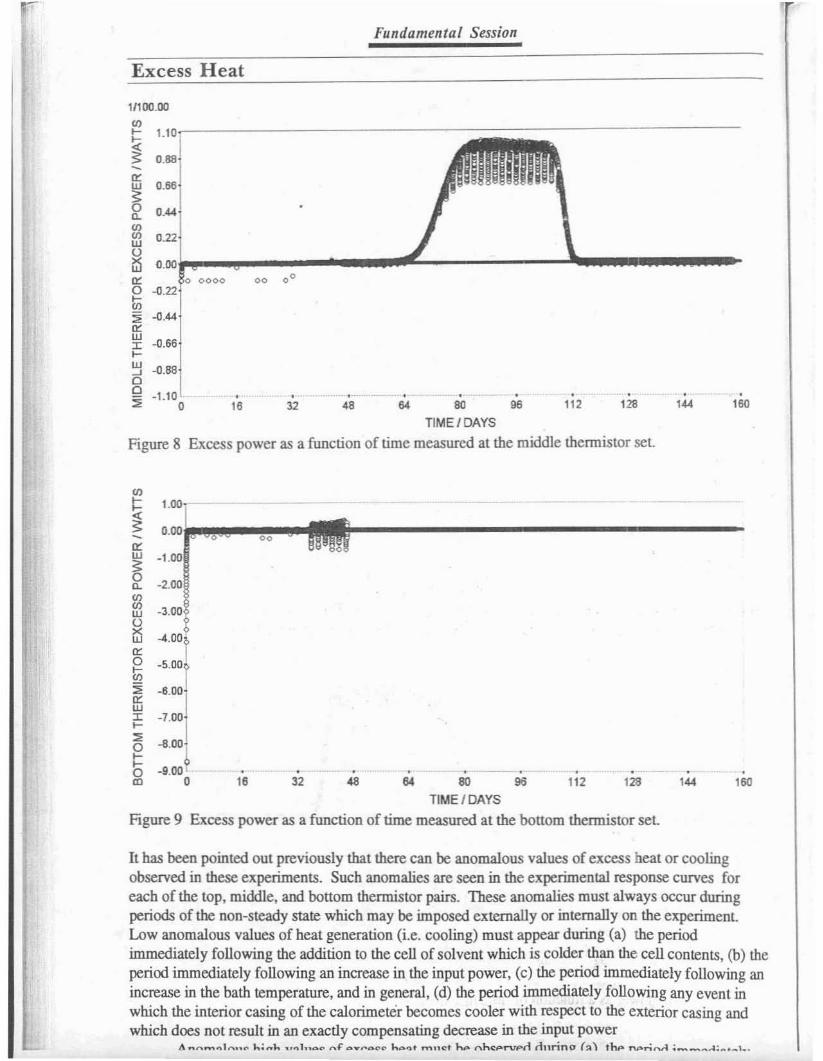
Excess power as a function of time measured at the middle thennistor set.
1.10
0.88
0."
0."
0.22
0.00o 0000
...{I.22
-0."
-0.88
·1.10 .o
"'........~-0:
~::lw
~0:ot;
"0:W~ ...{I.56....w5o
"Figure 8
.160'44
,128
.112
.96
.48
,32
,
"
1.00
0.0000
-1.00
-2.00
-3.00
-4.00
.5.00
80
TIME/DAYS
Figure 9 Excess power as a function of time measured at the bottom thennistor sel
It has been pointed out previously that there can be anomalous values of excess heat or coolingobserved in these experiments. Such anomalies are seen in the experimental response curves foreach of the top, middle, and bottom thennistor pairs. These anomalies must always occur duringperiods of the non-steady state which may be imposed externally or internally on the experiment.Low anomalous values of heat generation <i.e. cooling) mnst appear during <a) the periodimmediately following the addition to the cell of solvent which is colder than the cell contents, (b) theperiod immediately following an increase in the input power, (c) the period immediately following anincrease in the bath temperature, and in general, (d) the period immediately following any evenl inwhich the interior casing of the calorimeter becomes cooler with respect to the exterior casing andwhich does not result in an exactly compensating decrease in the input power
A I l..; .. l.. 1 ~ 1' 1-.",,, ' •.,1 1-.e;,Prvffl rinnno (::.) thl" n". ..1 : ri: ••_I•.

Fundamental Session
Excess Heat
.'50144
.".1129664.
4ll32
oo
.16
o
o
o
o-0.
6°i.0.80
_1.00o so
TIME/DAYS
Figure 10 Excess power percentage of input power as a function of time: top thermistor set.
following the addition to the cell of solvent which is wanner than the cell contents. (b) the periodimmediately following an decrease of the power input to the cell, (c) the period immediately111000.00
~ ,001 -~ 0.80"1
ir~ 0.
601
! 0.4°1
Q.~ 0.2011.••IJ!I.....-----....I11!:~-----....:: ...--------0.00,~w 0 00
·0.20
~0:: -DADo!i1"'"W:I:....Q.
o....
..-···-----~................-iiiiiiiiOiiiii---__·-
.'50
.'44
.''''112
~::lQ 320.00,---------_·-----
<3~ 256.00->-C) 192.00
'"wZ~ 128.0°1
~ 64.0°1o 0.00'+- ,, _
~:J -64.00
"::l~ .128.001
~ .,92.001
~ -258.001I -320.00 .•~ 0 Hi 32 48 64 80 96
~ TIME/O~S
Figure 11 Accumulated excess energy as a function of time: top thermistor set
e
following a decrease in the bath temperature, (d) the period immediately following the onset of anyexcess enthalpy generation in the cell. and in general, (e) the period immediately following any event
Fundamental Session
Excess Heat
in which the interior casing of the calorimeter becomes wanner with respect to the exterior casingand which does not result in an exacl.1y compensating increase in the input power.
Each of the perturbations listed in the last paragraph are non-equilibrium effects. Attentinntherefore is nonnally focused only to those data which are recorded when the cell is known to be atthennal equilibrium, i.e. at the majority of the data points in the experiments reported here.
One is also cognizant of the fact that non-equilibrium effects may also be imposed by ambientconditions of the laboratory environment on the components of the cell which pass from thecalorimeter into the ambient air, such as cables and leads. the glass lead tubes, the plastic plugs, andthe plastic condenser. Conduction effects can certainly affect the stability of the measurements. Forthis reason, the fluctuation of the air temperatW'e in the laboratory is always maintained to +/O.15°C, and within +/- O.5°C of the bath temperature. The fluctuations are therefore reduced tonegligible values, and there are observable fluctuations of +/- O.05°C only at very low power inputsand at the tnp thermistor only.
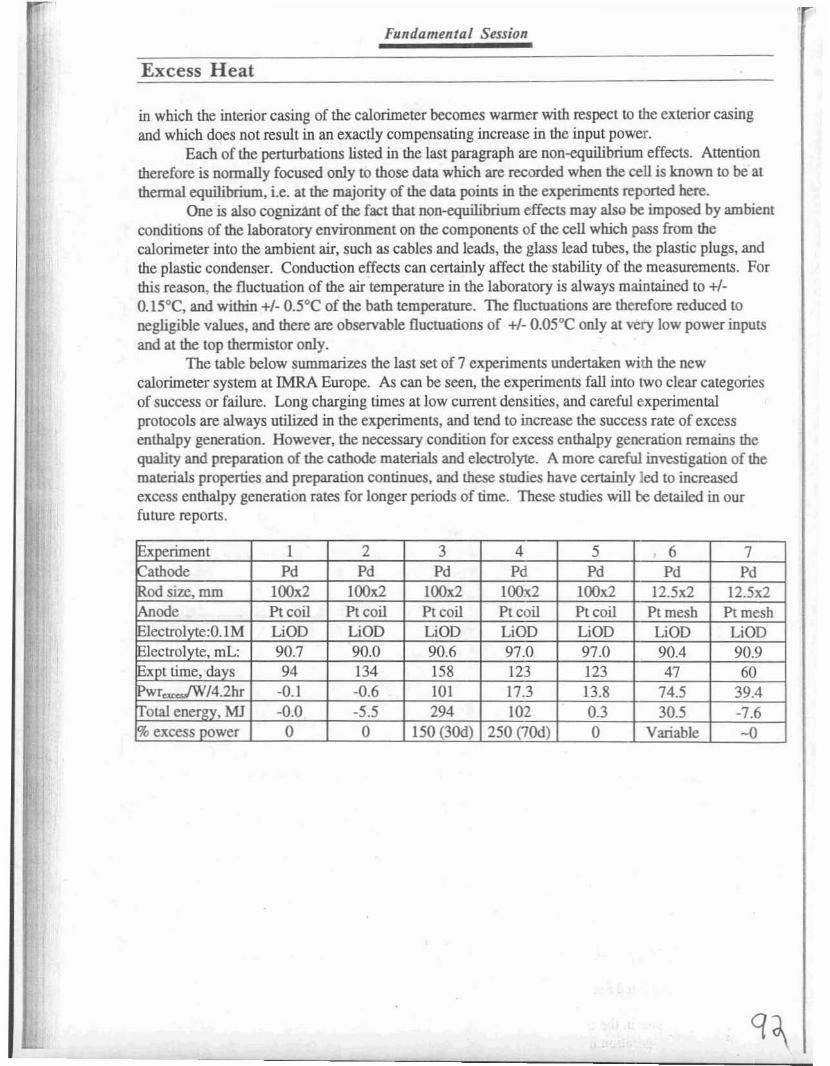
The table below summarizes the last set of 7 experiments undenaken with the newcalorimeter system at IMRA Europe. As can be seen, the experiments fall into two clear categoriesof success or failure. Long charging times at low current densities, and careful experimentalprotocols are always utilized in the experiments, and tend to increase the success rate of excessenthalpy generation. However, the necessary condition for excess enthalpy generation remains thequality and preparation of the cathode materials and electrolyte. A more careful investigation of thematerials properties and preparation continues, and these studies have certainly led to increasedexcess enthalpy generation rates for longer periods of time. These studies will be detailed in ourfuture reports.
IExperiment 1 2 3 4 5 , 6 7leathode Pd Pd Pd Pd Pd Pd Pd!Rod size, rom lOOx2 lOOx2 l00x2 l00x2 100x2 12.5x2 12.5x2
~ode PI cnil Pt coil Ptcoil Ptcoil PI cnil Pt mesh Pt meshlectrolvte:0.1M LiOD LiOD LiOD LiOD LiOD LiOD LiOD
IElectrolyte, mL: 90.7 90.0 90.6 97.0 97.0 90.4 90.9IExnt time, days 94 134 158 123 123 47 60l'wr...,../W/4.2hr -0.1 -0.6 101 17.3 13.8 74.5 39.4
otal energy, MJ -0.0 -5.5 294 102 0.3 30.5 -7.61% excess DOwer 0 0 150 (3Od) 250 (7Od) 0 Variable -0