RESULTS - INFLIBNET
57
CHAPTER 4 RESULTS
Transcript of RESULTS - INFLIBNET

CHAPTER 4
RESULTS
During de-etiolation it appears that both blue light absorbing photoreceptor
and phytochromes are involved in the regulation of phototropism (Liscum and
Stowe-Evans, 2000). At present we have relatively little physiological
information on phytochrome involvement in phototropism in part because the
blue/UV-A photoreceptor assumes much greater importance in this response
(Liscum and Briggs, 1995; Huala et al., 1997). There appears to be interactions
between these photoreceptor systems as well, but the nature of it has not yet
been fully elucidated (Liu and lino, 1996; Janoudi et al., 1997). Aside from
this, one or more signal response chains are likely required between a
photoreceptor and its final effect on the response, however, the pathways of
which are also partially known (Parks et al., 1996; Janoudi et al., 1997).
Furthermore, some sort of amplification system seems necessary to account for
the response and rather little is known about the mechanisms involved in the
phototropic response.
The most extensive photobiological studies on phototropism have been
carried out with eitolated seedlings (lino, 1990). The phytochrome responses,
which offer a well-characterized photoreceptor system and the blue light
photoreceptor are often more prominent in etiolated material. Even such an
apparently simple system of phototropic bending exhibits a great diversity of
responses. These responses can differ with respect to light requirement, time
course, and induction kinetics. However, most of our knowledge of
phototropism in higher plants has come from experiments on coleoptiles of
monocot seedlings, particularly those of Avena sativa and Zea mays (lino,
1990) and in recent years on hypocotyls of dicot plant Arabidopsis thaliana
(Liscum and Briggs, 1995). These coleoptiles or hypocotyls have the
advantages for studies of phototropism for anatomical simplicity, uniformity
57
and rapidity of growth, high phototropic sensitivity, and fast response to
phototropic stimuli. Nevertheless, the detailed studies of phototropism in other
higher plants would also be useful to extend to other genera before
generalizations can be made about light perception and transduction, and the
relation of these to the eventual response.
Tomato is an ideal system for examining light regulation of phototropism
since it has been extensively used in the study of photomorphogenesis
(Kendrick et al., 1997). This particular species is known to respond to both
light absorption by phytochrome and blue/UV-A photoreceptor. The
phytochrome gene family has been characterized and to date five phytochrome
genes have been identified: PHYA, PHYB1, PHYB2, PHYE and PHYF
(Hauser et al., 1995). However, there is little information available on the
characteristics of blue/UV-A light photoreceptor (s) in tomato seedlings. Thus,
putative mutants for blue light photoreceptor can be isolated in tomato as it is a
diploid and an ideal system for classical genetic studies and can be cultured
easily under wide range of environmental conditions.
In this study, for the above mentioned reasons tomato was chosen as an
experimental material to characterize phototropism. Phototropism has not yet
been studied in detail in tomato, therefore, in the first part of the study basic
physiological data on the phototropism of tomato hypocotyls was obtained.
Additionally we have used another approach to understand how photoreceptors
interact in phototropism by studying the response of mutants that are altered in
their response to one or more of these factors. This approach further helps to
define components involved in a complex response and for studying the signal
transduction pathways that link an activated photoreceptor with a response. To
58

this end, two sort of photo-responsive mutants were examined: phytochrome
deficient mutants with altered photomorphogenic responses viz., the
chromophore deficient au, the phyA deficient fri, the phyBl deficient tri and
the tri fri mutants. The second type of response mutant examined, hp-J, shows
opposite phenotype exhibiting exaggerated photomorphogenic responses to
light and its interaction in au,hp-l and fri,hp-1 mutants was assessed to clarify
the role of hp-1 in phototropic response. Furthermore, another approach to
study phototropic sensory transduction involves isolation of mutants with an
altered sensitivity to light. A screening technique for mutants that would
exhibit no phototropism in constant light was developed. A genetic and
physiological characterization of two such mutants, which have been isolated,
is presented here.
4.1 PHOTOTROPISM IN TOMATO
As a preliminary to studies of light induced changes in phototropic
response, we tested the effect of unilateral blue light and red light and
determined the time course of response induced in tomato seedlings. The dark-
grown seedlings were subjected to continuous unilateral blue light (450nm) for
120 min. The course of phototropic curvature induced during the 120-min
measurement period is presented in Fig. 4.1. The phototropic curvature is
manifested after a lag time of about 30-45 min from the onset of illumination
and the initiation of the response. Thereafter, the curvature increased to about
64° from the vertical, theoretically roughly parallel to the direction of the light
stimulus for the next 90 min. However, the curvatures began to decrease
during the final assay period, as is typical when there was self-adjustment of
response to light. On the contrary, seedlings irradiated with unilateral red light
displayed no curvature (Fig. 4.1). Thus, blue light elicited maximal bending
59
Figure 4.1. Time course of phototropic curvature (degrees) of tomato hypocotyls to
unilateral blue (0.1 (imole m': s'1) or red light (0.3 |amole m'2 s"'). Seedling
curvature was determined at the time points indicated. The data point
represent mean value ±S.E of three independent experiments using 10 dark-
grown seedlings per set.
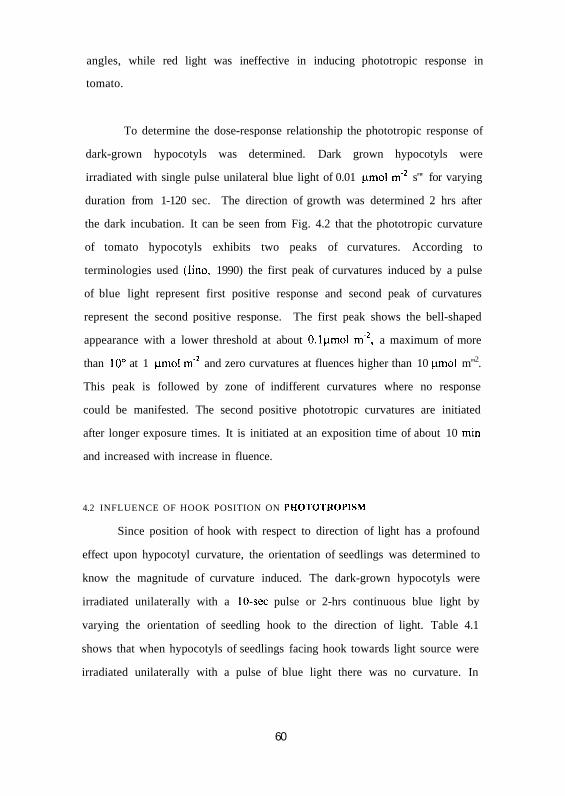
angles, while red light was ineffective in inducing phototropic response in
tomato.
To determine the dose-response relationship the phototropic response of
dark-grown hypocotyls was determined. Dark grown hypocotyls were
irradiated with single pulse unilateral blue light of 0.01 (imol m"2 s"' for varying
duration from 1-120 sec. The direction of growth was determined 2 hrs after
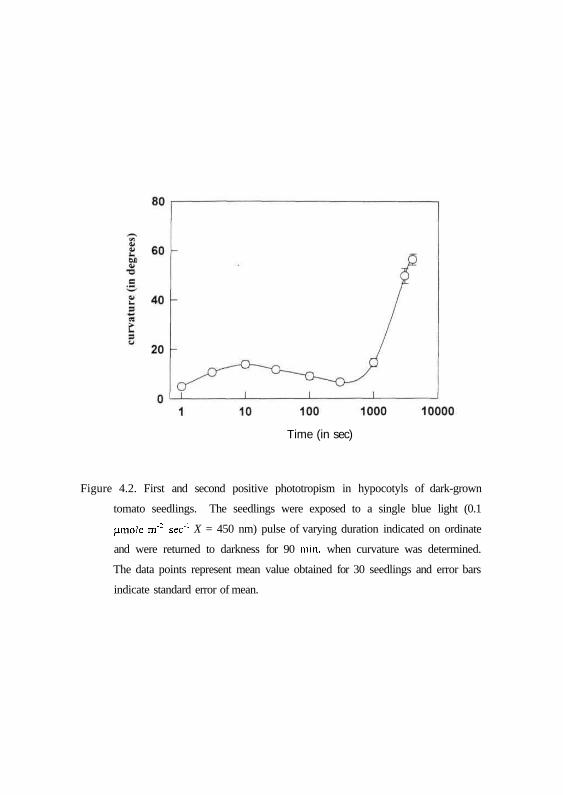
the dark incubation. It can be seen from Fig. 4.2 that the phototropic curvature
of tomato hypocotyls exhibits two peaks of curvatures. According to
terminologies used (lino, 1990) the first peak of curvatures induced by a pulse
of blue light represent first positive response and second peak of curvatures
represent the second positive response. The first peak shows the bell-shaped
appearance with a lower threshold at about 0.1|amol m"2, a maximum of more
than 10° at 1 |j.mol m"2 and zero curvatures at fluences higher than 10 jamol m"2.
This peak is followed by zone of indifferent curvatures where no response
could be manifested. The second positive phototropic curvatures are initiated
after longer exposure times. It is initiated at an exposition time of about 10 min
and increased with increase in fluence.
4.2 INFLUENCE OF HOOK POSITION ON PHOTOTROPISM
Since position of hook with respect to direction of light has a profound
effect upon hypocotyl curvature, the orientation of seedlings was determined to
know the magnitude of curvature induced. The dark-grown hypocotyls were
irradiated unilaterally with a 10-sec pulse or 2-hrs continuous blue light by
varying the orientation of seedling hook to the direction of light. Table 4.1
shows that when hypocotyls of seedlings facing hook towards light source were
irradiated unilaterally with a pulse of blue light there was no curvature. In
60
Time (in sec)
Figure 4.2. First and second positive phototropism in hypocotyls of dark-grown
tomato seedlings. The seedlings were exposed to a single blue light (0.1
(imole m"2 sec1 X = 450 nm) pulse of varying duration indicated on ordinate
and were returned to darkness for 90 min, when curvature was determined.
The data points represent mean value obtained for 30 seedlings and error bars
indicate standard error of mean.

Table 4.1. Influence of hook position and cotyledons on the phototropic
response of tomato seedlings. The average maximum curvature was
determined for 30 seedlings per treatment after phototropic stimulation for 10
sec or 2-hrs unilateral blue light. Variation is expressed as mean ± S.E
Responsetype
First positive
Second positive
Influence of hook
Hook away fromdirection of light
14.3° (±1.1)
88.3° (±3.0)
Hook in thedirection of light
1.0° (±0.4)
58.0° (±2.9)
Influence ofcotyledons
12.3° (±1.3)
59.4° (±2.4)
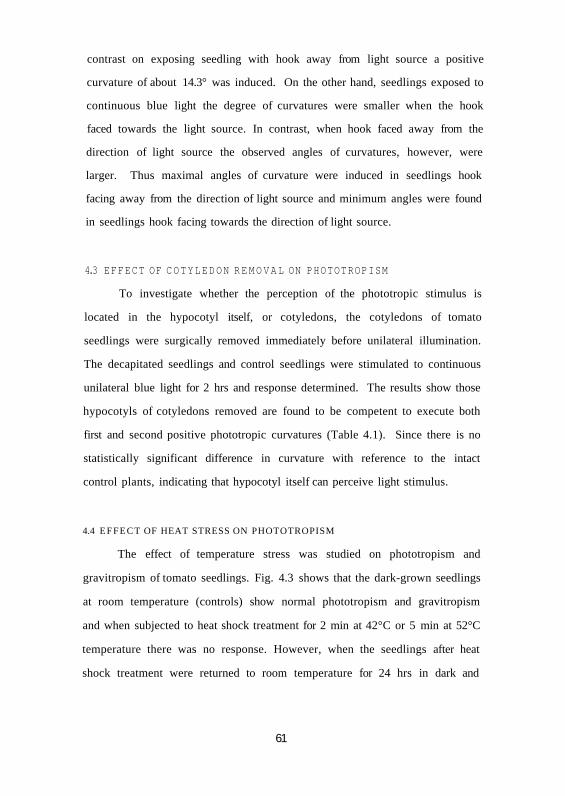
contrast on exposing seedling with hook away from light source a positive
curvature of about 14.3° was induced. On the other hand, seedlings exposed to
continuous blue light the degree of curvatures were smaller when the hook
faced towards the light source. In contrast, when hook faced away from the
direction of light source the observed angles of curvatures, however, were
larger. Thus maximal angles of curvature were induced in seedlings hook
facing away from the direction of light source and minimum angles were found
in seedlings hook facing towards the direction of light source.
4.3 EFFECT OF COTYLEDON REMOVAL ON PHOTOTROPISM
To investigate whether the perception of the phototropic stimulus is
located in the hypocotyl itself, or cotyledons, the cotyledons of tomato
seedlings were surgically removed immediately before unilateral illumination.
The decapitated seedlings and control seedlings were stimulated to continuous
unilateral blue light for 2 hrs and response determined. The results show those
hypocotyls of cotyledons removed are found to be competent to execute both
first and second positive phototropic curvatures (Table 4.1). Since there is no
statistically significant difference in curvature with reference to the intact
control plants, indicating that hypocotyl itself can perceive light stimulus.
4.4 EFFECT OF HEAT STRESS ON PHOTOTROPISM
The effect of temperature stress was studied on phototropism and
gravitropism of tomato seedlings. Fig. 4.3 shows that the dark-grown seedlings
at room temperature (controls) show normal phototropism and gravitropism
and when subjected to heat shock treatment for 2 min at 42°C or 5 min at 52°C
temperature there was no response. However, when the seedlings after heat
shock treatment were returned to room temperature for 24 hrs in dark and
61
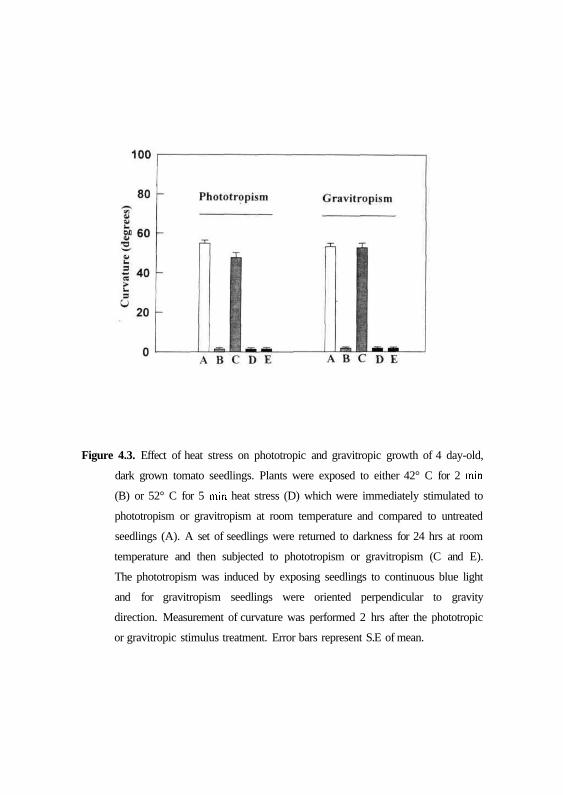
Figure 4.3. Effect of heat stress on phototropic and gravitropic growth of 4 day-old,
dark grown tomato seedlings. Plants were exposed to either 42° C for 2 min
(B) or 52° C for 5 min heat stress (D) which were immediately stimulated to
phototropism or gravitropism at room temperature and compared to untreated
seedlings (A). A set of seedlings were returned to darkness for 24 hrs at room
temperature and then subjected to phototropism or gravitropism (C and E).
The phototropism was induced by exposing seedlings to continuous blue light
and for gravitropism seedlings were oriented perpendicular to gravity
direction. Measurement of curvature was performed 2 hrs after the phototropic
or gravitropic stimulus treatment. Error bars represent S.E of mean.
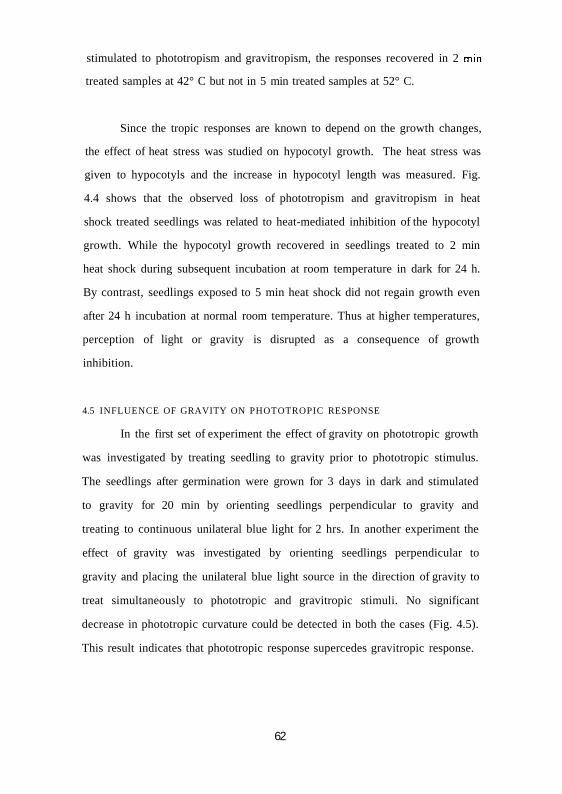
stimulated to phototropism and gravitropism, the responses recovered in 2 min
treated samples at 42° C but not in 5 min treated samples at 52° C.
Since the tropic responses are known to depend on the growth changes,
the effect of heat stress was studied on hypocotyl growth. The heat stress was
given to hypocotyls and the increase in hypocotyl length was measured. Fig.
4.4 shows that the observed loss of phototropism and gravitropism in heat
shock treated seedlings was related to heat-mediated inhibition of the hypocotyl
growth. While the hypocotyl growth recovered in seedlings treated to 2 min
heat shock during subsequent incubation at room temperature in dark for 24 h.
By contrast, seedlings exposed to 5 min heat shock did not regain growth even
after 24 h incubation at normal room temperature. Thus at higher temperatures,
perception of light or gravity is disrupted as a consequence of growth
inhibition.
4.5 INFLUENCE OF GRAVITY ON PHOTOTROPIC RESPONSE
In the first set of experiment the effect of gravity on phototropic growth
was investigated by treating seedling to gravity prior to phototropic stimulus.
The seedlings after germination were grown for 3 days in dark and stimulated
to gravity for 20 min by orienting seedlings perpendicular to gravity and
treating to continuous unilateral blue light for 2 hrs. In another experiment the
effect of gravity was investigated by orienting seedlings perpendicular to
gravity and placing the unilateral blue light source in the direction of gravity to
treat simultaneously to phototropic and gravitropic stimuli. No significant
decrease in phototropic curvature could be detected in both the cases (Fig. 4.5).
This result indicates that phototropic response supercedes gravitropic response.
62
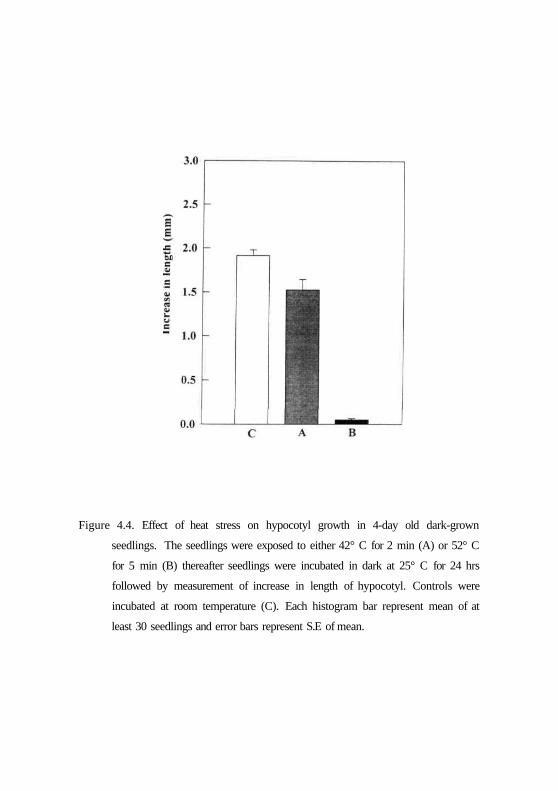
Figure 4.4. Effect of heat stress on hypocotyl growth in 4-day old dark-grown
seedlings. The seedlings were exposed to either 42° C for 2 min (A) or 52° C
for 5 min (B) thereafter seedlings were incubated in dark at 25° C for 24 hrs
followed by measurement of increase in length of hypocotyl. Controls were
incubated at room temperature (C). Each histogram bar represent mean of at
least 30 seedlings and error bars represent S.E of mean.
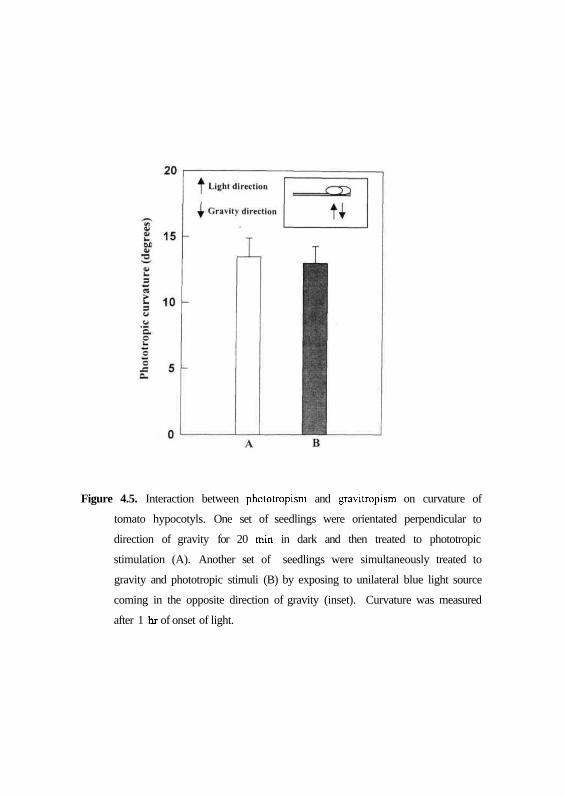
Figure 4.5. Interaction between phototropism and gravitropism on curvature of
tomato hypocotyls. One set of seedlings were orientated perpendicular to
direction of gravity for 20 min in dark and then treated to phototropic
stimulation (A). Another set of seedlings were simultaneously treated to
gravity and phototropic stimuli (B) by exposing to unilateral blue light source
coming in the opposite direction of gravity (inset). Curvature was measured
after 1 hr of onset of light.
4.6 EFFECT OF CAROTENOID BLEACHING ON PHOTOTROPISM
Over the years carotenoid has been proposed to be the chromophore
responsible for phototropism. One of the carotenoid, zeaxanthin, was shown to
be involved in the perception of phototropic signal in maize (Quinones et al.,
1996 ; Quinones and Zegier 1994). To assess the relative role of carotenoids in
phototropic response the seedlings were treated to Norflurazon, which
interferes with the desaturation of m-phytoene thus blocking the accumulation
of carotenoids. The seedlings germinated in the presence of Norflurozan
showed a substantial reduction in the accumulation of carotenoid levels (Fig
4.6). However, when the control and Norflurazon bleached seedlings were
treated to unilateral continuous blue light for 2 hrs, Norflurazon treated
seedlings had a normal phototropic response, although these seedlings showed
less curvature than control seedlings, (Fig 4.6).
4.7 EFFECT OF RED OR FAR-RED LIGHT PRE-TREAMENTS ON ENHANCEMENT
OF PHOTOTROPISM
Although phototropism is a blue-light mediated response, pre-irradiation
with red light enhances the phototropic response. The effect of red light pre-
irradiation on blue light induced first positive response was examined by
comparing effect of ominilateral pre-irradiation of red light from above for 5
min and incubated in dark for 90min prior to the blue light pulse. Table 4.2
shows magnitude of curvature determined 90 min after the blue light pulse
treatment. In non-preirradiated seedlings a curvature of 10.2° was observed.
However, in seedlings that are pre-irradiated with red light there was one-fold
increase in the response of about 20.8°. The red/far-red reversibility of
phototropic enhancement was tested by following 5 min red light preirradiation
with 5 min far-red irradiation. As shown in the Table 4.2. the red light
63

Figure 4.6. Effect of norflurazon treatment on phototropic curvature (A) and
accumulation of carotenoids in red-light grown seedlings (B). The seedlings
were germinated in the presence of norflurazon or distilled water (control) and
treated to phototropic stimulus for 2 hrs (A). Carotenoid content of norflurazon
treated seedlings was determined from the absorbance at 473 nm of cotyledons
of 5 seedlings and compared to that of control (B). Error bars represent S.E of
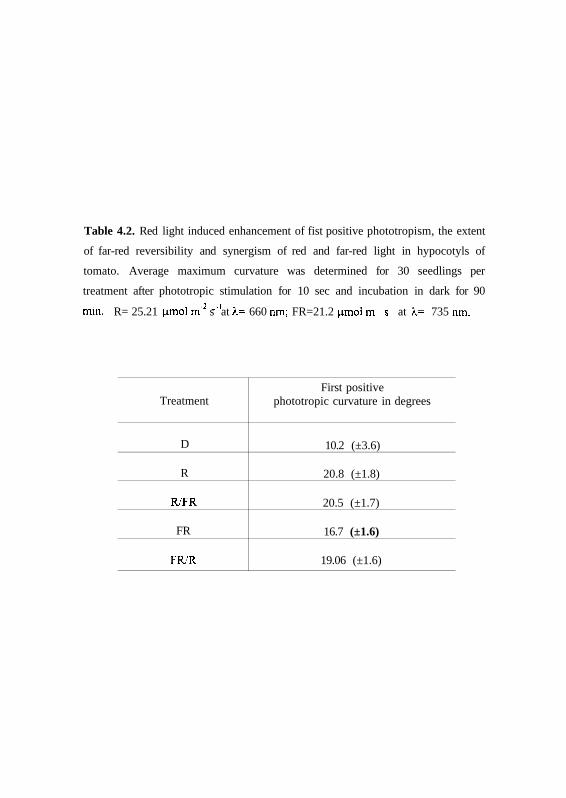
Table 4.2. Red light induced enhancement of fist positive phototropism, the extent
of far-red reversibility and synergism of red and far-red light in hypocotyls of
tomato. Average maximum curvature was determined for 30 seedlings per
treatment after phototropic stimulation for 10 sec and incubation in dark for 90--2 . - Imin. R= 25.21 nmol m s at k= 660 nm; FR=21.2 ^mol m s at X= 735 nm.
Treatment
D
R
R/FR
FR
FR/R
First positivephototropic curvature in degrees
10.2 (±3.6)
20.8 (±1.8)
20.5 (±1.7)
16.7 (±1.6)
19.06 (±1.6)
mediated enhancement could not be reversed by a subsequent far-red light
treatment. Moreover, when far-red light was given alone rather increased the
phototropic curvature to about 16.7°. It is evident from results presented that
the response lacks classical red/far-red reversibility as well as far-red light has
nearly the same effect.
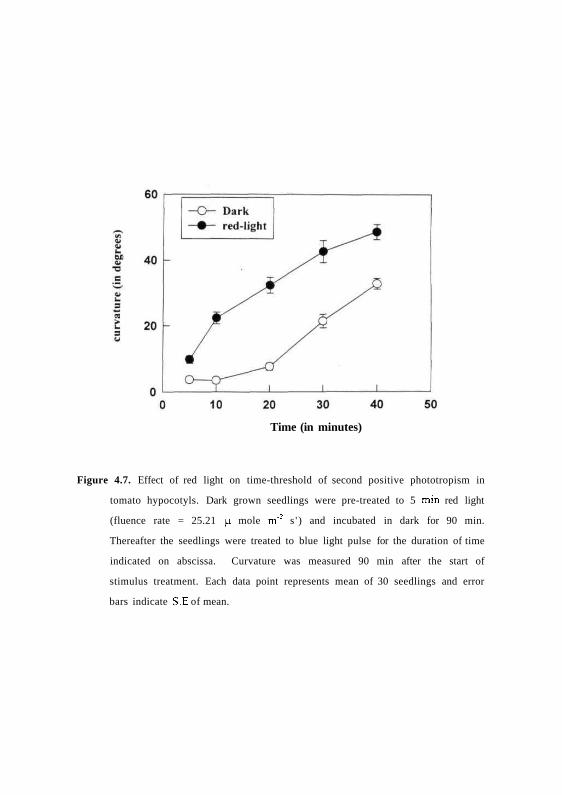
The effect of red light pre-irradiation was also examined on the time
threshold of second positive response of tomato hypocotyls. Dark grown
seedlings were pre-irradiated for 5 min with red light and incubated in dark for
90 min. After which, the seedling were exposed to varying duration of time
with unilateral blue light at 0.01 ^mol m ' V . Fig 4.7 shows that non-pre-
irradiated seedlings required a time threshold of about 10-min to induce
curvatures. In contrast pre-irradiation of seedlings with red light, displayed
higher sensitivity to phototropic stimulus by shortening of the time threshold to
5 min and significant increase of magnitude of curvature.
4.8 EFFECT OF BLUE OR WHITE LIGHT PRE-TREATMENTS ON FIRST POSITIVE
PHOTOTROPISM
The effect of blue or white light pre-irradiation followed with red or far-red
light were examined on first positive phototropic response by treating
immediately after pre-irradiations with unilateral blue light pulse for 10 sec at
0.01 |imol m"2 s"' and determining curvature after 90min incubation in dark.
Fig. 4.8. shows that first positive response could be detected only in dark-
grown, red light or far-red light pre-treated seedlings. In contrast, first positive
response significantly declined in seedlings pre-treated with either white light
or blue light. Interestingly, the blue light pretreatment followed by red or far-
64
Time (in minutes)
Figure 4.7. Effect of red light on time-threshold of second positive phototropism in
tomato hypocotyls. Dark grown seedlings were pre-treated to 5 min red light
(fluence rate = 25.21 n mole m"2 s ' ) and incubated in dark for 90 min.
Thereafter the seedlings were treated to blue light pulse for the duration of time
indicated on abscissa. Curvature was measured 90 min after the start of
stimulus treatment. Each data point represents mean of 30 seedlings and error
bars indicate S E of mean.
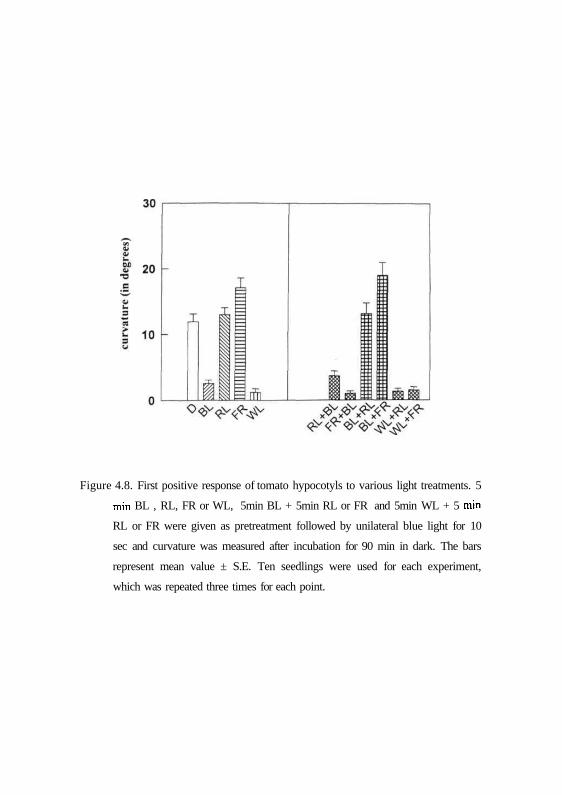
Figure 4.8. First positive response of tomato hypocotyls to various light treatments. 5
min BL , RL, FR or WL, 5min BL + 5min RL or FR and 5min WL + 5 min
RL or FR were given as pretreatment followed by unilateral blue light for 10
sec and curvature was measured after incubation for 90 min in dark. The bars
represent mean value ± S.E. Ten seedlings were used for each experiment,
which was repeated three times for each point.
red light restored the first positive response, whereas white light pretreatment
followed by red or far-red light could not restore the response.
4.9 KJNETICS OF FIRST AND SECOND POSITIVE PHOTOTROPISM DURING DE-
ETIOLATION
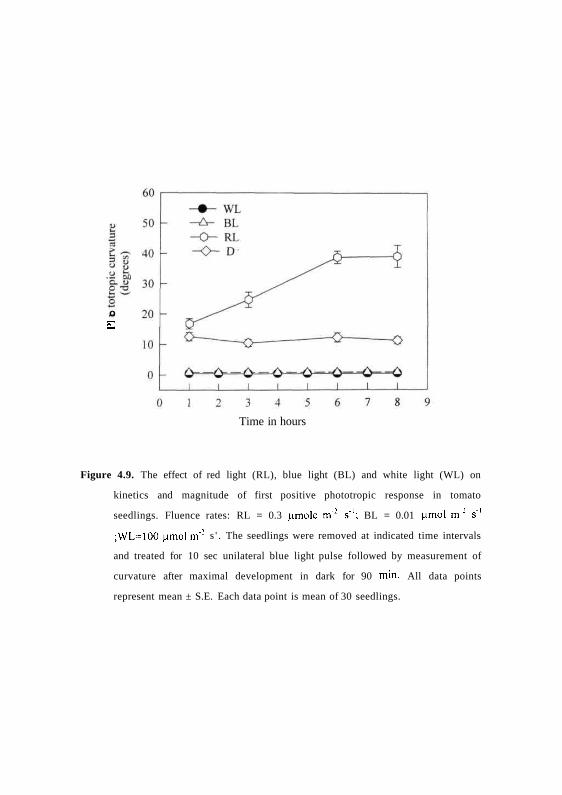
Only limited information is available for the sensitivity of seedlings to show
first and second positive responses during de-etiolation. After germination in
dark the seedlings were grown under ominilateral white or red or blue light,
and the first positive response was monitored during the course of de-etiolation
for 8h when the seedlings just opened the hooks. Fig. 4.9 shows that first
positive response was lost in white or blue light treated seedlings. The response
is retained and also enhanced in red light-grown seedlings (Fig. 4.9). Similarly,
the kinetics of second positive response was also monitored during de-
etiolation of seedlings. Seedlings grown under continuous white light was
examined for occurrence of second positive response at regular intervals of 24
hours. Fig. 4.10 shows that the seedlings responded to second positive stimulus
during early phase of seedling emergence 1, 2 or 3-day-old seedlings, but the
sensitivity is gradually lost as seedlings aged. This indicates that although
second positive phototropism is retained during early stages of de-etiolation the
response is lost in completely de-etiolated seedlings.
4.10 SECOND POSITIVE PHOTOTROPISM IN au AND//-/ MUTANTS
If phytochrome plays a role in the phototropism of tomato seedlings,
then mutants with altered in phytochrome apoprotein or its chromophore
should show modified response. The availability of phytochrome photoreceptor
mutants enables the characterization of its role in the co-action with blue/UV-A
photoreceptors to regulate phototropism. Alternatively, physiological
65
oSZ
Time in hours
Figure 4.9. The effect of red light (RL), blue light (BL) and white light (WL) on
kinetics and magnitude of first positive phototropic response in tomato
seedlings. Fluence rates: RL = 0.3 nmole m"2 s'1; BL = 0.01 ^mol m'2 s 1
;WL=100 |imol m"2 s ' . The seedlings were removed at indicated time intervals
and treated for 10 sec unilateral blue light pulse followed by measurement of
curvature after maximal development in dark for 90 min. All data points
represent mean ± S.E. Each data point is mean of 30 seedlings.
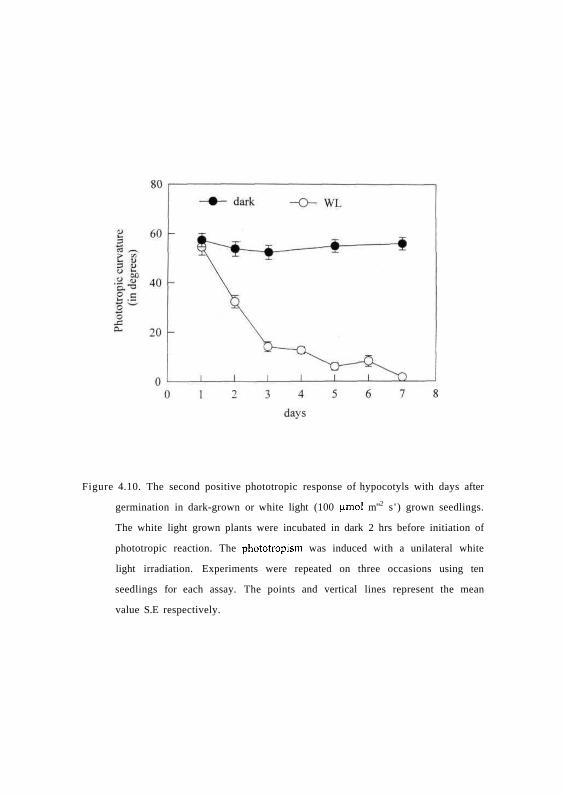
Figure 4.10. The second positive phototropic response of hypocotyls with days after
germination in dark-grown or white light (100 (amol m"2 s ' ) grown seedlings.
The white light grown plants were incubated in dark 2 hrs before initiation of
phototropic reaction. The phototropism was induced with a unilateral white
light irradiation. Experiments were repeated on three occasions using ten
seedlings for each assay. The points and vertical lines represent the mean
value S.E respectively.
characterization of the known phytochrome mutants may provide insight into
the role of phytochrome in phototropism.
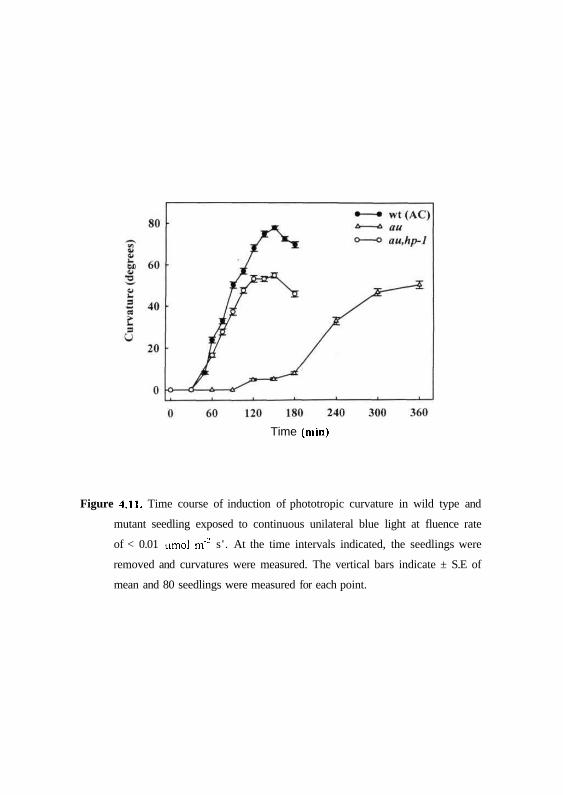
Since au mutant (possessing < 5% levels of phyA) that is deficient in
chromophore biosynthesis (Terry and Kendrick, 1996) has reduced
phytochrome level of all phy species, the role of phytochromes in phototropism
was analysed using this mutant. The dark grown wild type and mutant
seedlings were tested for phototropism by inducing the response with
continuous blue light for 6 hr time interval. Fig. 4.11 shows time course of the
phototropic curvature in wild type and au mutant seedlings. In wild type
seedlings exposed to uni-directional continuous blue light, response was
induced after 45 min and maximal phototropic curvature was reached by 120
min. In contrast, seedlings of aw mutant showed insignificant curvature up to 3
hrs and latter sluggishly developed some curvature. Even after 6 hrs the
curvature induced in au mutant was lesser than wild-type (Fig 4.11).
To further analyze the role of phytochrome in the au mutant phototropic
response of seedlings were also examined to their sensitivity to UV-A and
white light induced phototropism. The second positive curvatures were
compared in wild type and au mutant after irradiating either with continuous
UV-A or white light. While the wild type seedlings showed significant second
positive response, the same treatments resulted in insignificant response in au
mutant (Fig 4.12).
Since the dark grown au mutant seedlings had an altered phototropic
response, we decided to screen for phytochrome species-specific mutants. At
first, the role of specific phytochrome species on phototropism was examined
66
Time (min)
Figure 4.11. Time course of induction of phototropic curvature in wild type and
mutant seedling exposed to continuous unilateral blue light at fluence rate
of < 0.01 umol m"2 s ' . At the time intervals indicated, the seedlings were
removed and curvatures were measured. The vertical bars indicate ± S.E of
mean and 80 seedlings were measured for each point.
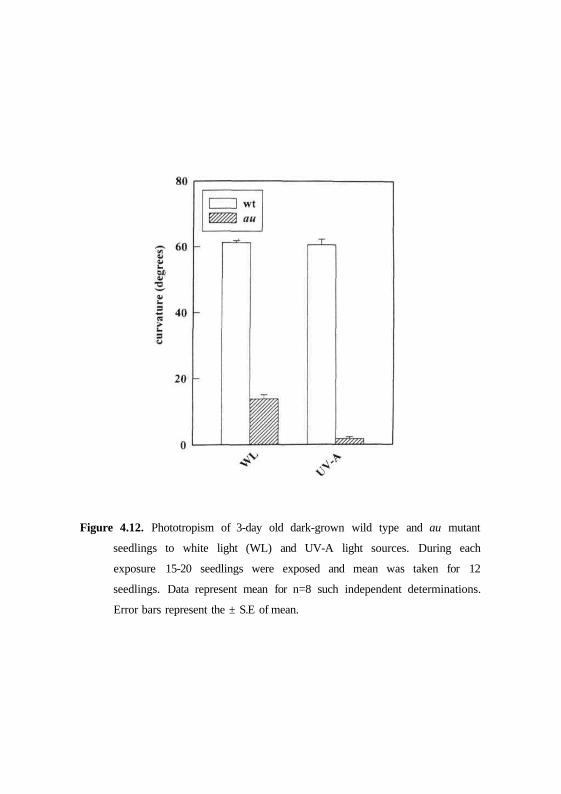
Figure 4.12. Phototropism of 3-day old dark-grown wild type and au mutant
seedlings to white light (WL) and UV-A light sources. During each
exposure 15-20 seedlings were exposed and mean was taken for 12
seedlings. Data represent mean for n=8 such independent determinations.
Error bars represent the ± S.E of mean.
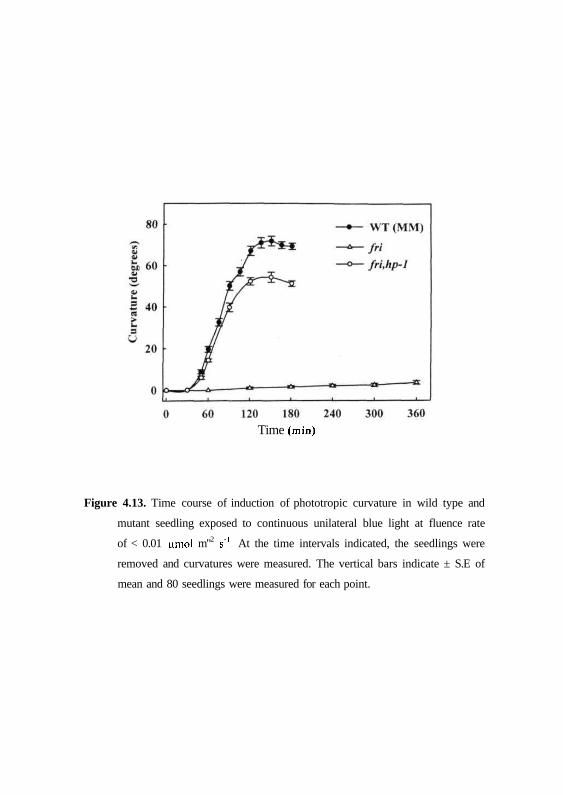
by using phy A mutant, fri. The fri mutant of tomato lacks bulk pool of
phytochrome in etiolated seedlings, predominantly phyA (van Tuinen et al.,
1995a), as a consequence of mutation in the PHYA gene (Pratt et al., 1997;
Lazarova et al., 1998). Fig. 4.13 shows comparison of phototropism in wild
type and//-/ mutant seedlings to continuous unilateral blue light for 6 hrs. In
dark grown wild type (MM) seedlings phototropic curvature was manifested
with in 45 to 60 min of stimulation and reached a maximum by 120 min. On
the contrary, however, seedlings of fri mutant showed no appreciable curvature
towards continuous blue light during first 3 hrs and bending is only relatively
slight even after 360 min (Fig. 4.13). These observations of phototropic
response in au and fri mutants indicates that both the mutants are severely
impaired in second positive phototropism.
4.11 SECOND POSITIVE PHOTOTROPISM IN au,hp-l AND fri,hp-l DOUBLE
MUTANTS
While experiments with au and fri mutant indicated a role for
phytochrome in second positive response, we examined its interaction with hp-
1 mutation in the digenic mutants au,hp-l and fri,hp-1. Double homozygous
mutant lines combing au and fri with hp-1 have already been described
(Kendrick et al., 1997). As shown in Figs. 4.11 and 4.13, both fri.hp-1 and
au,hp-l double mutants showed 45 - 60 min lag period and maximal curvature
by 2 h similar to wild type. This indicates that hp-1 mutation reverses second
positive phototropic response to continuous blue light in the double mutants
au.hp-1 andfri.hp-1.
67
Time (min)
Figure 4.13. Time course of induction of phototropic curvature in wild type and
mutant seedling exposed to continuous unilateral blue light at fluence rate
of < 0.01 umol m"2 s1. At the time intervals indicated, the seedlings were
removed and curvatures were measured. The vertical bars indicate ± S.E of
mean and 80 seedlings were measured for each point.
4.12 SECOND POSITIVE PHOTOTROPISM IN tri MUTANT AND trijri DOUBLE
MUTANTS
Possible participation of phytochrome Bl and it interaction with
phytochrome A in phototropism the response was investigated by the use of tri
mutant, and trijri double mutant respectively. The tri mutant has reduced
levels of phytochrome Bl (phyB) and is due to consequence of a mutation of
PHYBIgene itself (Kerckhoffs et al., 1996; van Tuninen et al., 1997; Pratt et
al., 1997). The dark grown seedlings were treated to continuous unilateral blue
light for 3 hrs and curvature determined. The seedlings of the phyBl mutant tri
showed phototropic response similar to wild type (Fig 4.14). Thus, the absence
of phyBl did not significantly effect the blue light induced curvature.
However, the trijri double mutant lacking phyA and phyBl behaved similarly
to fri mutant, showing little or no response. It is evident from this data that
the tri mutant shown normal second positive response while trijri is impaired
in the second positive phototropism.
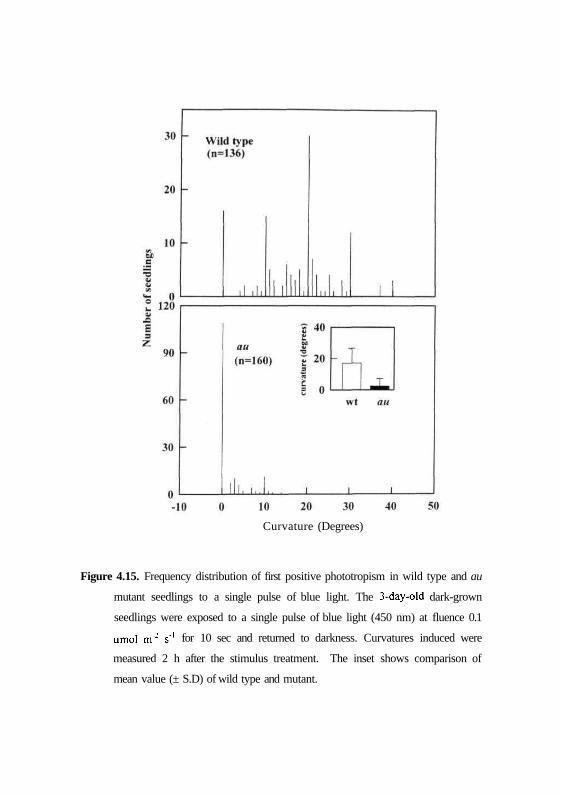
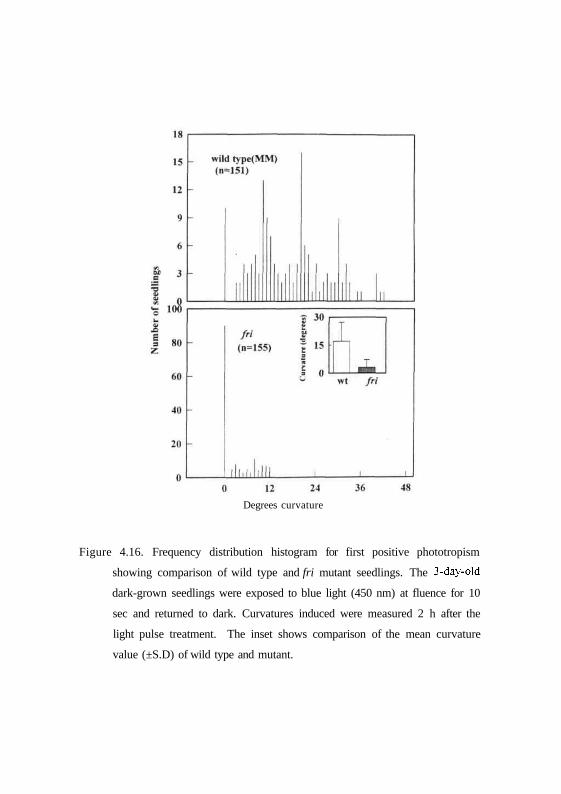
4.13 FIRST POSITIVE PHOTOTROPISM IN au AND//-/MUTANTS
Since the au and fri mutants are impaired in second positive
phototropism, the mutants were tested for first positive phototropic response.
The dark grown seedlings of wild type and mutants were treated with a pulse of
blue light for 10 sec at fluence 0.01 (imol m ' V and curvature was determined
after 2 hrs incubation in dark. Fig. 4.15 and 4.16 show that dark grown
seedlings of genotypes AC and MM show a mean curvature of 16.9° and 15.7°
respectively. Moreover, the seedlings show a uniform distribution of curvatures
with minimum curvatures of 20° to maximum curvatures of 80°. In contrast,
au and fri mutants show a mean first positive curvature of 2.37° and 2.45°
respectively (Figs. 4.15 and 4.16) and the frequency distribution shows angles
68

20
Figure 4.14. Phototropism to continuous blue light in wild type and mutant
seedlings. 3-day old dark-grown seedlings were treated to unilateral blue light
for 3 hours and curvatures measured. Each histogram represent mean of at
least 80 seedlings, the error bars represent S.D of mean.
Curvature (Degrees)
Figure 4.15. Frequency distribution of first positive phototropism in wild type and au
mutant seedlings to a single pulse of blue light. The 3-day-old dark-grown
seedlings were exposed to a single pulse of blue light (450 nm) at fluence 0.1
umol m'2 s'1 for 10 sec and returned to darkness. Curvatures induced were
measured 2 h after the stimulus treatment. The inset shows comparison of
mean value (± S.D) of wild type and mutant.
Degrees curvature
Figure 4.16. Frequency distribution histogram for first positive phototropism
showing comparison of wild type and fri mutant seedlings. The 3-day-old
dark-grown seedlings were exposed to blue light (450 nm) at fluence for 10
sec and returned to dark. Curvatures induced were measured 2 h after the
light pulse treatment. The inset shows comparison of the mean curvature
value (±S.D) of wild type and mutant.
of curvatures between 0° and 20°. Thus, the results indicate that au and fri
mutants are impaired in the first positive phototropism.
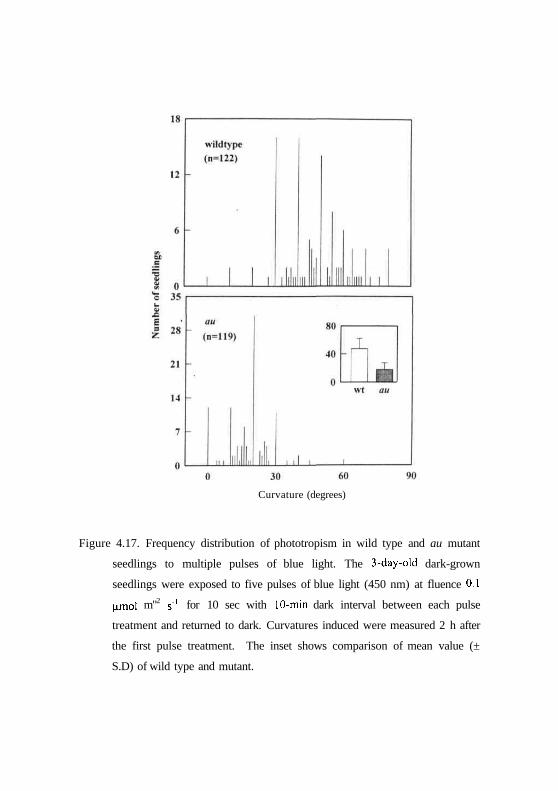
To further characterize the amplification of fist positive phototropism by
multiple pulses of blue light the dark-grown wild type and mutant seedlings
were treated to five multiple pulses of blue light separated by dark interval of
10 min between each pulse treatment. Figs 4.17 and 4.18 show that wild type
seedlings of genotypes AC and MM respond with mean curvature of 47.31°
and 38.89° respectively. In contrast, au and/n mutants responded with mean
curvature of 17.90° and 6.88° respectively. (Figs. 4.17 and 4.18). There is a
significant increase in curvature in the au mutant. These results indicate that
amplification of first positive phototropism takes place in au mutant compared
to fri mutant, however, it is insignificant with respect to its wild type in the
same background.
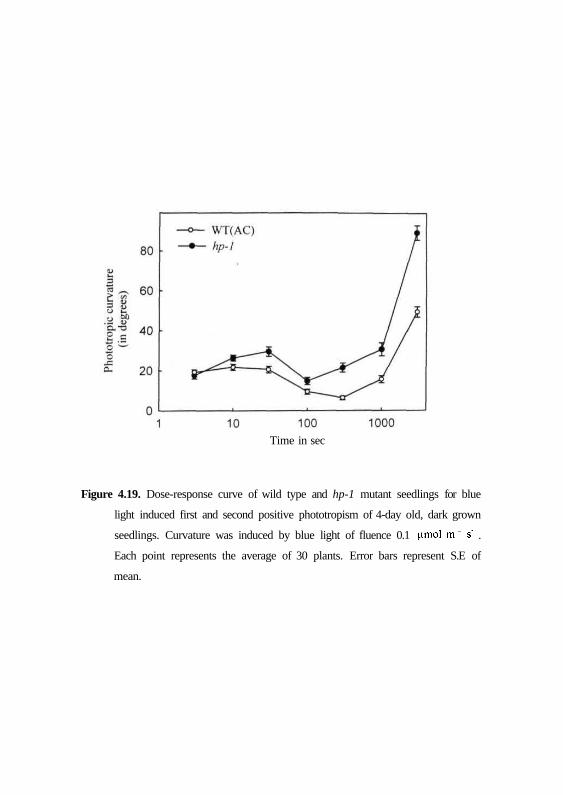
4.14 PHOTOTROPISM IN hp-1 MUTANT
Since hp-1 mutation can overcome the phyA deficiency in au and fri
mutants, the fluence response curve for blue-light mediated phototropism was
determined for dark-grown wild type and hp-1 mutant seedlings. Seedlings
were exposed to a fixed fluence of 0.1 umol m'2 sec1 blue light for various
duration and curvature was measured 120 min after the onset of blue light
exposure. Fig. 4.19 shows that though the first positive curvatures show a bell
shaped profile for both wild type and hp-1 mutant, the mutant showed higher
magnitude of curvatures. The kinetics differed with respect to time threshold
needed for hp-1 to induce second positive curvatures (Fig. 4.20). A clear zone
of indifferent curvatures between 120 and 1000 sec i.e., between first and
second positive curvature is discernible for wild type, whereas in hp-1 mutant
69
Curvature (degrees)
Figure 4.17. Frequency distribution of phototropism in wild type and au mutant
seedlings to multiple pulses of blue light. The 3-day-old dark-grown
seedlings were exposed to five pulses of blue light (450 nm) at fluence 0.1
nmol m"2 s"1 for 10 sec with 10-min dark interval between each pulse
treatment and returned to dark. Curvatures induced were measured 2 h after
the first pulse treatment. The inset shows comparison of mean value (±
S.D) of wild type and mutant.
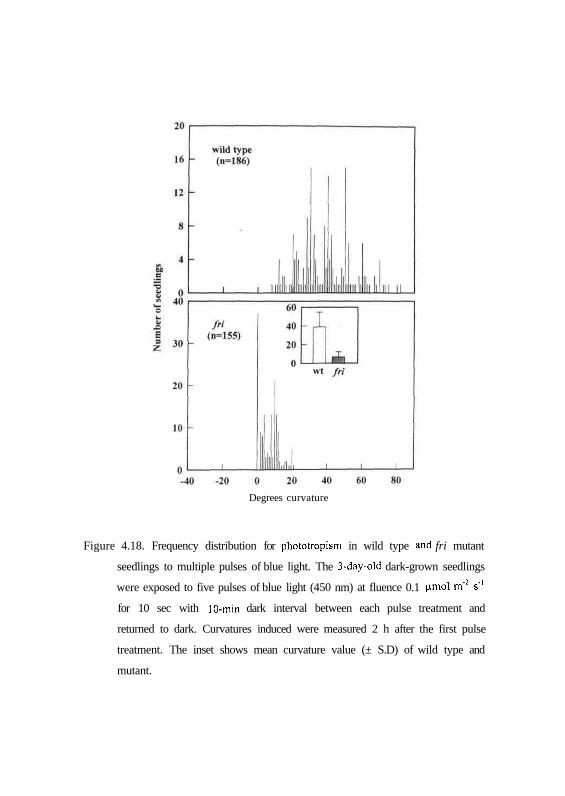
Degrees curvature
Figure 4.18. Frequency distribution for phototropism in wild type and fri mutant
seedlings to multiple pulses of blue light. The 3-day-old dark-grown seedlings
were exposed to five pulses of blue light (450 nm) at fluence 0.1 ^mol m'2 s"1
for 10 sec with 10-min dark interval between each pulse treatment and
returned to dark. Curvatures induced were measured 2 h after the first pulse
treatment. The inset shows mean curvature value (± S.D) of wild type and
mutant.
Time in sec
Figure 4.19. Dose-response curve of wild type and hp-1 mutant seedlings for blue
light induced first and second positive phototropism of 4-day old, dark grown
seedlings. Curvature was induced by blue light of fluence 0.1 |amol m" s' .
Each point represents the average of 30 plants. Error bars represent S.E of
mean.
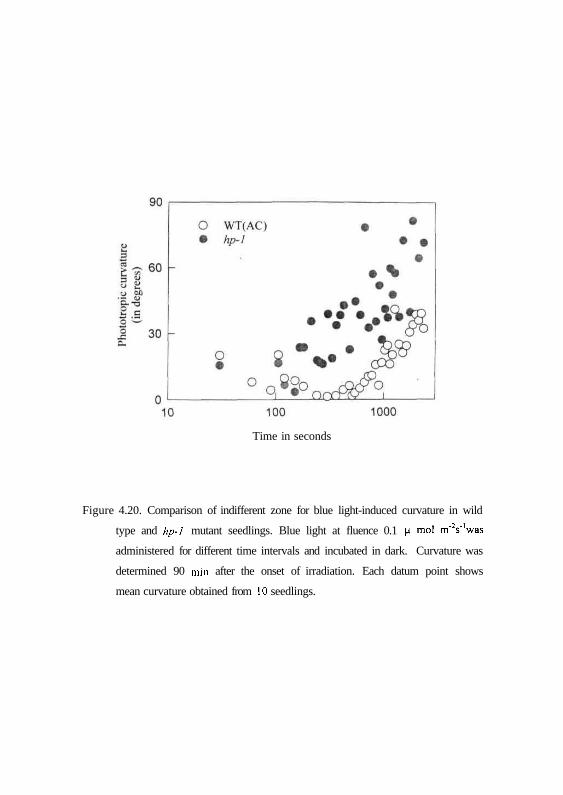
Figure 4.20. Comparison of indifferent zone for blue light-induced curvature in wild
type and hp-1 mutant seedlings. Blue light at fluence 0.1 (i mol m'Vwas
administered for different time intervals and incubated in dark. Curvature was
determined 90 min after the onset of irradiation. Each datum point shows
mean curvature obtained from 10 seedlings.
Time in seconds
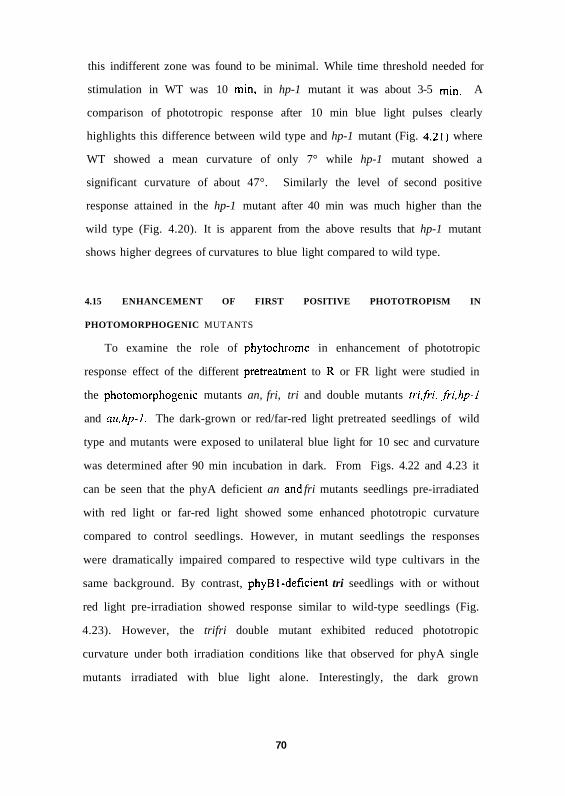
this indifferent zone was found to be minimal. While time threshold needed for
stimulation in WT was 10 min, in hp-1 mutant it was about 3-5 min. A
comparison of phototropic response after 10 min blue light pulses clearly
highlights this difference between wild type and hp-1 mutant (Fig. 4.21) where
WT showed a mean curvature of only 7° while hp-1 mutant showed a
significant curvature of about 47°. Similarly the level of second positive
response attained in the hp-1 mutant after 40 min was much higher than the
wild type (Fig. 4.20). It is apparent from the above results that hp-1 mutant
shows higher degrees of curvatures to blue light compared to wild type.
4.15 ENHANCEMENT OF FIRST POSITIVE PHOTOTROPISM IN
PHOTOMORPHOGENIC MUTANTS
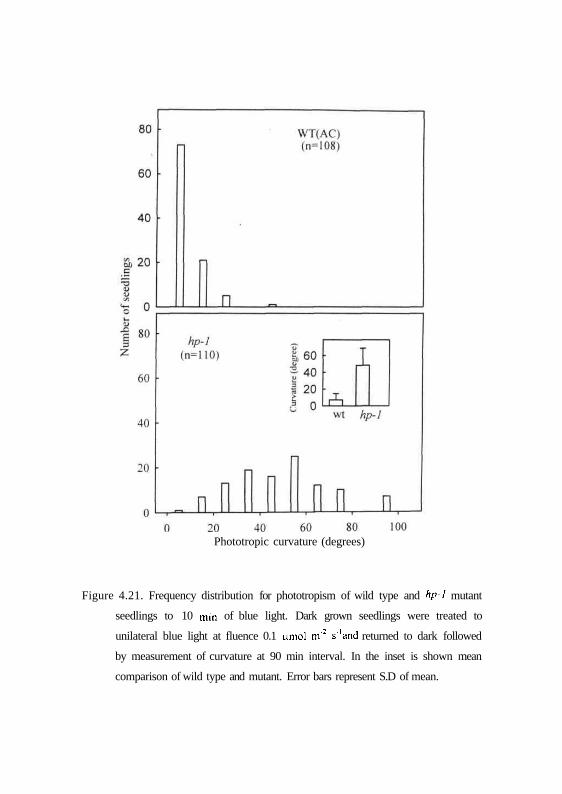
To examine the role of phytochrome in enhancement of phototropic
response effect of the different pretreatment to R or FR light were studied in
the photomorphogenic mutants an, fri, tri and double mutants trifri, fri,hp-1
and au.hp-1. The dark-grown or red/far-red light pretreated seedlings of wild
type and mutants were exposed to unilateral blue light for 10 sec and curvature
was determined after 90 min incubation in dark. From Figs. 4.22 and 4.23 it
can be seen that the phyA deficient an and fri mutants seedlings pre-irradiated
with red light or far-red light showed some enhanced phototropic curvature
compared to control seedlings. However, in mutant seedlings the responses
were dramatically impaired compared to respective wild type cultivars in the
same background. By contrast, phyBl-deficient tri seedlings with or without
red light pre-irradiation showed response similar to wild-type seedlings (Fig.
4.23). However, the trifri double mutant exhibited reduced phototropic
curvature under both irradiation conditions like that observed for phyA single
mutants irradiated with blue light alone. Interestingly, the dark grown
70
Phototropic curvature (degrees)
Figure 4.21. Frequency distribution for phototropism of wild type and hp-l mutant
seedlings to 10 min of blue light. Dark grown seedlings were treated to
unilateral blue light at fluence 0.1 umol m'2 s'and returned to dark followed
by measurement of curvature at 90 min interval. In the inset is shown mean
comparison of wild type and mutant. Error bars represent S.D of mean.
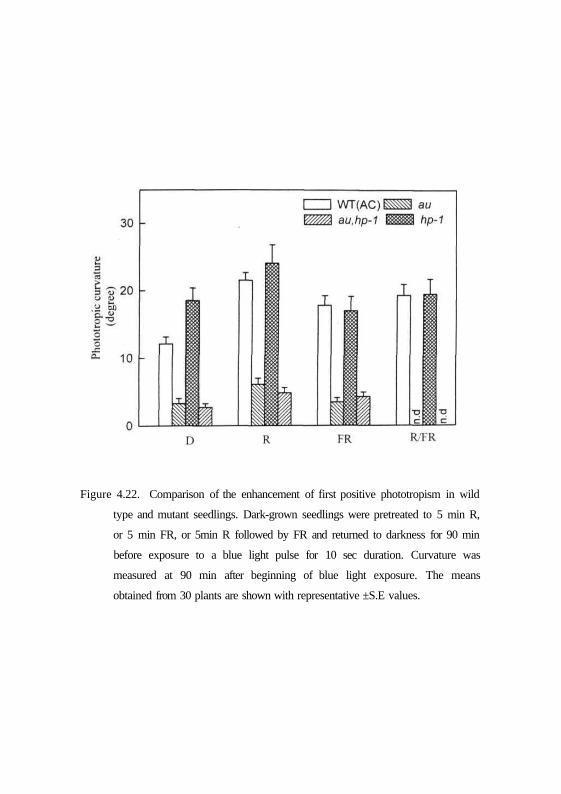
Figure 4.22. Comparison of the enhancement of first positive phototropism in wild
type and mutant seedlings. Dark-grown seedlings were pretreated to 5 min R,
or 5 min FR, or 5min R followed by FR and returned to darkness for 90 min
before exposure to a blue light pulse for 10 sec duration. Curvature was
measured at 90 min after beginning of blue light exposure. The means
obtained from 30 plants are shown with representative ±S.E values.
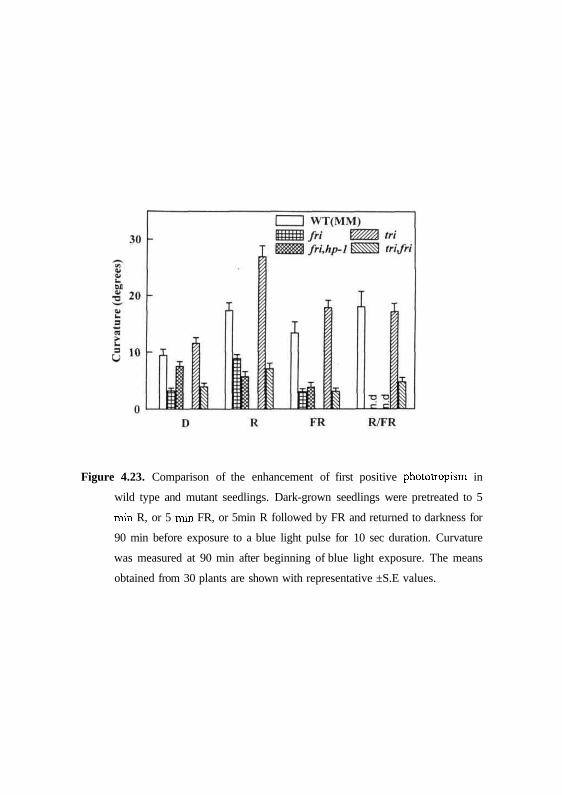
Figure 4.23. Comparison of the enhancement of first positive phototropism in
wild type and mutant seedlings. Dark-grown seedlings were pretreated to 5
min R, or 5 min FR, or 5min R followed by FR and returned to darkness for
90 min before exposure to a blue light pulse for 10 sec duration. Curvature
was measured at 90 min after beginning of blue light exposure. The means
obtained from 30 plants are shown with representative ±S.E values.
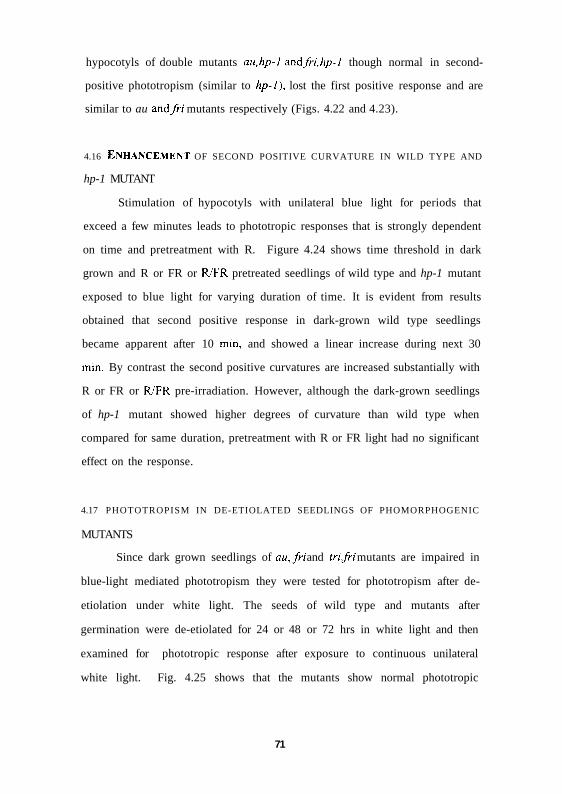
hypocotyls of double mutants au,hp-l and fri.tip-1 though normal in second-
positive phototropism (similar to hp-1), lost the first positive response and are
similar to au and/n mutants respectively (Figs. 4.22 and 4.23).
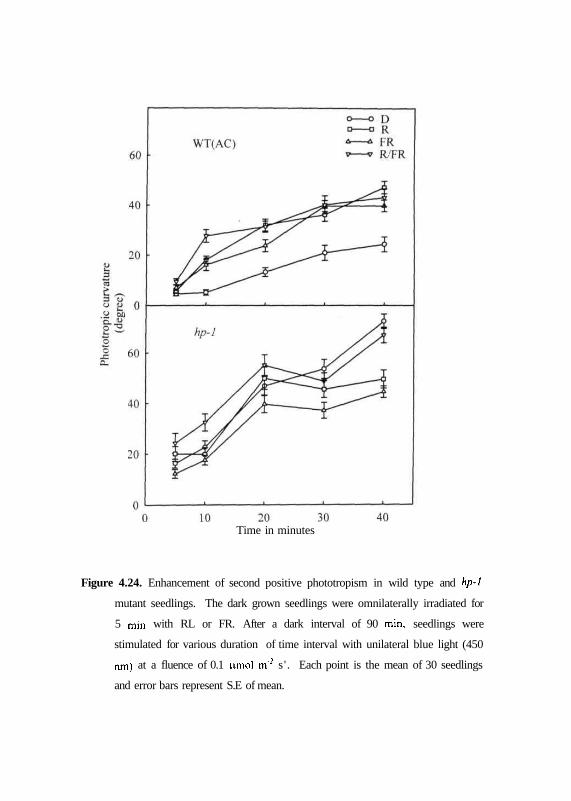
4.16 ENHANCEMENT OF SECOND POSITIVE CURVATURE IN WILD TYPE AND
hp-1 MUTANT
Stimulation of hypocotyls with unilateral blue light for periods that
exceed a few minutes leads to phototropic responses that is strongly dependent
on time and pretreatment with R. Figure 4.24 shows time threshold in dark
grown and R or FR or R/FR pretreated seedlings of wild type and hp-1 mutant
exposed to blue light for varying duration of time. It is evident from results
obtained that second positive response in dark-grown wild type seedlings
became apparent after 10 min, and showed a linear increase during next 30
min. By contrast the second positive curvatures are increased substantially with
R or FR or R/FR pre-irradiation. However, although the dark-grown seedlings
of hp-1 mutant showed higher degrees of curvature than wild type when
compared for same duration, pretreatment with R or FR light had no significant
effect on the response.
4.17 PHOTOTROPISM IN DE-ETIOLATED SEEDLINGS OF PHOMORPHOGENIC
MUTANTS
Since dark grown seedlings of au,fri and trifri mutants are impaired in
blue-light mediated phototropism they were tested for phototropism after de-
etiolation under white light. The seeds of wild type and mutants after
germination were de-etiolated for 24 or 48 or 72 hrs in white light and then
examined for phototropic response after exposure to continuous unilateral
white light. Fig. 4.25 shows that the mutants show normal phototropic
71
Time in minutes
Figure 4.24. Enhancement of second positive phototropism in wild type and hp-1
mutant seedlings. The dark grown seedlings were omnilaterally irradiated for
5 min with RL or FR. After a dark interval of 90 min, seedlings were
stimulated for various duration of time interval with unilateral blue light (450
nm) at a fluence of 0.1 umol m'2 s ' . Each point is the mean of 30 seedlings
and error bars represent S.E of mean.
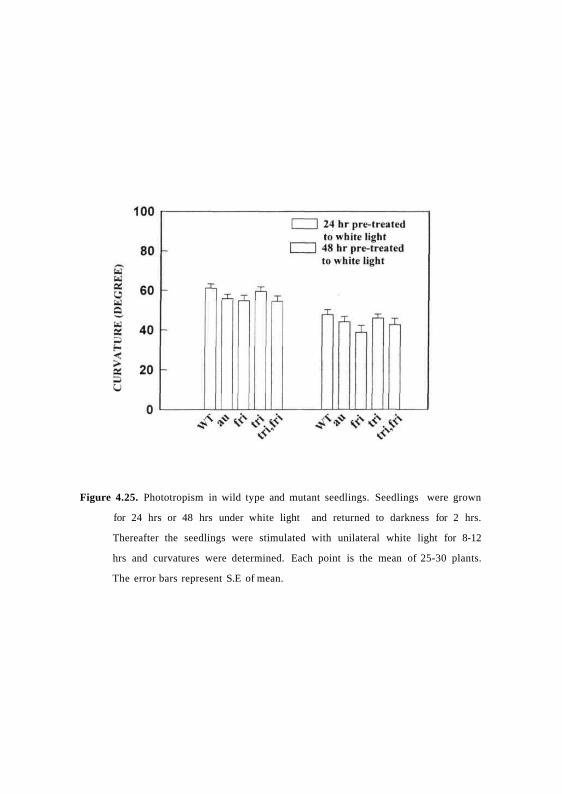
Figure 4.25. Phototropism in wild type and mutant seedlings. Seedlings were grown
for 24 hrs or 48 hrs under white light and returned to darkness for 2 hrs.
Thereafter the seedlings were stimulated with unilateral white light for 8-12
hrs and curvatures were determined. Each point is the mean of 25-30 plants.
The error bars represent S.E of mean.
curvature similar to wild type indicating that the mutants are normal in de-
etiolated seedling phototropism.
4.18 ISOLATION AND SCREENING OF NON-PHOTOTROPIC MUTANT LINES
Although Darwin (1890) first documented phototropism more than
century ago, little is known about the genetic events regulating this important
response. Though some aspects of genetic regulation of phototropism are now
known in Arabidopsis (Liscum and Briggs, 1995), no mutants were isolated or
described in literature in the tomato. In addition, in comparison to Arabidopsis,
studying phototropism in tomato has some advantages; for example its large
seedling size makes it useful for photophysiological analysis. The non-
phototropic mutants will also be specifically useful for further elucidation of
the mechanism of response and their role in plant growth and development.
Hence, an attempt was made to isolate and characterize tomato mutants
impaired in phototropism to develop as another genetic model for the study of
phototropism.
Seeds were mutagenized with 60 mM EMS (Koornnef et al.,1989)
resulting in the Mi generation of seeds. The appearance of somatic sectors and
other morphological variations on Mi plants were taken as indication of the
effectiveness of mutagen (Fig. 4.26). To identify the mutants that are non-
phototropic, M2seed harvested and bulked from 1500 Mi plants were screened.
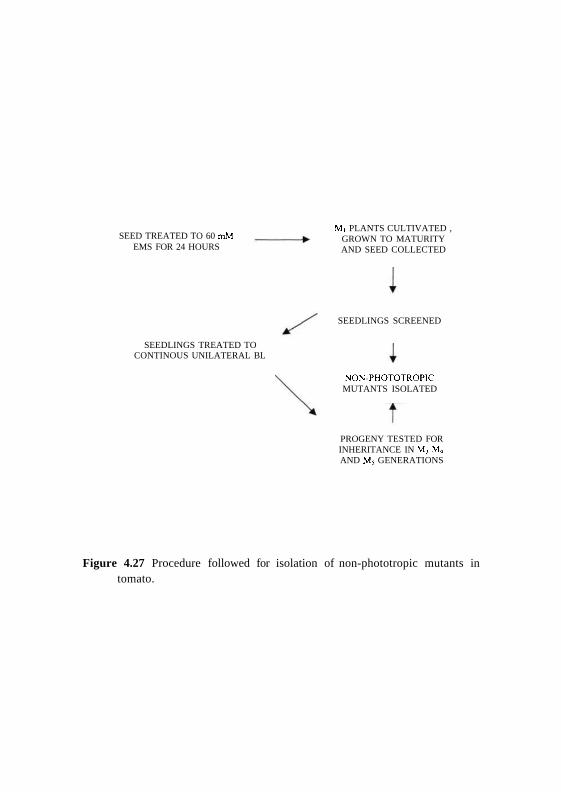
The procedure followed is outlined in Fig. 4.27. The M2 seeds were sown and
allowed to germinate in soilrite mixture filled at a density of approximately 200
- 300 seeds per petri-dish and grown in dark for a week. After which the
seedlings were then treated to unidirectional continuous blue light, and were
scored for seedlings that appeared non-phototropic. From a total of approx.
72
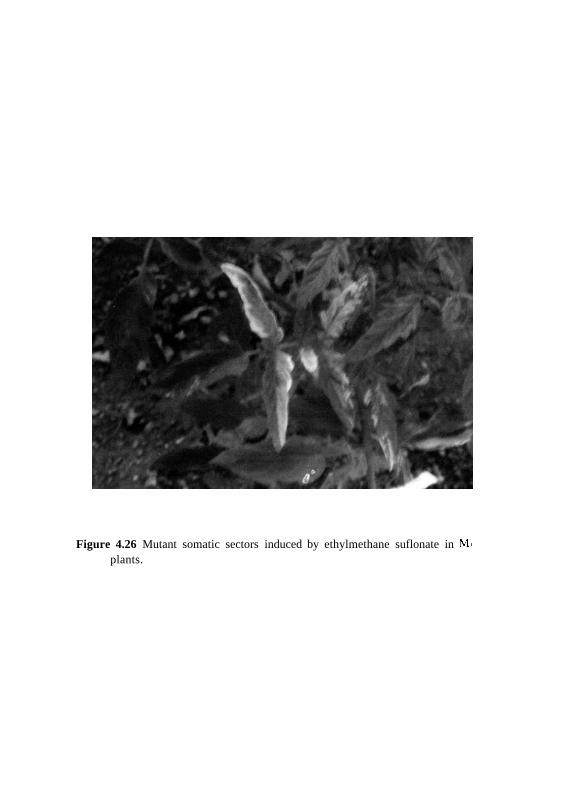
Figure 4.26 Mutant somatic sectors induced by ethylmethane suflonate in Miplants.
SEED TREATED TO 60 mMEMS FOR 24 HOURS
SEEDLINGS TREATED TOCONTINOUS UNILATERAL BL
Mi PLANTS CULTIVATED ,GROWN TO MATURITYAND SEED COLLECTED
PROGENY TESTED FORINHERITANCE IN M, M4
AND M5 GENERATIONS
Figure 4.27 Procedure followed for isolation of non-phototropic mutants intomato.
SEEDLINGS SCREENED
NON-PHOTOTROPICMUTANTS ISOLATED
1,40,000 M2 seedlings screened, 16 putative mutants, that were insensitive
towards unidirectional blue light treatment for 12 -16 hrs of exposure were
identified (see Fig. 4.28). The plants were allowed to mature and seed (M3
generation) from these M2 plants were further secured for the presence of
mutant phenotype as summarized in Table 4.3.
During further screening of the mutants in following generations, 8 lines
were found to retain mutant phenotype. Seed of two lines 1EMS96 and
4EMS96 showed wild type response in later generations and hence were not
used further. One of the line (6EMS96) though set seeds but could not
germinate in M3 generation and similarly some of the lines (12-16EMS96) were
lost as these lines failed to set seeds (Table 4.3). However, two of the lines
(viz., 2EMS96 and 5EMS96) along with other non-phototropic lines that
retained for phenotype were selected and characterized.
4.19 CHARACTERIZATION OF NON-PHOTOTROPIC MUTANTS
The mutant lines were analyzed genetically and physiologically to
determine the nature of the mutation and their relationship. The lines 2EMS96
and 5EMS96 were crossed with wild type and observed that F| seedlings are
non-phototropic in both the cases (Table 4.4). The analysis of segregation
ratios showed approximately 1:3 ratio of phototropic to non-phototropic in F2
seedlings suggesting that these two mutant phenotypes were caused by
dominant mutations. In addition, to clarify the genetic relationship of the
phenotype, reciprocal crosses were also performed. The results of these crosses
are consistent with the interpretation that the phenotypes are due to single
dominant mutation in the respective mutants.
73
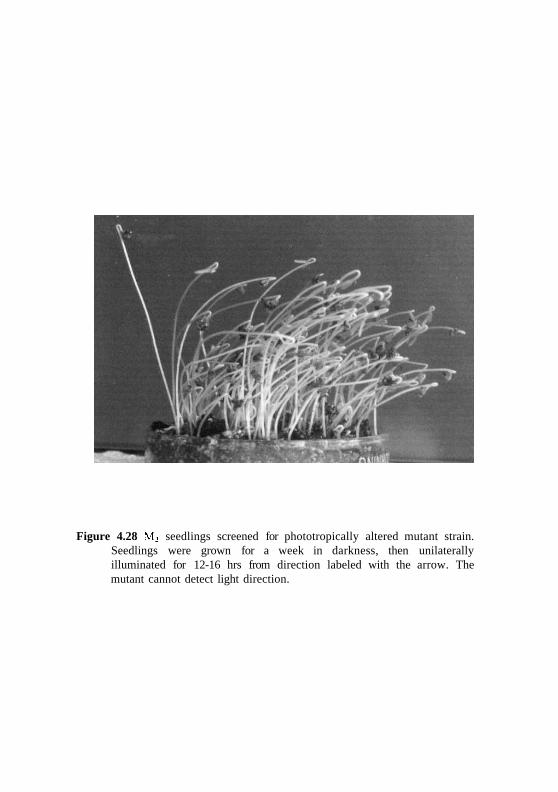
Figure 4.28 M2 seedlings screened for phototropically altered mutant strain.Seedlings were grown for a week in darkness, then unilaterallyilluminated for 12-16 hrs from direction labeled with the arrow. Themutant cannot detect light direction.
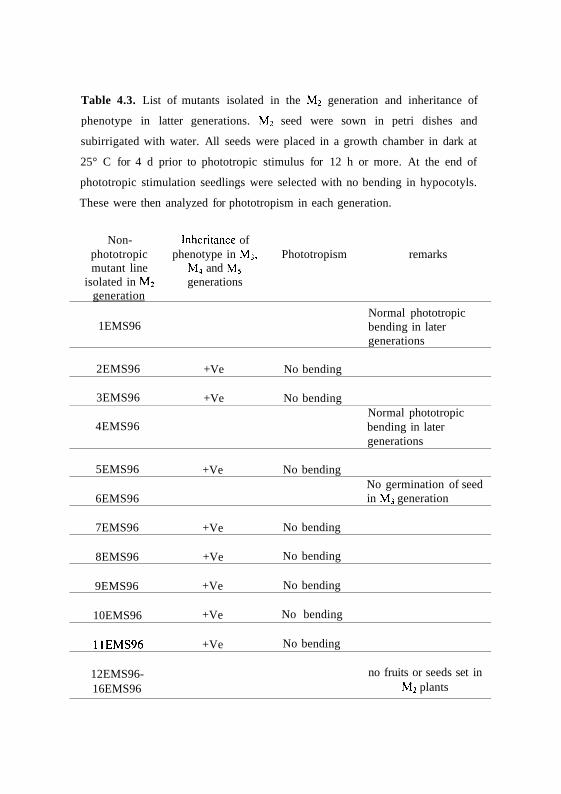
Table 4.3. List of mutants isolated in the M2 generation and inheritance of
phenotype in latter generations. M2 seed were sown in petri dishes and
subirrigated with water. All seeds were placed in a growth chamber in dark at
25° C for 4 d prior to phototropic stimulus for 12 h or more. At the end of
phototropic stimulation seedlings were selected with no bending in hypocotyls.
These were then analyzed for phototropism in each generation.
Non- Inheritance ofphototropic phenotype in M3, Phototropism remarksmutant line M4 and M5
isolated in M2 generationsgeneration
1EMS96
2EMS96
3EMS96
4EMS96
5EMS96
6EMS96
7EMS96
8EMS96
9EMS96
10EMS96
11EMS96
12EMS96-16EMS96
+Ve
+Ve
+Ve
+Ve
+Ve
+Ve
+Ve
+Ve
No bending
No bending
No bending
No bending
No bending
No bending
No bending
No bending
Normal phototropicbending in latergenerations
Normal phototropicbending in latergenerations
No germination of seedin M3 generation
no fruits or seeds set inM2 plants
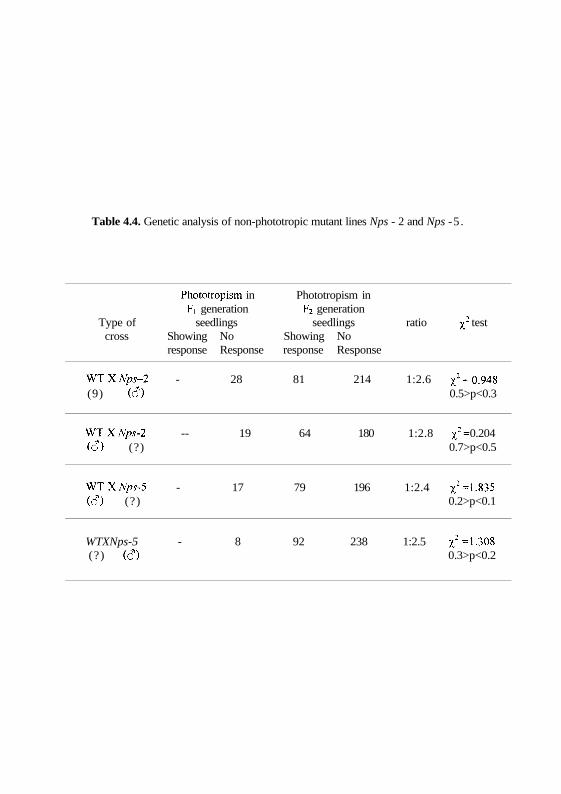
Table 4.4. Genetic analysis of non-phototropic mutant lines Nps - 2 and Nps -5 .
Phototropism in Phototropism inFi generation F2 generation
Type of seedlings seedlings ratio ^2 testcross Showing No Showing No
response Response response Response
WTXNps-2 - 28 81 214 1:2.6 x2 =0.948
(9) (c?) 0.5>p<0.3
W T X % - 2 -- 19 64 180 1:2.8 x2= 0.204
(<?) (?) 0.7>p<0.5
WTXNps-5 - 17 79 196 1:2.4 JJ2-1.835(6) (?) 0.2>p<0.1
WTXNps-5 - 8 92 238 1:2.5 x2 "1-308(?) (61) 0.3>p<0.2
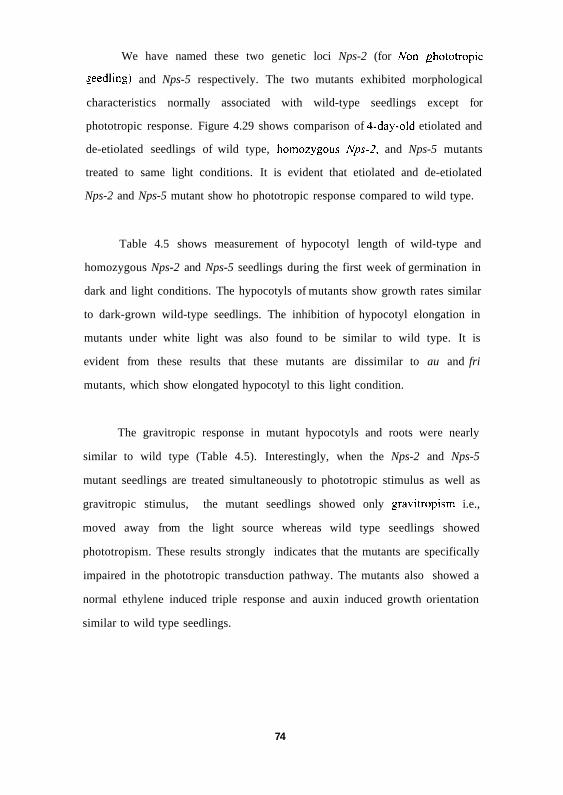
We have named these two genetic loci Nps-2 (for /Von phototropic
needling) and Nps-5 respectively. The two mutants exhibited morphological
characteristics normally associated with wild-type seedlings except for
phototropic response. Figure 4.29 shows comparison of 4-day-old etiolated and
de-etiolated seedlings of wild type, homozygous Nps-2, and Nps-5 mutants
treated to same light conditions. It is evident that etiolated and de-etiolated
Nps-2 and Nps-5 mutant show ho phototropic response compared to wild type.
Table 4.5 shows measurement of hypocotyl length of wild-type and
homozygous Nps-2 and Nps-5 seedlings during the first week of germination in
dark and light conditions. The hypocotyls of mutants show growth rates similar
to dark-grown wild-type seedlings. The inhibition of hypocotyl elongation in
mutants under white light was also found to be similar to wild type. It is
evident from these results that these mutants are dissimilar to au and fri
mutants, which show elongated hypocotyl to this light condition.
The gravitropic response in mutant hypocotyls and roots were nearly
similar to wild type (Table 4.5). Interestingly, when the Nps-2 and Nps-5
mutant seedlings are treated simultaneously to phototropic stimulus as well as
gravitropic stimulus, the mutant seedlings showed only gravitropism i.e.,
moved away from the light source whereas wild type seedlings showed
phototropism. These results strongly indicates that the mutants are specifically
impaired in the phototropic transduction pathway. The mutants also showed a
normal ethylene induced triple response and auxin induced growth orientation
similar to wild type seedlings.
74
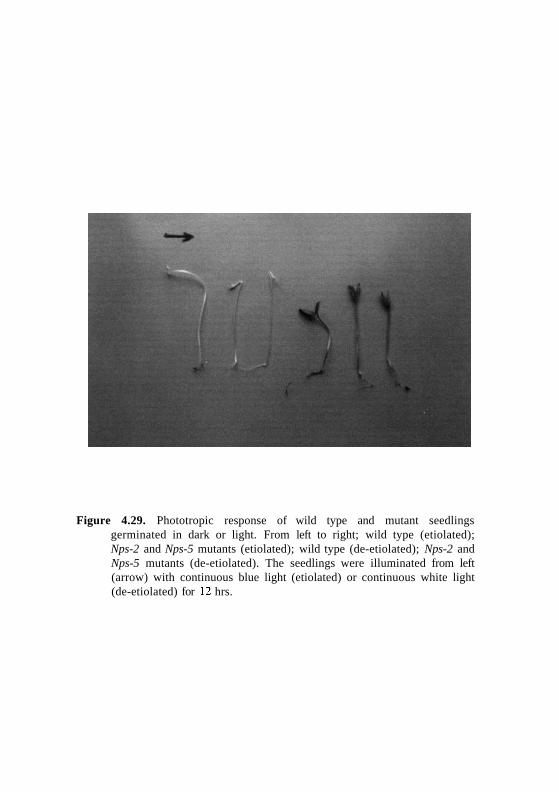
Figure 4.29. Phototropic response of wild type and mutant seedlingsgerminated in dark or light. From left to right; wild type (etiolated);Nps-2 and Nps-5 mutants (etiolated); wild type (de-etiolated); Nps-2 andNps-5 mutants (de-etiolated). The seedlings were illuminated from left(arrow) with continuous blue light (etiolated) or continuous white light(de-etiolated) for 12 hrs.
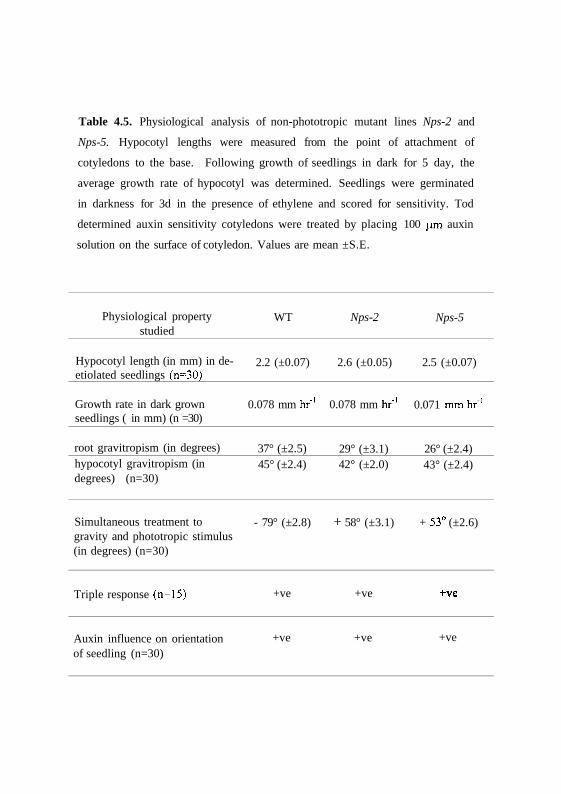
Table 4.5. Physiological analysis of non-phototropic mutant lines Nps-2 and
Nps-5. Hypocotyl lengths were measured from the point of attachment of
cotyledons to the base. Following growth of seedlings in dark for 5 day, the
average growth rate of hypocotyl was determined. Seedlings were germinated
in darkness for 3d in the presence of ethylene and scored for sensitivity. Tod
determined auxin sensitivity cotyledons were treated by placing 100 (im auxin
solution on the surface of cotyledon. Values are mean ±S.E.
Physiological propertystudied
Hypocotyl length (in mm) in de-etiolated seedlings (n=30)
Growth rate in dark grownseedlings ( in mm) (n =30)
root gravitropism (in degrees)hypocotyl gravitropism (indegrees) (n=30)
Simultaneous treatment togravity and phototropic stimulus(in degrees) (n=30)
Triple response (n=15)
Auxin influence on orientationof seedling (n=30)
WT
2.2 (±0.07)
0.078 mm hr"1
37° (±2.5)45° (±2.4)
- 79° (±2.8)
+ve
+ve
Nps-2
2.6 (±0.05)
0.078 mm hr"1
29° (±3.1)42° (±2.0)
+ 58° (±3.1)
+ve
+ve
Nps-5
2.5 (±0.07)
0.071 mmhr"1
26° (±2.4)43° (±2.4)
+ 53° (±2.6)
+ve
+ve

4.20 SEED GERMINATION IN au,hp-l
Although tomato is an example of a D-germinating species, there is
evidence that the FR-absorbing form of phytochrome present in seeds is a
prerequisite for germination. This was tested in the wild type and au,hp-l
double mutant which has a phenotype closer to au than hp-1. Seed of WT were
germinated on wet filter paper under total darkness or continuous red or blue or
white light and subsequently the germination of each population were
measured. Figure 4.30 A. shows a comparison of germination of wild-type
under different light conditions. The germination of seed in dark started after
two days and reached a maximum after 4 days, thereafter the germination
decreased. Compared to the germination of wild type seed in dark, white or red
light treatments was found to reduce and inhibit germination. Figure 4.30 B
shows comparison of germination in wild type and au, au,hp-l and hp-1
mutants. In darkness the au and ait,hp-1 mutants showed a reduction in seed
germination, however, hp-1 mutant seed germinated similar to wild type. In
contrast, under white or red light conditions au and auhp-1 mutants germinated
well. Thus, it appears that phytochrome inhibits germination in red or blue or
white light in wild type and the germination response of au,hp-1 is similar to
au mutant.
4.21 CHLOROPLAST DEVELOPMENT IN au MUTANT
The appearance of proteins of the oxygen-evolving complex, involved in
water oxidation in photosynthesis, is known to be controlled by phytochrome
and it has been demonstrated that the phytochrome is able to modulate the rate
of transcription of the corresponding nuclear genes. To study the effect of
deficiency of phytochrome on appearance of these proteins, the chloroplast
development was compared in wild type and au mutant in a short
75

Figure 4.30. Germination of wild type seed with number of days in dark and white
or red light conditions (A) and comparison of germination in mutant seed
with wild type (B) in dark or white light or red light or blue light of 4 day-
old treated seed.
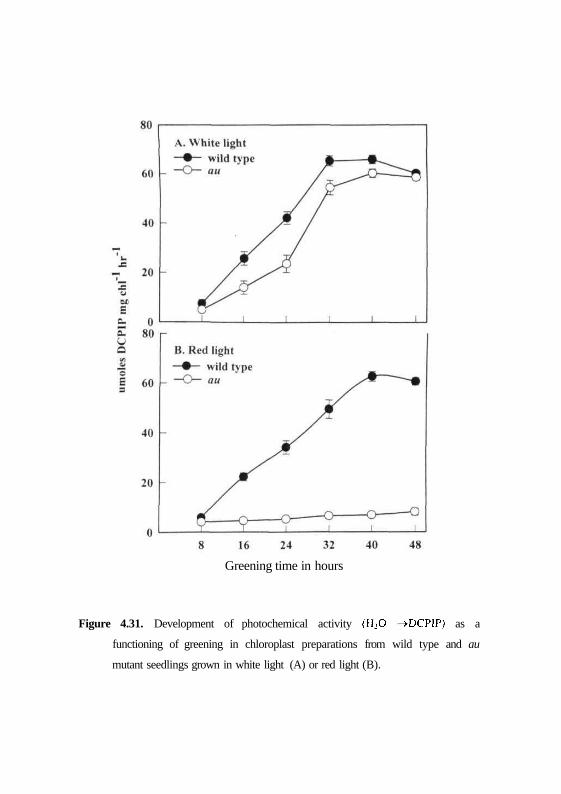
physiological time frame of up to 48 hrs under different light conditions by
photoreduction of water oxidizing complex. Wavelength dependence for
chloroplast development was monitored by measuring Hill reaction
development. PSI1 activity was measured spectrophotometrically by the
photoreduction of DCPIP with water as electron donor. No activity could be
detected within the first 8 h of greening for either wild type or mutant thylakoid
membranes both in white light and red light (Fig. 4.31). In white light, the rate
of development of activity after this lag, however, was faster in the wild type
than in the mutant. Although consistently high levels of activities were
observed in wild type plastid preparations, both wild type and mutant samples
had achieved maximal activities at 48 h of greening. The activities peaked after
40 h and stable activities were not obtained until at least 48 h of greening (Fig.
4.31 A).
Compared to this normal development of mutant under white light a
different pattern was followed under red light. In red light, photochemical
activity of wild type showed steady increase after 8 h and reached a peak at 40
h followed by stable activity at 48 h of greening. In contrast an mutant did not
develop any photochemical activities after 40 h of greening and with a very
insignificant level of activity at 48 h of greening (Fig. 4.3IB). These results
correlate well with phytochrome function and since an is deficient in
phytochrome, its chloroplast development is blocked or arrested specifically
under red light.
76
Greening time in hours
Figure 4.31. Development of photochemical activity (H2O ->DCPIP) as a
functioning of greening in chloroplast preparations from wild type and au
mutant seedlings grown in white light (A) or red light (B).