Results from the 2015 Programme for International … · Programme for International Student...
54
© 2016 THE EDUCATION TRUST Results from the 2015 Programme for International Student Assessment (PISA): How does the United States compare to other nations? December 2016
Transcript of Results from the 2015 Programme for International … · Programme for International Student...
© 2016 THE EDUCATION TRUST
Results from the 2015Programme for International Student
Assessment (PISA):
How does the United States compare to other nations?
December 2016

© 2016 THE EDUCATION TRUST© 2016 THE EDUCATION TRUST
How has U.S. performance on PISA changed over time?

© 2016 THE EDUCATION TRUST© 2016 THE EDUCATION TRUST
Subject
2000Rank (out
of 26)
2003 Rank
(out of 26)
2006 Rank
(out of 26)
2009 Rank
(out of 26)
2012Rank
(out of 26)
2015 Rank
(out of 26)
Reading 13th 14th n/a Tied 10th 14th 16th
Mathematics 17th 22nd 22nd Tied 20th 22nd 24th
Science 13th Tied 17th 19th 13th 16th 15th
Source: National Center for Education Statistics, 2016
Note: Rankings are for the 26 countries that were members of the OECD and participated in PISA in 2000, 2003, 2006, 2009, 2012, and 2015 and include Luxembourg despite changes to assessment conditions beginning in 2003. 2006 results for U.S. reading performance are not available. Rankings for this chart only are based on rounded scale scores.
Performance Among the 26 OECD Countries Continuously Participating in PISA Since 2000
U.S. Stagnant or Falling Relative to Other Countries

© 2016 THE EDUCATION TRUST© 2016 THE EDUCATION TRUST
504495
500
498
497489
502
497496
483474
487481
470
350
400
450
500
550
600
2000 2003 2006 2009 2012 2015
Ave
rage
sca
le s
core
U.S. Performance on PISA over time – All subjects
Reading
Science
Mathematics
*
Note: Possible scores range from 0 to 1,000. Trends are not available from 2000 for all subjects due to revised assessment frameworks; 2006 results for U.S. reading performance are not available. * indicates score is significantly different from 2012 score at the p<.05 level. Source: National Center for Education Statistics, 2016 https://nces.ed.gov/surveys/pisa/pisa2015/pisa2015highlights_6.asp
Performance in all subjects has remained stagnant, or
dropped since the beginning of the assessments

© 2016 THE EDUCATION TRUST© 2016 THE EDUCATION TRUST
483474
487481
470
500 498 499496
490
350
400
450
500
550
600
2003 2006 2009 2012 2015
Ave
rage
sca
le s
core
U.S. Performance on PISA over time – Math
United States
OECD*
Note: Possible scores range from 0 to 1,000. * indicates score is significantly different from the 2012 score at the p<.05 level
Source: National Center for Education Statistics, 2016 https://nces.ed.gov/surveys/pisa/pisa2015/pisa2015highlights_6.asp
Math scores have fallen significantly since 2009

© 2016 THE EDUCATION TRUST© 2016 THE EDUCATION TRUST
489
502
497 496
498
501
501
493
350
400
450
500
550
600
2006 2009 2012 2015
Ave
rage
sca
le s
core
U.S. Performance on PISA over time – Science
United States
OECD
Source: National Center for Education Statistics, 2016 https://nces.ed.gov/surveys/pisa/pisa2015/pisa2015highlights_6.asp
U.S. Science scores have followed similar
trends to the OECD average
Note: Possible scores range from 0 to 1,000. * indicates score is significantly different from the 2012 score at the p<.05 level

© 2016 THE EDUCATION TRUST© 2016 THE EDUCATION TRUST
504495 500
498 497496 497490
496
498
493
350
400
450
500
550
600
2000 2003 2006 2009 2012 2015
Ave
rage
sca
le s
core
U.S. Performance on PISA over time – Reading
United States
OECD
Note: Possible scores range from 0 to 1,000. * indicates score is significantly different from the 2012 score at the p<.05 level. 2006 results for U.S. reading performance are not available. Source: National Center for Education Statistics, 2016 https://nces.ed.gov/surveys/pisa/pisa2015/pisa2015highlights_6.asp
U.S. performance on reading has been
consistent

© 2016 THE EDUCATION TRUST© 2016 THE EDUCATION TRUST
How have results of the highest and lowest achieving students in the U.S.
changed over time?

© 2016 THE EDUCATION TRUST
Source: National Center for Education Statistics, 2016 https://nces.ed.gov/surveys/pisa/pisa2015/pisa2015highlights_6.asp
356 358 368 368355
418 411425 418 408
483 474487 481
470
550537
551 543532
607593
607 600585
300
350
400
450
500
550
600
650
700
2003 2006 2009 2012 2015
Ave
rage
sca
le s
core
PISA – Math
10th percentile
25th percentile
Average
75th percentile
90th percentile
Scores fell in 2015 for all levels of performers in math
© 2016 THE EDUCATION TRUST
Source: National Center for Education Statistics, 2016 https://nces.ed.gov/surveys/pisa/pisa2015/pisa2015highlights_6.asp
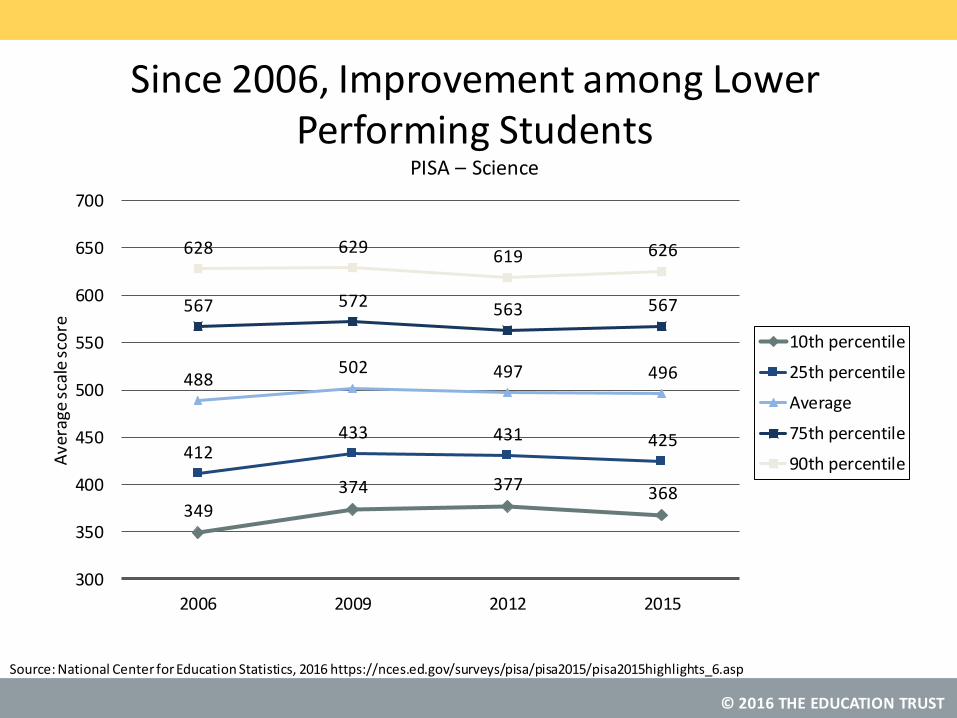
349374 377 368
412433 431 425
488502 497 496
567 572 563 567
628 629619 626
300
350
400
450
500
550
600
650
700
2006 2009 2012 2015
Ave
rage
sca
le s
core
PISA – Science
10th percentile
25th percentile
Average
75th percentile
90th percentile
Since 2006, Improvement among Lower Performing Students

© 2016 THE EDUCATION TRUST
Source: National Center for Education Statistics, 2016 https://nces.ed.gov/surveys/pisa/pisa2015/pisa2015highlights_6.asp
363 319
372 378364
436429 433
436 430
504495 500
498 497
577
568 569561 568
636622 625
614 624
300
350
400
450
500
550
600
650
700
2000 2003 2009 2012 2015
Ave
rage
sca
le s
core
PISA – Reading
10th percentile
25th percentile
Average
75th percentile
90th percentile
Performance in reading has been stagnant in reading for 15 year olds

© 2016 THE EDUCATION TRUST© 2016 THE EDUCATION TRUST
The most recent results by subject

© 2016 THE EDUCATION TRUST© 2016 THE EDUCATION TRUST
2015 Math

© 2016 THE EDUCATION TRUST
Source:
Of 35 OECD Countries, U.S.A. Ranks 31st in Math Literacy
U.S.A.OECD
Higher than U.S. average Not measurably different from U.S. average Lower than U.S. average
National Center for Education Statistics, 2016 https://nces.ed.gov/surveys/pisa/pisa2015/pisa2015highlights_5.asp
300
350
400
450
500
550
Japa
n
Kor
ea,
Rep
ublic
of
Swit
zerl
and
Esto
nia
Can
ada
Ne
the
rlan
ds
Den
mar
k
Fin
lan
d
Slo
veni
a
Ge
rman
y
Pol
and
Irel
and
No
rway
Au
stri
a
Ne
w Z
eal
and
Swe
den
Au
stra
lia
Fran
ce
Un
ite
d Ki
ngd
om
Cze
ch R
epu
blic
Por
tuga
l
OEC
D a
vera
ge
Ital
y
Icel
and
Spai
n
Luxe
mb
our
g
Latv
ia
Hu
nga
ry
Slo
vak
Re
pub
lic
Isra
el
Un
ite
d St
ate
s
Gre
ece
Ch
ile
Turk
ey
Mex
ico
Ave
rage
sca
le s
core
Math, 2015 – All Students
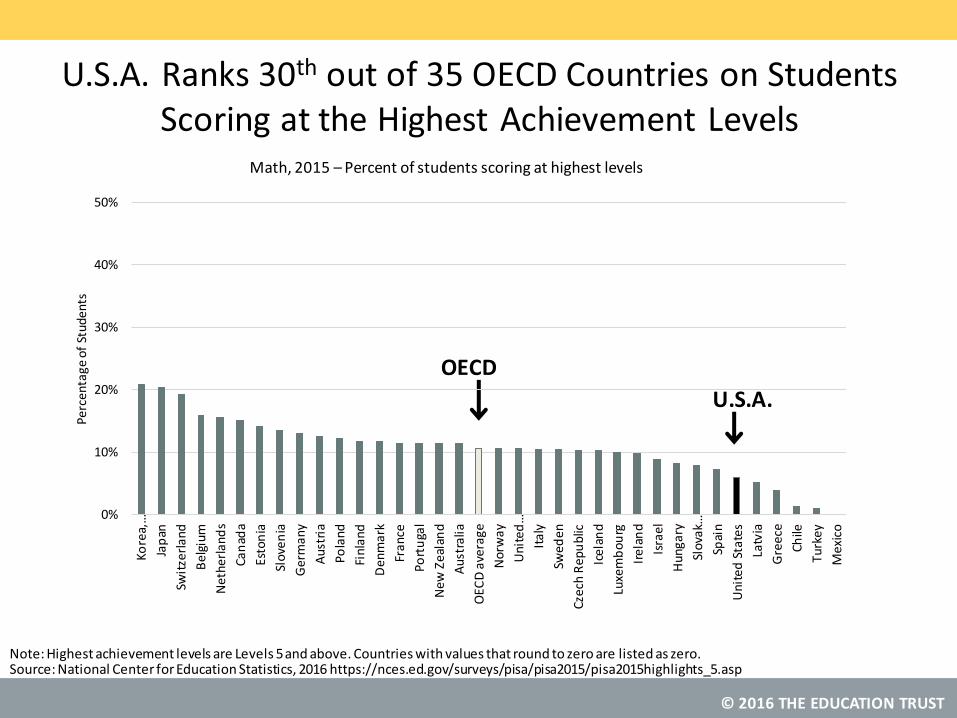
© 2016 THE EDUCATION TRUST
Source: National Center for Education Statistics, 2016 https://nces.ed.gov/surveys/pisa/pisa2015/pisa2015highlights_5.asp
U.S.A. Ranks 30th out of 35 OECD Countries on Students Scoring at the Highest Achievement Levels
U.S.A.
OECD
Note: Highest achievement levels are Levels 5 and above. Countries with values that round to zero are listed as zero.
0%
10%
20%
30%
40%
50%
Ko
rea,
…
Jap
an
Swit
zerl
and
Bel
gium
Net
herl
and
s
Ca
nad
a
Esto
nia
Slo
ven
ia
Ger
man
y
Aus
tria
Pola
nd
Fin
lan
d
Den
mar
k
Fran
ce
Port
uga
l
New
Zea
lan
d
Aus
tral
ia
OEC
D a
vera
ge
No
rwa
y
Un
ited
…
Ital
y
Swed
en
Czec
h R
epu
blic
Icel
and
Luxe
mb
ourg
Ire
lan
d
Isra
el
Hun
gary
Slov
ak…
Spai
n
Un
ited
Sta
tes
Latv
ia
Gre
ece
Ch
ile
Turk
ey
Mex
ico
Perc
enta
ge o
f St
uden
ts
Math, 2015 – Percent of students scoring at highest levels

© 2016 THE EDUCATION TRUST
Source: National Center for Education Statistics, 2016 https://nces.ed.gov/surveys/pisa/pisa2015/pisa2015highlights_5.asp
U.S.A. Ranks 30th out of 35 OECD Countries in the Math Achievement of the Highest-Performing Students
Note: Highest-performing students are those at the 90th Percentile.
OECD U.S.A.
350
400
450
500
550
600
650
700
Ave
rage
sca
le s
core
Math, 2015 – 90th Percentile Score

© 2016 THE EDUCATION TRUST
Source: National Center for Education Statistics, 2016 https://nces.ed.gov/surveys/pisa/pisa2015/pisa2015highlights_5.asp
U.S.A. Ranks 28th out of 35 OECD Countries in the Math Achievement of the Lowest-Performing Students
Note: Lowest-performing students are those at the 10th Percentile.
OECD
U.S.A.
250
300
350
400
450
500
Ave
rage
sca
le s
core
Math, 2015 – 10th Percentile Score

© 2016 THE EDUCATION TRUST© 2016 THE EDUCATION TRUST
Neither low-SES students nor high-SES students compare well to their international
counterparts . . .

© 2016 THE EDUCATION TRUST
Source: National Center for Education Statistics, 2016 https://nces.ed.gov/surveys/pisa/pisa2015/pisa2015highlights_5.asp
U.S.A. Ranks 29th out of 35 OECD Countries in the Math Achievement of High-SES Students
U.S.A.OECD
350
400
450
500
550
600
Kore
a, R
epub
lic o
f
Jap
an
Swit
zerl
and
Esto
nia
Ger
man
y
Net
herl
and
s
Fran
ce
Finl
and
Slov
enia
Cze
ch R
epub
lic
Can
ada
Po
rtu
gal
Pola
nd
Luxe
mbo
urg
Den
mar
k
Irel
and
Au
stri
a
Swe
de
n
New
Zea
lan
d
Au
stra
lia
Un
ited
Kin
gdom
Hun
gary
No
rway
OEC
D a
vera
ge
Spai
n
Ital
y
Slo
vak
Rep
ub
lic
Icel
and
Un
ited
Sta
tes
Latv
ia
Isra
el
Gre
ece
Chi
le
Turk
ey
Mex
ico
Ave
rag
e S
cale
Sco
re
Math, 2015 – High-SES Students
Note: High SES students are those in the top quartile of the ESCS index in their country. The ESCS (Index of Economic, Social , and Cultural Status) is comprised of information related to parents’ occupational status, parents’ educational attainment, family wealth, home educational resources, and possessions related to “classical” culture in the home.

© 2016 THE EDUCATION TRUST
Source:
U.S.A. Ranks 28th out of 35 OECD Countries in the Math Achievement of Low-SES Students
Note: Low SES students are those in the bottom quartile of the ESCS index in their country. The ESCS (Index of Economic, Social, and Cultural Status) is comprised of information related to parents’ occupational status, parents’ educational attainment, family wealth, home educational resources, and possessions related to “classical” culture in the home.
U.S.A.
OECD
National Center for Education Statistics, 2016 https://nces.ed.gov/surveys/pisa/pisa2015/pisa2015highlights_5.asp
350
400
450
500
550
600
Jap
an
Esto
nia
Can
ada
Kore
a, R
epub
lic o
f
De
nm
ark
Swit
zerl
and
Finl
and
Net
herl
and
s
Slov
enia
No
rway
Pola
nd
Irel
and
Ger
man
y
Icel
and
Un
ited
Kin
gdom
Au
stra
lia
Au
stri
a
New
Zea
land
Swed
en
Ital
y
OEC
D a
vera
ge
Po
rtu
gal
Latv
ia
Spai
n
Fra
nce
Cze
ch R
epub
lic
Luxe
mbo
urg
Un
ited
Sta
tes
Slov
ak R
epu
blic
Hun
gary
Gre
ece
Isra
el
Turk
ey
Mex
ico
Chi
le
Ave
rage
sca
le s
core
Math, 2015 – Low-SES Students

© 2016 THE EDUCATION TRUST
Source:
431
542
428
529
442
532
431
517
0
100
200
300
400
500
600
Low SES High SES
PISA, 2003-2015, by student SES level
Math results declined for both low and high-SES students between 2012 and 2015. Today, results for low-SES students are the same as they were in 2003,
while for high-SES students, math scores are lower than they were 12 years ago.
National Center for Education Statistics, 2016 https://nces.ed.gov/surveys/pisa/pisa2015/pisa2015highlights_3.asp
2006 2012 2015 2006 2012 2015
Ave
rage
sca
le s
core
Note: High SES students are those in the top quartile of the ESCS index in their country. Low SES students are those in the bottom quartile. The ESCS (Index of Economic, Social, and Cultural Status) is comprised of information related to parents’ occupational status, parents’ educati onal attainment, family wealth, home educational resources, and possessions related to “classical” culture in the home. N/A = Scores by ESCS level are not publicly available for this year.
2003 2003 2009
N/AN/A
2009

© 2016 THE EDUCATION TRUST
Gaps between low-SES and high-SES students are large . . .

© 2016 THE EDUCATION TRUST
Source:
The U.S. Gap Between High-SES and Low-SES Students is Equivalent to Over Two Years of Schooling
National Center for Education Statistics, 2016 https://nces.ed.gov/surveys/pisa/pisa2015/pisa2015highlights_5.asp
U.S.A.OECD
350
400
450
500
550
600
Mex
ico
Turk
ey
Icel
and
Nor
way
Latv
ia
Cana
da
Esto
nia
Den
mar
k
Fin
land
Slo
veni
a
Irel
and
Gre
ece
Ital
y
Japa
n
Pola
nd
Ne
the
rla
nd
s
Uni
ted
King
dom
Sp
ain
OEC
D a
vera
ge
Aus
tral
ia
Un
ited
Sta
tes
New
Zea
land
Ger
man
y
Aus
tria
Swed
en
Swit
zerl
and
Isra
el
Kore
a, R
epub
lic o
f
Slo
vak
Rep
ublic
Ch
ile
Port
ugal
Cze
ch R
ep
ub
lic
Fran
ce
Luxe
mbo
urg
Hu
ngar
y
Ga
p i
n A
vera
ge S
cale
Sco
re
Math, 2015 – Gaps in low- and high- SES performance
Note: High SES students are those in the top quartile of the ESCS index in their country. Low SES students are those in the bottom quartile. The ESCS (Index of Economic, Social, and Cultural Status) is comprised of information related to parents’ occupational status, parents’ educati onal attainment, family wealth, home educational resources, and possessions related to “classical” culture in the home.

© 2016 THE EDUCATION TRUST© 2016 THE EDUCATION TRUST
Within the United States, performance varies widely
across groups of students . . .

© 2016 THE EDUCATION TRUST
Source:
PISA results indicate that U.S. schools are equipping white and Asian students with higher levels of
preparation in Math.
499
419
446
498490
350
400
450
500
550
600
White African American Latino Asian OECD Average
Ave
rage
sca
le s
core
Math, 2015 – U.S. results by race/ ethnicity
National Center for Education Statistics, 2016 https://nces.ed.gov/surveys/pisa/pisa2015/pisa2015highlights_5.asp

© 2016 THE EDUCATION TRUST
Source:
Students in high-poverty schools score far below students in low-poverty schools
427
530
490
350
400
450
500
550
600
High-poverty schools Low-poverty schools OECD Average
Ave
rag
e s
cale
sco
re
Math, 2015 – Results by school poverty level
National Center for Education Statistics, 2016 https://nces.ed.gov/surveys/pisa/pisa2015/pisa2015highlights_5.asp
Note: Low income schools are those in which 75% or more of students are eligible for free or reduced price lunch; high income schools are those in which less than 10% are eligible

© 2016 THE EDUCATION TRUST
Source:
2015 Science

© 2016 THE EDUCATION TRUST
Source:
Of 35 OECD Countries, U.S.A. Ranks 19th in Science Literacy
300
350
400
450
500
550
Ave
rage
Sca
le S
core
PISA Science, 2015 – All Students
U.S.A. OECD
Higher than U.S. average Not measurably different from U.S. average Lower than U.S. average
National Center for Education Statistics, 2016 https://nces.ed.gov/surveys/pisa/pisa2015/pisa2015highlights_3.asp

© 2016 THE EDUCATION TRUST
Source:
U.S.A. Ranks 14th out of 35 OECD Countries on Students Scoring at the Highest Achievement Levels
National Center for Education Statistics, 2016 https://nces.ed.gov/surveys/pisa/pisa2015/pisa2015highlights_3.asp
0%
10%
20%
30%
40%
50%
Perc
enta
ge o
f St
uden
ts
Science, 2015 - Percent of students scoring at the highest levels
U.S.A.OECD
Note: Highest achievement levels are Levels 5 and above. Countries with values that round to zero are listed as zero.

© 2016 THE EDUCATION TRUST
Source: National Center for Education Statistics, 2016 https://nces.ed.gov/surveys/pisa/pisa2015/pisa2015highlights_3.asp
350
400
450
500
550
600
650
700
Ave
rag
e s
cale
sco
re
Science, 2015 – 90th Percentile score
U.S.A. Ranks 14th out of 35 OECD Countries in the Science Achievement of the Highest-Performing Students
OECDU.S.A.
Note: Highest-performing students are those at the 90th Percentile

© 2016 THE EDUCATION TRUST
Source: National Center for Education Statistics, 2016 https://nces.ed.gov/surveys/pisa/pisa2015/pisa2015highlights_3.asp
250
300
350
400
450
500
Ave
rage
sca
le s
core
Science, 2015 – 10th Percentile Score
U.S.A. Ranks 21st out of 35 OECD Countries in the Science Achievement of the Lowest-Performing Students
Note: Lowest-performing students are those at the 10th Percentile.
OECD U.S.A.

© 2016 THE EDUCATION TRUST
Source:
The United States’ results for low and high-SES students are similar to OECD
averages for their counterparts.

© 2016 THE EDUCATION TRUST
Source:
350
400
450
500
550
600
Ave
rage
sca
le s
core
Science, 2015 – High- SES Students
National Center for Education Statistics, 2016 https://nces.ed.gov/surveys/pisa/pisa2015/pisa2015highlights_3.asp
U.S.A. Ranks 19th out of 35 OECD Countries in the Science Achievement of High-SES Students
U.S.A. OECD
Note: High SES students are those in the top quartile of the ESCS index in their country. The ESCS (Index of Economic, Social , and Cultural Status) is comprised of information related to parents’ occupational status, parents’ educational attainment, family wealth, home educational resources, and possessions related to “classical” culture in the home.

© 2016 THE EDUCATION TRUST
Source:
350
400
450
500
550
600
Ave
rage
sca
le s
core
Science, 2015 – Low-SES Students
U.S.A. Ranks 18th out of 35 OECD Countries in the Science Achievement of Low-SES Students
U.S.A. OECD
National Center for Education Statistics, 2016 https://nces.ed.gov/surveys/pisa/pisa2015/pisa2015highlights_3.asp
Note: Low SES students are those in the bottom quartile of the ESCS index in their country. The ESCS (Index of Economic, Social, and Cultural Status) is comprised of information related to parents’ occupational status, parents’ educational attainment, family wealth, home educational resources, and possessions related to “classical” culture in the home.

© 2016 THE EDUCATION TRUST
Source:
Scores for low-SES students in the U.S. improved between 2006 and 2015, but most of this improvement happened prior to 2012. Between 2006 and
2015, scores for high-SES students declined.
National Center for Education Statistics, 2016 https://nces.ed.gov/surveys/pisa/pisa2015/pisa2015highlights_3.asp
435
552
456
548
457
546
350
400
450
500
550
600
Low SES High SES
Science, 2006-2015, by student SES level
2006 2012 2015 2006 2012 2015
Ave
rage
sca
le s
core
N/A
2009
N/A
2009
Note: High SES students are those in the top quartile of the ESCS index in their country. Low SES students are those in the bottom quartile. The ESCS (Index of Economic, Social, and Cultural Status) is comprised of information related to parents’ occupational status, parents’ educati onal attainment, family wealth, home educational resources, and possessions related to “classical” culture in the home. N/A = Scores by ESCS level are not publicly available for this year.

© 2016 THE EDUCATION TRUST
Gaps between low-SES and high-SES students are large . . .

© 2016 THE EDUCATION TRUST
Source:
The U.S. Gap Between High-SES and Low-SES Students is Equivalent to Over Two Years of Schooling
350
400
450
500
550
600
Gap
in A
vera
ge S
cale
Sco
re
Science, 2015 – Gaps between low- and high- SES performance
National Center for Education Statistics, 2016 https://nces.ed.gov/surveys/pisa/pisa2015/pisa2015highlights_3.asp
U.S.A.OECD
Note: High SES students are those in the top quartile of the ESCS index in their country. Low SES students are those in the bottom quartile. The ESCS (Index of Economic, Social, and Cultural Status) is comprised of information related to parents’ occupational status, parents’ educati onal attainment, family wealth, home educational resources, and possessions related to “classical” culture in the home.

© 2016 THE EDUCATION TRUST© 2016 THE EDUCATION TRUST
Within the United States, performance varies widely
across groups of students . . .

© 2016 THE EDUCATION TRUST
Source:
PISA results indicate that U.S. schools are equipping white and Asian students with higher levels of
preparation in science.
531
433
470
525
493
350
400
450
500
550
600
White African American Latino Asian OECD Average
Ave
rage
sca
le s
core
Science, 2015 – Performance by race/ ethnic group
National Center for Education Statistics, 2016 https://nces.ed.gov/surveys/pisa/pisa2015/pisa2015highlights_3.asp

© 2016 THE EDUCATION TRUST
Source:
Students in high-poverty schools score far below students in low-poverty schools
446
546
493
350
400
450
500
550
600
High-poverty schools Low-poverty schools OECD Average
Ave
rag
e s
cale
sco
re
Science, 2015 – Performance by school poverty level
National Center for Education Statistics, 2016 https://nces.ed.gov/surveys/pisa/pisa2015/pisa2015highlights_3.asp
Note: High poverty schools are those in which 75% or more of students are eligible for free or reduced price lunch; low poverty schools are those in which less than 10% are eligible
© 2016 THE EDUCATION TRUST
Source:
2015 Reading

© 2016 THE EDUCATION TRUST
Source:
0
100
200
300
400
500
600
Reading, 2015 - All Students
Of 35 OECD Countries, U.S.A. Ranks 20thth
in Reading Literacy
U.S.A. OECD
Higher than U.S. average Not measurably different from U.S. average Lower than U.S. average
National Center for Education Statistics, 2016 https://nces.ed.gov/surveys/pisa/pisa2015/pisa2015highlights_4.asp
Ave
rag
e s
cale
sco
re

© 2016 THE EDUCATION TRUST
Source:
0
2
4
6
8
10
12
14
16
18
20
Reading, 2015 - Percent of students scoring at the highest levels
National Center for Education Statistics, 2016 https://nces.ed.gov/surveys/pisa/pisa2015/pisa2015highlights_4.asp
U.S.A. Ranks 14th out of 35 OECD Countries on Students Scoring at the Highest Achievement Levels
U.S.A.OECD
Note: Highest achievement levels are Levels 5 and above. Countries with values that round to zero are listed as zero.
Pe
rce
nt o
f stu
de
nts

© 2016 THE EDUCATION TRUST
Source:
0
100
200
300
400
500
600
700
800Reading, 2015 - 90th percentile score
National Center for Education Statistics, 2016 https://nces.ed.gov/surveys/pisa/pisa2015/pisa2015highlights_4.asp
U.S.A. Ranks 14th out of 35 OECD Countries in the Reading Achievement of the Highest-Performing Students
Note: Highest-performing students are those at the 90th Percentile.
OECDU.S.A.
Ave
rag
e s
cale
sco
re

© 2016 THE EDUCATION TRUST
Source:
0
50
100
150
200
250
300
350
400
450
500
Irel
and
Esto
nia
Ca
na
da
Fin
lan
d
Jap
an
Kore
a, R
epub
licof
Pola
nd
Den
mar
k
Slo
ven
ia
No
rway
Spai
n
Ge
rma
ny
Port
ugal
Latv
ia
Uni
ted
King
dom
New
Zea
land
Net
herl
ands
Aus
tral
ia
Uni
tedS
tate
s
Swed
en
OEC
D a
vera
ge
Bel
giu
m
Swit
zerl
and
Ital
y
Czec
h R
epub
lic
Icel
an
d
Au
stri
a
Fran
ce
Chile
Hu
ngar
y
Luxe
mb
ou
rg
Gre
ece
Isra
el
Turk
ey
Mex
ico
Slo
vak
Rep
ubl
ic
Reading, 2015 - 10th percentile score
National Center for Education Statistics, 2016 https://nces.ed.gov/surveys/pisa/pisa2015/pisa2015highlights_4.asp
U.S.A. Ranks 19th out of 35 OECD Countries in the Reading Achievement of the Lowest-Performing Students
Note: Lowest-performing students are those at the 10th Percentile.
OECDU.S.A.
Ave
rag
e s
cale
sco
re

© 2016 THE EDUCATION TRUST
Source:
The United States’ results for high-SES students are similar to OECD averages for their counterparts, while results for low-
SES students are somewhat higher.

© 2016 THE EDUCATION TRUST
Source: National Center for Education Statistics, 2016 https://nces.ed.gov/surveys/pisa/pisa2015/pisa2015highlights_4.asp
0
100
200
300
400
500
600
700
Fin
lan
d
Fra
nce
Ger
man
y
Irel
and
Ca
nad
a
Kore
a, R
epub
licof
New
Zea
lan
d
Esto
nia
Jap
an
Bel
gium
Net
herl
and
s
Aus
tral
ia
Pola
nd
Port
uga
l
Luxe
mb
ou
rg
Slov
enia
Swed
en
Czec
h R
epu
blic
No
rwa
y
Swit
zerl
and
Un
ited
Kin
gdom
Den
mar
k
Uni
ted
Stat
es
OEC
D a
vera
ge
Spai
n
Aus
tria
Hun
gary
Ital
y
Latv
ia
Isra
el
Gre
ece
Icel
and
Slo
vak
Re
pu
blic
Chile
Turk
ey
Mex
ico
Reading, 2015 - High SES students
U.S.A. OECD
U.S.A. Ranks 23rd out of 35 OECD Countries in the Reading Achievement of High-SES Students
Ave
rag
e s
cale
sco
re
Note: High SES students are those in the top quartile of the ESCS index in their country. The ESCS (Index of Economic, Social , and Cultural Status) is comprised of information related to parents’ occupational status, parents’ educational attainment, family wealth, home educational resources, and possessions related to “classical” culture in the home.

© 2016 THE EDUCATION TRUST
Source: National Center for Education Statistics, 2016 https://nces.ed.gov/surveys/pisa/pisa2015/pisa2015highlights_4.asp
0
100
200
300
400
500
600
Fin
lan
d
Can
ada
Esto
nia
Irel
and
No
rway
Kor
ea,
Rep
ublic
of
Japa
n
Ge
rman
y
Slo
veni
a
Pol
and
Den
mar
k
Un
ite
d Ki
ngd
om
Ne
the
rlan
ds
Ne
w Z
eal
and
Au
stra
lia
Un
ite
d St
ate
s
Swe
den
Spai
n
Por
tuga
l
Latv
ia
Icel
and
OEC
D a
vera
ge
Bel
giu
m
Swit
zerl
and
Fran
ce
Ital
y
Au
stri
a
Cze
ch R
epu
blic
Isra
el
Gre
ece
Luxe
mb
our
g
Ch
ile
Hu
nga
ry
Turk
ey
Slo
vak
Re
pub
lic
Mex
ico
Reading, 2015 - Low SES Students
U.S.A. OECD
U.S.A. Ranks 16th out of 35 OECD Countries in the Reading Achievement of Low-SES Students
Ave
rag
e s
cale
sco
re
Note: Low SES students are those in the bottom quartile of the ESCS index in their country. The ESCS (Index of Economic, Social, and Cultural Status) is comprised of information related to parents’ occupational status, parents’ educational attainment, family wealth, home educational resources, and possessions related to “classical” culture in the home.

© 2016 THE EDUCATION TRUST
Source:
Scores for low-SES students in the U.S. improved between 2009 and 2015, but most of this improvement happened between 2009 and 2012. Between
2009 and 2015, scores for high-SES students declined.
National Center for Education Statistics, 2016 https://nces.ed.gov/surveys/pisa/pisa2015/pisa2015highlights_3.asp
2012 2015 2012 2015
Ave
rage
sca
le s
core
2009 2009
Note: High SES students are those in the top quartile of the ESCS index in their country. Low SES students are those in the bottom quartile. The ESCS (Index of Economic, Social, and Cultural Status) is comprised of information related to parents’ occupational status, parents’ educati onal attainment, family wealth, home educational resources, and possessions related to “classical” culture in the home. Reading scores by ESCS quartile are not available for years prior to 2009.
451
558
461
546
462
540
350
400
450
500
550
600
Reading, 2009-2015, by student SES level
Low SES High SES
© 2016 THE EDUCATION TRUST
Gaps between low-SES and high-SES students are large . . .

© 2016 THE EDUCATION TRUST
Source:
The gap between high and low-SES students in the United States is slightly smaller than the OECD average.
National Center for Education Statistics, 2016 https://nces.ed.gov/surveys/pisa/pisa2015/pisa2015highlights_4.asp
350
400
450
500
550
600
Icel
and
Turk
ey
No
rway
Esto
nia
Latv
ia
Mex
ico
Can
ada
Den
mar
k
Finl
and
Ko
rea,
Rep
ub
lico
f
Un
ited
Kin
gdom
Jap
an
Slov
enia
Un
ited
Sta
tes
Irel
and
Spai
n
Ital
y
Pola
nd
OEC
D a
vera
ge
Swe
de
n
Au
stra
lia
Chi
le
Net
herl
and
s
Po
rtu
gal
Ger
man
y
Isra
el
Gre
ece
New
Zea
lan
d
Swit
zerl
and
Au
stri
a
Be
lgiu
m
Slov
ak R
epu
blic
Cze
ch R
epub
lic
Hu
nga
ry
Fran
ce
Luxe
mbo
urg
Reading, 2015 - Gap between high and low SES students
U.S.A. OECD
Gap
in A
vera
ge S
cale
Sco
re
Note: High SES students are those in the top quartile of the ESCS index in their country. Low SES students are those in the bottom quartile. The ESCS (Index of Economic, Social, and Cultural Status) is comprised of information related to parents’ occupational status, parents’ educati onal attainment, family wealth, home educational resources, and possessions related to “classical” culture in the home.

© 2016 THE EDUCATION TRUST
Within the United States, performance varies widely
across groups of students . . .

© 2016 THE EDUCATION TRUST
Source:
PISA results indicate that U.S. schools are equipping white and Asian students with higher levels of preparation in reading.
National Center for Education Statistics, 2016 https://nces.ed.gov/surveys/pisa/pisa2015/pisa2015highlights_4.asp
526
443
478
527
493
350
400
450
500
550
600
White Black Hispanic Asian OECD average
Reading, 2015 – Performance by race/ ethnic group
Ave
rag
e s
cale
sco
re

© 2016 THE EDUCATION TRUST
Source: National Center for Education Statistics, 2016 https://nces.ed.gov/surveys/pisa/pisa2015/pisa2015highlights_4.asp
Results of students in the highest-poverty schools were lower than those of students in the lowest-poverty
schools.
Note: High poverty schools are those in which 75% or more of students are eligible for free or reduced price lunch; low poverty schools are those in which less than 10% are eligible
453
548
493
350
400
450
500
550
600
High-poverty Schools Low-poverty schools OECD average
Reading, 2015 – Performance by school poverty level
Ave
rag
e s
cale
sco
re