Results for the First Half of th Fi l Y E di M 31 2014f ... · Edth ilid kfild Employee solutions...
39
Results for the First Half f th Fi lY E di M 31 2014 of the Fiscal Year Ending May 31, 2014 Pasona Group Inc. Fi tS ti TSE (2168) First Section TSE (2168) January 15, 2014 http://www.pasonagroup.co.jp/english Social solution company Social solution company ※ Units in billions of yen have been rounded to the nearest first decimal place. Units in millions of yen have been rounded down.
Transcript of Results for the First Half of th Fi l Y E di M 31 2014f ... · Edth ilid kfild Employee solutions...

Results for the First Halff th Fi l Y E di M 31 2014of the Fiscal Year Ending May 31, 2014
Pasona Group Inc.Fi t S ti TSE (2168)First Section TSE (2168)
January 15, 2014http://www.pasonagroup.co.jp/english
Social solution company
0
Social solution company
※ Units in billions of yen have been rounded to the nearest first decimal place. Units in millions of yen have been rounded down.

1. Summary of the First Half f th Fi l Y E di M 31 2014of the Fiscal Year Ending May 31, 2014
H1 FY2013 (June 1, 2013 - November 30, 2013)
Social solution company
1
Social solution company

Shift in employment conditions
“Third Arrow (New growth strategy) of Abenomics”
Reform of employment structure and systems aim to strengthen human resource capabilities
The Abe administration’s new growth strategy “Japan Revitalization Strategy”
Shift from an employment● Increase job mobility
Shift from an employment maintenance policy to better support labor mobility
Strengthen education and training, internship, and trial employmentprograms
● Promote opportunities that enable women, youngpeople, and the elderly to excel
● Help realize a variety of work styles
Review the worker dispatch system
2
work styles

Regional Revitalization Business
Pasona has handled a wide range of projects for local governmentsthroughout Japan
3
We take the lead to produce regional revitalization projects

Tohoku Reconstruction Support
Pasona is acting as a “motivator for reconstruction” to help build Tohoku’s future
Employment creation support
Job creation through our employment support business
Build long-term relationships of mutual trust with communitiesEmployment creation support
in Rikuzentakatawith communities
Listen carefully to the needs of both clients and job seekers to avoid mismatches
Job support for agriculture and fishery workers(Iwate/Miyagi/Fukushima)
Conduct trainings in cooperation with local NPOs and other organizations in order to raise the motivation of job seekers
4
Operation of the Fukushima Employment Support Center
Successful employment support for more than job seekers

COOL JAPAN Strategy
The Cool Japan Initiative is opening up new markets
Pasona’s initiatives for the current fiscal year y(ending May 2014)
Investment in Cool Japan Fund IncJapan’s
“CulturalInvestment in Cool Japan Fund Inc.
Staffing of “Cool Japan Producers”
Cultural Influence”
Project to uncover and develop the seeds of "Cool Japan"
La nch the Cool Japan
Staffing of Cool Japan Producers
Launch the Cool Japan Global Incubation Center
Create a new “Culture Industry”
5
Open the Star Rise Tower Culture Industry

Support for the Effective Use of Women
Abe administration’s growth strategy “Make Japan a place where women shine”
Nikkei survey of “Companies that Effectively Utilize People”
in the “Diversity Management” category
for Client for Workers
Women in management position(manager and above) 43%
Ratio of women returning to work after giving birth to their first child essentially 100%
Ratio of female directors 23%
00
Women’s Workstyle Service WOMEN’S CAREER COLLEGE
S i l ll f
Pasona supports the effective utilization of women in the workplace.
Social career college for working women – Design the person you want to be.
6
in the workplace.
The Pasona Group provides expertise to further advance the effective utilization of women in the workplace.
Supporting career advancement for working womenPasona’s training for temporary staff opened to the public

“Harness the potential of the individual”
Work
Education
Pasona Group's job isCulture
"Life Produce"
7
Health

2. Progress of Strategic Priority for FY20132. Progress of Strategic Priority for FY2013
Social solution company
8
Social solution company

PASONA GROUP Strategy
O l l Place &
Social Solution CompanyPhase 3
Outplacement Employee fringe benefit
Place & Search
(Domestic/Global)Improveearnings capacity
Temporary Staffing Insourcing
Healthcare Agriculture ChildcareEducation and trainingPhase 2
Expand business scale
Phase 1 New Business Fields
9Society's problems

Strategic Priorities FY2013
l i l i i
FY2011 FY2012 FY2013
Strengthen and expand Insourcing business
Bolstering solution services
Insourcing/BPOCloud solutions
Strengthen solution services
Cloud solutions
Strengthen employee solutionsg p yExpand the specialized work fieldStrengthen strategies
for the Public marketExpand BPO business
Promote environments to facilitate work
Proactive development Cultivate and expand
Further developing global servicesDevelop new bases
10
pof overseas business global business
p
Expand global service menu

Solution services (1)
Expert Services Insourcing/BPO Cloud solutions
Analysis and standardization of work at staffing clients
h k
Pasona contracts for operations(Lessen administrative costs)
haken
I iTransfer to our facilities
Insourcing
BPO(Near/Offshore)
Utilize the cloud (Salesforce) for more efficient operations
(Near/Offshore)
11

Solution services (2)
Development by Cloud market
Salesforce SuccessFactors
Increase in adoption by Japanese companies has made engineers a seller’s market
SalesforceHuman resource management SaaS centered on SAP’s cloud services
SuccessFactors
S t ti t i i f i Start of special alliance between
Established Pasona Tquila Inc. (November 2012) Joint investment Pasona Tquila and Selesforce
CAPLAN Corporation Domestic installation record No.1
Systematic training of engineersutilizing know-how derived from Pasona Tquila
Authorized technicians
Start of special alliance between SAP and CAPLANJoint proposal to existing customers of SAP
CAPLAN Corporation
40 people
200 people
Number of traineeCAPLAN Corporation SAP AWARD “The Best Cloud” 2013SuccessFactors Award “Best Partner of the Year”
12
40 people
H1 FY13 FY14 (Forecast)2011 and 2012

E d th i li d k fi ld
Employee solutions (1)
Expand the specialized work field
Passport for Accounting Skill Standard Financial centerPassport for Accounting Skill Standard Financial centerFull support, from acquiring qualifications as a securities broker to employment
Meet rapidly rising demand
Develop an exam jointly with the Japan Association for CFOs, and encourage staff to take the exam as a direct career development tool specializing in accounting work.
Meet rapidly rising demand from securities companies resulting from NISA(Nippon Individual Savings Account )
OMOTENASHI Crew ProjectWOMEN’S CAREER COLLEGE
Make staff training sessions available to the public
13
Expand the scope of studentsPromote the Pasona brand

Employee solutions (2)
Childcare/ Nursing care Business
Development of various infrastructure aimed at supporting working people
Crowd SourcingChildcare/ Nursing care Business
by
Crowd Sourcing
December 2013f
Pasona Foster Pasona Tech
Web-based job ordering, delivery, and settlementNew style of work unrestrained by time or place
Support for home-based work
Contracted operations of a large child care support facility
Suppo t o o e based o
P Lif C
Market2013 24.6 billion
2017 147 4 billi
Order volume
August 2013Established the Crowd Sourcing Association
Pasona Life CareNovember 2013Opened a new day service facility
2017 147.4 billion(Forecast by Yano Research Institute Ltd.)
14
Established the Crowd Sourcing Associationmanaged by five companies, including Pasona TechEdogawa House
(Minami-kasai)

Global Services
Expand global service menus
October 2013
Benefit One AsiaE bli h d i Si i j i i h
CAPLANTraining in Japanese-style hospitality
Employee fringe benefit/ Incentive Education and training
Established in Singapore in a joint venture with ITOCHU February 2014
ChungHwa Benefit OneEstablished a joint venture with
conducted overseas
Pasona Education
Established a joint venture with Taiwan’s largest carrier “Chunghwa Telecom*”
* Welfare and benefit agency services already provided for approximately 50,000 employees, including Taiwan’s state-run
Training for sales personnel handling such products as cosmetics and high-end automobiles (in Vietnam)
Pasona EducationStrengthen management training
, p y , genterprises⇒ Transfer business to new company, expand
and strengthen businessManagerial training in India
Overseas training programs in Hong Kong
15
Gradually expand to Thailand and Indonesia
Overseas training programs in Hong Kong for companies and universities“Pasona Global Edge”

3. Overview of the First Half of the Fi l Y E di M 31 2014Fiscal Year Ending May 31, 2014
Social solution company
16※ Units in billions of yen have been rounded to the nearest first decimal place. Units in millions of yen have been rounded down.
Social solution company

(Billi f )
Consolidated Results for H1 FY2013
103.0 108.5 102.6
(Billions of yen)YoY (0.3)%
+45.3%
0.71 (0.45)
1.04 (0.03)
0.9 (0.1)
Net Sales Operating Income Net Lossp g
(Millions of yen) H1 FY12 to net sales%
H1 FY13 to net sales% H1 FY13 to net sales
%vs FY12 YoY vs Forecast %
H1 FY12 H1 FY13Results
H1 FY12 H1 FY12H1 FY13Forecast
H1 FY13Results
H1 FY13Forecast
H1 FY13Results
H1 FY13Forecast
(Millions of yen) H1 FY12 % Forecast % H1 FY13 % Increase/DecreaseYoY
Increase/Decrease%
Net sales 102,976 100.0 108,500 100.0 102,619 100.0 (356) (0.3)% (5,880) (5.4)%
Cost of sales 83,905 81.5 - - 83,208 81.1 (696) (0.8)% - -
Gross profit 19,070 18.5 - - 19,410 18.9 340 1.8% - -
SG&A 18 355 17 8 18 372 17 9 16 0 1%
17
SG&A expenses 18,355 17.8 - - 18,372 17.9 16 0.1% - -
Operating income 714 0.7 880 0.8 1,038 1.0 323 45.3% 158 18.0%
Ordinary income 692 0.7 820 0.8 961 0.9 268 38.8% 141 17.3%
Net income(loss) (454) - (110) - (25) - 429 - 84 -

Consolidated Results by Segment(Millions of yen)( y )
Segment H1FY12 H1FY13Increase/Decrease YoY H1FY12 H1FY13
Increase/Decrease YoY H1FY12 H1FY13
Increase/Decrease
Operating incomeNet sales Operating income margin
1 Expert Services 65,325 62,198 (3,126) (4.8)%
2 Insourcing 18,657 18,967 309 1.7%
3 HR Consulting, others 1,885 2,036 151 8.1%3 HR Consulting, others 1,885 2,036 151 8.1%
4 Place & Search 1,461 1,558 97 6.6%
5 Global Sourcing 1,323 1,720 396 29.9%
(8.0)%1,276 1,173 (102) 1.4% 1.4% (0.0)pt
88,654 86,482 (2,172) (2.5)%
6 Outplacement 5,746 5,644 (101) (1.8)% 916 796 (120) (13.1)% 16.0% 14.1% (1.9)pt
7 Outsourcing 8,176 9,436 1,260 15.4% 875 965 90 10.3% 10.7% 10.2% (0.5)pt
Subtotal
8 Life Solutions Public Solutions Shared
1,966 2,547 581 29.6% 18 8 (10) (54.3)% 0.9% 0.3% (0.6)pt
9 Eliminations and Corporate (1,567) (1,492) 74 - (2,371) (1,905) 466 - - - -
18
p ( , ) ( , ) ( , ) ( , )
10 Total 102,976 102,619 (356) (0.3)% 714 1,038 323 45.3% 0.7% 1.0% 0.3pt

Gross Profit, SG&A expenses(Billions of yen)(Billions of yen)
YoY
YoY+0.02
Gross Profit SG&A expenses(Billions of yen)
I i Personnel OtherRent
(Billions of yen)
18.36 18.3719.07 19.41
+0.34
+0.41+0.01 (0.02) +0.02
(0.07)
Increase in revenues
Increase ingross profit
margin
Personnelexpenses
Otherexpenses
+1.8%
+0.1%Rent
Rise ingross profit margin 18.5% → 18.9%
+0 4pt
SG&A expense ratio17.8% → 17.9%+0 1pt
H1 FY12 H1 FY13H1 FY12 H1 FY13
+0.4pt +0.1pt
(Billions of yen)Inc ease/
(Billions of yen)
H1 FY12 H1 FY13 Increase/Decrease
Gross profit 19.07 19.41 +0.34Gross profit margin 18 5% 18 9% +0 4pt
H1 FY12 H1 FY13 Increase/Decrease
Personnel 10.63 10.65 +0.01Advertisement andrecruitment 0.51 0.53 +0.02
IT 0.99 0.97 (0.02)Rent 1 86 1 84 (0 02)
19
Gross profit margin 18.5% 18.9% +0.4pt Rent 1.86 1.84 (0.02)Others 4.37 4.39 +0.01
Total 18.36 18.37 +0.02SG&A expense ratio 17.8% 17.9% +0.1pt

Non-operating/Extraordinary income, Others
(Millions of yen)
H1 FY12 H1 FY13 Increase/Decrease
YoY
714 1,038 323 45.3%
Non-operating income 125 118 (7) (5.6)%
Non-operating expenses 147 195 47 32.2%
Operating income
Non operating expenses 147 195 47 32.2%
692 961 268 38.8%
Extraordinary income 0 0 0 -
Ordinary income
Extraordinary loss 38 40 2 7.6%
654 920 266 40.6%Income before income taxes
Income taxes-current 716 666 (49) (6.9)%
Income taxes-deferred 91 15 (75) (82.7)%
Minority interests in income 301 263 (38) (12 6)%
20
Minority interests in income 301 263 (38) (12.6)%
(454) (25) 429 -Net income (loss)

Financial Condition and Cash Flows
70 9 71 3
Total Assets Shareholder's Equity Equity Ratio
Total Assets, Shareholders’ Equity, Equity RatioFinancial Position
Liabilities ¥ 42.8 billion
Liabilit
(Billions of yen)
As of November 30, 2013•Figures in parentheses indicate changes from the end ofthe previous fiscal year.
70.9 71.3 68.5
29.0% 29.3% 29.9%
Total Assets¥ 68.5 billion
(- ¥2.8 billion)
(- ¥ 2.2 billion)
Shareholders’ Equity N
ties
20.5 20.9 20.5
May 31,2012
May 31,2013
November 30,2013
Minority Interests¥ 5.2 billion
( ¥ 0 1 billion)
qu ty¥ 20.5 billion
(- ¥ 0.4 billion )
et Assets
2012 2013 2013(- ¥ 0.1 billion)
May 31,2013
Nov30,2013
Increase/Decrease
Current assets 47.8 44.2 (3.7)
(Billions of yen)
・ Decrease in cash and deposits ・ Increase in notes and accounts receivable-trade
¥(4.9) billion¥1.1 billion
Noncurrent assets 23.4 24.3 0.9
Total assets 71.3 68.5 (2.8)
Current liabilities 33.7 31.8 (2.0)・ Decrease in accounts payable-trade ・ Increase in income taxes payable
¥(1.0) billion¥(0.8) billion
・ Investments and other assets ¥0.8 billion
21
¥(1.3) billion¥(1.4) billion
Noncurrent liabilities 11.3 11.0 (0.3)
Total liabilities 45.0 42.8 (2.2)
Total net assets 26.3 25.7 (0.5)
・ Decrease in minority interests・ Dividends paid
¥(0.1) billion¥(0.4) billion

Cash Flows
Cash Flows
YoY Increase/DecreaseItem of Increase/Decrease
H1 FY12 H1 FY13 Increase/Decrease
Cash flows from operating activities (0.7) (2.2) (1.5)
(Billions of yen)
・ Income before income taxes¥0.3 billions
・ Decrease in provision for retirement benefits ¥(0.4) billions
・ Increase in operating debt ¥(0.3) billions
・ Decrease in notes and accounts i bl t d ¥(0 3) billi
・ Income before income taxes¥0.9 billions
・ Depreciation and amortization¥1.2 billions
・ Increase in notes and accountsreceivable-trade ¥(1.0) billions
・ Decrease in operating debt Cash flows from
investing activities (3.0) (2.5) 0.5Cash flows from
financing activities (3.7) (0.3) 3.4Cash and cash
15 6 15 1 (0 5)
receivable-trade ¥(0.3) billions ・ Income taxes paid ¥(0.6) billions
・ Purchase of property, plant andequipment ¥1.4 billions
・ Purchase of intangible assets
¥(1.0) billions・ Income taxes paid ¥(1.3) billions
・ Purchase of property, plant and equipment ¥(0.4) billions
equivalents at the end of the period
15.6 15.1 (0.5) ・ Purchase of intangible assets¥(0.2) billions
・ Purchase of investment securities ¥(0.3) billions
・ Purchase of investments insubsidiaries ¥(0.4) billionsFree cash flows (3.7) (4.7) (1.0)
equipment ¥(0.4) billions・ Purchase of intangible assets
¥(0.6) billions・ Purchase of investment securities
¥(0.9) billions・ Purchase of investments in
subsidiaries ¥(0.4) billions
・ Proceeds from long-term loanspayable ¥2.0 billions
・ Payments made to trust account¥1 4 billi
・ Proceeds from long-term loanspayable ¥2.0 billions
・ Proceeds from long-term loanspayable ¥(1 3) billions
22
¥1.4 billionspayable ¥(1.3) billions
・ Cash dividends paid ¥(0.7) billions

Expert Services (Temporary staffing)
Sales by Staffing TypeNet Sales
(Billions of yen)※ Figures exclude intersegment sales
※ Segment figures include intersegment sales
(Millions of yen)
H1 FY12 H1 FY13 Y Y129.7 130.3
65.3 62.2 YoY
+0 5%
H1 FY12 H1 FY13 YoY
Clerical 35,998 33,740 (6.3)%Technical 14,458 14,134 (2.2)%IT engineering 8,800 8,956 1.8%S l d M k ti 3 102 2 927 (5 6)%
YoY(4.8)%
+0.5% Sales and Marketing 3,102 2,927 (5.6)%Other Expert Services 2,828 2,313 (18.2)%Total 65,188 62,072 (4.8)%
FY12 FY13Revised Forecast
H1 FY12 H1 FY13
H1 FY12 (%)
Sales Composition
Forecast H1 FY12
H1 FY13
( )
● H1 resultIncrease in orders from a wide range of industries, including financeand manufacturing, though contract terminations due to past
Business Conditions
54 4
55.2
22 8
22.2
14 4
13.5
4 7
4.8
3 7
4.3
23
tightening of temporary staffing regulations continues
● H2 planWe expect contract terminations to peak in March, and a continued rise in demand as the recovery accelerates
54.4 22.8 14.4 4.7 3.7

Insourcing (Contracting)
45.3
Net sales from utilization of external personnel (Temporary staffing + Contracting)
Net Sales
(Billions of yen)
Insourcing (Contracting)(Billions of yen)
175.6
37.0 18.7 19.0
Y Y
YoY(3.4)%
g ( g)Expert Services (Temporary staffing)
+1.5%+11.7% +5.3%
YoY+22.4%
12.3 16.4 26.7 37.0 45.3
152.1 147.0 149.2 166.7
175.6 YoY+1.7%
139.8 130.6 122.5
129.7 130.3 FY12 FY13Revised Forecast
H1 FY12 H1 FY13
FY09 FY10 FY11 FY12 FY13
● H1 resultConsiderable increase in private-sector contractsIncrease in solutions projects utilizing cloud technologies
Business Conditions
24
FY09 FY10 FY11 FY12 FY13(Revised Forecast)● H2 plan
Full-fledged start for large-scale projects delayed in the first halfIncrease in new projects

Place & Search (Placement / Recruiting)
2 98
(Billions of yen)
Net SalesTotal of sales in placement / recruiting in Global sourcing, domestic Temp to Perm and Place & Search 140
No. of Orders* The data are expressed as relative values with Q1 FY08 being 100%
2.87
3.522.702.98
YoY+10.3%
YoY+22.7%
80
100
120 Place&Searchnew job openings
new job openings-to-applicants(*)
1.46 1.5640
60
YoY+6.6%
FY12 FY13Revised Forecast
H1 FY12 H1 FY130
20
Q1 Q2 Q3 Q4 Q1 Q2 Q3 Q4 Q1 Q2 Q3 Q4 Q1 Q2 Q3 Q4 Q1 Q2 Q3 Q4 Q1 Q2
FY08 FY09 FY10 FY11 FY12 FY13
Source: Ministry of Health, Labor and Welfare “Report on employment service” N E l di i k b f l djNote: Excluding part-time workers before seasonal adjustment
業状況
● H1 resultHiring increases in manufacturing and a wide range of other industriesOrders remain strong
Business Conditions
25
● H2 planIncrease the number of career consultants to meet growing demandAim to increase personnel, and raise the contract rate

Global Sourcing (Overseas)
3.69
(Billions of yen)
Net Sales(Millions of yen)
H1 FY12 H1 FY13 YoY
Temporary Staffing 449 617 37.3%
Net Sales by Business Segment
3.24
1 72
Placement / Recruiting 550 707 28.6%
Contracting (Payroll,others)
297 368 24.1%
Others 26 26 (0.9)%
YoY+14.0%
1.321.72
Net Sales by RegionYoY
+29.9%(Millions of yen)
Total 1,323 1,720 29.9%
FY12 FY13Revised Forecast
789
579
1,048Asia
North
H1 FY12 H1 FY13
H1 FY12
H1 FY13 +32.7%(Exclude Japan)
Forecast
North America
770
North America +33.1%
Sales composition 業状況
● H1 resultDemand for personnel by Japanese companies overseas remained strongIncreases in both temporary staffing and placement
Business Conditions
26
Asia57.6%
42.4%● H2 planContinue to focus on outsourcing services, such as payroll and recruitment
Outplacement
10 4(Billions of yen)
Operating Income, Operating Income Margin
Net Sales
30 000300
Companies Announcing Employment Adjustments (No. of companies and applicants)
(Companies) (People)
10.4
5 7 5 6 YoY
25,000
30,000
250
300No. of compaies which implemented employment adjustment
No. of applicants
YoY(14.8)%
YoY
0.92 0.80 0.83
5.7 5.6
YoY(1.8)%
YoY(13.1)%
15,000
20,000
150
200 downYoY
(61.6)%
16.0% 14.1% 8.0%
H1 FY12 H1 FY13 H1 FY13H1 FY12 FY13(Forecast)
10,000 100FY13
(Forecast)
0
5,000
0
50
2009 2010 2011 2012 2013
● H1 resultContinued a quicker definitive turnaround in the placement of users resulting from focus on career counseling and actively cultivating
Business Conditions
P b d IR di l d ti l
27
new employment offers → Earnings ahead of schedule
● H2 planMaintain nationwide office network in line with sales strategyStrengthen sales capabilities to capture demand in the next fiscal year
Pasona survey based on IR disclosure and newspaper articles.Some of companies which implemented employment adjustment did not announce No. of applicants.

Outsourcing (Benefit One Inc.)
7 2508,000
Employee fringe benefitCRM22.0
Operating Income, Operating Income MarginNet Sales
(Billions of yen)(Thousands people)
Benefit One Membership
1,990 2,320 2,3902,430
1,470
1,970120380 580
780890
1,260
4,7205,490 5,820
6,4705,710
7,250
3 000
4,000
5,000
6,000
7,000
CRMParsonal
9.4 3.02
22.0
YoY+24.9%
2,620 2,790 2,840 3,260 3,350 4,020
0
1,000
2,000
3,000
FY09 FY10 FY11 FY12 As of Sep. 30 2013
FY13(Forecast)
8.2
0.88 0.97
YoY+15.4%
YoY+10.3%
YoY+12.0%
H1 FY12 H1 FY13
10.7% 10.2% 13.7%
H1 FY13H1 FY12 FY13(Forecast)
3 4%
Health care
5.9% Others 3.7%
Diversification of incomeFY13(Forecast)
6.2%8.0%
4.3%3.4% 1.6%
Employee
fringe benefit
Parsonal
10.3%
CRM 5.5%
● H1 resultSteady increase in welfare benefit program membershipIncentive and Health care businesses remained strong
Business Conditions
28
76.5%fringe benefit
62.1%Incentive
12.5%
FY12 FY13(Forecast)
● H2 planEstablish an Asian headquarters in SingaporeAccelerate global business development

Consolidated Forecasts for the Fiscal Year Ending May 31, 2014
207.7222.0
(Billions of yen)YoY +6.9%+8.0%
2 0
3.2 3.4181.5
(21.4)%2.0
0.03 0.61 0.48
Sales Ordinary Income Net Incomea O d a y o o
FY11 FY13(Forecast)
FY12
(Millions of yen) FY12 to net sales%
FY13InitialFo ecast
to net sales%
FY13RevisedFo ecast
to net sales%
vs FY13Initial Forecast
Increase/DecreaseYoY vs FY12
Increase/DecreaseYoY
FY11 FY13(Forecast)
FY12FY11 FY13(Forecast)
FY12
Forecast Forecast Increase/Decrease
Net sales 207,685 100.0 222,000 100.0 222,000 100.0 0 0.0% 14,314 6.9%
Cost of sales 167,609 80.7 180,330 81.2 180,830 81.5 500 0.3% 13,220 7.9%
Gross profit 40,075 19.3 41,670 18.8 41,170 18.5 (500) (1.2)% 1,094 2.7%
SG&A expenses 36 898 17 8 38 240 17 2 37 740 17 0 (500) (1 3)% 841 2 3%
29
SG&A expenses 36,898 17.8 38,240 17.2 37,740 17.0 (500) (1.3)% 841 2.3%
Operating income 3,176 1.5 3,430 1.5 3,430 1.5 0 0.0% 253 8.0%
Ordinary income 3,187 1.5 3,320 1.5 3,320 1.5 0 0.0% 132 4.2%
Net income 610 0.3 480 0.2 480 0.2 0 0.0% (130) (21.4)%

Consolidated Forecasts by Segment for the Fiscal Year Ending May 31, 2014
FY12FY13Initial
Forecast
FY13RevisedForecast
Increase/Decrease
VS Initialforecast
%
VS FY12Increase/Decrease
VS FY12%
FY12FY13Initial
Forecast
FY13RevisedForecast
Increase/Decrease
VS Initialforecast
%
VS FY12Increase/Decrease
VS FY12%
Sales Operating income (loss)
Segment
(A) (B) (C) (C)-(B) (C)-(A) (D) (E) (F) (F)-(E) (F)-(D)
Expert Services 129,720 132,320 130,320 (2,000) (1.5)% 600 0.5%
Insourcing 37,007 43,300 45,300 2,000 4.6% 8,293 22.4%
HR Consulting HR Consulting(including TTP, nursing care)
4,094 4,310 4,310 0 0.0% 216 5.3%
Place & Search 2,869 3,520 3,520 0 0.0% 651 22.7%
Global Sourcing 3,236 3,690 3,690 0 0.0% 454 14.0%
Subtotal 176 928 187 140 187 140 0 0 0% 10 212 5 8%
2,661 3,170 3,170 0 0.0% 509 19.1%
Subtotal 176,928 187,140 187,140 0 0.0% 10,212 5.8%
Outplacement 12,235 10,430 10,430 0 0.0% (1,805) (14.8)% 2,164 830 830 0 0.0% (1,334) (61.6)%
Outsourcing 17,610 22,000 22,000 0 0.0% 4,390 24.9% 2,696 3,020 3,020 0 0.0% 324 12.0%
Life SolutionsP bli S l ti 3 933 5 410 5 410 0 0 0% 1 477 37 6% (46) (40) (40) 0 6 Public Solutions
Shared3,933 5,410 5,410 0 0.0% 1,477 37.6% (46) (40) (40) 0 - 6 -
Eliminations and Corporate (3,021) (2,980) (2,980) 0 - 41 - (4,299) (3,550) (3,550) 0 - 749 -
Consolidated 207,685 222,000 222,000 0 0.0% 14,315 6.9% 3,176 3,430 3,430 0 0.0% 254 8.0%
30

4 R f4. Reference
31※ Units in billions of yen have been rounded to the nearest first decimal place. Units in millions of yen have been rounded down.
Operating Income Margin FY11
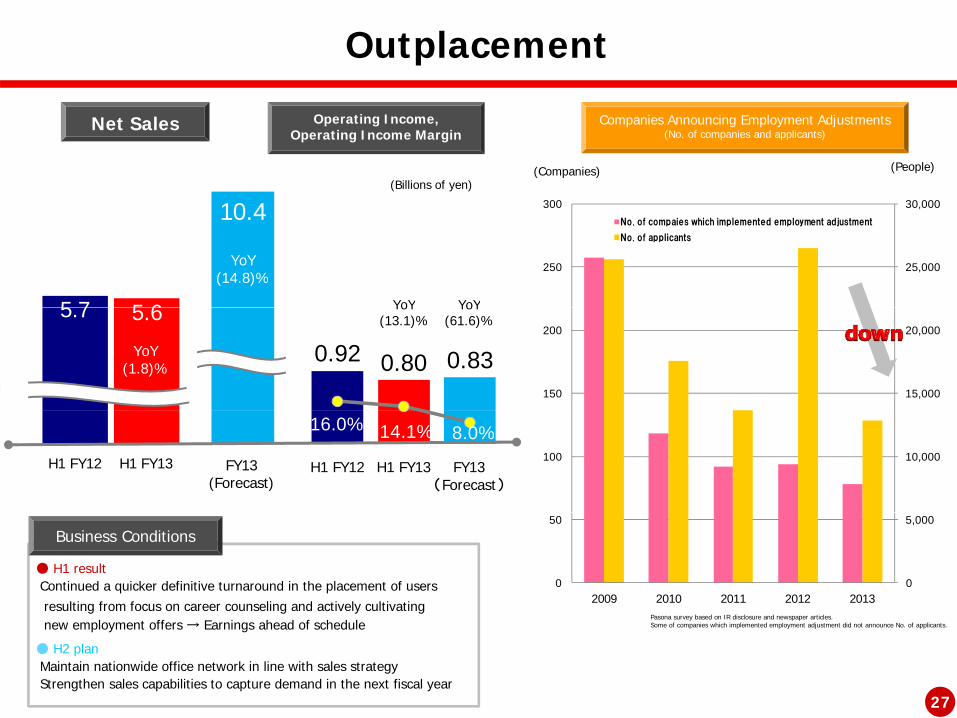
Quarterly Earnings Trends
0 7%
2.1%2.6%
1.3%0 8% 1 9%
1.6%70.0
80.0
90.0
100.0 Net Sales
p g g
Operating Income Margin FY12
Operating Income Margin FY13
(Billions of yen)
45.9 45.0 44.4 46.3 51.3 51.7 50.6 54.1 51.2 51.4
0.7%0.7%1.3%
0.3% 0.8% 1.9%
0.4%
20 0
30.0
40.0
50.0
60.0
70.0
0.0
10.0
20.0
1Q 2Q 3Q 4QFY13FY11 FY12 FY11 FY12 FY11 FY12 FY11 FY12
Q1 Q2 Q3 Q4
FY13 FY13 FY13
FY11 FY12 YoY FY13 YoY FY11 FY12 YoY FY13 YoY FY11 FY12 YoY FY11 FY12 YoY
Net sales 45,901 51,270 +11.7% 51,212 (0.1)% 44,979 51,705 +15.0% 51,406 (0.6)% 44,364 50,585 +14.0% 46,252 54,123 +17.0%
Gross profit 8,488 9,517 +12.1% 10,032 +5.4% 8,158 9,553 +17.1% 9,377 (1.8)% 8,249 10,022 +21.5% 8,908 10,982 +23.3%
SG&A expenses 7,886 9,181 +16.4% 9,197 +0.2% 8,035 9,174 +14.2% 9,174 +0.0% 7,894 8,984 +13.8% 8,023 9,557 +19.1%
Q4 (March to May)Q2 (September to November)Q1 (June to August) Q3 (December to February)
Operating income 601 335 (44.3)% 834 +149.0% 122 379 +209.0% 203 (46.4)% 355 1,037 +192.1% 884 1,424 +61.0%
Ordinary income 560 330 (41.0)% 798 +141.5% 184 362 +96.5% 163 (54.9)% 393 1,010 +156.8% 952 1,483 +55.7%
Net income (loss) 111 (193) - 103 - (36) (260) - (128) - (181) 160 - 136 904 +563.1%
Gross profit margin 18.5% 18.6% +0.1pt 19.6% +1.0pt 18.1% 18.5% +0.4pt 18.2% (0.3)pt 18.6% 19.8% +1.2pt 19.3% 20.3% +1.0pt
SG&A expense ratio 17.2% 17.9% +0.7pt 18.0% +0.1pt 17.9% 17.7% (0.2)pt 17.8% +0.1pt 17.8% 17.8% (0.0)pt 17.3% 17.7% +0.4pt
Ope ating income ma gin 1 3% 0 7% (0 6)pt 1 6% +0 9pt 0 3% 0 7% +0 4pt 0 4% (0 3)pt 0 8% 2 1% +1 3pt 1 9% 2 6% +0 7pt
Consolidated
32
Operating income margin 1.3% 0.7% (0.6)pt 1.6% +0.9pt 0.3% 0.7% +0.4pt 0.4% (0.3)pt 0.8% 2.1% +1.3pt 1.9% 2.6% +0.7pt
Ordinary income margin 1.2% 0.6% (0.6)pt 1.6% +1.0pt 0.4% 0.7% +0.3pt 0.3% (0.4)pt 0.9% 2.0% +1.1pt 2.1% 2.7% +0.6pt
Net income margin 0.2% - - 0.2% - - - - - - - 0.3% - 0.3% 1.7% +1.4pt

Quarterly Earnings Trends by Segment
(Millions of yen)
Sales Operating income (loss)
Segment Q1 FY12 Q2 FY12 Q3 FY12 Q4 FY12 Q1 FY13 Q2 FY13 YoY Q1 FY12 Q2 FY12 Q3 FY12 Q4 FY12 Q1 FY13 Q2 FY13 YoY
1 Expert Services 32,971 32,354 31,206 33,188 31,169 31,029 (4.1)%
2 Insourcing 9,149 9,508 8,902 9,446 9,327 9,640 1.4%
3 HR Consulting, others 916 968 950 1,258 1,013 1,022 5.6%
4 Place & Search 743 717 615 792 762 796 10.9%
5 Global Sourcing 668 655 912 1,000 866 853 30.2%
672603 562 823 (22.7)%653 519
44,449 44,204 42,587 45,686 43,140 43,342 (2.0)%
6 Outplacement 2,724 3,021 3,169 3,319 3,060 2,584 (14.5)% 388 528 568 678 613 182 (65.5)%
7 Outsourcing 3,886 4,289 4,526 4,907 4,552 4,883 13.9% 469 406 891 929 530 435 7.1%
Lif S l ti
Subtotal
8
Life Solutions Public Solutions Shared
987 979 1,028 937 1,194 1,353 38.2% 40 (21) (30) (34) (19) 27 -
9 Eliminations and Corporate (777) (789) (726) (727) (735) (756) - (1,166) (1,205) (953) (973) (944) (961) -
10 Total 51,270 51,705 50,585 54,123 51,212 51,406 (0.6)% 335 379 1,037 1,424 834 203 (46.4)%
33
, , , , , , ( ) , , ( )

Key Indicators (First Half)
Net Assets (Millions of yen)
Shareholders' Equity Ratio
Net Assets and Shareholders’ Equity RatioNet Sales and Operating Income Ratio
(Millions of yen)
(Millions of yen) %%6.0 140.0
Net Sales (Millions of yen)
Operating Income Ratio
18.4
21.5
24.6
27.7
24.922.5 24.3
25.3 24.625.7
27.3
40.8
47.0 49.4
41.3 41.8
37.641.3
36.4 36.029.9
30 0
40.0
50.0
60.0
15 0
20.0
25.0
30.0
66 8
74.6
87.0
98.2
113.2 119.5
116.1
92.1 89.0 90.9
103.0 102.6
2.8
3.3
3.9
4.6
3.2
3.83.0
4.0
5.0
60 0
80.0
100.0
120.0
3.8
7.3
13.415.4
28.5
0.0
10.0
20.0
30.0
0.0
5.0
10.0
15.0
'01/11'02/11'03/11'04/11'05/11'06/11'07/11'08/11'09/11'10/11'11/11'12/11'13/11
66.6 66.8
2.6
1.41.0
0.6 0.8 0.7 1.0
0.0
1.0
2.0
0.0
20.0
40.0
60.0
'01/11'02/11'03/11'04/11'05/11'06/11'07/11'08/11'09/11'10/11'11/11'12/11'13/11 01/11 02/11 03/11 04/11 05/11 06/11 07/11 08/11 09/11 10/11 11/11 12/11 13/1101/1102/1103/1104/1105/1106/1107/1108/1109/1110/1111/1112/1113/11
First Half Results (Millions of yen)Key Indicators '01/11 '02/11 '03/11 '04/11 '05/11 '06/11 '07/11 '08/11 '09/11 '10/11 '11/11 '12/11 '13/11Net Sales 66,593 66,822 74,641 87,016 98,247 113,202 119,516 116,086 92,069 88,994 90,880 102,976 102,619Gross Profit Margin 17.6% 18.9% 20.1% 20.6% 19.8% 20.3% 20.4% 20.0% 19.2% 18.2% 18.3% 18.5% 18.9%SG&A Expenses 9,823 10,386 12,091 13,905 16,290 18,654 21,274 21,598 16,784 15,640 15,922 18,355 18,372SG&A Expense Ratio 14.8% 15.6% 16.2% 16.0% 16.6% 16.5% 17.8% 18.6% 18.2% 17.6% 17.5% 17.8% 17.9%Operating Income 1,878 2,211 2,892 3,982 3,123 4,314 3,071 1,598 905 533 724 714 1,038Operating Income Ratio 2.8% 3.3% 3.9% 4.6% 3.2% 3.8% 2.6% 1.4% 1.0% 0.6% 0.8% 0.7% 1.0%Ordinary Income 1,738 2,086 2,707 3,990 3,103 4,392 3,145 1,803 933 580 744 692 961Ordinary Income Ratio 2.6% 3.1% 3.6% 4.6% 3.2% 3.9% 2.6% 1.6% 1.0% 0.7% 0.8% 0.7% 0.9%Net Income (Loss) 822 931 1,272 2,319 1,482 2,073 1,063 203 (1,696) (549) 75 (454) (25)Net Income Ratio 1.2% 1.4% 1.7% 2.7% 1.5% 1.8% 0.9% 0.2% - - 0.1% - -Total Assets 24,808 26,796 32,759 39,150 43,526 49,918 55,216 52,670 42,866 55,084 57,480 68,768 68,524Net Assets *1 3 824 7 316 13 374 18 381 21 509 24 573 27 736 24 939 22 497 24 260 25 295 24 619 25 743
34
Net Assets *1 3,824 7,316 13,374 18,381 21,509 24,573 27,736 24,939 22,497 24,260 25,295 24,619 25,743Shareholders' Equity Ratio *2 15.4% 27.3% 40.8% 47.0% 49.4% 41.3% 41.8% 37.6% 41.3% 36.4% 36.0% 28.5% 29.9%Current Ratio 117.0% 122.7% 146.9% 177.2% 182.0% 152.3% 150.8% 136.4% 148.1% 190.7% 172.4% 144.4% 139.0%
Notes: 1. Presentation of shareholders’ equity amended to a net assets basis in line w ith changes to accounting standards and policies. M inority interests included in presentation of net assets since the fiscal y ear ended May 31, 2007. 2. Despite changes in calculation methods for net assets follow ing the introduction of changes to accounting standards and policies, the shareholders’ equity ratio since the fiscal y ear ended May 31, 2007 is calculated utilizing an amount equiv alent to net assets applicable to common shares. 3. F or '01/11-'06/11, Pasona Inc. consolidated business results hav e been used for comparativ e purposes.

Key Indicators (Full Year)
29 5
60.0 30.0
Net Assets (Billions of yen)Shareholders' Equity Ratio
Net Assets and Shareholders’ Equity RatioNet Sales and Operating Income Ratio
(Billions of yen)(Billions of yen) (%) (%)
Net Sales (Billions of yen)
Operating Income Ratio(%)
15.7
20.6
27.6 26.9
29.5
25.1 25.0 25.6 26.3 26.3
24.1
28.6
42.5
48.1
45.5
41.1 41.6
35.439.6
34.7
29 0 29 3
30.0
40.0
50.0
15.0
20.0
25.0
157.0179.2
203.8
231.2 236.9218.7
183.5 178.8 181.5
207.73.6
4.24.9 4.6
3 8 3 7 3 0
4.0
5.0
6.0
150.0
200.0
250.0
6.48.4
29.0 29.3
0.0
10.0
20.0
0.0
5.0
10.0
FY01 FY02 FY03 FY04 FY05 FY06 FY07 FY08 FY09 FY10 FY11 FY12
133.8 135.63.8 3.7
2.7
1.3
2.0 1.4 1.1
1.5
0.0
1.0
2.0
3.0
0.0
50.0
100.0
FY01 FY02 FY03 FY04 FY05 FY06 FY07 FY08 FY09 FY10 FY11 FY12
Results (Millions of yen)
Key Indicators '02/05 '03/05 '04/05 '05/05 '06/05 '07/05 '08/05 '09/05 '10/05 '11/05 '12/05 '13/05Net Sales 133,822 135,625 156,979 179,156 203,815 231,231 236,945 218,699 183,515 178,806 181,498 207,685Gross Profit Margin 18.2% 19.7% 20.9% 20.8% 20.2% 20.3% 20.8% 19.9% 20.0% 18.8% 18.6% 19.3%SG&A Expenses 19,557 21,058 25,104 28,992 33,491 38,542 42,925 40,735 33,070 31,125 31,840 36,898SG&A Expense Ratio 14.6% 15.5% 16.0% 16.2% 16.4% 16.6% 18.1% 18.6% 18.0% 17.4% 17.5% 17.8%Operating Income 4,786 5,687 7,648 8,238 7,745 8,507 6,444 2,850 3,660 2,432 1,964 3,176Operating Income 4,786 5,687 7,648 8,238 7,745 8,507 6,444 2,850 3,660 2,432 1,964 3,176Operating Income Ratio 3.6% 4.2% 4.9% 4.6% 3.8% 3.7% 2.7% 1.3% 2.0% 1.4% 1.1% 1.5%Ordinary Income 4,222 5,373 7,329 8,289 7,844 8,807 6,637 3,361 4,044 2,571 2,091 3,187Ordinary Income Ratio 3.2% 4.0% 4.7% 4.6% 3.8% 3.8% 2.8% 1.5% 2.2% 1.4% 1.2% 1.5%Net Income 1,974 2,027 3,647 4,363 3,588 4,198 2,962 312 204 412 29 610Net Income Ratio 1.5% 1.5% 2.3% 2.4% 1.8% 1.8% 1.3% 0.1% 0.1% 0.2% 0.0% 0.3%Total Assets 26,526 29,425 37,004 42,884 51,931 54,425 58,513 55,468 52,269 60,564 70,889 71,276Net Assets *1 6,388 8,418 15,732 20,644 27,634 26,904 29,468 25,148 24,979 25,642 26,295 26,253Shareholders' Equity Ratio *2 24.1% 28.6% 42.5% 48.1% 45.5% 41.1% 41.6% 35.4% 39.6% 34.7% 29.0% 29.3%
35
q yCurrent Ratio 121.6% 122.3% 160.2% 182.8% 170.8% 152.1% 154.2% 129.6% 163.3% 175.2% 154.7% 141.8%Number of Employ ees (exclude contract workers) 1,537 1,687 1,979 2,204 2,608 3,126 3,647 3,671 3,643 3,956 4,452 4,778
Notes: 1. Presentation of shareholders’ equity amended to a net assets basis in line w ith changes to accounting standards and policies. Minority interests included in presentation of net assets since the fiscal y ear ended May 31, 2006. 2. Despite changes in calculation methods for net assets follow ing the introduction of changes to accounting standards and policies, the shareholders’ equity ratio since the fiscal y ear ended May 31, 2006 is calculated utilizing an amount equiv alent to net assets applicable to common shares. 3. The data for the periods up to and including the fiscal y ear ended May 31, 2007 are consolidated data for Pasona Inc. The data for the periods commencing the fiscal y ear ended May 31, 2008 and bey ond are consolidated data for Pasona Group Inc.

Stock Information (As of November 30, 2013)
kd f h h ld b kd f h h ld b b f h ld
Financial companies 35,271 (8.45%)
Securities companies
1,485 (0.36%)Treasury stock 42 401 (10 17%)
Financial companies 30 (0.39%)
Securities companies18 (0.23%)
Other corporations 64 (0.82%)
ForeignTreasury
Breakdown of Shareholders by Type Breakdown of Shareholders by Number of Share Held
Other corporations 63,741 (15.29%)
Foreign
42,401 (10.17%)Foreign corporations and other foreign
investors 106 (1.36%)
Treasury stock
1 (0.01%)
Total7 794
Total416 903
N f Sh
gcorporations and
other foreign investors 65,814
(15.79%)
Individuals and others 208,191
(49.94%)
Individuals and others
7,575 (97.19%)
7,794people
416,903shares
Principal Shareholders No. of SharesHeld
%
Yasuyuki Nambu 147,632 35.41%
Pasona Group Inc. 42,401 10.17%
Nambu Enterprise Inc. 37,378 8.97%
G ld S h I t ti l 17 961 4 31%Goldman Sachs International 17,961 4.31%
Sanrio Company, Ltd. 11,885 2.85%
The Master Trust Bank of Japan, Ltd (Trust account) 10,045 2.41%
CMBL S. A. Re Mutual Funds 9,510 2.28%
Pasona Group Employees' Shareholding Association 6,416 1.54%
36
Japan Trustee Services Bank,Ltd.(Trust account) 5,550 1.33%
State Street Bank-West Pension Fund Clients-Exempt 4,825 1.16%
1. The Company's treasury stock (42,401 shares, 10.17% of total issued shares) ranked second. In accordance with Article 308.2 of the Corporations Law, there are no voting rights attached to treasury stock.
2. The Company conducted a 1:100 stock split on common stock with an effective date of December 1, 2013, at the same time, adopted a unit share system that set unit share at 100 shares.

E t S i Outplacement
Consolidated Subsidiaries (by segment)
Expert ServicesInsourcing HR Consulting, education and training, others
Pasona Inc.
Pasona Tech, Inc.
Pasona Language Inc.
KIS Co.,Ltd. Outsourcing
Pasona Inc.
Outplacement
Pasona Okayama Inc.
Pasona Logicom Inc.
Pasona Marketing Inc.
Pasona Agri-Partners Inc.
GO C d
CAPLAN Corporation
Yaskawa Business Staff Corporation
Bewith, Inc.
Asahi Beer Communications Co, Ltd.
S O CO O O
Benefit One Inc.
Benefit one Health care Inc.
Benefit One Solutions Inc.
ARGO. Co., Ltd.
Nihon Employment Creation Organization Inc.
Place & Search
Pasona Inc. Pasona Fortune Inc.
SUPPORT CORPORATION Life Solutions
Pasona Foster Inc.
Pasona Life Care Inc.
Pasona Education Co. Limited
Global Sourcing
Pasona NA, Inc. PASONA CANADA, INC.
Pasona MIC, Inc. Pasona Taiwan Co., Ltd.
Pasona Singapore Pte Ltd PASONA ASIA CO LIMITED
Public Solutions
Pasona Heartful Inc.
Pasona Furusato Incubation IncPasona Singapore Pte. Ltd. PASONA ASIA CO., LIMITED
PT Pasona HR Indonesia Pasona Korea Co., Ltd
TEAM PASONA INDIA COMPANY LIMITED
MGR Search and Selection CO., LTD.
Pasona Human Resources (Shanghai) Co., Ltd.
Shared
Pasona Furusato Incubation Inc.
Pasona CIO Inc.
37
Pasona HR Consulting Recruitment (Thailand) Co., Ltd.
Pasonatech Consulting (Dalian) Co., Ltd.
Pasona Tech Vietnam Co., Ltd.
● Subsidiaries 39, Affiliates 3
(As of November 30, 2013)

Corporate Data
Tokyo Stock Exchange 1st Section 2168Tokyo Stock Exchange, 1st Section 2168
Shin Marunouchi Bldg
Pasona Group Inc.Corporate Name
Comprehensive Group officeOtemachi 2 6 4 Chiyoda ku
December 3, 2007(F di F b 1976)
Established
Shin Marunouchi Bldg.1-5-1, Marunouchi, Chiyoda-ku,Tokyo 100-6514
HeadquartersOtemachi 2-6-4 Chiyoda-ku,Tokyo 100-8228 Phone 03-6734-0200
5,000 million yenPaid-in Capital
Yasuyuki NambuRepresentative
(Founding February 1976)
Expert Services (Temporary staffing), Insourcing (Contracting), HR Consulting , education and training, othersPlace & Search (Placement/Recruiting) Global Sourcing (Overseas)Outplacement
Business Activities
5,989 (Consolidated, including contract workers)Number of Employees
pOutsourcing Life Solutions, Public Solutions, Shared
(As of May 31, 2013)
38
Subsidiaries 39, Affiliates 3
http://www.pasonagroup.co.jp/english/
Group Companies
URL
(As of November 30, 2013)


![Characterizing Test Methods and Emissions Reduction ...184-H1. 155-H1. 170-H1. 198-H1. 218-H1. 1. 10. 100. 1000. Axis Title Diameter [nm] A_0581_492_H1. A_0581_466_H1. A_0581_482_H1.](https://static.fdocuments.net/doc/165x107/5f74a0f484fbe405e9323ea1/characterizing-test-methods-and-emissions-reduction-184-h1-155-h1-170-h1.jpg)