Results for the 53 weeks to 2 July 2016 - Supercheap...
26
Peter Birtles Group Managing Director and Chief Executive Officer David Burns Chief Financial Officer 26 August 2016 Results for the 53 weeks to 2 nd July 2016
Transcript of Results for the 53 weeks to 2 July 2016 - Supercheap...

Peter Birtles Group Managing Director and Chief Executive Officer
David Burns Chief Financial Officer
26 August 2016
Results for the 53 weeks to 2nd July 2016

Contents
2015/16 Financial Results 2016/17 Trading Update Group Strategy

3
Group Highlights
• Total group sales up by 8.2%
• Segment EBITDA up by 6.4%
• Normalised NPAT of $108.6 million up 2.2%
Sales LFL 15/16 (2) 14/15 13/14 12/13
Auto 4.4% 2.2% 2.4% 5.0%
Leisure 4.4% -0.6% -0.8% 2.9%
Sports(1) 6.3% 6.6% 2.6% 8.0%
• Net Profit After Tax attributable to owners of $62.8 million
• Auto segment sales up by 8.0%, EBIT up by 9.0% to $104.6 million
• Sports segment sales up by 9.0%, EBIT up by 18.6% to $77.8 million
• Leisure segment sales up by 7.1% but investment in competitive pricing, inventory clearance and higher
product costs resulting in EBIT decline of 42.4% to $18.6 million
• Restructuring and impairment costs of $45.8 million after tax associated with transformation of Rays and
Infinite Retail businesses
• Operating cash flows of $159.2 million up by circa $15 million on a like for like basis
• $81.3 million cash invested in future growth in new stores and refurbishments
• Final Dividend of 21.5 cents, full year dividend of 41.5 cents, an increase of 3.8%
(1) Rebel and Amart only (2) Like for Like 52 week basis
2015/16 results are for 53 weeks, pcp results are for 52 weeks
4
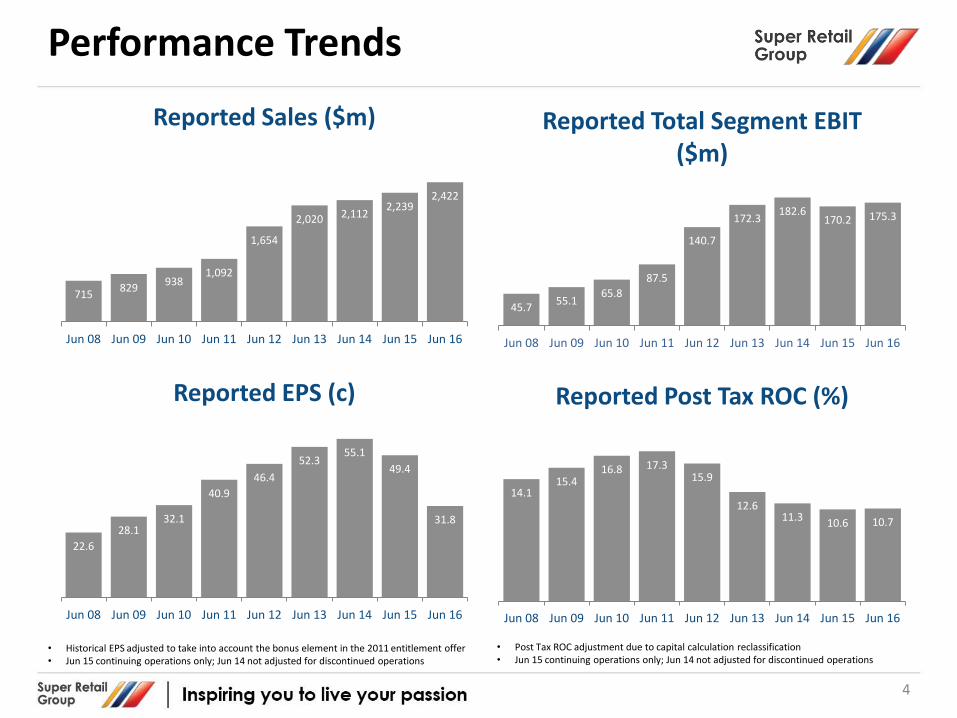
Performance Trends
• Historical EPS adjusted to take into account the bonus element in the 2011 entitlement offer • Jun 15 continuing operations only; Jun 14 not adjusted for discontinued operations
• Post Tax ROC adjustment due to capital calculation reclassification • Jun 15 continuing operations only; Jun 14 not adjusted for discontinued operations
715 829
938 1,092
1,654
2,020 2,112 2,239
2,422
Jun 08 Jun 09 Jun 10 Jun 11 Jun 12 Jun 13 Jun 14 Jun 15 Jun 16
Reported Sales ($m)
22.6
28.1 32.1
40.9
46.4
52.3 55.1
49.4
31.8
Jun 08 Jun 09 Jun 10 Jun 11 Jun 12 Jun 13 Jun 14 Jun 15 Jun 16
Reported EPS (c)
45.7 55.1
65.8
87.5
140.7
172.3 182.6
170.2 175.3
Jun 08 Jun 09 Jun 10 Jun 11 Jun 12 Jun 13 Jun 14 Jun 15 Jun 16
Reported Total Segment EBIT ($m)
14.1 15.4
16.8 17.3 15.9
12.6 11.3
10.6 10.7
Jun 08 Jun 09 Jun 10 Jun 11 Jun 12 Jun 13 Jun 14 Jun 15 Jun 16
Reported Post Tax ROC (%)
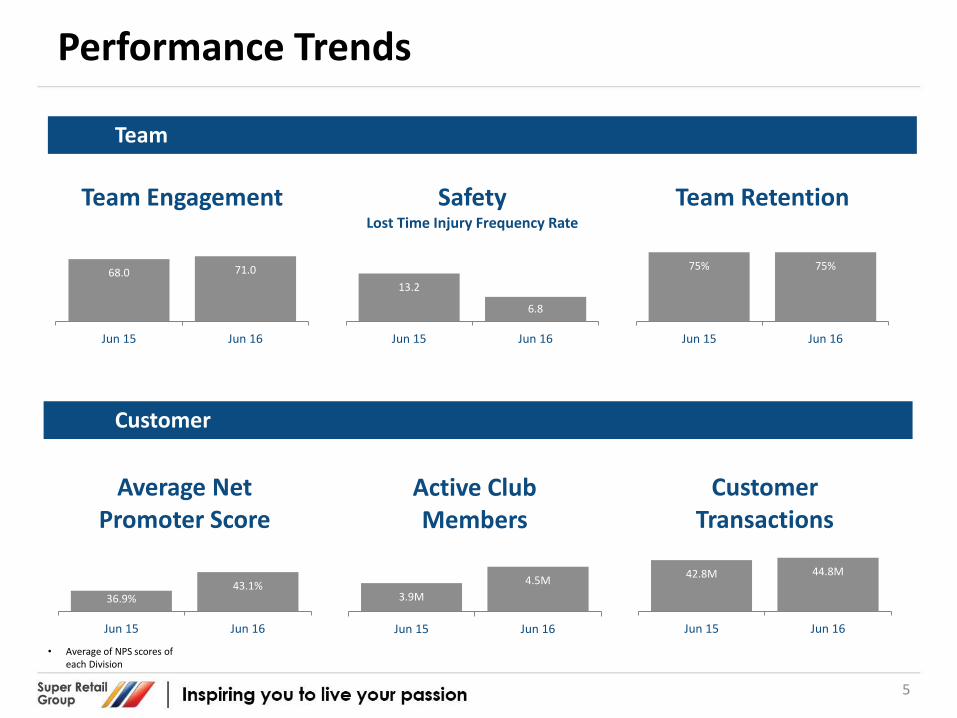
Performance Trends
68.0 71.0
Jun 15 Jun 16
Team Engagement
13.2
6.8
Jun 15 Jun 16
Safety Lost Time Injury Frequency Rate
75% 75%
Jun 15 Jun 16
Team Retention
36.9% 43.1%
Jun 15 Jun 16
Average Net Promoter Score
3.9M
4.5M
Jun 15 Jun 16
Active Club Members
42.8M 44.8M
Jun 15 Jun 16
Customer Transactions
Team
Customer
• Average of NPS scores of each Division
5
6
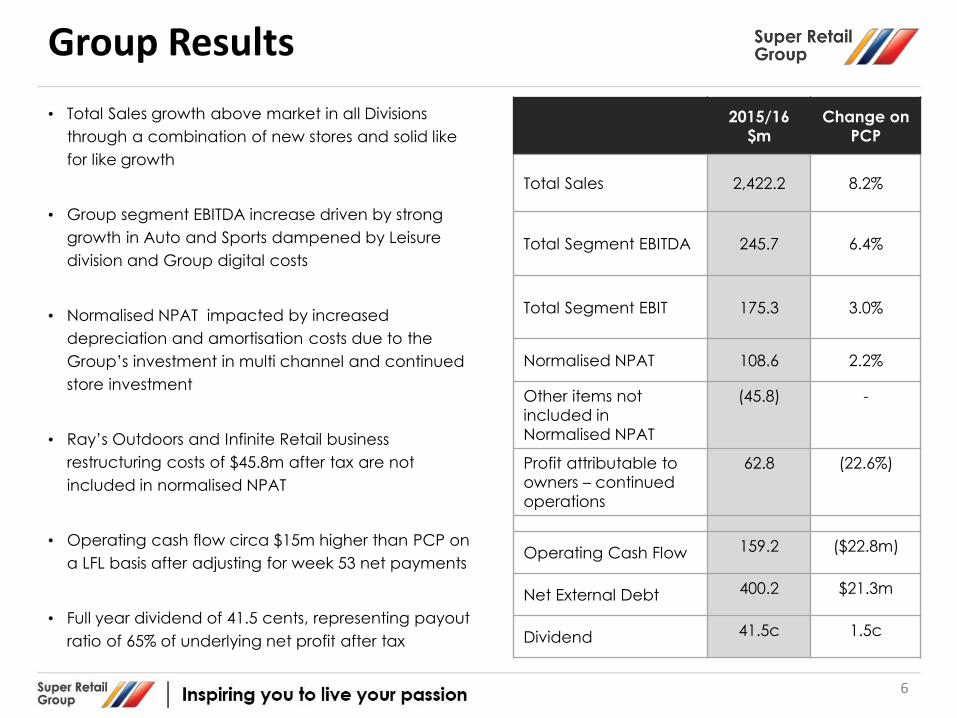
Group Results
2015/16
$m
Change on
PCP
Total Sales 2,422.2 8.2%
Total Segment EBITDA 245.7 6.4%
Total Segment EBIT 175.3 3.0%
Normalised NPAT 108.6 2.2%
Other items not
included in
Normalised NPAT
(45.8) -
Profit attributable to
owners – continued
operations
62.8 (22.6%)
Operating Cash Flow 159.2 ($22.8m)
Net External Debt 400.2 $21.3m
Dividend 41.5c 1.5c
• Total Sales growth above market in all Divisions
through a combination of new stores and solid like
for like growth
• Group segment EBITDA increase driven by strong
growth in Auto and Sports dampened by Leisure
division and Group digital costs
• Normalised NPAT impacted by increased
depreciation and amortisation costs due to the
Group’s investment in multi channel and continued
store investment
• Ray’s Outdoors and Infinite Retail business
restructuring costs of $45.8m after tax are not
included in normalised NPAT
• Operating cash flow circa $15m higher than PCP on
a LFL basis after adjusting for week 53 net payments
• Full year dividend of 41.5 cents, representing payout
ratio of 65% of underlying net profit after tax

7
Segment Results
2015/16 2014/15
Sales
$m
Segment EBIT
$m
Sales
$m
Segment EBIT
$m
Auto Segment 922.8 104.6 854.3 96.0
Leisure Segment 581.9 18.6 543.2 32.3
Sports Segment 910.2 77.8 835.0 65.6
Group & Unallocated 7.3 (25.7) 6.2 (23.7)
Total Segment Result 2,422.2 175.3 2,238.7 170.2
Segment Results are net of non-controlling interests (EBIT only) and excludes the business restructuring costs for
Ray’s Outdoors and Infinite Retail. Refer the segment notes below.
8
Auto Retailing
2015/16
$m
Change on
PCP
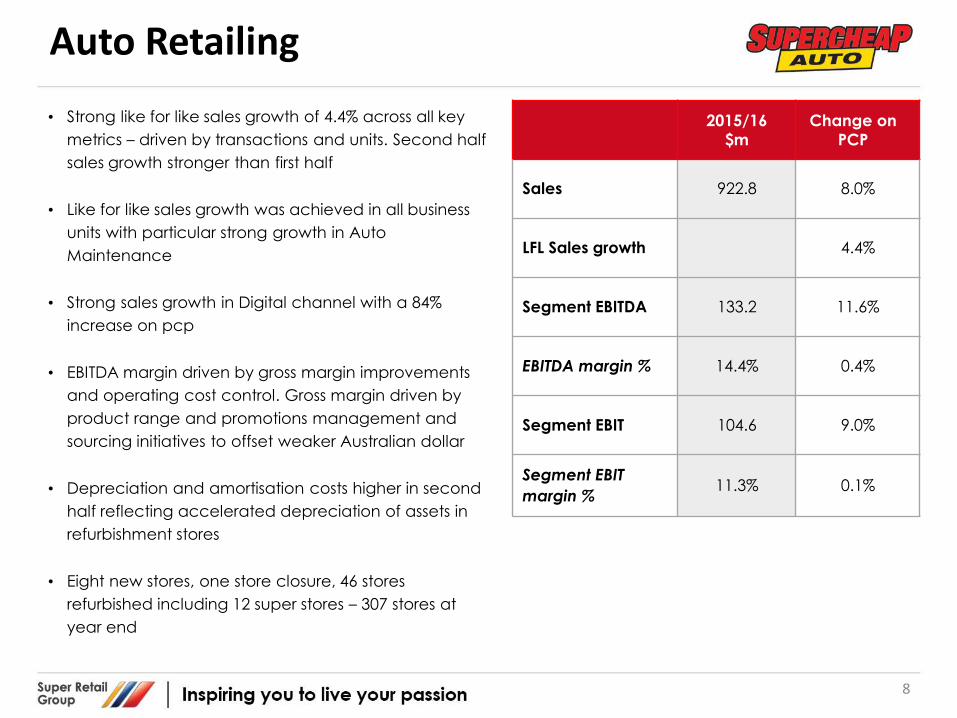
Sales 922.8 8.0%
LFL Sales growth 4.4%
Segment EBITDA 133.2 11.6%
EBITDA margin % 14.4% 0.4%
Segment EBIT 104.6 9.0%
Segment EBIT
margin % 11.3% 0.1%
• Strong like for like sales growth of 4.4% across all key
metrics – driven by transactions and units. Second half
sales growth stronger than first half
• Like for like sales growth was achieved in all business
units with particular strong growth in Auto
Maintenance
• Strong sales growth in Digital channel with a 84%
increase on pcp
• EBITDA margin driven by gross margin improvements
and operating cost control. Gross margin driven by
product range and promotions management and
sourcing initiatives to offset weaker Australian dollar
• Depreciation and amortisation costs higher in second
half reflecting accelerated depreciation of assets in
refurbishment stores
• Eight new stores, one store closure, 46 stores
refurbished including 12 super stores – 307 stores at
year end

9
Leisure Retailing
Segment results excludes restructuring costs – refer segment note in Annual Report
2015/16
$m
Change on
PCP
Sales 581.9 7.1%
LFL Sales growth 4.4%
Segment EBITDA 37.5 (23.2%)
EBITDA margin % 6.4% (2.6%)
Segment EBIT 18.6 (42.4%)
Segment EBIT
margin % 3.2% (2.7%)
• Strong like for like sales growth of 4.4% with BCF at 5.5%
and Ray’s Outdoors/Rays at 1.3%
• BCF performance improving significantly in the 2nd
half as revised pricing and promotional strategies
implemented
• BCF sales growth driven by strong transaction and
units per transaction increases despite challenging
demand conditions in Queensland
• Traditional Ray’s Outdoors stores delivering negative
LFL sales growth outside of clearance activity. Three
converted Rays trial stores collectively delivering
target LFL uplift
• Ray’s Outdoors contributing circa $7 million EBIT loss
• Depreciation and amortisation costs higher in second
half reflecting accelerated depreciation of assets in
refurbishment stores
• Four BCF stores opened, one closure and Ray’s
Outdoors/Rays net nil change. BCF 120 and Ray’s
Outdoors/Rays at 53 stores at year end

Leisure Performance Plan Update
10
BCF
RAYS
• Ray’s Outdoors closures completed in
Tasmania, Western Australia and South
Australia
• Closures in Queensland, New South Wales
and Victoria due to complete late September
• Total of 21 stores to close, 11 stores to BCF, 5
stores to Amart Sports and one store to
Supercheap Auto
• Of the total of 17 new format Rays stores, 15
will be trading in new format by December
2016. Remaining 2 stores subject to lease
agreements
• New format stores profit delivery to date in
accordance with business case
• Strong Net Promoter Score results – good
response from customers visiting the stores
1st half 2nd half
LFL Sales growth 3.1% 8.2%
Gross margin vs pcp -3.6% -1.2%
EBITDA vs pcp -$6.2m +$0.6m
EBITDA margin vs pcp -3.5% -0.9%
• Strong improvement in 2nd half performance
driven by revised pricing and promotions
strategy
• Further opportunities being actioned including
customer service levels, store refurbishments,
range extensions and targeted marketing
• Rays repositioning presents further opportunities
for BCF to extend its customer base

11
Sports Retailing
(1) Rebel and Amart Sports Only (2) Infinite Retail EBIT net of non-controlling interests
• Total Sales growth in Rebel and Amart Sports driven by
total transaction growth of 3.2% and average
transaction value growth of 3.3%
• Strong LFL growth across all major categories with
particularly strong performance in footwear and
apparel
• Strong sales growth in Digital channel with a 61%
increase on pcp
• Rebel and Amart Sports EBITDA margin increase has
been driven by gross margin improvements and
operating cost control
• Infinite Retail ownership increased from 50.05% to 95% in
early November 2015 and is now fully integrated into
the Rebel operations – all loss making contracts fully
provided
• Workout World was transformed into Rebel Fit during the
period.
• During the period, three Rebel and five Amart Sports
stores opened. Three Rebel and one Amart Sports store
closed. 161 Rebel and Amart Sports stores at year end
2015/16
$m
Change on
PCP
Rebel, Amart Sports and Workout World
Sales 882.4 9.5%
LFL Sales growth(1) 6.3%
EBITDA 105.2 18.7%
EBITDA margin % 11.9% 0.9%
EBIT 83.4 20.7%
EBIT margin % 9.5% 0.9%
Infinite Retail
EBIT(2) (5.6) (2.1)m
Sports Segment EBIT 77.8 18.6%
RebelFIT

12
Group & Unallocated
2015/16
$m
Change on
PCP
Sales 7.3 17.7%
$m
EBITDA (25.3) (2.3)
EBIT (25.7) (2.0)
Comprising:
Corporate costs (6.9) (1.4)
Unutilised storage (8.0) 4.4
Digital (8.2) (3.7)
Other Group costs (2.6) (1.3)
• Group and Unallocated includes:
• Corporate costs not allocated to segments
• Commercial Operations
• Super Retail Commercial
• Oceania Bicycles
• Digital Businesses
• Fixed Price Car Service
• Youcamp
• Auzzie Outdoors
• Costs not allocated include corporate activities, un-
utilised distribution centre space and investment in
building the Group’s digital capability
• Excess storage costs reducing over time reflecting
business growth and lease expiries
• Investment in the Group’s digital initiatives have been
expensed rather than capitalised due to the early
development phases of the projects/investments and
the uncertain return

13
Group Cash Flow
2015/16
$m
2014/15
$m
Operating cash flow
(pre store set up
investment)
184.4 196.2
Store set up investment (25.2) (14.2)
Operating cash flow 159.2 182.0
Stores (56.1) (38.8)
Other Capex (23.8) (33.1)
Business acquisition 0.0 0.0
Investing Cash flow (79.9) (71.9)
Dividends & interest (100.3) (100.5)
Ext Debt
(repay)/proceeds 23.3 (20.6)
Financing Cash flow (77.0) (121.1)
Net Cash flow 2.3 (11.0)
• Operating cash flow (pre store set up investment)
is circa $26m higher than PCP on a LFL basis
(excluding week 53 net payments)
• Strong underlying operating cash flow
performance has funded investment in new stores
and operational capital expenditures
• New and refurbished store investment of $81.3m is
fully funded out of operating cash flows. Store
refurbishment returns continue to support the
larger refurbishment programs in Auto and Sports
• Investment in new and refurbished store capex is
split: $25.6m in Auto, $16.2m in Leisure and $14.3m
in Sports
• Other capital expenditure is lower due to
completion of the new distribution centres
• Investment in building digital capability has been
expensed rather than capitalised
• Debt position has increased slightly due to timing
of the financial close as noted earlier
14
Group Balance Sheet
Jun 16
$m
Jun 15
$m
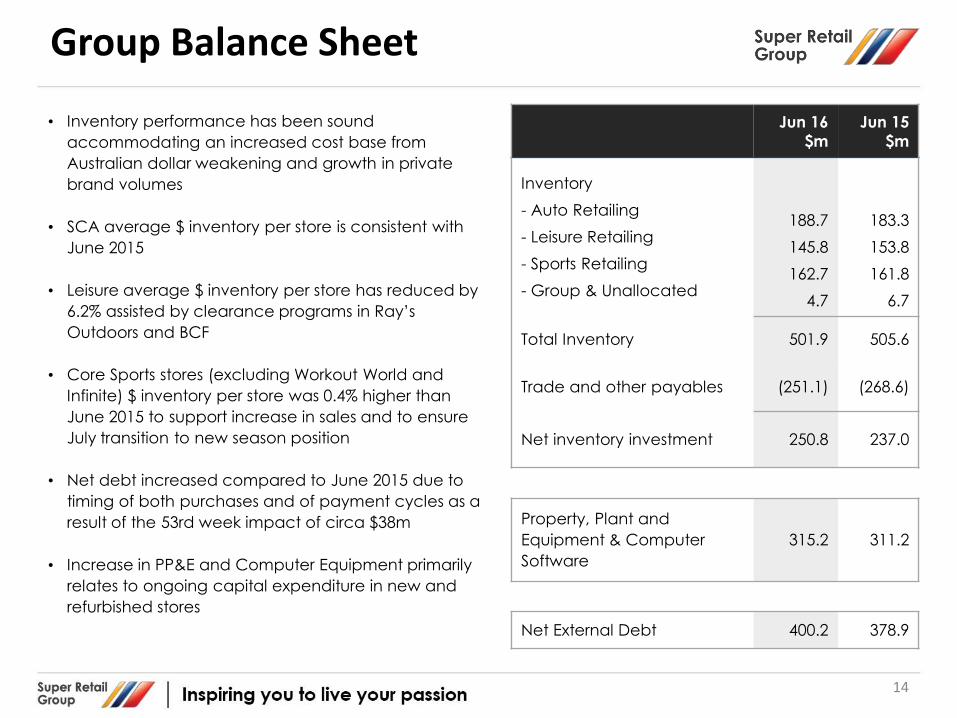
Inventory
- Auto Retailing
- Leisure Retailing
- Sports Retailing
- Group & Unallocated
188.7
145.8
162.7
4.7
183.3
153.8
161.8
6.7
Total Inventory 501.9 505.6
Trade and other payables (251.1) (268.6)
Net inventory investment 250.8 237.0
Property, Plant and
Equipment & Computer
Software
315.2 311.2
Net External Debt 400.2 378.9
• Inventory performance has been sound
accommodating an increased cost base from
Australian dollar weakening and growth in private
brand volumes
• SCA average $ inventory per store is consistent with
June 2015
• Leisure average $ inventory per store has reduced by
6.2% assisted by clearance programs in Ray’s
Outdoors and BCF
• Core Sports stores (excluding Workout World and
Infinite) $ inventory per store was 0.4% higher than
June 2015 to support increase in sales and to ensure
July transition to new season position
• Net debt increased compared to June 2015 due to
timing of both purchases and of payment cycles as a
result of the 53rd week impact of circa $38m
• Increase in PP&E and Computer Equipment primarily
relates to ongoing capital expenditure in new and
refurbished stores

15
Returns & Capital Ratios
2015/16 2014/15
Normalised EPS 55.1c 54.0c
Basic EPS from continuing
operations 31.8c 41.2c
Fixed charge cover –
normalised EBITDAL 1.93x 1.89x
Average Net Debt $405m $435m
Jun 16 Jun 15
Net Debt : Capital –
continuing operations
- Headline
- Adjusted(1)
35.3%
71.6%
33.1%
68.4%
Reported Annualised Post
Tax Return on Capital
(ROC)(2)
10.7% 10.6%
(1) Adjusted capital includes leases capitalised into debt at 6x annual charge
(2) Based on Normalised Net Profit After Tax
• All debt funding is compliant with financial
covenants
• Fixed charge cover ratio based on reported
EBITDAL is 1.69 which is above covenant
• Average net debt improvement is due to working
capital improvements through the year
• Return on Capital remains below targeted level
but above WACC
• Effective AUD/USD rate for the period was 0.76,
down from 0.86 in pcp. The AUD/USD hedge rate
for next 12 months circa 0.72
• Effective tax rate was 33.9% due to non
recognised tax losses incurred in joint venture
businesses or in overseas jurisdictions. This includes
losses in Fixed Price Car Service, Youcamp, Auzzie
Outdoors and Infinite Retail. The effective tax rate
is expected to return to normalised levels
approximating 30% in future years.

Segment Note 2015/16
16
For the period ended 2 July 2016
Auto $m
Leisure $m
Sports $m
Total continuing operations
$m
Inter-segment eliminations/
unallocated $m
Consolidated $m
Segment Revenue and Other Income
External segment revenue 922.8 581.9 910.2 2,414.9 7.9 2,422.8
Inter segment sales - - - - (0.6) (0.6)
Other income - - 0.9 0.9 0.7 1.6
Total segment revenue and other income 922.8 581.9 911.1 2,415.8 8.0 2,423.8
Segment EBITDA(1)
133.2 37.5 100.3 271.0 (25.3) 245.7
Segment depreciation and amortisation(2)
(28.6) (18.9) (22.5) (70.0) (0.4) (70.4)
Segment EBIT result 104.6 18.6 77.8 201.0 (25.7) 175.3
Net finance costs (19.4)
Total segment NPBT 155.9
Segment income tax expense(3)
(47.3)
Normalised NPAT 108.6
Other items not included in the total segment NPAT(4)
(45.8)
Profit for the period attributable to:
Owners of Super Retail Group Limited 62.8
Non-controlling interests (4.8)
Profit for the period 58.0 (1)Adjusted for business restructuring costs of $43.3 million and the $20.0 million impairment charge for the Ray’s Outdoors brand, refer to note 11 – Intangible assets.
(2) Adjusted for NCI depreciation of $0.9 million and $14.9 million provision for depreciation relating to business restructuring. (3 )Excludes $17.5 million relating to the tax effect of business restructuring costs with a value of $63.3 million. (4)Includes $63.3 million of business restructuring costs (including $20.0 million impairment) and the associated income tax benefit of $17.5 million.

Segment Note 2014/15
17
For the period ended 27 June 2015
Auto $m
Leisure $m
Sports $m
Total continuing operations
$m
Inter-segment eliminations/
unallocated $m
Consolidated $m
Segment Revenue and Other Income
External segment revenue 854.3 543.2 835.0 2,232.5 8.2 2,240.7
Inter segment sales - - - - (2.0) (2.0)
Other income 0.7 - 0.9 1.6 0.9 2.5
Total segment revenue and other income 855.0 543.2 835.9 2,234.1 7.1 2,241.2
Segment EBITDA(1)
119.4 48.8 85.8 254.0 (23.0) 231.0
Segment depreciation and amortisation(2)
(23.4) (16.5) (20.2) (60.1) (0.7) (60.8)
Segment EBIT result 96.0 32.3 65.6 193.9 (23.7) 170.2
Net finance costs(3)
(21.6)
Total segment NPBT 148.6
Segment income tax expense(4)
(42.3)
Normalised NPAT 106.3
Other items not included in the total segment NPAT(5)
(9.0)
Loss from discontinuing operations (16.2)
Profit for the period attributable to:
Owners of Super Retail Group Limited 81.1
Non-controlling interests (4.2)
Profit for the period 76.9 (1)Adjusted for business restructuring costs for continuing operations and discontinuing operations. (2)Adjusted for expenses pertaining to discontinued operations of $5.9 million and business restructuring costs for continuing operations of $0.4m. (3)Adjusted for non-controlling interest (NCI) interest of $0.3 million). (4)Segment income tax expense of $42.3 million excludes $3.8 million relating to the tax effect of business restructuring costs with a value of $12.8
million, refer to (i) below. (5)Includes $12.8 million of business restructuring costs, the related income tax effect of $3.8 million.
Contents
2015/16 Financial Results 2016/17 Trading Update Group Strategy

19
2016/17 Trading Update
Auto Retailing
• LFL sales growth in the first 7 weeks of 2016/17 circa 3.5%
• SCA store development: plan to open 15 new stores and close one store, 50 refurbishments, extensions
and relocations
Leisure Retailing
• LFL sales growth in the first 7 weeks of 2016/17 circa 10.0%
• 1st quarter Ray's Outdoors clearance will boost its LFL sales growth but dampen BCF’s LFL sales growth
• Ray’s Outdoors clearance activity and store closures are on track
• Store development plan to open 14 BCF stores (3 new sites and 11 conversions for Ray’s Outdoors sites)
Sports Retailing
• LFL sales growth in the first 7 weeks of 2016/17 circa 4.0%
• Store development: plan to open two new Rebel stores and 12 Amart Sports stores (including 5 conversion
of Ray’s Outdoors sites)
Group
• Group Unallocated costs to be circa $21m, including Corporate $8m, unutilised distribution centre storage
$5m, Digital $5m, and Other $2m
• Planned capital expenditure of circa $115m to support the larger store development program, Rays
transformation and investment in information systems

Contents
2015/16 Financial Results 2016/17 Trading Update Group Strategy
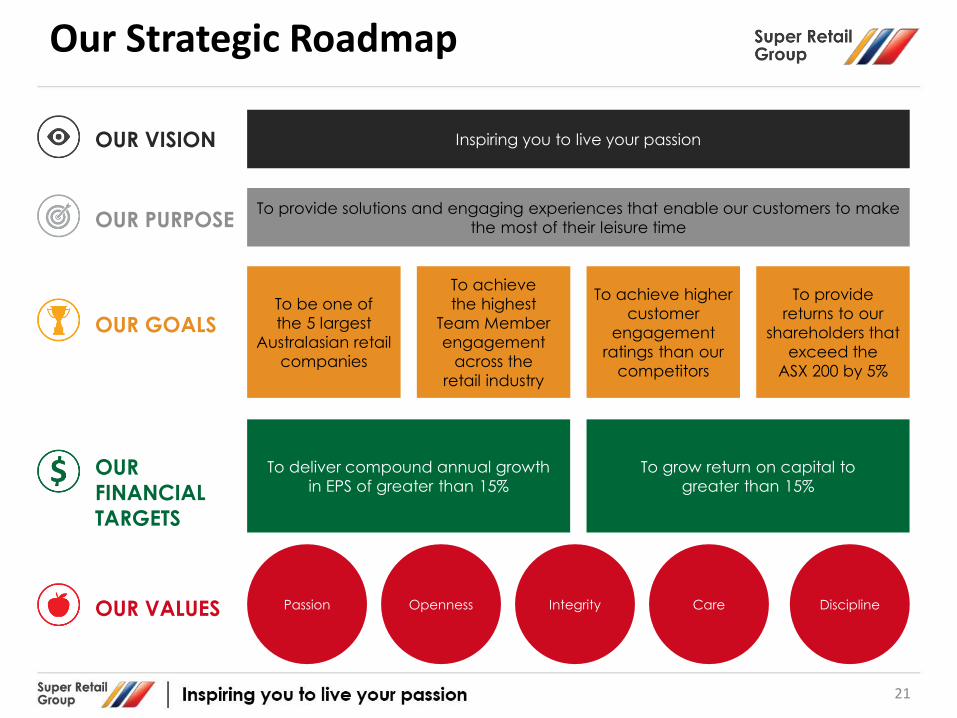
Our Strategic Roadmap
21
Inspiring you to live your passion
To provide solutions and engaging experiences that enable our customers to make
the most of their leisure time
To be one of
the 5 largest
Australasian retail
companies
To achieve
the highest
Team Member
engagement
across the
retail industry
To provide
returns to our
shareholders that
exceed the
ASX 200 by 5%
To achieve higher
customer
engagement
ratings than our
competitors
To grow return on capital to
greater than 15%
To deliver compound annual growth
in EPS of greater than 15%
Passion Openness Integrity Care Discipline
OUR VISION
OUR PURPOSE
OUR GOALS
OUR
FINANCIAL
TARGETS
OUR VALUES

Solutions that engage and inspire our customers Opening circa 150 new stores over
the next 5 years
Strategic Pillars
22
In store experience that benchmarks strongly against best
in class for our categories
Strong portfolio of existing stores in the right location for our target
customers
Group wide focus on driving customer endorsement through team and customer engagement
TODAY 5 YEAR PLAN
Market leading retail brands in all our categories (apart from outdoor
adventure)
Continued development of digital businesses and in developing
interactive digital communities based around leisure passions
First to market access to the best products through our strong partnerships with our trade
partners and our sourcing and supply chain capabilities
Market leading digital engagement with our retail brands – conversion
currently below par
Extension of our offer into physical services to provide customer
solutions
Early exploration of digital business models extending service
offering
Continual focus on improving customer experience through the
store refurbishment program – circa 80 stores per annum
Developing ecommerce customer experience and fulfilment
capabilities
Increasing range of services provided in store and out of store through partnering with 3rd party
providers
Continual focus on developing our trade partner partnerships

Customer Understanding and Insight
Strengthening in-house capabilities to generate insights to improve the customer experience and maximise
customer lifetime value
Leading Private and Exclusive Brands
Strong portfolio of private brands: Auto circa 42% of sales
Leisure circa 36% of sales Sports circa 14% of sales
Strategic Pillars
23
Large active membership of loyalty programs:
Auto – 1.2 million active Leisure – 1.5 million active Sports – 1.8 million active
Exclusive access to selected international brands
Basic in-house customer analytics capability
Growing active membership and lifetime value
TODAY 5 YEAR PLAN
Strong portfolio of differentiated private brands:
Auto circa 50% of sales Leisure circa 40% of sales Sports circa 25% of sales
Secure additional exclusive international brands
Deep understanding of our target customers across all categories
TODAY 5 YEAR PLAN

Agile and Efficient Supply Chain
Further $55m to $80m net inventory reduction delivered from
existing capabilities and new allocations management systems
Engaged and Capable Team High levels of team member engagement and retention
Strategic Pillars
24
Distribution centre and freight network to support business plans
are built and operational
Strong corporate culture built around core values and vision
Some Sports logistics managed by 3PL
$20m cost savings driven through productivity, freight efficiencies and
sports integration
TODAY 5 YEAR PLAN
Evolving culture to support changing business model and team member expectations - customer centricity, collaboration and agility
Enhanced leadership and capability development
Best of breed warehouse management and forecasting and
replenishment systems
Multi channel fulfilment capability that meets customer expectations
Improving performance across safety and diversity
Sustained engagement and retention with improved safety and
diversity
TODAY 5 YEAR PLAN

Strong, Sustainable and Efficient Foundations
Developing performance management framework to support
evolving business model
Strategic Pillars
25
Strong performance framework and IT infrastructure that supports
traditional product and physical channel business model
Strong cost control disciplines across the Group
$10m group wide procurement and productivity savings program
TODAY 5 YEAR PLAN
IT Transformation: • Establish 3rd party managed data
centre • Implementation of a new digital
platform, middleware, business analytics and allocations systems
• Enhanced cyber security management
Compliant sustainability and ethical souring practices
Enhanced sustainability and ethical sourcing governance
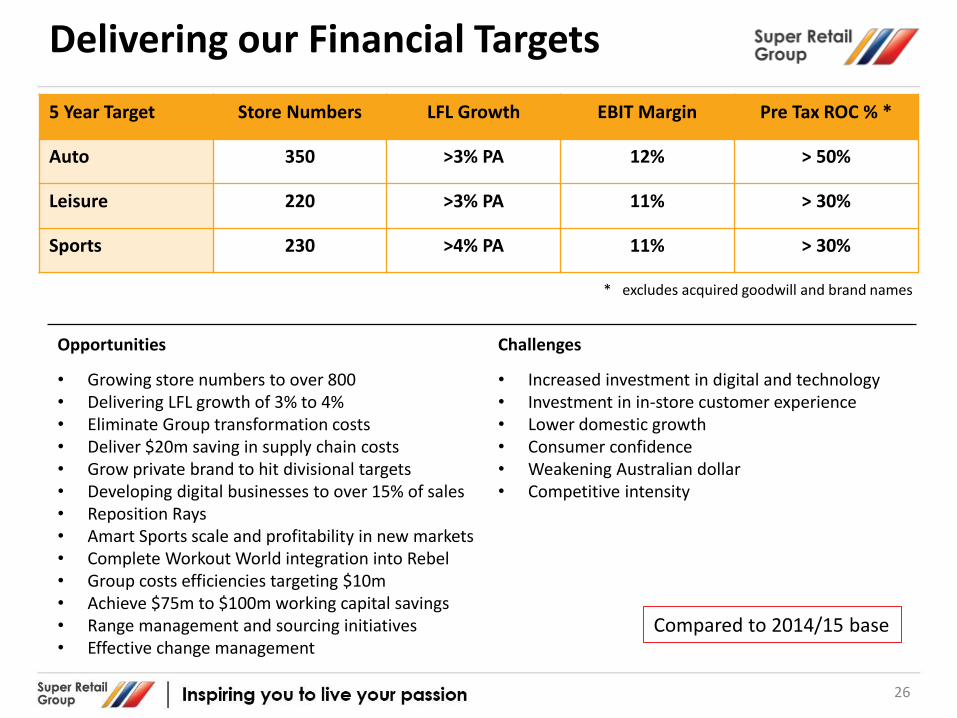
Delivering our Financial Targets
Opportunities
• Growing store numbers to over 800 • Delivering LFL growth of 3% to 4% • Eliminate Group transformation costs • Deliver $20m saving in supply chain costs • Grow private brand to hit divisional targets • Developing digital businesses to over 15% of sales • Reposition Rays • Amart Sports scale and profitability in new markets • Complete Workout World integration into Rebel • Group costs efficiencies targeting $10m • Achieve $75m to $100m working capital savings • Range management and sourcing initiatives • Effective change management
Challenges
• Increased investment in digital and technology • Investment in in-store customer experience • Lower domestic growth • Consumer confidence • Weakening Australian dollar • Competitive intensity
26
5 Year Target Store Numbers LFL Growth EBIT Margin Pre Tax ROC % *
Auto 350 >3% PA 12% > 50%
Leisure 220 >3% PA 11% > 30%
Sports 230 >4% PA 11% > 30%
* excludes acquired goodwill and brand names
Compared to 2014/15 base


![53 weeks to 52 weeks to Change 30 April 2017 24 April 2016 .../media/Files/S/... · 7/20/2017 · Net debt(5) 182.1 99.7 KEY HIGHLIGHTS • Group revenue increased by 11.7% [1] o](https://static.fdocuments.net/doc/165x107/60360b6d3ab510635611c9f5/53-weeks-to-52-weeks-to-change-30-april-2017-24-april-2016-mediafiless.jpg)