Results Bda
10
Results: It is easy to understand the visual representation, instead of large data sets in form of rows and columns. With the help of Tableau, we represent the data in form of graph and figures for better understanding. Now, our analysis is as follows: 1. International Carriers with maximum delay in January 2008.
description
imt
Transcript of Results Bda

Results:
It is easy to understand the visual representation, instead of large data sets in form of rows and columns. With the help of Tableau, we represent the data in form of graph and figures for better understanding.
Now, our analysis is as follows:
1. International Carriers with maximum delay in January 2008.
9E have the highest numbers of Arrival delays (15782) and Departure Delays(12980)

2. Weekday with maximum number of delays in arrival as well as departure
Day 2 have highest delay in Arrival as well as departure i.e. Monday.
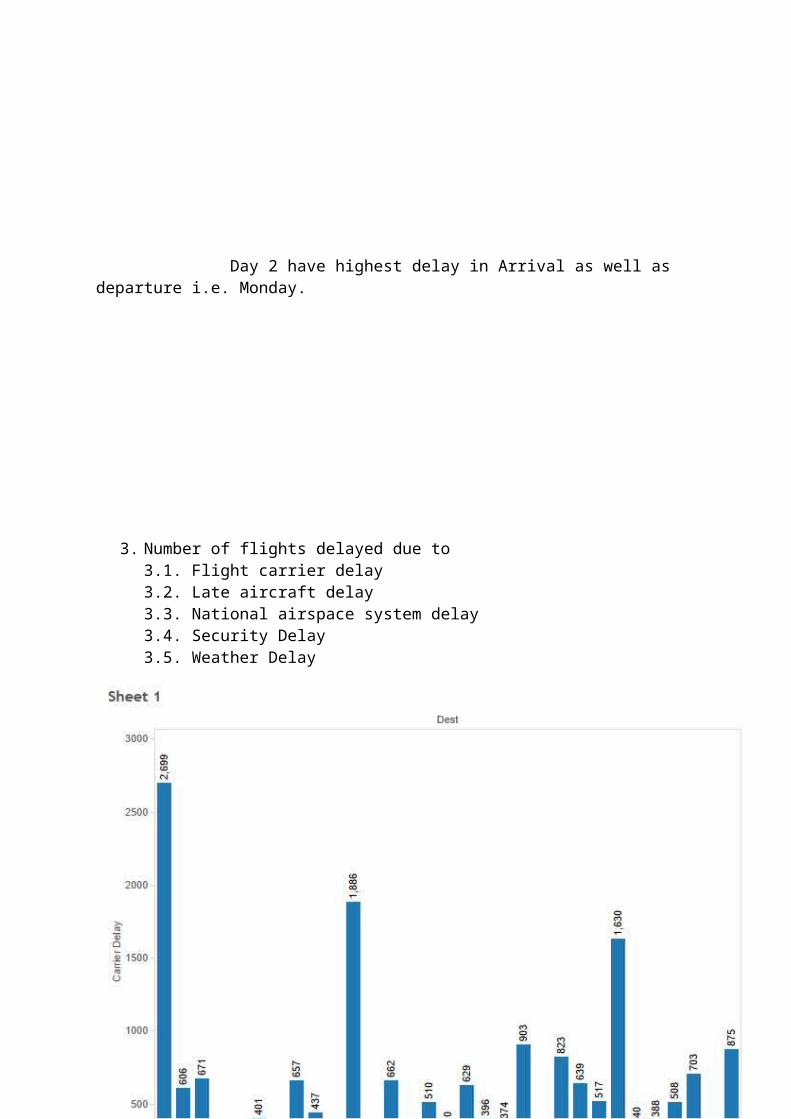
3. Number of flights delayed due to 3.1. Flight carrier delay3.2. Late aircraft delay3.3. National airspace system delay3.4. Security Delay 3.5. Weather Delay


Graph 1 shows ATL have maximum number of flight delay while Graph 2 &3 shows delay due to Aircraft arrival and NAS from previous destination affects ORD, the most. Graph 4 shows security delays affects PHX most. Graph 5 shows MDW is most affected due to weather delay.
4. Carriers affected most with the numbers of different delays4.1. Weather Delay4.2. Late Aircraft Delay4.3. NAS Delay4.4. Security Delay

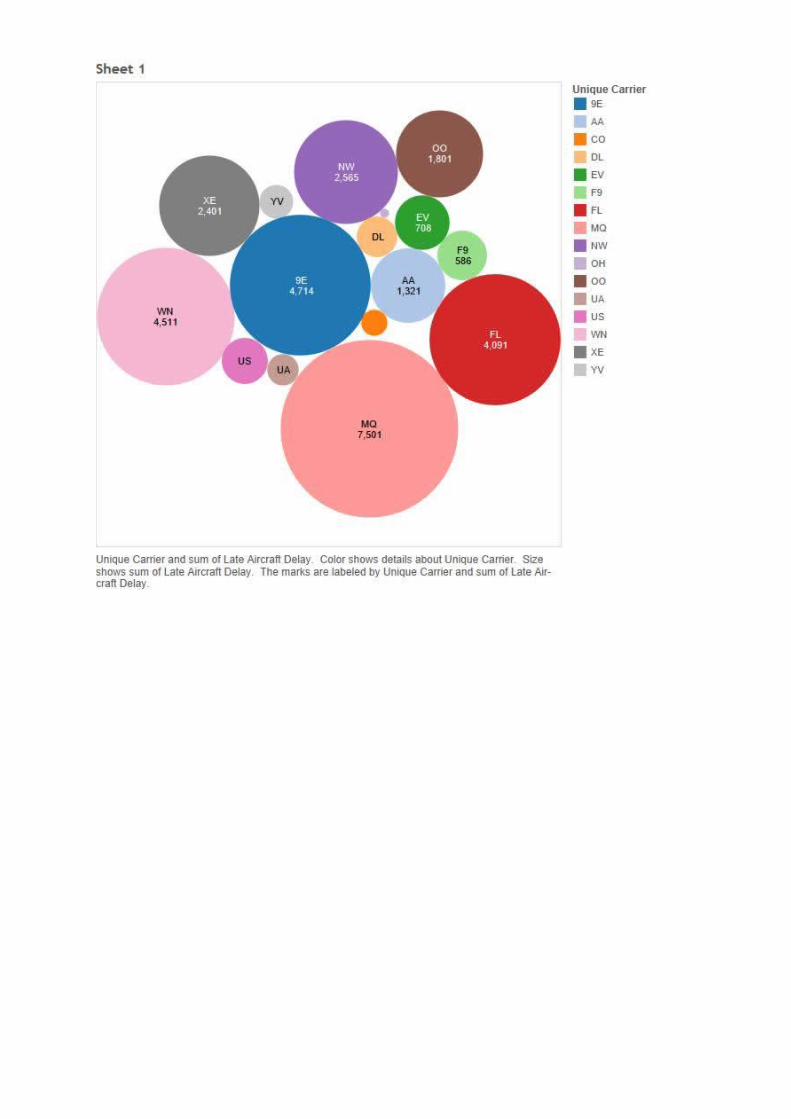

WN suffers most with weather delay and security delay. MQ suffers with late aircraft delay and OO suffers with NAS delay most.
5. Security Delay
Seventh Day i.e. Saturday have most numbers of Security delays.