Results Balloon Flight Solar Cell Calibration Program · Solar cells made in recent years haw...
40
JPL Publiq&n%7-44 Results of the 1987 NASNJPL Balloon Flight Solar Cell Calibration Program B. E. Anspaugh R. S. Weiss s ~ - . (UASA-CR-382617) RESULTS OF THE 1987 188- 194 13 1aSA/JPL BAUOOB PLIGHT SOLAR CELL CALIBRITIOB PEOGRAN :Jet Propulsion Lab.) 39 P CSCL 018 Unclas G3/02 0131806 December 15,1987 NASA National Aeronautics and Space Administration Jet Propulsion Laboratory California Institute of Technology Pasadena, California https://ntrs.nasa.gov/search.jsp?R=19880010029 2020-08-06T06:00:40+00:00Z
Transcript of Results Balloon Flight Solar Cell Calibration Program · Solar cells made in recent years haw...

JPL Publiq&n%7-44
Results of the 1987 NASNJPL Balloon Flight Solar Cell Calibration Program B. E. Anspaugh R. S. Weiss
s ~ - . (UASA-CR-382617) RESULTS OF THE 1987 188- 194 13 1aSA/JPL B A U O O B PLIGHT SOLAR CELL
CALIBRITIOB PEOGRAN :Jet Propuls ion Lab.)
39 P CSCL 018 Unclas G3/02 0131806
December 15,1987
NASA National Aeronautics and Space Administration
Jet Propulsion Laboratory California Institute of Technology Pasadena, California
https://ntrs.nasa.gov/search.jsp?R=19880010029 2020-08-06T06:00:40+00:00Z

~ ~~
JPL Publication 87-44
Results of the 1987 NASNJPL Balloon Flight Solar Cell Calibration Program B. E. Anspaugh R. S. Weiss
December 15,1987
National Aeronautics and Space Administration
Jet Propulsion Laboratory California Institute of Technology Pasadena, California

The research described in this plblication was carried out by the Jet propllsion Laboratory, California Institute of Technology, under a contract with the National Aeronautics and Space Administration.
Reference herein to any specific canmercial product, process, or service by trade name, tradenark, manufacturer, or otherwise, does not constitute or Imply its endorsenrent by the United States Government or the Jet Propulsion Laboratory, California Institute of Technology.

ABSTRACT
The 1987 solar cell calibration talloon flight was successfully canpleted
on August 23, 1987, meeting all objectives of the program.
mochrles vere carried to an altitude of 120,000 ft (36.0 Lon). The calibrated
cells can now be used as refererice standards in simulator testing of cells and
arrays.
Forty-eight
i

- The authors wish to extend appreciation for the cooperation and support
provided by the entire staff of the National Scientific Balloon Facility
located in Palestine, Texas.
persannel, especially Ed Mann for perfonning all the pre-flight solar cell
masummnts.
organizations are greatly appreciated.
Gratitude is also extended to assisting JPL
The cooperation and patience extended by all participatirg
iv

1 . I~ImANDoveRvIEw . . . . . . . . . . . . . . . . . . . . . . . 1
2.m.m1mPT#X=EWlRES . . . . . . . . . . . . . . . . . . . . . . . . . 3
2.1 BKlDUIZFABRICATIUBJ . . . . . . . . . . . . . . . . . . . . . . . . 3
2.2 C E t L h E A S ~ . . . . . . . . . . . . . . . . . . . . . . . 3
2 .3 -m CoEFFICIWJ!S AM) MAST SQUW BITS . . . . . . . . . 4
2.4 PANELAssagLYANDcHw=KIoIlT . . . . . . . . . . . . . . . . . . 4
2.5 PRE-KAUMX pRocEDuRes AT PALESTINE . . . . . . . . . . . . . . . 7
3.BALKlCMsySrpM . . . . . . . . . . . . . . . . . . . . . . . . . . . . 8
3.1 BALUONDESXIPTION . . . . . . . . . . . . . . . . . . . . . . 8
3.2 TOPPAYUMD . . . . . . . . . . . . . . . . . . . . . . . . . . 10
3.3 -PAYIDAD . . . . . . . . . . . . . . . . . . . . . . . . . . 13
4 . FLIQlTSEQuENI=E . . . . . . . . . . . . . . . . . . . . . . . . . . . 17
4 .1 PRE-LAU"pRepARATIONS . . . . . . . . . . . . . . . . . . . . 17
4.2 FLIGHT . . . . . . . . . . . . . . . . . . . . . . . . . . . . . 21
4.3 E'LIGHT TERMINATION . . . . . . . . . . . . . . . . . . . . . . . 22
5 . DATAANALYSIS . . . . . . . . . . . . . . . . . . . . . . . . . . . . 25
5.1 CCWUTERANAtysIS . . . . . . . . . . . . . . . . . . . . . . 25
5.2 CALIBRATIolyRESULTS . . . . . . . . . . . . . . . . . . . . . . 28
5.3 UPDATEOFBE'S-17ADATA . . . . . . . . . . . . . . . . . . . . . 28
6 . CCNCLUSIm . . . . . . . . . . . . . . . . . . . . . . . . . . . . . 31
7 . REFERWCE . . . . . . . . . . . . . . . . . . . . . . . . . . . . . . 32
I
V

Figures
Figure 1 . Photograph of tk 1987 Balloon Flight Solar Panel . . . . . . . 5
F i g u r e 2 . 1987ModulemtimChart . . . . . . . . . . . . . . . . . . 6
9
14
Figure 3 . Aluminum Hoop Assembly w i t h Tracker Mmmted . . . . . . . . . . Figure 4 . Block Diagram of Ballom Telemetry System . . . . . . . . . . . Figure 5 . Flight Train canfiguration . . . . . . . . . . . . . . . . . . 19
Figure6 . BalloonLaunch . . . . . . . . . . . . . . . . . . . . . . . . 20
Figure 7 . 1987 Balloon Flight Profile . . . . . . . . . . . . . . . . . . 24
Tables
Table 1 . 1987 Balloon Flight 8/23/87 120. OOO FT . RW1.0112 Flight NO . 1450P . . . . . . . . . . . . . . . . . . . . . . . . . . . . . . 29
30 -le 2 . Repeatability of Standard Solar Cell RF'S-17A . . . . . . . . . .
V i

!
!
1. lNmoDumIoN AND m 1 E W
The primary source of electrical power for unnamed space vehicles is the
direct conversion of solar energy thrmgh the use of solar cells.
advancing cell technology cosltinues to d i f y the spectral msponse of solar
cells to utilize more of the sun's spectrum, designers of solar cells an3
arrays m s t have the capability of measuring these cells in a light beam that
is a close match to the solar spectrum.
very closely by laboratory solar simulators.
ard the sizing of solar arrays requires such highly accurate measurements that
the intensity of these simulators must be set very accurately.
in settiw the simulator intensity can conceivably cause a disastrous mis-
sizing of a solar panel, causillg either a premature shortfall in paver or the
launch of an oversized, overwight solar panel.
As
The solar spectrum has been matched
But the design of solar cells
A small error
The JPL solar cell calibration program was conceived to prduce reference
standards for the pu;.pose of properly setting solar simulator intensities.
The concept was to fly solar cells on a high-altitude balloon, msasure their
output at altitudes near 120,000 ft, recover the cells, a d use them as
reference standards. The reference cell is placed
in the simulator beam and the beam intensity is adjusted until the reference
cell reads the same as it read on the balloon. As lang as the reference cell
has the same spectral respame as t h cells or -1s to be meamred, this is
a v e r y accurate method of settitlg the intensity.
changes, the spectral reqonse of the solar cells changes also, and reference
standamh must be continually renewed.
The pmcedwe is simple.
But as solar cell technology
I
1

Until the sumaer of 1985, there had always been a question as to haw much
the atmosphere above the balloon modified the solar spectrum.
modification was significant, the reference cells might not have the required
accuracy.
resporrses and if the atmosphere has any effect at all, it would be expected to
modify the calibration of such blue cells much more than that of their
If the
Solar cells made in recent years haw increasirgly higher blue
predecesso=.
In late 1984, a collection of solar cells rep-tirg a wide cross
section of solar cell techmlogy vas f l m on the D i s c o v e r y shuttle as a part
of the Solar Cell Calibration E’acility (SCCF) experiment. They were
calibrated as reference cells on this flight using procedures similar to those
USBd on the balloon flights.
balloon flight and ramamred.
nearly identical results (Ref. l), the reference standards fran balloon
flights may continue! to be used w i t h high confidence.
The same cells -re then flawn on the 1985
Since the two sets of -ts gave very
2

I
!
2. PRE-FLIrn FmmmREs
2.1 MODULE FABRICATION
The cells wcre nmunted by tha psrticipants on JpG-supplied standard
modules accordillg to starrdard pmcdwes developed for the construction of
reference cells.
by a fiberglass circuit board with insulated solder posts.
painted a high reflectance white and was pe-tly provided with a load
resistor. Tkris resistor performs two tasks. First, it loads the cells mer
short circuit current, which is the cell parameter that varies in direct
proportion to light intensity.
near 100 mV during the flight, matching a constraint imposed by the telemtry
electronics.
for a 2 x 4 an cell, etc.
Prxnpc)
three-year period.
The JFZ standard module is a machined capper block, rimned
This assembly v a s
secoad, it scales the cell outputs to read
W resistance values are 0.5 ohm for a 2 x 2 an cell, 0.25 o h
The load resistors are precision (0.1 percent, 20
have a resistance stability equal to or tetter than +0.002% over a
The 1987 flight incorporated 48 solar cell modules from 10 different
vendors.
had been flown on earlier flights were reflown.
included again, as it has been on every balloon flight since 1963.
continues to update our historical record of the calibration procedure
repeatability.
The cells included both Si ard GaAs types. Eight GaAs cells that
JPL Module RE'S-17A was
Its output
2.2 CELL MEASUREMENTS
After the cells were mounted onto the capper blocks, the electrical
output of each cell module was measured under illumination by the JPL X25
3

Mark I1 solar simulator. For these nrsasurements, the simulator intensity was
set using only ane reference cell--no attempt was mde to match the spectral
resporrse of the reference stmdard to the irdivldual cell modules.
absolute accuracy of these meesureaents is therefore unlnrown, but the
-ts do allaw checking of the modules for any unacceptable assembly
losses or instabilities.
exactly the same way to check for any cell
have occurred as a result of the flight.
Tha
After the balloon flight, the! cells were measured in
or instabilities that may
2.3 TEWEE?ATuRE COEFFICIENl!S AM) LEAST SQUARe FITS
The temperature coefficients of the mounted cells were also measured
before the flight.
in a vacuum chamber. Outputs were measured at 0, 20, 40, 60, and 80 deg C
under illumination with the X25. The temperature coefficients of the cell
modules were canputed fran these data by fittirq the autplt vs temperature
relationship with a linear least squares fit.
The modules were mounted on a temperature controlled black
2.4 PANEL A S S m L Y AND CHECKWT
After the electrical measurements were completed, the modules were
Figure 1 is a mounted on the solar panel and c m t e d electrically.
pbtograph of the nmddes after completion of these steps am3 Figure 2 is a
diagram which identifies the mdules in the photograph by their serial
numbers.
together were given complete functional tests in terrestrial sunlight. The
assembled tracker and panel w e r e placed in sunlight on a clear, bright day,
and checked for the tracker's ability to acquire and track the sun while each
After completion of the panel assembly, the panel and tracker
4

I 5

U M w - 2&
@ a B
6

i
!
t
t
cell mOdule was checked for electrical output.
colrpleted satisfactorily, the assembly was shipped to the National Scientific
Balloon Facility (NSBF) in Palestine, Texas, for flight.
bhen tkse tests were
2.5 PRE-LW" AT PACESTINE
The NSBF wa6 established in 1963 at Palestine, Texas. This location was
chosen because it has favorable weather cosditiam for balloon launching and a
large number of clear days with light surface winds.
in this part of the country take the balloons over sparsely popllated areas so
the descending payloads are unlikely to hit anyone.
flights have flawn f m n the Palestine facility since 1973. The flights are
scheduled to fly in July or August since the sun is high in the sky at that
time of year, and the sunlight passee through a minimum depth of atmqhere
before reaching the solar modules.
The high-altitcrde winds
The JPL calibration
Upon arrival at Palestine, the tracker and mdule payload were again
!Che data encoder was connected to the module checked for proper operation.
payload and an end-to-end check wa8 performed an the payload, telemetry,
receiving ard decoding systems.
mounted to the tracker assembly and its four output voltage levels wired into
the telemetry stream aloq with the mOdule outputs.
converter system was calibrated by recording these four voltage levels as they
were inplt to the system and as they were converted, decoded, and sent through
the system as digital output values.
by replacing one of the thermistors with a known resistor while the entire
system was operating.
calibrated resistors, which correspond to specific resistances on the
A self-contained voltage reference bax was
The analog-to-digital
The thermistor channels =re calibrated
The process was repeated using a set of nine carefully
7

resistance vs temperature calibration curve for that thermistor.
referersx voltage procedure, input vs autput values w e r e recorded.
procedure was repeated to calibrate all the thermistor channels.
As for the
Then the
After all the checkouts and calibrations w e r e performed, the tracker was
mounted onto the alunimm M a r hoop assembly wh ich will ride on the top
portion (or apex) of the balloon.
solar panel after mounting onto the hoop.
Figure 3 is a photograph of the tracker and
3. BALu3oNSYSTEM
The main canponents of the balloon flight system were (1) The apex-
mounted hoop assembly that contains the experimental packxje, the data
encoder, the recovery system and the camera pacwe, ( 2 ) the balloon, and (3)
the lower payload that contains the telemetry and paver systems.
3.1 B N U O N DESCRIPTION
The balloon employed for the JPL solar cell calibration high-altitude
flights had a volulne of 3.49 million ft3 (99,OOO m3) and was made from 0.8 mil
(20 micron) thick stratofilm, a polyethylene film designed for balloon use.
The balloon alone weighs 762 pounds (346 kg) . The balloon was designed to
lift itself along with the bottan and top payloads to a float altitude of
120,000 ft (36 km). At float altitude, the balloon will have a diameter of
roughly 188 ft (59 m).
and bottan payloads was hilt into the balloon during its mufacture.
balloon was built with an internal rip line designed to rip a hole in the side
of the balloon for terminatian of the flight.
A multicandhrctor cable to electrically connect the top
The
A special structure was built
8

Figure 3. Aluminum Hoop Assembly with Tracker Maunted
9

into the top of the belloon for attaching the top payload. 'Ituo poppet ~ l v e s
incorporated into this mounting structure will open and release helium fran
the balloon at the d of the flight. The poppet valves act as a back-w to
the rip line.
Trying to inflate and launch a balloon with a sizeable weight attached to
its top is like tryins to balance a 30 ft broan hardle on the end of your
fiqer when the broom -le has a 50 lb weight on top. A tow bdlloon, tied
to the top payload, was used durirg the inflation and launch phases to add
stability and keep the top payload on top.
31 ,OOO ft3, is designed to lift abaut 160 lb (73 log).
This smaller balloon, about
The taw balloon was cut
loose from the top payload after launch as soon as the main balloon quit
oscillating.
The top payload consists of the tracker, solar -1, voltage reference
bux, multiplexer, data encoder, single-frame movie camra, clock, descent
parachute, and tracking beam. All these items w e r e mounted to the aluminum
hoop assembly sham in Figure 3. The hoop assembly, with appropriately placed
styrofoam crush pads, served the following functions:
Permitted the t y t e d payload to "float" c#l tap of the balloon and minimized billowing of balloon material araund the top payload.
Served as the mounting surface to the balloon's top end fitting.
W i d e d a convenient point for attaching the tow balloon and the descent parachute.
Acted as a shock damper to protect a r ~ I minimize damage to the top payload at touchdown.
10
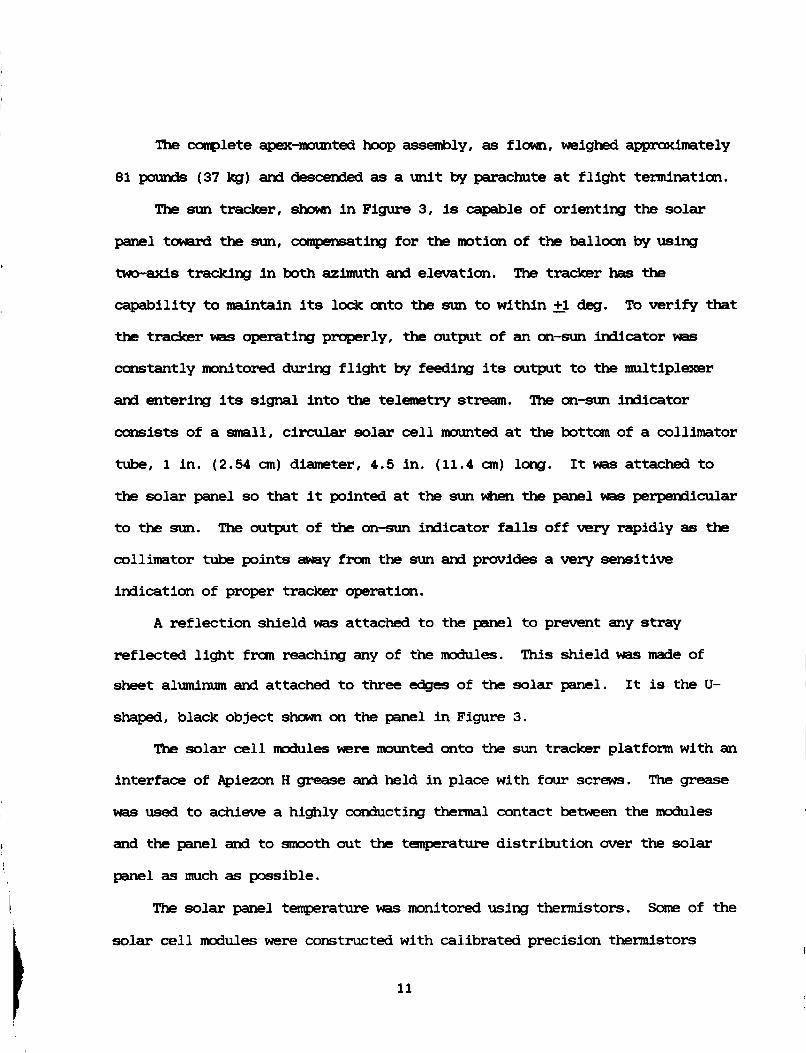
The mnplete apex-ted hoop assembly, as f l m , weighed applmdmately
81 pounds (37 kg) and descended as a unit by parachute at flight termination.
The sun tracker, s h m in Figure 3, is capable of orienting the solar
panel taward the sun, compensating for the motion of the balloon by using
two-axis tracldng in both azimuth and elevation.
capability to maintain its lock onto the sun to within kl deg.
the tracker was operating properly, the output of an on-sun indicator was
constantly monitored during flight by feeding its output to the multiplexer
and entering its signal into the telemetry stream.
mists of a small, circular solar cell mounted at the bottom of a collimator
tube, 1 in. (2.54 an) diameter, 4.5 in. (11.4 an) l oq . It was attached to
the solar panel so that it pointed at t h sun when the panel was perperdinilar
to the sun.
collimator tube points away frwn the sun and provides a very sensitive
indication of proper tracker operation.
The tracker has tha
To verify that
The on-sun indicator
The output of the on-sun indicator falls off very rapidly as the
A reflection shield was attached to the panel to prevent any stray
This shield was made of reflected light fran reaching any of the modules.
sheet aluminum and attached to three edges of the solar panel.
shaped, black object shown on the panel in Figure 3.
It is the U-
The solar cell modules =re mxlnted onto the sun tracker platfonn with an
interface of Apiezon H grease and held in place with four screws.
was used to achieve a highly conducting thermal contact betveen the modules
and the panel and to smooth out the temperature distribution Over the solar
panel as much as possible.
The grease
The solar panel temperature was monitored using thermistors. Some of the
solar cell modules were constructed with calibrated precision thermistors
11

embedded in the copper substrate directly beneath the solar cell.
these modules were m t e d on the solar panel at strategic locations so their
temperature readings gave an accurate representation of panel temperature.
Placemt of these modules on the panel is shown in Figure 2.
Four of
The FCM data encoder amplified the analog signals from the solar cells,
thermistors, on-sun indicator, and reference voltages, then perforaed an
analog-to-digital conversion.
used to set bit rate, bits per word, parity, analog-to-digital comrersion, and
format.
multiplexers allow sampling of up to 128 data c’knnels and amplify the low-
level signals frm the experimental package. The amplifier was designed to
process voltage signals at input levels up to 100 mV.
through the various channels at a rate of tw scans per second, i.e., every
data channel is rear3 twice each second.
It had a pmgrammable control unit which was
A PROM was used to provide format control. Four 32-channel
The multiplexer stepped
A n ultra-wide angle, single frame movie camera mxlnted at the perimeter
of the aluminum hoop provided visual documentation of tracker operation.
battery--red timer activated the shutter at ten second intervals, so that
50 ft of 8 mn movie film is sufficient to record the entire flight from launch
to landing.
correlation of tracker operation to the telenetered data.
provide a canplete record of ascent, traclcer operation at float altitude,
descent, towAdOwn, alKI p0St-t- events.
A
A wind-up clock was placed in the camera’s field-of-view for
The pictures
12

t
3.3 BOTTOM PAMxlAD ~
The bottom payload was entirely furnished by the NSBE'. It consists of a
battery power supply, a ballast module for balloon control, a d an electronics I
module lmawn as the Consolidated Instrument Package (CIP) . P m r for operating most of the electrical and electronic equipment 001
the balloon was supplied by a high-capacity complement of lithium batteries.
Thls supply, furnisning 28 VDC regulated power and 36 VDC unregulated pawer,
powred the sun tracker and all the instruments in the CIP.
small battery sources were used at various- locatians on the balloon for
Several other
instruments that require small amDunts of power. For example, the tracking
beaoons, the voltage reference box, and the camera timer all had individual
battery pawer supplies. All batteries *re sized to supply power for at least
twice the expected duration of a normal flight.
High-altitude balloons tend to slowly lose helium during the course of
the flight. As a c-, a helium balloon will tend to reach float
altitude and then begin a slow descent.
ballast system was included as part of the bottom payload.
approximately 125 pounds (57 kg) of ballast in the form of very fine steel
To counteract this tendency, a
It contained
shot.
proper use of this system, float altitude may be maintained to within
The shot may be released in any desired amount by radio comnard. By
- +2,000 ft (+600 m).
The telemetry system was contained in the Consolidated Instrument
Package. A block diagram of the telemetry system is sham in Figure 4.
system sent all data transmissions concerning the flight over a comaan
carrier.
The
The CIP also ccmtained a corrmand system for d n g comnands to the
13

AIRBORNE EQUIPMENT
SOLARCELL VOLTAGES
REFERENCE
- PCM DATA - SUBCARRIER ENCODER OSCILLATOR
COMPUTER SYSTEM
SOLAR CELL TEMPERATURES
I 0
FM I TRANSMITTER I
e
I I 1
CRT
-
w PCM DECODER h TELEMETRY H FWFM RECEIVER DlSCRlMl NATORS
1 I I I I - 1 1 I
I INCREMENTAL MAGNETIC TAPE
DATA REDUCTION AT JPL I (UNIVAC 1100 COMPUTER) I I I
Figure 4 . Block D i a g r a m of Balloon Teleanetry System
14

balloon for controlling scientific payloads or for controlling the
hmdceeping functions on the balloon. Specifically, the CIP contained the
follawing equipment :
MKS pressure transcfuars.
(Inega receiver.
Subcarrier oscillators (as required).
L-band Rd transmitter.
High-freqmncy tracking beacon transmitter.
-r for air traffic control trackirg.
PCM comnarrd receiver-decoder.
The altitude of the balloon was measured with a capacitance-type
electronic transducer, which read pressure within the range of 1020 to
0.4 millibars (102,000 to 40 Newtons/m2) with an accuracy of 0.05%.
tramducer produced a DC level that was encoded as PCM data and decoded at the
receiving station into pressure, and then the altitude was calculated from the
pressure reading.
T k
The Omega navigation system was used for flight tracking. An on-board
receiver was used to receive the CRnega signal for retransmission to the
processor in the ground station.
uncertainty of less than 2 mi (3.2 lan).
into the telemtry stream and updated e\lery eight seconds.
This system can provide position data to an
0mg-a signal was also multiplexed
As previously mentioned, all the telemetry data ms sent to the ground in
the form of pulse code modulation.
used to generate the RF carrier.
pulse code and sent to the receiving station at Palestine.
A UHF L-band transmitter in the CIP was
The L-band carrier was modulated by the
15

Several tracking beacons were used on the balloon. A low-frequency
transmitting beacon, attached to the lawer payload, was used by the autanatic
direction finding (ADE') system in the recovery airplane to track and locate
the balloon during flight and recovery.
attached to the top payload to help find the payload during recovery.
aircraft type transponder was flawn so that Air Traffic Control could r e d the
balloonfs location on their radar systems throughout the flight.
A P-band transmitting beacon was
A n
The purpose of the p(RuI cunmand system is to send cannrands to the balloon,
i.e., to turn the tracker on or off, terminate the flight, etc. It was
designed to reject false canraands and was highly reliable in operation.
data was encoded on a frequency-shift-kieyed audio carrier.
then deccded into data and timing control.
transmission of the data word.
bit-by-bit canparison before a camand is executed.
the balloon fran either the ground station at Palestine or fran one of the
recovery airplanes.
The
This signal was
Each camand consisted of a double
Both words must be decoded and pass a
Cammnds may be sent to
The top end of a 8.5-diameter parachute was fastened to the bottom of
the balloon. The lawer payload, containing the CIP, the battery powr supply,
ard the ballast, was attached to the bottom of the parachute.
electrical cables and break-away connectors were rigged in parallel with the
mechanical connections.
from the balluon ard fall to earth suspended fruin the parachute at terminatim
of the flight.
Apprapriate
The whole bottom assembly was designed to break away
16

4. FLIGHT SEQUENCE
4 . 1 PRE-LAUNCH PREPARATIONS
The balloon launching pad at the NSBF is a large circular area, 2,000 ft
(600 m) in diameter.
area, solidly paved, measuring 1,000 ft (300 m) in diameter. Grass is planted
in the area betwen the two circles, and a paved road surrounds the large
circle.
In the center of this large circle is another circular
Paved radials extend fran the perimeter road toward the launch pad.
When all pre-launch preparations had been canpleted and the staff
tmteorologist had predicted favorable weather and winds at Palestine and for
sane 300 mi (480 km) dam-range, the equipnent was taken to the launch site.
The main balloon, protected by a plastic sheath, was laid out full-length on
the circular paved area.
the top of the balloon upvind. The top end of the balloon was passed under,
behind, and Over the top of a large, smooth, horizontal spool m t e d on the
front end of the spool vehicle.
the spool vehicle.
released by a trigger mechanism.
the spool was p h e d back to engage the latch so that the spool trapped the
balloon.
allawing the top payload to rest on the ground.
balloon that will later receive the helium gas during inflation.
will form a kind of bubble in this part of the balloon above the launching
spool.
payload were begun.
It was aligned with the direction of the wind, with
One erd of this launching spool was hinged to
The other end of the spool had a latch which could be
After the balloon was passed over the spool,
The top 10 m or so of the balloon was pulled forward fran the spool,
It is this top 10 m of
The helium
After the launching spool was latched, final preparations of the top
The taw balloon was attached to the hoop with nylon
17

lines, the clock was firlDund, the camera was errezyized, and a final checkout of
the tracker and data encoder was performed.
Preparations at the bottom end of the balloon proceeded in parallel. The
ballom was connected to the top center of the parachute campy, arrd the
parachute's shKlud lines were connected to the bottan payload usiq a special
fitting.
bottom payload cables were passed up and over a high, platformlike structure
on the top of the launch vehicle.
fixed pin pointed forward.
passed Over this pin, and a quick release mechanism latched the fitting to the
pin. The lower payload was thus suspended f m n the pin in front of the
vehicle in full view of the vehicle's driver. After canpletion of all the
mechanical and electrical hoohp at both top and bottan payloads, a final
checknut of all the CIP and ballast systems was performed.
All the cannectiq wires, lines and cables associated with the
On the forward part of this structure, a
A hole in the special shroud line fittillg was
The launch sequence began by inflating the taw balloon with helium. The
main balloon was then inflated by passing a pre-determined volume of helium
tArough t w long fill-tubes and into the balloon as sham in Figure 5 . The
balloon was launched by triggering the latch on the launching spool. When the
latch released, a stout spring caused the free end of the spool to fly
forward, rotating about the hiv. This released the balloon. As the balloon
rose, the launch vehicle at the lower end of the balloon began to move fonmrd
(damwind).
directly belaw the balloon and had his vehicle goirg along at the same speed
as the balloon, he released the latch on the pin and the lower payload was
released.
seconds after release of the launching spool just as the damwind launch
When the driver of the launch vehicle had positioned the vehicle
Figure 6 shms the balloon system and the launch vehicle a few
18

ORIGINAL PAGE IS QJ3 EOOR QUALIW
T O W BA L L 00 N TOP PAYLOAD 7
LOWER PAYLOAD
WIND - 500 to 1200 FEET
Figure 5 . Flight Train Configuration
19

OP.;GINAL PAGE IS OF POOR QUALIT3
Figure 6 . Balloan Launch
20

vehicle began to move.
was sent from the launch pad triggering an explosive charge.
the tow balloon and the launch sequence was complete.
As soon as the main balloon quit oscillating, a si-1
This released
4 .2 FLIGHT
The balloon normally as- at a rate of approximately 900 ft/min
(4 .6 m/s) and reached float altitude in slightly over two hours.
ascent, the flight controller at Palestine maintained a constant contact with
Air Traffic Control (ATC).
mntirmausly given to ATC so that air traffic in the area could be vectored
around t k balloon.
During the
Data f m the on-board navigational system was
After the balloon had been launched, solar cell voltages, interspersed
with reference calibration voltages and thermistor voltages, were fed into the
telemetry system.
to the NSBF ground station along with the navigational, altitude, ard other
information from the CIP.
and displayed in real time for monitoring of the flight. The flight was timed
to reach float altitude approximately two hours before solar noon, so when the
telemetry showed that float altitude had been reached, the tracker was turned
on by telemetry comnand.
telemetered values for the current drawn by the tracker motors, the output of
the on-sun indicator, and the outputs of certain selected solar cell modules.
Data was recorded continuously from two hours before solar noon until orye hour
past solar noon.
These voltages were converted to PCM and were transmitted
At the graund station they were decoded, recorded,
Tracker operation was monitored by observing the
21

4.3 E'LIOIIT TESMINATION
Slmrtly after launch and while the balloon was ascending, the recovery
airplarre took off from Palestine with the recovery crew aboard.
was equipped with a radio system that allawed the crew to maintain amstant
comrmnication with the balloon base either by direct transmission or by radio
relay from the balloon.
it could send carmands to the balloon.
alti- above 80,000 ft (24 lon) blow from east to west at speeds of about
50 knots 25 m / s e c ) , so the airplane had to fly abaut 300 mi (180 lan) west of
Palestine to be in position for recovery.
the balloon at any time by using the ADF to track the lav-frequemy beacon.
The pilot of the recovery airplane is responsible for the termination phase.
Before leaving Palestine, the pilot had been provided a set of descent vectors
by the staff meteorologist.
trajectories the payloads will follow as they cane dawn on their parachutes.
Upon receiviw wxd f m n Palestine that the experimenter had all the data he
needed, the pilot flew under the balloon and established its position
accurately by visual obsenmtion.
where the payloads shaild corn down.
Traffic Control.
traffic, and when the descent vector plots ahawed that the payloads would not
come dam in an inhabited area, the pilot sent the comnands to the balloon for
termination of the flight.
This airplarre
The airplane also had a full cmmand system so that
During the SLmmer moths, the wirds at
The pilot can fly directly toward
The descent vectors are an estimate of the
Usirg the descent vectors, he then plotted
He also established contact with Air
When Alt advised that the payloads muld not endarger air
The termination sequence consisted of first s-ing a cormbard that cut
the electrical cable running from the bottom payload t o the top payload.
cornnand simultaneously cut the cables holdirg the top payload onto the top of
This
22

t i
the balloon and opened the poppet vglves on t h top of the balloon.
camnand released the bottan parachute from the balloon, allawing the bottan
gayload to fall avq and calmed the balloon to becane top heavy.
bottan payload fell, a ripcord attached to the top of the parachute opeaed a
large section in the b a l l m .
the balloon, its parachute opened and they all began their descent.
A
As the
balloon collapsed, the top paylosd fell off
It requires abmt an hour for the two parachutes am3 the balloon to fall
fran float altitude at the descent rate of roughly 1250 ft/min (6.4 m / s ) .
Durixq this time, the pilot monitored the position of the bottan payload using
his ADF.
transducer and relayed this information along to Am.
gruutxl, all three item have to be faad.
He also monitored the altitude infonnation fran the pressur@
After reaching the
The beacons on the tup and bottan
payloads usually aid in lacatiw them rather qulckly.
centered around the impact zones calculated from the descent vectors are f l m
as necessary. Once the impact locations were established from the air, the
recovery crew drew detailed maps and later returned with grourd vehicles to
recover the payloads.
Search patterns
Figure 7 is the flight prorile for the 1987 balloon flight (No. 1450P in
It is a plot of altitude vs distance from the the nomenclature of the NSFiF).
launch site from the time of launch until touchdown.
on appmximately 10-minute time intervals.
site was appraximately 320 m i (515 h) fmn the launch site and the total
flight duration was eight hours.
The points are plotted
As the figure shrrws, the touchdown
23

140
120
I- 100 w W LL
20
0
I I SOLAR NOON I
- 0 0 0 0 - TERMINATE 0
0 o* DATA ANALYSIS
- 0 PERIOD
0
0
0
-
0
- 0
0
0 - 0
0
0
IMPACT LAUNCH 1219 GMT z2120 GMT
719CDT I I
DISTANCE FROM LAUNCH SITE, MILES BALLOON FLIGHT PROFILE 8/23/87 FLIGHT JPL 1450P
100 200 300 400
Figure 7. 1987 Balloon Flight Profile
24

5. DATA ANALY!XS
The canputer analysis ms performed at JPL using the Univac 1100
cangmter.
duriw the flight, then corrected the cell data for temperature and sun-earth
distance according to the formula:
The program read the raw data fran the magnetic tape produced
Vhere:
VT,R = mxasured mdule output voltage at temperature T and distance R.
R = sun-earth distance in astronomical units (AU).
A
T
= module output tenperatwe coefficient.
= module temperature in deg C.
The remainder of this section describes the details of performi- the above
corrections ard computing calibratim values for the cells.
5.1 coMpvrw ANALYSIS
The computer program read data from the -tic tape one record at a
time.
of data consisted of two synch words f o l l d by a reading of each of the 64
data channels.
followed by the latitude, longitude and pressure as measured by instruments on
the balloon.
record fell within the all- data analysis time.
time window is an inpt to the program set by the parameters MINTIM and
MAXTIM).
Each record contained 16 scans of data plus a ground fram. Each scan
The ground frame contained the date and time of the scan,
The program first chcked the gmwd frame to see whether the
(The allawed data analysis
The computer rejected the entire frame if the time of the current
25

record fell outside the time windaw or if it could L.baa the time properly.
T b b w t e r
scans.
in pllse code modulation (m) counts.
avem, then a screening promdun? WCLS used to reject scans containing
questionable data.
wa8 lamr than a threshold value (input parameter m N ) .
rejected if the PCM caclllt for a data chamel was not within the alltmable PCM
count range, if there was too large a count deviation on any channel fran one
scan to the next, or if there was an unrecoverable problem in reading the
tape.
records within the tinre windaw until it had accumulated 200
Each set of 200 scans is called a pmss. At this point, the data was
The FU4 data for each chanml was
For example, scans were rejected if the on-sun irdicator
Scans vert! also
The PCM data v a s next axwerted to engimring units. The program has a
provision for doing this in any of four different ways. The simplest and most
wlnnonly used method will be described here. Durirg the Calibration of the
telemetry system, the output of the telenretry system vs the input from the
voltaw r e f e m box was recorded to produce a table of mV inpt vs PCM count
output.
connected one by o m across a thrmistor channel ard the resultiw PCM CclLlllt
for that channel recorded.
resistance value was known, the construction of a RX count vs temperature
table was possible.
an3 a calibration table was umstructed for each thermistor channel.
these calibration values were inpt to the canputer program. During
conversion of solar cell data to mV, the ctmputer perfonned a linear
interpolation in the PCM vs mV table. At the completion of the initial
cmpter analysis run, the output values of each channel correspondirq to
Similarly for the thermistor channels, a series of resistors was
since the t e m p r a t U r @ comesponding to each
Thls procedure was repeated for all thermistor channels
All
26

tlr>ltw reference levels were chclced.
constant during the flight, (they nomally read constant to within+- F W
count out of 1,OOO) the use of the simple lirrear interpolation scheme vms
mntimIed for th6 final data analysis.
thrmistor resistance vs temperature is nonlinear, a third degree polylvmcial
was used for the interpolation of the temperature values.
If they HRF~ fcnad to have held
Since the relationship between
At the end of each pass, fuur averages =re computed for each chiarmel:
(1) an initial average based on all acceptable scans, (2) a corrected a v e q ,
using all data falling within a specified fractional deviation (inplt
parameter mw) of the initial averages, (3) the corrected average multiplied
by the square of the earth-sun radius vector (in AU) for the day of the flight
(inpt parameter RV), and (4) a final average with all the above corrections
plus a temperature correction to 28 deg C.
values of the temperature coefficients nmsured in the laboratory (inpt
parasnetem TPCOEF).
!Ms final correction used the
This completes the data analysis for one pass of data. The entire
process was repeated by returning to the tape reading routine and readirg
another pass (200 scans) of data. All the screenix and averaging routines
were performed on this pass also, and this procedure was mntinurtd until 20
passes of data had been analyzed or until MRXTIM was m.
In addition to the averages taken after each pass, an overall sumnary
matrix was constructed, which contained the fully corrected averages for each
channel after each pass.
pass.
deviation were canputed for each channel.
A raw of entries was added to this matrix after each
After all passes had been canpleted, an overall average and standard
These overall averages of
27

approximately 4000 readings are the reported calibration values for the
modules.
5.2 CALIBRATION RESULTS
Table 1 reports the calibration values of all the cells calibrated on the
1987 balloon flight, corrected to 28 deg C and to 1 AU. The table also reports
the stmadard deviation of the 4,000 meaSureJgnts, the pre-flight and
post-flight readings of each nodule in the X25 simulator, a canparison of the
pre-flight with the post-flight simulator readirqs, and a canprison of the
pre-flight sirmilator readings with the balloon calibration readirgs.
table also reports the temperature coefficients measured for each module in
the laboratory.
The
5.3 UPDATE OF BFS-17A DATA
Several standard modules have been flown repeatedly over the 25-year
period of calibration flights.
history, BFS-l7A, appears in !Cable 2 along with sane computed statistical
parameters. The standard deviation of 0.27 (0.45%) and a maximum deviation of
0.75 (1.25%) fmn the mean shew that the BFS-17A readings are very tightly
grouped. In addition to giviw a ~lessure of the consistency of the
year-to-year measurements, BFs-17A also provides some insight into the quality
of the solar irradiance falling on the solar panel with regard to unlfonnity,
shadowing, or reflecticm. Since this cell has been m t e d in various
locatlorrs on the panel over the years ard its readings have been quite
consistent, there does not seem to be any evidence of nommlfonnity over the
l?anel-
The record of the one with the 1-t
28

Table 1.
t
87-101 84-110 87-123 87-126 87-128 87-140 87-141 87-145 87-146 87-147 78-110 87-150 79-010 79-01 1 79-013 79414 82-001 84-001 84-002 86-023 8 6 4 2 4 86-025 87-001 87-002 87-003 87-004 87-005 87-006 BFS17A 86-105 86-106 87-120 87-122 87-160 87-162 87-164 87-165 87-170 87-100 87-181 87-185 87-190 87-192 87-194 87-200 87-202 87-204
1 W 8€RN !mw (*N
oI1G.
AmulsP ASEC ASEC ASEC ASEC
BOEINO BOEm
BOEINO BOEING
HAC HAC JPL JPL JPL JPL JPL JPL JPL JPL JPL JPL JPL JPL JPL JPL JPL JPL JPL
uec uec m IMSC uec uec uec uec
SLX SPL SPL SPL m m m
V" VARIAN VARIAN
-
mEm
1987 Balloon Flight 8/23/87 120,000 FT. FW=1.0112 Flight NO. 1450P
TmP. -1TY ADJVSW A-
66.22 59.58 57.69 74.63 79.68 15.56 26.61 68.63 43.65 16.63 96.12 93.31 53.40 54.76 54.90 50.04 54.90 59.63 59.77 59.47 59.59 87.99 64.26 64.86 59.90 59.41 48.70 48.68 60.63 58.93 50.44 57.69 57.06 85.94 85.03 82.67 82.95 81.92 75.42 79.49 67.17 77.41 82.20 75.35 41.39 62.00 20.65 99.908 19.81. 49.808 . 00.
S T w DEV.
.07971
.14647
.08300
.11847
.049u
. o m 2
.05134
.om44
.06833
.09491
.11926
.04992
.07362
.08082
.lo014
.07928
.07610
.13933
.04253
.11602
.04014
.lo237
.06509
.OS429
.12oo1
.11224
.06262
.05017
.11401
.lo892
.05428 ,07111 .13308 .06348 .lo919 .17571 .07813 .lo811 .08578 .14014 .13152 .lo181 .08680 .06608 .07704 .07701 .05289 .oo220 .07371 .16217 .00000
- 63.39 57.67 55.14 74.70 79.51 16.27 29.13 69.65 43.60 29.98 94.97 92.92 50.93 52.06 53.02 56.03 52.48 57.63 57.61 57.35 57.17 88.27 62.40 62.99 57.47 57.31 46.90 46.85 58.75 56.50 56.10 55.07 54.75 85.64 85.24 82.11 83.09 82.30 78.22 80.01 64.80 7'1.50 82.42 75.5 41.23 59.96 19.30 .oo .oo .oo .oo
63.33 57.54 55.15 74.71 79.37 15.67 24.65 68.74 43.09 17.29 94.68 92.48 50.64 51.81 52.54 55.65 52.11 57.37 57.31 56.85 56.86 87.04 62.10 62.39 57.50 56.84 45.77 45.97 59.51 56.33 56.05 55.00 54.67 85.76 86.23 81.93 82.73 81.06 75.48 80.01 64.49 77.13 81.99 75.08 41.16 59.72 19.13 .oo .oo .oo .oo
-.09 -.23
.02 . 01 -.18
-3.69 15.38 -1.31 -1.17
-42.33 -.31 -.47 -.57 -.48 -.91 -.68 -.71 -.45 -.52 -.a7 -.54 -.49 -.48 -.95
.05 -.e2
-2.41 -1.88
1.29 -.XI -.09 -.13 -.15
.14 -.01 -.22 -.43
-1.60 .35
-.04 -.40 -.48 -.52 -.!56 -.1? -.40 -.88 .oo .oo .oo .oo
4.38 3.17 4.62
.06
.17 4.30 8.72 1.69 -.02
-46.10 1.27
.35 4.75 5.29 3.41 3.44 4.63 3.36 3.59 3.68 4.16 -.42 2.89 2.90 4.14 3.53 3.72 3.88 3.14 4.28 3.99 4.78 4.09
.43 -.28
.73 -.14 -.53
.24 -.76 3.41 -.11 -.33 -.24
,20 3.38 6.97 .oo .oo .oo .oo
.0535
. O W 5
.0432
.0360
.ow6 -.O2M
.0195
.0570 -.oo21 - .0415 .a80 . a 2 9 .0340 . O m .0421 . a 6 7 .0429 . O532 .0515 -0482 .0467 .0473 . O W 0 . O m .0345 .0328
-.oo11 .o001 .0310 .0418 .a60 .04oo .0249 ,0160 .0480 .0361 .0320 .0490 -0412 .057 1 . o m .0429 .0380 .O517 .0083 .0513 .0145 .oooo .oooo .oooo .oooo
GMS REFLY G M S 4 X 2 10 OHM 4 MIL BSF(B) 2Om8MILBsR CIS GMSlcM2
CIS 1 at2 GMSlCMz K? REFLY
GMS REFLY GMS REFLY GAAS REFLY QAAS FfEFLY GAAS REFLY GMS REFLY GMS REFLY GAAS MR" T1 REPLY G M S h W " R E F L Y T 3 K6 3/4 T1 GMSSPL GMSseL. G A A S r 4 w r E a i GAASr4wrEai SI/-. FILTW SI/AMDR. FILTW STANDRRD GMS REFLY GAAS REFLY GAAS4X2 - 4 X 2 10 Om 4 MIL SPL 3 .5 x 3.5 10 om 4 MIL SPL 3 .5 x 3 . 5 10 om 4 MIL ASEC 3.5 x 3.5 10 Om 4 HIL 3.5 X 3.6 10 om BsR 10 om 4 MIL CaImm BACK 10 Om 3 MIL K6 BSR GMS 12 MIL LPE 10 CHM ASEC 10 m SPL 10 Om SLX INOAAS GMS AtoAAs (1.93 EV)
29

Table 2. Repeatability of Standard Solar Cell RFS-17A (39 Flights Over a 25-year Period)
Flight Date
9/ 5/63 8/ 3/64 8/ 8/64 7/28/65 8/ 9/65 8/13/65 7/29/65 8/ 4/66 8/12/66 8/26 /66 7/14/67 7/25/67 8/ 4/67 8/10/67 7/19/68 7/29/68 8/26/69 9/ 8/69 7/28/70 8/ 5/70
calibration Value, mV
60.07 60.43 60.17 59.90 59.90 59.93 60.67 60.25 60.15 60.02 60.06 60.02 59.83 60.02 60.31 60.20 60.37 60.17 60.42 60.32
Mean Stanlard Deviatim Bhxinnm Deviation
Plight Date
4/ 5/74 4/23/74 5/ 8/74 10/ 12/74 10/24/74 6/ 6/75 6/27/75 6/10/77 8/11/77 7/20 /78 8/ 8/79 7/24/80 7/25/81 7/21/82
7/19/84 7/12/85 7/15/86
7/12/a3
8/23/acl
60.19 0.27 0.75
calibration Value, mV
60.37 60.37 60.36 60.80 60.56 60.20 60.21 60.35 60.46 60.49 60.14 60.05 60.07 59.86 60.10 59.84 59.99 59.44 60.63
9/5/63 to 8/5/70 Each data point is an average of 20 to 30 points per flight
4/5/74 to 7/1/75 Each data point is an average of 100 or mre points per flight
6/10/77 to 7/21/82 Each data point is an average of 200 data points
7/12/83 to Present Each data point is an average of 4000 data points
30

6. CONCLU!3IONS
The 1987 balloon flight was a successful flight. BFS-17A again returned
readim that are nearly identical to the it returned on its previaus
38 flights. One reference cell, 78-110, that had been f l m in 1978 was
reflown in 1987.
96.12 in 1987, giving a repeatability of 0.33%.
Several GaAs cells were reflm this year, includiw four cells that had
been flown in the 1979-1982 time period and in 1986.
higher than they did in 1986 (W.7, +2.0, +2.2, and +2.5% higher), lxt 1-r
than they read on their original flights (-2.2, -1.4, -2.0, and -0.7% lower).
Three GaAs cells f l m in 1984 were reflawn in 1987.
canparison to 1984 were -2.5%, -0.6% and +0.3%.
1986 Ere reflown.
they -re in 1986.
The calibration values for this cell were 96.44 in 1978 and
All four cells read
The 1987 readings in
Three GaAs cells f l m in
The 1987 readings were 1.2%, 1.5% and 1.7% higher than
In view of the fact that the repeatability of silicon cell calibration
values continues to be significantly better than for GaAs cells, we are
treating this as a seriaus concern.
are under consideratian: 1. the G a M cells are slightly unstable, and 2. the
cell temperature measurements on the balloon may have sufficient uncertainty
that the application of temperature correctlam to the GaAs cells (with their
larger tenprature coefficients) may result in larger uncertainties in the
calibration values.
measurements for future flights and are also continuing to look at the long-
term stability of GaAs solar cells.
T m hypotheses for explaining this effect
We are taking stepe to improve the tenprature
31
7. REFERWCE
1. B.E. Anspimgh, R.G. Damirg ard L.B. Sidwell, Solar Cell Calibration Facility Validation of Balloon Flight Data: ACompar ison of Shuttle and Balloon Flight Results, JPL Publi- cation No.85-78,Jet Propulsion Laboratory, -,Calif., October 15, 1985.
!
32

TECHNICAL REPORT STANDARD TITLE PAGE ~
1. Report No. 87-44
- ~- ~~~
2. Govenmnnnt Accesston No. 3. Recipimt's Cotalog No.
4. Title and Subtitle 5. Report Date
Results of the 1987 NASA/JPL Balloon Flight Solar Cell Calibration Program
December 15, 1987 6. Performing Organization Code
15. Supplementary Notes . .
7. Authork) B.E. Anspaugh and R.S. Weiss
~~
16. Abatract
8. Performing Organization Report No,
The 1987 solar cell calibration balloon flight was seccussfully completed on August 23, 1987, meeting all objectives of the program. modules were carried to an altitude of 120,000-ft (36.0 km). cells can now be used as reference standards in simulator testing of cells and arrays.
Forty-eight The calibrated
9. Performing Organization Nane and M d r e s s
JET PROPULSION LABORATORY California Institute of Technology
Pasadena, California 91109 4800 Oak Grove Drive
I
12. Sponsoring b n e y Nune d Address
IO. work b i t No.
11. Contract or Grant No.
13. Type of Report and Period Cavered NAS7-9 18
JPL Publication
JPL 0184 A9183
NATIONAL AERONAUTICS AND SPACE ADMINISTRATION Washington, D.C. 20546
14. Spomoring Agency Code RE156 BK-506-41-11-02-00
7. Key Words (Selected by Author(s)) Balloon-Borne Instruments; Calibrating; Energy Conversion Efficiency; Modules;' Solar Cells; Standards
18. Distribution Statement .
Unclassified; unlimited
9. Security Clesif. (of this report) 20. Security Clarsif. (of this poge) 21. No. of Pages Unclassified Unclassified
22. Price


![Silicon-based solar cells - fotowoltaika.edu.pl. Thin-layer cells and modules ... Silicon -based solar cells – characteristics and production processes ] ] Silicon -based solar cells](https://static.fdocuments.net/doc/165x107/5b0c5ceb7f8b9a6a6b8c3d79/silicon-based-solar-cells-thin-layer-cells-and-modules-silicon-based-solar.jpg)