Results Announcement for the full year ending 30 June 2012Information in this presentation is...
20
Results Announcement for the full year ending 30 June 2012 Centuria Capital Limited Presentation to Investors and Analysts For personal use only
Transcript of Results Announcement for the full year ending 30 June 2012Information in this presentation is...

Results Announcement for the full year ending 30 June 2012
Centuria Capital Limited
Presentation to Investors and Analysts
For
per
sona
l use
onl
y

2012 Financial Year Highlights
Centuria Capital Limited
Presentation to Investors and Analysts 1Information in this presentation is general information only. Before you make any decision in relation to your investment, we recommend that you obtain financial advice from a licensed financial adviser.
Earnings* • Underlying FY12 - NPAT $4.9 million (FY11: $6.4 million)• Underlying Earnings per share 6.1c (FY11: 8.2c) • Statutory FY12 - NPAT $2.0 million (FY11: ($2.9 million))• Statutory Earnings per share 2.5c (FY11: (3.7c)) Dividend / Capital Management • Interim Dividend - 1.25c per share fully franked (FY11: 2.5c franked to 30%)• Final Dividend - allocated $1.6 million (equivalent 2.0c per share) to acquisition of unmarketable parcels. Details to be released by 30 September 2012 Strong Balance Sheet• Corporate gearing remains low at 14.4% (excluding non-recourse debt)• Corporate working capital facility recently extended to December 2013
Rationalisation • Recent strategic structural review has reduced staff headcount by ~15%
• Relocation of Melbourne office to smaller, more cost-effective, Centuria owned property
• Strategic investments in systems, infrastructure and people across the business, particularly in Property Funds Management
* Underlying Earnings comprises Centuria Capital Group and excludes Centuria Life Benefit Funds
For
per
sona
l use
onl
y

Business Developments • Property Funds Management business unit established one Fund in FY12 - $58 million acquisition of 441 St Kilda Road
• FY13 to date, Property Funds Management business unit has contracted to purchase two significant properties (total ~$78 million)
• Property Funds Management business unit performance is a key profit driver in respect of upfront fees and annuity management fee income
• Outlook for Property Funds Management business unit promising having regard to YTD performance and strong pipeline of second half acquisition opportunities
• Establishment of Singapore office to create Asian platform for Centuria
2012 Financial Year Highlights
Centuria Capital Limited
Presentation to Investors and Analysts 2Information in this presentation is general information only. Before you make any decision in relation to your investment, we recommend that you obtain financial advice from a licensed financial adviser.
For
per
sona
l use
onl
y

2012 Key Performance Metrics
• Overall Group FUM balance of $1.9 billion despite only one property acquisition
• Property underlying earnings impacted by low acquisition performance (since addressed)
ResidentialMortgages FUM
Centuria LifeFUM
Centuria
FUM Property
Total Funds Under Management ($bn)
2.00
1.50
1.00
0.50
-
2.50
2007 2008 2009 2010 2011 2012
Centuria Capital Limited
Presentation to Investors and Analysts 3Information in this presentation is general information only. Before you make any decision in relation to your investment, we recommend that you obtain financial advice from a licensed financial adviser.
For
per
sona
l use
onl
y
2012 Key Performance Metrics (continued)
Reverse Mortgage FUM ($bn)
Centuria LifeFUM ($bn)
Centuria
FUM ($bn)Property
Total Funds Under Management ($bn)
2.00
1.50
1.00
0.50
-
2.50
2007 2008 2009 2010 2011 2012
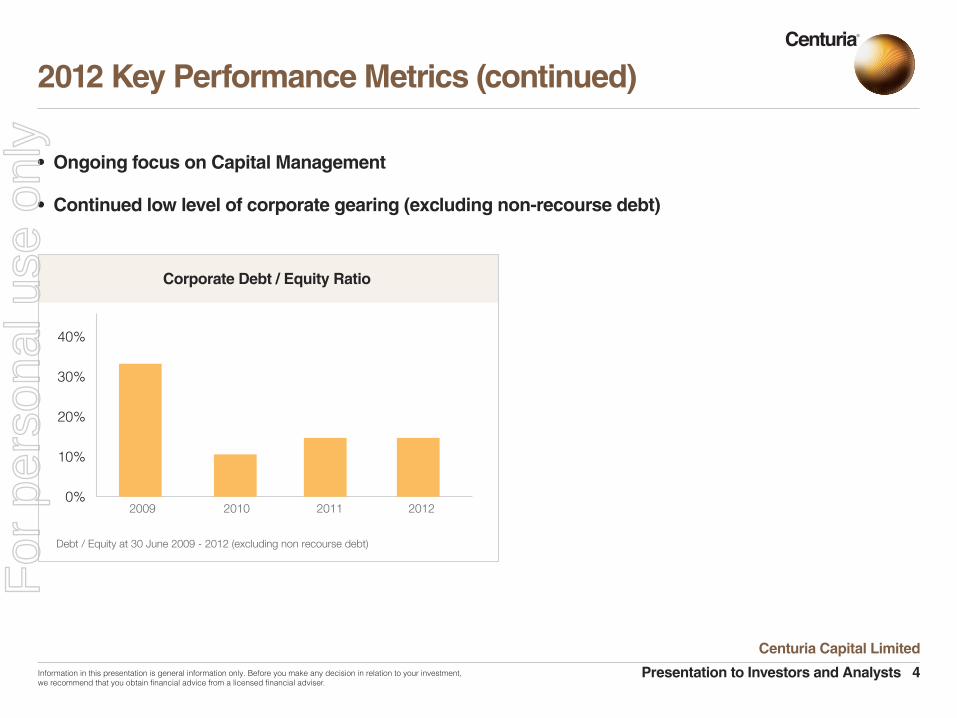
Debt / Equity at 30 June 2009 - 2012 (excluding non recourse debt)
Corporate Debt / Equity Ratio
40%
30%
20%
10%
0%2009 2010 2011 2012
• Ongoing focus on Capital Management • Continued low level of corporate gearing (excluding non-recourse debt)
Centuria Capital Limited
Presentation to Investors and Analysts 4Information in this presentation is general information only. Before you make any decision in relation to your investment, we recommend that you obtain financial advice from a licensed financial adviser.
For
per
sona
l use
onl
y

Divisional Revenue (excl. Benefit Funds)
Centuria Capital Limited
Presentation to Investors and Analysts 5
Year Ended 30 June 2012 2011
Total Revenue
Property Funds Management 11,799 13,015
Friendly Societies 12,628 13,453
Residential Mortgages 16,555 16,294
Property Investments* 3,239 2,937
Insurance 1,307 1,341
Other 1,109 1,075
Total 46,637 48,115
$000’s $000’s
* Heads of Agreement has been signed for the sale of these two legacy assets with a 31 August 2012 settlement date
Information in this presentation is general information only. Before you make any decision in relation to your investment, we recommend that you obtain financial advice from a licensed financial adviser.
For
per
sona
l use
onl
y

Underlying Results (excl. Benefit Funds)
Centuria Capital Limited
Presentation to Investors and Analysts 6
Year Ended 30 June 2012 2011
Underlying earnings by major division
- Centuria Property Funds 3,577 4,755
- Centuria Life 7,755* 9,137
- Residential Mortgages 2,661 3,495
- Insurance 1,065 1,037
- Corporate (6,709) (8,601)
- Other (115) 697
Total underlying earnings 8,232 10,520
Tax expense (excluding non-recurring items) (3,374) (4,163)
Underlying net profit after tax 4,861 6,357
Non-recurring adjustments
- Prior year non-recurring adjustments (including tax effect) - 9,248
- Impairment of investment in associate 2,887 -
- Provision for doubtful debts (CBGF1) 1,169 -
- Mortgageport write-downs 200 -
- Final convertible notes provision 934 -
- Gain due to a change in estimate of the realisation of the swap (650) -
- Net gain on NLT investment property and borrowing write-downs (406) -
- Tax benefit on 30 June 2012 non-recurring adjustments (1,240) -
Reported net profit after tax 1,967 (2,891)
$000’s
Information in this presentation is general information only. Before you make any decision in relation to your investment, we recommend that you obtain financial advice from a licensed financial adviser.
$000’s
* Life division underlying earnings suffered one-off impact of more accurate allocation of costs and investments made in the business
For
per
sona
l use
onl
y

Centuria Capital Limited
Presentation to Investors and Analysts 7
Key Achievements
• Purchase of 441 St Kilda Road, Melbourne for $58.0 million (Centuria’s largest individual purchase since inception)
• Acquisition pipeline to exceed FY12 performance ($78 million contracted for first half) with good ongoing prospects for second half
• Positioned Centuria as a market leader in the unlisted funds sector and gaining strong traction with many of the national financial planning groups
• Integration of new funds management and accounting system to service future scale in the business with fewer staff
Centuria Property Funds
Portfolio by StateNew South Wales
Victoria
Queensland
South Australia
Australian Capital Territory
Northern Territory
Portfolio by SectorOffice
Industrial
Retail Bulky Goods
Speciality Use
Mixed Use
Retail
67.39%
10.87%
13.04%
2.17%
2.17%
4.25%
63.04%
13.04%
10.87%
6.52%
4.35%
2.17%
441 St Kilda Road, Melbourne, Victoria
Information in this presentation is general information only. Before you make any decision in relation to your investment, we recommend that you obtain financial advice from a licensed financial adviser.
FY12
FY13
For
per
sona
l use
onl
y

Centuria Capital Limited
Presentation to Investors and Analysts 8
Centuria Property Funds (continued)
Business Profile
29
46Number of Funds
Number of Buildings
3.7 years
93
%Portfolio Occupancy
Portfolio Weighted Average Lease Expiry (income)
3,853
17.10%
Number of Investors
Completed funds with a value of over $300 million with an average total return to Investors of 17.10% per annum
Information in this presentation is general information only. Before you make any decision in relation to your investment, we recommend that you obtain financial advice from a licensed financial adviser.
Key Achievements (continued)
• Significant unrecorded future potential performance and sales fees (exceeds $10 million)• Continued corporate acquisition activity in FY12 with four bids totalling $2.9 billion FUM made
For
per
sona
l use
onl
y

• Centuria Life continues to generate strong and stable cash earnings to the Centuria Group
• $712 million FUM as at 30 June 2012 (net reduction from FY11 3.26%)
• Guaranteed Bonds continue to deliver consistent net returns in a challenging year, where RBA cash rate fell by 1.25%
• Reduction in net outflows
• Increased flows into Guardian funeral bonds • Continued focus on new product initiatives
Centuria Life (including Guardian)
Centuria Capital Limited
Presentation to Investors and Analysts 9
$465 m
$247 m
80,312Total FUM of Centuria Life Bonds
Total FUM of Over Fifty Guardian Friendly Society Bonds
Total number of Policies
Information in this presentation is general information only. Before you make any decision in relation to your investment, we recommend that you obtain financial advice from a licensed financial adviser.
For
per
sona
l use
onl
y

Insurance
Continued Strong Customer Retention Rate
92%
90%
88%
86%
84%
82%
80%
78%
2006 2007 2008 2009 2010 2011 2012
Over Fifty Insurance Motor
Over Fifty Insurance Home
Source: Allianz
• Continued consistent contributor to Centuria Group earnings – 2012 EBIT $1.065 million (FY11: $1.037m)
• Divisional profit marginally increased
• 25,108 policyholders as at 30 June 2012 • Maintained high customer retention over time
• Growth being seen through internet sales
• Marketing efforts and dollars spent concentrated on strong performing regions resulting in improvement in key performance indicators and profit contribution
Centuria Capital Limited
Presentation to Investors and Analysts 10Information in this presentation is general information only. Before you make any decision in relation to your investment, we recommend that you obtain financial advice from a licensed financial adviser.
For
per
sona
l use
onl
y

Residential Mortgages
Over Mortgage Book ANZ Loan Book
200
180
160
140
120
100
80
60
40
20
0
2012
2014
2016
2018
2020
2022
2024
2026
2028
2030
2032
2034
2038
2040
2042
2044
2046
2048
2050
2052
2054
2056
2058
2060
Embedded Value - At 30 June 2012 12% p.a. Redemption Rate assumed
$’m
Projected debt-free book value $100 million
Source: Rice Warner, 30 June 2012
Centuria Capital Limited
Presentation to Investors and Analysts 11
• Value of residential reverse mortgage book at 30 June 2012 - $182 million (30 June 2011: $192m)
• Non-recourse loan at 30 June 2012 - $152 million (30 June 2011: $165m)
• Loan facility maturity date extended to 30 September 2013
• Significant embedded shareholder equity in the portfolio increasing in 2012 - $33m (2011 : $27m)
• Loan statistics at 30 June 2012 - Security value: $806m (30 June 2011: $933m) - Non-recourse loan to valuation ratio: 19% (30 June 2011: 18%) - Number of loans: 1,979 (30 June 2011: 2,256) - Average loan balance: $92,132 (30 June 2011: $85,151)
• No portfolio loan losses sustained on the portfolio since inception
Information in this presentation is general information only. Before you make any decision in relation to your investment, we recommend that you obtain financial advice from a licensed financial adviser.
* The above projection is subject to many variables including run-off rate, regular refinancing, and projection given is as a guide onlyF
or p
erso
nal u
se o
nly
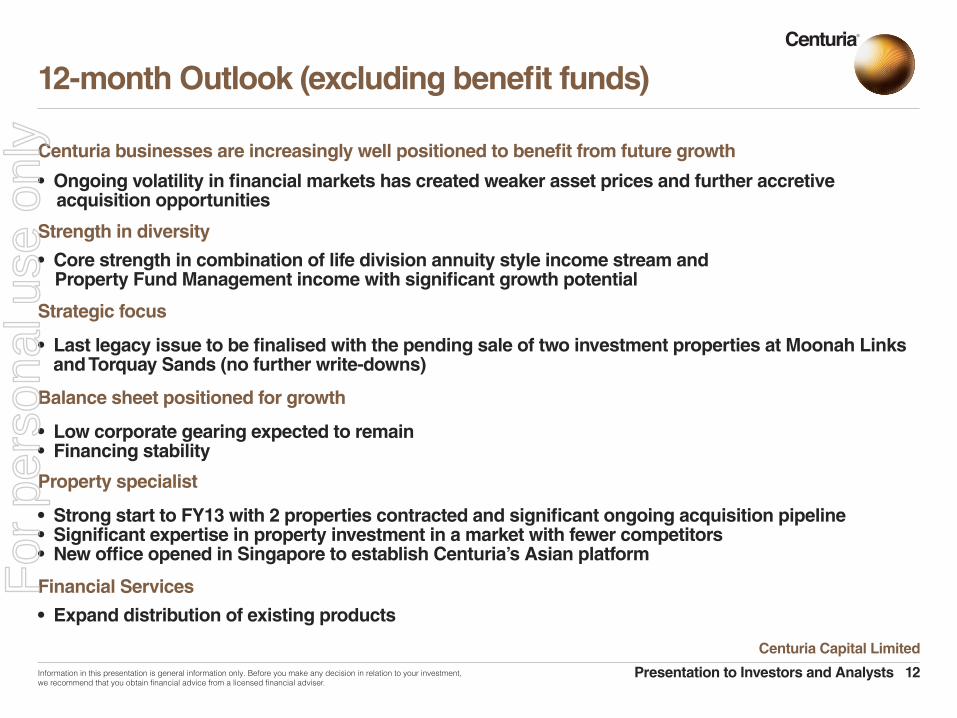
12-month Outlook (excluding benefit funds)
Centuria businesses are increasingly well positioned to benefit from future growth
• Ongoing volatility in financial markets has created weaker asset prices and further accretive acquisition opportunities
Strength in diversity
• Core strength in combination of life division annuity style income stream and Property Fund Management income with significant growth potential
Strategic focus
• Last legacy issue to be finalised with the pending sale of two investment properties at Moonah Links and Torquay Sands (no further write-downs)
Balance sheet positioned for growth
• Low corporate gearing expected to remain • Financing stability
Property specialist
• Strong start to FY13 with 2 properties contracted and significant ongoing acquisition pipeline • Significant expertise in property investment in a market with fewer competitors• New office opened in Singapore to establish Centuria’s Asian platform
Financial Services
• Expand distribution of existing products
Centuria Capital Limited
Presentation to Investors and Analysts 12Information in this presentation is general information only. Before you make any decision in relation to your investment, we recommend that you obtain financial advice from a licensed financial adviser.
For
per
sona
l use
onl
y

The “Statutory Accounts” show the consolidated corporate entities including the Benefit Funds which Centuria is required under AIFRS to consolidate.
The “Benefit Funds” reflect value of stand alone policyholder funds.
The “Corporate Accounts” reflect the value and performance of Centuria shareholder funds.
Numbers in the following reconciliations may differ slightly from the Annual Report however this is due to rounding of numbers.
General comment on statutory account reconciliation
AppendicesStatutory Account Reconciliations
Centuria Capital Limited
Presentation to Investors and Analysts 13Information in this presentation is general information only. Before you make any decision in relation to your investment, we recommend that you obtain financial advice from a licensed financial adviser.
For
per
sona
l use
onl
y

Appendix 1: Income Statement for year ended 30 June 2012
Statutory Accounts Benefit Funds Corporate
Revenue 32 - 32
Revenue from Centuria Life 13 - 13
Net revenue from Benefit Funds - - -
Other income 1 - 1
Total revenue 46 - 46
Finance costs 16 - 16
Employee benefits expense 9 - 9
Administrative and other expenses 10 - 10
Centuria Life expenses 5 - 5
Share of loss of associates 2 - 2
Impairment of investments in associates - - -
Revaluation of investment property assets - - -
Net profit before tax 4 - 4
Tax 2 - 2
Reported net profit after tax 2 - 2
$m $m$m
Centuria Capital Limited
Presentation to Investors and Analysts 14Information in this presentation is general information only. Before you make any decision in relation to your investment, we recommend that you obtain financial advice from a licensed financial adviser.
For
per
sona
l use
onl
y

Appendix 2: Balance Sheet as at 30 June 2012
Statutory Accounts Benefit Funds Corporate
Assets
Cash and equivalents 16 - 16
Trade and other receivables 11 - 11
Non-current assets held for sale 15 - 15
Financial assets at fair value - - -
Other financial assets 20 - 20
Reverse Mortgage Loans 182 - 182
Investment property - - -
Investment in associates – equity method 1 - 1
Plant & equipment 1 - 1
Deferred tax assets 10 - 10
Intangible assets 53 - 53
Assets in respect of benefit funds 465 465 -
Other assets 2 - 2
Total Assets 776 465 311
$m $m$m
Centuria Capital Limited
Presentation to Investors and Analysts 15Information in this presentation is general information only. Before you make any decision in relation to your investment, we recommend that you obtain financial advice from a licensed financial adviser.
For
per
sona
l use
onl
y

Appendix 2: Balance Sheet as at 30 June 2012 (continued)
Statutory Accounts Benefit Funds Corporate
Liabilities
Trade and other payables 6 - 6
Corporate debt 13 - 13
Borrowings – recourse to investment property only 16 - 16
Borrowings - Reverse Mortgages 152 - 152
Other liabilities 28 - 28
Policyholders funds 465 465 -
Income tax payable 6 - 6
Total Liabilities 686 465 221
Net Assets 90 - 90
Equity
Issued capital 90 - 90
Reserves (1) - (1)
Retained earnings 1 - 1
Equity attributable to equity holders of the parent 90 - 90
Total Equity 90 - 90
$m $m$m
Centuria Capital Limited
Presentation to Investors and Analysts 16Information in this presentation is general information only. Before you make any decision in relation to your investment, we recommend that you obtain financial advice from a licensed financial adviser.
For
per
sona
l use
onl
y

Appendix 3: Cash Flow Statement for year ended 30 June 2012
Statutory Accounts Benefit Funds Corporate
Cash flows from operating activities
Interest received 1 - 1
Dividends received - - -
Management fees received 20 - 20
Rent, trust and other income received 8 - 8
Benefit Funds (34) (34) -
Payments to suppliers and employees (24) - (24)
Income tax received (2) - (2)
Net cash flows used in operating activities (31) (34) 3
Cash flows from investing activities
Interest earned on mortgage loans net of mortgage receipt/ draw-downs (7) - (7)
Benefit Funds 51 51 -
Payment for plant and equipment - - -
Proceeds from investment in other financial assets 4 - 4
Payment for acquisition of intangible assets 1 - 1
Net cash flows provided by investing activities 49 51 (2)
$m $m$m
Information in this presentation is general information only. Before you make any decision in relation to your investment, we recommend that you obtain financial advice from a licensed financial adviser.
Centuria Capital Limited
Presentation to Investors and Analysts 17
For
per
sona
l use
onl
y

Appendix 3: Cash Flow Statement for year ended 30 June 2012 (continued)
Statutory Accounts Benefit Funds Corporate
Cash flows from financing activities
Convertible Loans (6) - (6)
Loans from related entities (1) - (1)
Benefit Funds 1 1 -
Proceeds from borrowings – Reverse Mortgages 3 - 3
Funds provided to Reverse Mortgage customers (3) - (3)
Funds collected from Reverse Mortgage customers 26 - 26
Repayment of borrowings (13) - (13)
Finance costs (6) - (6)
Proceeds from borrowings 5 - 5
Dividends and distributions paid (3) - (3)
Net cash flows used in financing activities 3 1 2
Net increase in cash and cash equivalents 21 18 3
Cash and cash equivalents at the beginning of the period 31 19 12
Cash and cash equivalents at the end of the period 52 37 15
$m $m$m
Information in this presentation is general information only. Before you make any decision in relation to your investment, we recommend that you obtain financial advice from a licensed financial adviser.
Centuria Capital Limited
Presentation to Investors and Analysts 18
For
per
sona
l use
onl
y

This document has been issued by Centuria Capital Limited ABN 22 095 454 336 and contains general information about Centuria Capital Limited and its related bodies corporate (“Centuria”) which is current as at 24 August 2012.
The information in this document is in summary form and does not purport to be complete. Due to the impact of rounding, the totals shown for charts, graphs or tables in this document may not equate to the sum of the individual components of the relevant chart, graph or table. Accordingly, it should be read in conjunction with all other information concerning Centuria filed with the Australian Securities Exchange.
The document has been prepared from information believed to be accurate, however, no representation or warranty is made as to the accuracy or adequacy of any information contained in the document. To the extent permitted by law, Centuria, its related bodies corporate and their respective directors, officers and employees, exclude liability for any loss or damage resulting from the issue or use of, or reliance
on, anything contained in or omitted from this document.This document is not a recommendation or personal advice in relation to Centuria or any product or service offered by Centuria and does not take into account the investment objectives, financial situation or needs of any particular person. Past performance is not indicative of future performance.
To the extent this document contains prospective financial information, that information has been based on current expectations about future events and is, however, subject to risks, uncertainties and assumptions that could cause actual results to differ materially from expectations.
Disclaimer
Information in this presentation is general information only. Before you make any decision in relation to your investment, we recommend that you obtain financial advice from a licensed financial adviser.
Centuria Capital Limited
Presentation to Investors and Analysts 19
For
per
sona
l use
onl
y