
Results - shodhganga.inflibnet.ac.inshodhganga.inflibnet.ac.in/bitstream/10603/29930/8/08_chappter...
34
Results
Transcript of Results - shodhganga.inflibnet.ac.inshodhganga.inflibnet.ac.in/bitstream/10603/29930/8/08_chappter...

Results

Results
4. Results
4.1. SNPs and allele frequencies in C10orf2 (PEOl) gene in discovery panel
No new SNP could be detected in all the discovery panel samples. However,
four SNPs reported in NCB! database in non-coding regions of C 1 Oort2 gene were
found in different population samples. The SNPs rs3740485 (iSNP 000315, intron 3,
position 3300 in gene, allele 'C' replaced by 'T'); rs3740486 (iSNP 000316, intron
3, position 3302 in gene, allele 'T' replaced by 'C'); rs3740487 (iSNP 000317,
intron 4, position 3462 in gene, allele 'C' replaced by 'A'), and rs3824783 (iSNP
000330, intron 4, position 3530 in gene, allele 'G' replaced by 'A'), were found to
be present in populations checked. All these four SNPs (rs3740485, Clf; rs3740486,
TIC; rs3740487, CIA; and rs3824783 GIA) were present in three castes (9, 18, and
22, all IE) and three tribal (dSNP 29, 31, 32, all AA) sub populations of India. In
addition, the 'C' allele of rs3740486 was also present in dSNP6 (IE, Tribe) and
dSNP24 (DR, Tribe) oflndian populations. Similarly, allele 'A' of SNP rs3740487
and rs3824783 was present in dSNP1 (caste, IE) (Fig. 6, 7, 8, 9, 10 & 11; Table:
VII).
Other eight validated SNPs reported at NCB! database (rs7184, rs1535349,
rs2863095, rs3740484, rs3740488, rs3740489, rs4919511, and rs 17113613) were
absent in the discovery samples for C 1 Oort2 gene.
The allelic frequencies were calculated for all four SNPs within the gene
C10orf2. For SNP rs3740485, allelic frequencies of allele 'C' and allele 'T' were
0.672 and 0.328, for rs3740486, 0.359 'G' and 0.641 'T'; for rs3740487, 0.719 'C'
and 0.281 'A' and for rs3824783, 0.625 'G' and 0.375 'A' in total 32 populations
(Table: IX).
4.2. SNPs and allele frequencies in MPG gene in discovery panel
No new SNP was found in MPG gene in the Indian sub populations. Only
one synonymous SNP reported in NCB! database (exonic location 2642, SNP ID
rs3176388, 'C' is replaced by 'T') was found present in exon 2, of IE, caste
population dSNP9 and dSNP11 of discovery panel (Fig. 12 & 13; Table: VIII).
The allelic frequencies were calculated for the SNP rs3176388 within the
gene MPG. For SNP rs3176388, allelic frequencies of allele 'C' and 'T' were 0.710
and 0.290 (Table: VIII).
46

Results
4.3. Heterozygosity of SNPs in C10orf2 and MPG in discovery panel
Nine populations for SNP rs3740485 (dSNP1, 5, 6, 10, 11, 12, 23, 24, 28);
seven for rs3740786, (dSNP1, 5, 10, 12, 17, 28, 30); four for rs3740787 (dSNP5, 10,
11, 30), and ten for rs3824783, (dSNP4, 5, 6, 11, 12, 23, 24, 25, 26, 30) in gene
C10orf2 were found to be heterozygous out of32 populations (Table: X).
In case of SNP rs3176388, in gene MPG, nine populations (dSNP2, 3, 14,
18, 21, 22, 36 and 40) were heterozygous out of 40 populations (Table: X).
4.4. SNPs and allele frequencies in C10orf2 (PEOl) gene in validation panel
Allele frequencies for the allele 'C' of the SNP rs3740485 were found to be
less than 0.5 in 36 populations (IE-E-LP_CIB, IE-E-LP_KWB, IE-W-IP_BHL, IE
W-IP_DBH, IE-W-LP_DEB, IE-W-LP_PAL, IE-W-LP_SID, IE-N-LP_CMR, IE-N
LP _JAT, IE-N-LP _KKB, IE-N-LP _KSP, IE-N-LP _KUP, IE-N-LP _KOL, IE-N
LP _RJU, IE-N-LP _RJH, IE-N-LP _KHT, IE-N-SP _AGL, IE-N-SP _SUI, IE-NE
IP HJG IE-N-IP KNT IE-N-IP THR, TB-N-IP SPT TB-N-SP BUD DR-E--' -' - -' -' IP _MDA, DR-S-LP _ VKB, DR-C-LP _BHM, DR-S-IP _CNC, DR-S-LP _KLR, DR
S-LP _KRB, AA-E-IP _MUN, AA-E-IP _JNG, AA-W-IP _KLS, AA-NE-IP _KHS,
AA-C-IP _KKU and AA-C-IP _SHY); equal to 0.5 in 3 populations (IE-E-LP _MHA,
IE-N-SP_SHI and DR-S-IP_HLK), between 0.50 and 0.90 in 9 populations (IE-W
LP_KOB, IE-W-LP_PTD, IE-N-SP_RAM, IE-N-SP_SYD, DR-C-IP_GND, DR-S
LP_NDU, DR-S-LP_PDC, AA-E-IP_STL and AA-C-IP_BAI), more than 0.90 in 1
population (IE-N-SP_SYD), 1 in 3 populations (IE-NE-LP_NSD, IE-E-LP_ORB
and DR-S-IP_KRM) and absent in 3 population (IE-N-LP_SPB, IE-S-IP_HPK and
DR-S-IP _PNY). As a result twenty sub populations were found to be heterozygous
(IE-E-LP_KWB, IE-W-IP_DBH, IE-W-LP_DEB, IE-W-LP_KOB, IE-W-LP_PTD,
IE-W-LP _PAL, IE-N-LP _CMR, IE-N-LP _KUP, IE-N-LP _KOL, IE-N-LP _RJU, IE
N-SP _AGL, IE-N-SP _SUI, IE-N-IP _KNT, IE-N-IP _THR, DR-C-LP _BHM, DR-S
LP_KLR, AA-E-IP_MUN, AA-NE-IP_KHS, DR-C-IP_GND and DR-S-LP_NDU)
(Fig. 14; Table: II).
Similarly, allele frequency for the allele 'C' of the SNP rs3740486, 7
populations were with frequency less than 0.50 (IE-NE-LP _NSD, IE-E-LP _ORB,
DR-C-IP_GND, DR-S-IP_HLK, DR-S-IP_KRM, DR-S-LP_NDU, and AA-C
IP _BAI); 1 population with 0.50 (DR-S-LP _PDC); 13 populations between 0.50 and
0.90 (IE-W-IP_BHL, IE-W-IP_DBH, IE-W-LP_DEB, IE-W-LP_KOB, lE-W-
47

Results
LP_PTD, IE-W-LP_SID, IE-N-LP_KSP, IE-N-LP_SPB, DR-S-IP_CNC, DR-S
LP _KLR, DR-S-LP _KRB, AA-E-IP_JNG and AA-C-IP _SHY); 22 population
between 0.90 and 1.00 (IE-E-LP_KWB, IE-W-LP_PAL, IE-N-LP_CMR, IE-N
LP_KKB, IE-N-LP_KOL, IE-N-LP_RJU, IE-N-LP_KHT, IE-N-SP_RAM, IE-NE
IP_HJG, IE-N-IP_KNT, IE-S-IP_HPK, TB-N-IP_SPT, TB-N-SP_BUD, TB-N
SP_BUH, TB-NE-LP_MEI, DR-E-IP_MDA, DR-S-LP_VKB, DR-C-LP_BHM,
AA-E-IP _MUN, AA-W-IP _KLS, AA-NE-IP _KHS and AA-C-IP _KKU); 11
populations with frequency 1.00 (IE-E-LP _ CIB, IE-E-LP _MHA, IE-N-LP _JAT, IE
N-LP_KUP, IE-N-LP_RJH, IE-N-SP_AGL, IE-N-SP_SUI, IE-N-SP_SHI, IE-N
IP _THR, DR-S-IP _PNY and AA-E-IP _STL) and absent in 1 population (IE-N
SP _SYD). Total44 sub populations were heterozygous in nature for rs3740486 (IE
E-LP_CIB, IE-E-LP_KWB, IE-E-LP_MHA, IE-W-IP_BHL, IE-W-LP_KOB, IE
W-LP _PAL, IE-W-LP _PTD, IE-N-LP _JAT, IE-N-LP _KKB, IE-N-LP _KUP, IE-N
LP_KOL, IE-N-LP_RJU, IE-N-LP_RJH, IE-N-LP_SPB, IE-N-LP_KHT, IE-N
SP _AGL, IE-N-SP _RAM, IE-N-SP _SUI, IE-N-SP _SHI, IE-N-SP _SYD, IE-NE
IP HJG IE-N-IP KNT IE-N-IP THR IE-S-IP HPK TB-N-IP SPT TB-N--' -' -' -' -, SP _BUD, TB-N-SP _BUH, TB-NE-LP _MEl, DR-E-IP _MDA, DR-S-LP _ VKB, DR
S-IP _PNY, DR-C-LP _ BHM, DR-C-IP _ GND, DR-S-LP _KLR, DR-S-LP _KRB,
DR-S-LP_PDC, AA-E-IP_STL, AA-E-IP_MUN, AA-E-IP_JNG, AA-W-IP_KLS,
AA-NE-IP_KHS, AA-C-IP_KKU, AA-C-IP_SHY and AA-C-IP_BAI) (Fig. 15;
Table: II).
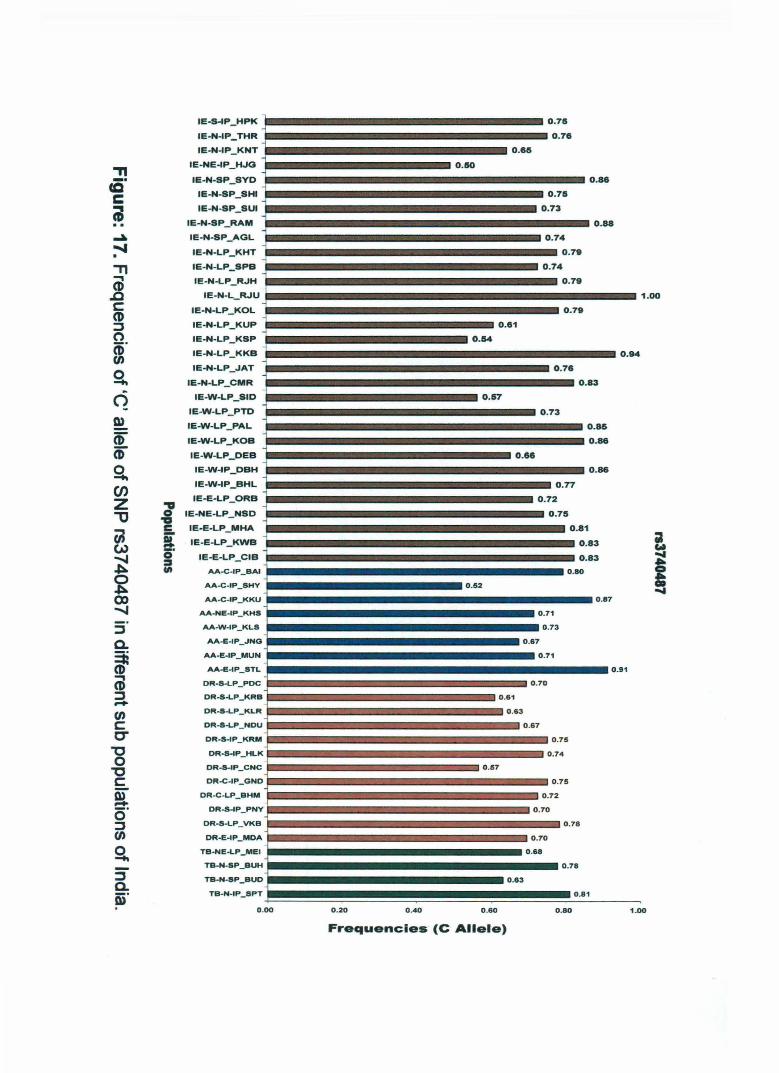
Allele frequencies for the allele 'C' of the SNP rs3740487 were found to be
0.5 in one population (IE-NE-IP_HJG), between 0.50 and 0.90 in 51 populations
(IE-E-LP_CIB, IE-E-LP_KWB, IE-E-LP_MHA, IE-NE-LP_NSD, IE-E-LP_ORB,
IE-W-IP_BHL, IE-W-IP_DBH, IE-W-LP_DEB, IE-W-LP_KOB, IE-W-LP_PAL,
IE-W-LP_PTD, IE-W-LP_SID, IE-N-LP_CMR, IE-N-LP_JAT, IE-N-LP_KSP, IE
N-LP _KUP, IE-N-LP _KOL, IE-N-LP _RJH, IE-N-LP _SPB, IE-N-LP _KHT, IE-N
SP _ AGL, IE-N-SP _RAM, IE-N-SP _SUI, IE-N-SP _ SHI, IE-N-SP _ SYD, IE-N
IP _KNT, IE-N-IP _THR, IE-S-IP _HPK, TB-N-IP _SPT, TB-N-SP _BUD, TB-N
SP_BUH, TB-NE-LP_MEI, DR-E-IP_MDA, DR-S-LP_ VKB, DR-S-IP_PNY, DR
C-LP_BHM, DR-C-IP_GND, DR-S-IP_CNC, DR-S-IP_HLK, DR-S-IP_KRM, DR
S-LP _NDU, DR-S-LP _KLR, DR-S-LP _KRB, DR-S-LP _PDC, AA-E-IP _MUN,
AA-E-IP JNG AA-W-IP KLS AA-NE-IP KHS AA-C-IP KKU AA-C-IP SHY -' -' -' -' -and AA-C-IP _BAI); between 0.90 and 1.00 in 2 population (IE-N-LP _KKB and
48

Results
AA-E-IP_STL) and 1 population with frequencies 1.00 (IE-N-LP_RJU). Total 51
sub populations {IE-E-LP_CIB, IE-E-LP_KWB, IE-E-LP_MHA, IE-NE-LP_NSD,
IE-E-LP ORB IE-W-IP BHL IE-W-LP DEB IE-W-LP KOB IE-W-LP PAL -' -' -, -' -' IE-W-LP_PTD, IE-W-LP_SID, IE-N-LP_CMR, IE-N-LP_KKB, IE-N-LP_KSP, IE
N-LP_KUP, IE-N-LP_KOL, IE-N-LP_RJU, IE-N-LP_RJH, IE-N-LP_SPB, IE-N
LP _KHT, IE-N-SP _AGL, IE-N-SP _RAM, IE-N-SP _SUI, IE-N-SP _SHI, IE-N
SP _ SYD, IE-NE-IP _ HJG, IE-N-IP_ KNT, IE-N-IP_ THR, IE-S-IP_ HPK, TB-N
IP _SPT, TB-N-SP _BUD, TB-N-SP _BUH, TB-NE-LP _MEl, DR-E-IP _MDA, DR
S-LP_ VKB, DR-S-IP_PNY, DR-C-LP_BHM, DR-C-IP_GND, DR-S-IP_CNC, DR
S-IP _HLK, DR-S-IP _KRM, DR-S-LP _NDU, DR-S-LP _KLR, DR-S-LP _KRB, DR
S-LP _PDC, AA-E-IP _ MUN, AA-E-IP _JNG, AA-W -IP _ KLS, AA-NE-IP _ KHS,
AA-C-IP _KKU and AA-C-IP _SHY) were heterozygous in nature for rs3740487
(Fig. 16; Table: II).
Allele frequencies for the allele 'G' of the SNP rs3824 783 were found to be
less than 0.5 in two sub populations (IE-NE-IP _HJG, DR-S-IP _PNY); equal to 0.5
in 1 sub population (IE-W-IP_BHL), between 0.50 and 0.90 in 52 sub populations
{IE-E-LP_CIB, IE-E-LP_KWB, IE-E-LP_MHA, IE-NE-LP_NSD, IE-E-LP_ORB,
IE-W-IP _DBH, IE-W-LP _DEB, IE-W-LP _KOB, IE-W-LP _PAL, IE-W-LP _PTD,
IE-W-LP _SID, IE-N-LP _CMR, IE-N-LP _JAT, IE-N-LP _KKB, IE-N-LP _KSP, IE
N-LP _KUP, IE-N-LP _KOL, IE-N-LP _RJU, IE-N-LP _RJH, IE-N-LP _SPB, IE-N
LP_KHT, IE-N-SP_AGL, IE-N-SP_RAM, IE-N-SP_SUI, IE-N-SP_SHI, IE-N
SP _SYD, IE-N-IP _KNT, IE-N-IP _THR, IE-S-IP _HPK, TB-N-IP _SPT, TB-N
SP _BUD, TB-N-SP _BUH, TB-NE-LP _MEl, DR-E-IP _MDA, DR-S-LP _ VKB, DR
C-LP_BHM, DR-C-IP_GND, DR-S-IP_CNC, DR-S-IP_HLK, DR-S-IP_KRM, DR
S-LP NDU DR-S-LP KLR, DR-S-LP KRB DR-S-LP PDC AA-E-IP STL AA--' - -' -' -, E-IP_MUN, AA-E-IP_JNG, AA-W-IP_KLS, AA-NE-IP_KHS, AA-C-IP_KKU,
AA-C-IP _SHY and AA-C-IP _BAI ). All 55 sub populations were heterozygous for
rs3824783 (Fig. 17; Table: II).
The following populations were found to be monomorphic (allele frequency
equal to one) for the 'C' allele of rs3740485, three sub populations (IE-NE
LP _NSD, IE-E-LP _ORB and DR-S-IP _KRM); for 'C' allele of rs3740486, eleven
sub populations (IE-E-LP_CIB, IE-E-LP_MHA, IE-N-LP_JAT, IE-N-LP_KUP, IE
N-LP _RJH, IE-N-SP _AGL, IE-N-SP _SUI, IE-N-SP _SHI, IE-N-IP _THR, DR-S
IP _PNY and AA-E-IP _ STL); for 'C' allele of rs3740487, one sub population (lE-N-
49
Results
LP_RJU) and for 'G' allele ofrs3824783 (none ofthe population). The data shows
the maximum number of eleven sub populations were monomorphic for 'C' allele of
rs3740486.
Additionally, in rs3740485 there were three sub populations, where allele 'C'
was replaced with allele 'T'. Similarly in rs3740486, only one sub population was
with 100% frequency of allele 'T'. In case of rs3740487 and rs3824783, no sub
populations were with alternative alleles 'A' and 'G' respectively.
The Indian populations found to be polymorphic (homozygous and
heterozygous) in discovery panel like, dSNP6, 24, 49 and dSNP53 were also
polymorphic in large population samples of validation panel.
4.5. SNPs and allele frequencies in MPG gene in validation panel
In MPG gene, allele frequencies for the allele 'C' of the SNP rs3176388
were found to be absent in frequency category less than 0.5 and equal to 0.5,
between 0.50 and 0.90 in 17 sub populations (IE-E-IP _em, IE-E-LP _ KWB, IE-NE
LP_NSD, IE-E-LP_ORB, IE-W-LP_DEB, IE-W-LP_KOB, IE-W-LP_PAL, IE-W
LP_PTD, IE-W-IP_SID, IE-N-LP_RJH, IE-N-SP_SHI, IE-N-IP_THR, TB-N
SP _BUD, DR-S-IP _KRM, DR-S-LP _NDU, DR-S-LP _KLR and AA-E-IP _JNG),
more than 0.90 in 6 sub populations (IE-N-LP _CMR, IE-N-LP _KSP, IE-NE
IP_HJG, TB-N-IP_SPT, TB-NE-LP_MEI and DR-C-IP_GND), and 1 in one sub
population (AA-C-IP _BAI). As a result 23 sub populations were found to be
heterozygous (IE-E-IP _em, IE-E-LP _KWB, IE-NE-LP _NSD, IE-E-LP _ORB, IE
W-LP_DEB, IE-W-LP_KOB, IE-W-LP_PAL, IE-W-LP_PTD, IE-W-IP_SID, IE-N
LP_RJH, IE-N-SP_SHI, IE-N-IP_THR, TB-N-SP_BUD, DR-S-IP_KRM, DR-S
LP_NDU, DR-S-LP_KLR, AA-E-IP_JNG, IE-N-LP_CMR, IE-N-LP_KSP, IE-NE
IP_HJG, TB-N-IP_SPT, TB-NE-LP_MEI and DR-C-IP_GND). The SNP rs3178388
observed polymorphic in discovery panel ( dSNP9 and 11) which is in corroboration
with the results of discovery panel (Fig. 18; Table: III).
Similarly, in MPG gene SNPs like rs2234949 (G/T, exon 4) and rs2308313
(CIT, exon 3) alleles 'G' and 'C' were found to be monomorphic in all 24 Indian sub
populations respectively. Both of these SNPs were absent in discovery panel
populations.
50
Results
4.6. Analysis of genomic heterozygosity in 55 sub populations of India
Average heterozygosity for Indo-European, Tibeto-Burman, Dravidian and
Austro-Asiatic linguistic groups
The heterozygosity was calculated for each of the population and arranged
according to different linguistic population groups like IE, TB, DR and AA.
The average heterozygosity observed among 31 IE populations varied
between 0.32 (min) in IE-W-LP_SID and IE-N-LP_KUP to 0.50 (max) in IE-W
LP _PTD. In all other IE populations the average heterozygosity values falls between
the ranges of min to max. The average heterozygosity observed among 4 TB
populations varied between 0.32 in TB-N-IP_SPT (min) to 0.50 in TB-N-IP_BUD
(max). The average heterozygosity observed among 12 DR populations varied
between 0.32 in DR-C-IP _ GND (min) to 0.50 in DR-S-LP _KLR (max). The average
heterozygosity observed among 8 AA populations varied between 0.36 in AA-E
IP _MUN (min) to 0.49 in AA-E-IP _JNG (max). The maximum average
heterozygosity for all the four linguistics Indo-European, Tibeto-Burman, Dravidian
and Austro-Asiatic was 0.31, 0.32, 0.32 and 0.36; while maximum average diversity
was 0.50, 0.50, 0.50 and 0.49 respectively (Table: XI).
4.7. Analysis of genomic diversity in subdivided populations using F-statistics
Gene diversity (Ht) and its associated parameters like inter-populational gene
variation or coefficient of gene differentiation (Gst) and intra-populational
genetic variation (Hs) within the Indo-European, Tibeto-Burman, Dravidian
and Austro-Asiatic linguistic groups for four SNP loci of ClOortl
In Indo-European populations, the Gst values were minimum 0.091 while for
other remaining loci it was almost similar (>0.152). Total gene diversity for all the
four loci was found to be almost similar. Similarly the intra-populational genetic
variation i.e. Hs values were almost similar in all the four SNPs under study and
ranges from 0.39 (min) to 0.45 (max). The overall values were 0.152, 0.490, and
0.416 for Gst, Ht and Hs respectively.
In Tibeto-Burman populations, the Gst values were minimum 0.069 for
SNP3 while highest for SNP4 i.e. 0.132. For other remaining loci it were >0.069
and <0.132. Total gene diversity was ranges from 0.387 to 0.488. Similarly Hs
values were between 0.383 (min for SNP2) and 0.448 (max for SNP3). The overall
values were 0.099, 0.443, and 0.399 for Gst, Ht and Hs respectively.
51

Results
In Dravidian populations, the minimum values ofGst, Ht and Hs were 0.037
(SNP4), 0.466 (SNP1) and 0.386 (SNP1) while maximum values for 0.173 (SNP1),
0.491 (SNP3) and 0.467 (SNP4) respectively. The overall values of Gst, Ht and Hs
for all four loci ofC10orf2 were 0.110, 0.483 and 0.430 respectively.
In Austro-Asiatic populations (exclusively tribes of Indian origin) the
minimum values of Gst or Fst (Gst=Fst for bi allelic loci), Ht and Hs were 0.091
(SNP1), 0.460 (SNP1) and 0.415 (SNP3) while maximum values for 0.164 (SNP3),
0.498 (SNP2) and 0.432 (SNP4) respectively. The overall values of Gst, Ht and Hs
for all four loci ofC10orf2 were 0.125, 0.485 and 0.424 respectively (Table: XII). In
all four linguistic populations the Gst values were less than 0.25 which indicates
negligible genetic differentiation among populations analysed.
4.8. Calculation of chi square values and degree of freedom for ClOortl gene in
Indo-European, Tibeto-Burman, Dravidian and Austro-Asiatic linguistic
groups
The Chi-square values obtained after analysis of the four SNPs of gene
C10orf2 within 55 Indian sub populations suggests the p-values <0.001 (significant)
for all four linguistic populations namely, IE, TB, DR and AA which, shows that the
populations are homogenous (Table: XIII).
4.9. Association of ClOortl and mtDNA genes with Ophthalmoplegia
Clinical presentation of the patients
Presently, all Ophthalmoplegia cases had commonly observed symptoms like
ptosis, eye muscle pain and weakness. The first sample was an unmarried female of
age 16, with single eye ptosis since childhood. Her eye movement was limited and
symptoms of ptosis observed at the age of six month. The second sample was a 9
year female patient with symptoms like opthalmoparesis, limited eye movement in
all gazes except abduction and single eye ptosis since the age of2 year. She came to
hospital after severe meningitis attack. Third sample was a 25 year married female
patient with single eye ptosis, diplopia, limited eye movement except down gaze,
and with onset of Ophthalmoplegia symptoms at the age of 25. The fourth sample
was 8-year female with single right eye ptosis since birth. The fifth sample was a 20-
year aged male with single left eye ptosis since birth. The movement of the eye was
52

Results
limited except the down gaze. Fifth patient also felt pain in his eye muscle during
cycling and running.
None of the subjects had any family history of opthalmoplegic or any other
eye disease upto their first cousin level hence all samples were categorized as
sporadic. Except third patient, all others developed the disease symptoms during
early age of their childhood (Table: XIV). Few of the rarely observed
opthalmoplegic symptoms like mental changes, cardiomyopathy, rhabdomyolysis,
sensorineural deafness, cataracts and endocrinopathies were absent in our patients.
Mutational analysis of Cl Oorf2 and mitochondrial genes
Mutation analysis in five coding regions of C10orf2 revealed no nucleotide
variation in any of the sporadic Ophthalmoplegia patients, in comparison to 30
ethnically matched controls.
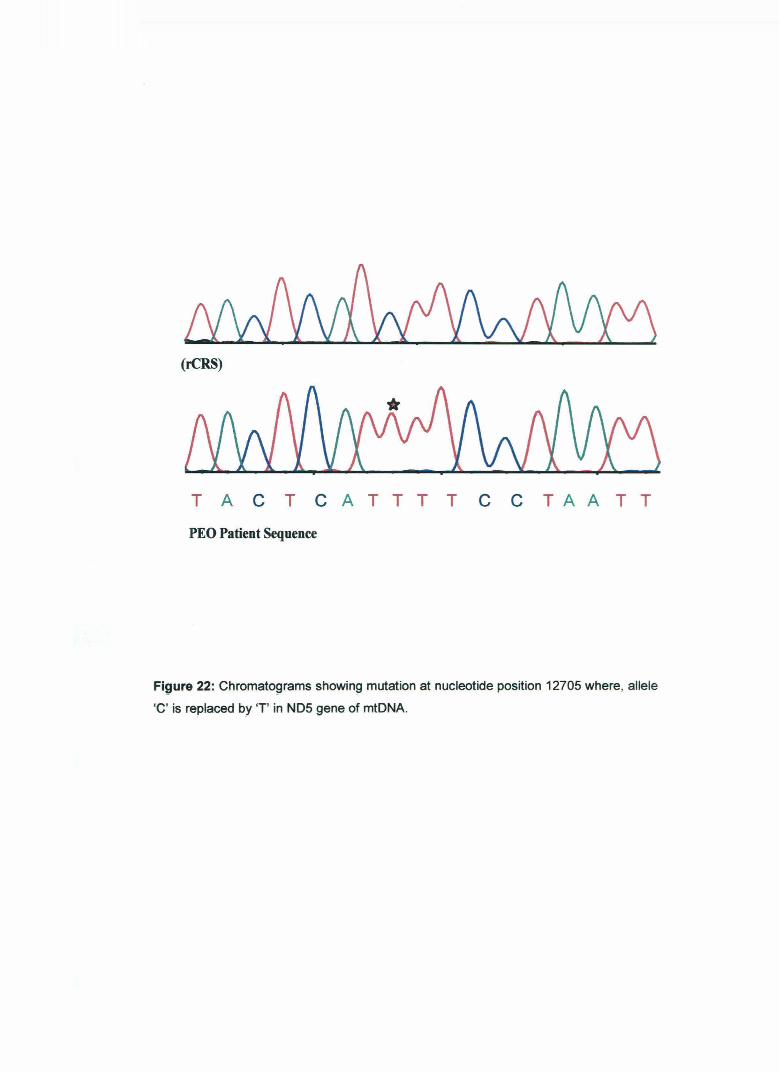
However, mtDNA analysis in 5 samples of PEO, revealed mutations in ND2
(5450, A/G, synonymous, novel); in tRNA-Trp (5576, A/G, T stem of tRNA-Trp,
novel); in non coding nucleotide region or MT-NC3 (5585, G/A, reported at
MITOMAP) and in NADH dehydrogenase subunit 5 (MDND5) (12705, Clf,
synonymous, reported at MITOMAP) genes. Mutations A5450G and C12705T were
observed in fifth patient; A5576G, G5585A, C12705T in second and C12705T in
fourth patient (Fig. 19, 20, 21, 22 & 23; Table: XIV).
None of the mutations were found in mitochondrial genes like tRNA-Leu,
RNR2, tRNA-Asn, tRNA-Ala, tRNA-Trp, tRNA-Cys, tRNA-Try, TRNL2, tRNA
His, tRNA-Ser, ND1 and ND4 in present study following mtDNA sequencing.
53

Table VII: Genotypes of four SNPs rs3740485, rs3740486, rs3740487 and rs3824783 of
C10orf2 gene in representative Discovery panel of Indian populations.
Sample Linguistics Castelfribes Discovery
rs374048S rs3740486 rs3740487 rs3824783 (Geography) paneiiD West Bengal IE-E-LP Rarhi Brahmin (c) dSNPI CT CT AA AA
Uttar Pradesh IE-N-LP Kanyakubj Brahmin (c) dSNP2 cc TI cc GG Himachal IE-N-IP Kannet(T) dSNP3 cc TI cc GG Pradesh
West Bengal IE-E-LP Mahishya (c) dSNP4 cc TI cc AG
Bihar IE-E-LP Bhumihar (c) dSNPS CT CT AC AG
Rajasthan IE-W-IP Bhil (T) dSNP6 CT cc cc AG
Rajasthan IE-W-LP Paliwal Brahmin (c) dSNP7 cc TI cc GG
Maharastra IE-W-LP Deshatha Brahmin (c) dSNP8 cc TI cc GG
Rajasthan IE-W-SP Maheswaris (c) dSNP9 TI cc AA AA
Maharastra IE-W-SP CKP (c) dSNPIO CT CT AC GG
Maharastra IE-W-SP Parsis (c) dSNPll CT TI AC AG
Maharastra IE-N-LP Koli(T) dSNPI2 CT CT cc AG Himachal IE-N-LP Rajput(c) dSNPI3 cc TI cc GG Pradesh Himachal IE-N-LP Lohar(c) dSNP14 cc TI cc GG Pradesh
West Bengal IE-N-LP Kayastha (c) dSNP15 cc TI cc GG
Uttar Pradesh IE-N-SP Shia (c) dSNP16 cc TI cc GG
Haryana IE-N-SP Aggrawal (c) dSNP17 cc CT cc GG
Punjab IE-N-SP Ramgaria sikh (c) dSNP18 TI cc AA AA
l'wliab IE-N-LP Khatri dSNP19 cc TI cc GG Himachal IE-N-LP Chamar(c) dSNP20 cc TI cc GG Pradesh
Kamataka IE-S-IP Hakki pikki (T) dSNP21 cc TI cc GG
Maharastra IE-C-LP Chitpawan Brahmin (c) dSNP22 TI cc AA AA
Meghalaya TB-NE-IP Khasi (T) dSNP23 CT TI cc AG Andhra DR-S-IP Kuruman(T) dSNP24 CT cc cc AG Pradesh Andhra DR-S-LP Reddy(c) dSNP25 cc TI cc AG Pradesh
Kamataka DR-S-LP Gowda(c) dSNP26 cc TI cc AG
Chattisgarh DR-C-LP Bison Hom Maria (c) dSNP27 cc TI cc GG
West Bengal AA-E-IP Santhal (T) dSNP28 CT CT cc GG
Jbarldland AA-E-IP Munda(T) dSNP29 TI cc AA AA Andaman& AA-S-IP Nicobaries (T) dSNP30 cc CT AC AG
Nicobar Andaman& AA-S-IP Ongis(T) dSNP31 TI cc AA AA Nicobar
Maharastra AA-C-IP Kurku(T) dSNP32 Yf cc AA AA

Table VIII: Genotypes of the SNP rs3176388 of MPG gene in Discovery panel of Indian populations.
Sample Linguistics Caste!fribes Discovery panel ID rs3176388 (Geography) West Bengal IE-E-LP Rarhi Brahmin (c) dSNPI cc Uttar Pradesh IE-N-LP Kanyakubj Brahmin (c) dSNP2 CT
Himachal Pradesh IE-N-IP Kannet(T) dSNP3 CT
West Bengal IE-E-LP Mahishya (c) dSNP4 cc Bihar IE-E-LP Bhumihar (c) dSNPS cc
Rajasthan IE-W-IP Bhil (T) dSNP6 NA
Rajasthan IE-W-LP Paliwal brahmin (c) dSNP7 cc Maharastra IE-W-LP Deshatha Brahmin (c) dSNP8 cc Rajasthan IE-W-SP Maheswaris (c) dSNP9 TT
Maharastra IE-W-SP CKP(c) dSNPJO cc Maharastra IE-W-SP Parsis (c) dSNPII TT
Maharastra IE-N-LP Koli(T) dSNPI2 cc Himachal Pradesh IE-N-LP Rajput (c) dSNPI3 cc Himachal Pradesh IE-N-LP Lobar (c) dSNPI4 CT
West Bengal IE-N-LP Kayastha (c) dSNPIS NA
Uttar Pradesh IE-N-SP Shia(c) dSNPI6 NA
Haryana IE-N-SP Aggrawal (c) dSNPI7 cc Punjab IE-N-SP Ramgaria sikh (c) dSNPI8 CT
Punjab IE-N-LP Khatri (c) dSNPJ9 cc Himachal Pradesh IE-N-LP Chamar (c) dSNP20 cc
Kamataka IE-S-IP Hakki pikki (T) dSNP2l CT
Maharastra IE-C-LP Chitpawan Brahmin (c) dSNP22 CT
Meghalaya TB-NE-IP Khasi dSNP23 cc Andhra Pradesh DR-S-IP Kuruman(T) dSNP24 NA
Andhra Pradesh DR-S-LP Reddy (c) dSNP2S cc Kamataka DR-S-LP Gowda(c) dSNP26 cc Chattisgarh DR-C-LP Bison Horn Maria (c) dSNP27 cc
West Bengal AA-E-IP Santhal (T) dSNP28 NA
Jharkhand AA-E-IP Munda(T) dSNP29 NA
Andaman & Nicobar AA-S-IP Nicobaries (T) dSNP30 NA
Andaman & Nicobar AA-S-IP Ongis (T) dSNP31 NA
Maharastra AA-C-IP Kurku(T) dSNP32 NA
Jharkhand IE-E-LP Chik Baraik (T) dSNP33 cc Uttar Pradesh IE-N-IP Tharu(T) dSNP34 cc Uttar Pradesh IE-N-SP Sunni (c) dSNP3S cc West Bengal IE-N-LP Bagdi (c) dSNP36 CT
Meghalaya IE-NE-IP Hajong(T) dSNP37 cc West Bengal TB-E-IP Rabha(T) dSNP38 cc
Bihar DR-E-IP Madia(T) dSNP39 cc Andhra Pradesh DR-S-IP Vaidiki Brahmin (c) dSNP40 CT
Note: NA means DNA samples was not available for amplification
Table IX: Genotypes and allelic frequencies of different SNPs in discovery panel for C10orf2 and MPG genes.
Gene Total no. Allele SNPID p Allele q Allele Heterozygous of Freq. name
2enotype (p)
rs3740485 cc TI CT
32 0.672 (17) (6) (9)
rs3740486 cc TI CT
32 0.359 (8) (17) (7) C10orf2
rs3740487 cc AA AC
32 0.719 (21) (7) (4)
rs3824783 GG AA AG
32 0.625 (15) (7) (10)
MPG rs3176388 cc TI CT
31 0.710 (21) (2) (8)
Allele Freq.
(q)
0.328
0.641
0.281
0.375
0.290
Table X: The discovery panel samples with heterozygous status for respective SNPs in C10orf2 ar MPGgenes.
Heterozygous populations discovery Heterozygous genotype Total no.
SNPID of IDs i.e. dSNP (Number of sample)
genotype
rs3740485 dSNP 1, 5, 6, 10, 11, 12, 23, 24 & 28 CT(9) 32
rs3740486 dSNP 1, 5, 10, 12, 17,28 & 30 CT(7) 32
rs3740487 dSNP 5, 10, 11& 30 AC(4) 32
rs3824783 dSNP 4, 5, 6, 11, 12, 23, 24, 25, 26 & 30 AG (10) 32
rs3176388 dSNP 2, 3, 14, 18, 21, 22,36 & 40 CT(8) 40

Table XI: Average heterozygosity for C10orf2 gene in 55 Indian sub populations.
Indian POPulations POP ID Average Hetei"C)~osity Standard Error _ift}_ POP1 IE-E-LP CIB 0.42 0.08 POP2 IE-E-LP KWB 0.46 0.02 POP3 IE-E-LP MHA 0.44 0.06 POP4 IE-NE-LP NSD 0.36 0.06 POPS IE-E-LP ORB 0.42 0.07 POP6 IE-W-IP BHL 0.42 0.07 POP7 IE-W-IP DBH 0.42 0.06 POPS IE-W-LP DEB 0.44 0.04 POP9 IE-W-LP KOB 0.41 0.10
POP10 IE-W-LP PAL 0.39 O.ll POP11 IE-W-LP PTD 0.51 0.00 POP12 IE-W-LP SID 0.32 0.08 POPI3 IE-N-LP CMR 0.35 0.12 POP14 IE-N-LP JAT 0.45 0.04 POP15 IE-N-LP KKB 0.43 0.05 POP16 IE-N-LP KSP 0.37 0.09 POP17 IE-N-LP KUP 0.32 0.12 POP18 IE-N-LP KOL 0.44 0.02 POP19 IE-N-LP RJU 0.36 0.12 POP20 IE-N-LP RJH 0.46 0.02 POP21 IE-N-LP SPB 0.46 0.04 POP22 IE-N-LP KHT 0.45 0.03 POP23 IE-N-SP AGL 0.45 0.04 POP24 IE-N-SP RAM 0.46 0.03 POP25 IE-N-SP SUI 0.45 0.06 POP26 IE-N-SP SHI 0.46 0.04 POP27 IE-N-SP SYD 0.43 0.06 POP28 IE-NE-IP HJG 0.43 0.04 POP29 IE-N-IP KNT 0.45 0.03 POP30 IE-N-IP THR 0.43 0.05 POP31 IE-S-IP HPK 0.48 0.02 POP32 TB-N-IP SPT 0.32 0.10 POP33 TB-N-SP BUD 0.34 0.02 POP34 TB-N-SP BUH 0.50 0.00 POP35 TB-NE-LP MEl 0.45 0.03 POP36 DR-E-IP MDA 0.46 0.02 POP37 DR-S-LP VKB 0.35 0.08 POP38 DR-S-IP PNY 0.47 _!.02 POP39 DR-C-LP BHM 0.45 0.02 POP40 DR-C-IP GND 0.32 0.12 POP41 DR-S-IP CNC 0.43 0.04 POP42 DR-S-IP HLK 0.48 0.02 POP43 DR-S-IP KRM 0.47 0.02 POP44 DR-S-LP NDU 0.38 0.13 POP45 DR-S-LP KLR 0.50 0.01 POP46 DR-S-LP KRB 0.47 0.02 POP47 DR-S-LP PDC 0.46 _().01 POP48 AA-E-IP STL 0.47 0.02 POP49 AA-E-IP MUN 0.36 0.05 POP 50 AA-E-IP JNG 0.49 0.02 POPS I AA-W-IP KLS 0.46 0.03 POP52 AA-NE-IP KHS 0.37 0,07 POP53 AA-C-IP KKU 0.38 0.06 POP 54 AA-C-IP SHY 0.47 0.05 POP 55 AA-C-IP BAI 0.46 0.03

Table XII: Gst (Inter-populational gene variation or coefficient of gene differentiation); Ht
(Total gene diversity) and Hs (Intra-populational genetic variation) within the major language
families/linguistic groups namely Indo-European, Tibeto-Burman, Dravidian and Austro
Asiatic using 4 SNP loci of C10orf2 gene.
ClOorflloci in Indo-European populations Gst Ht Hs
rs3740485 (SNP1) 0.177 0.486 0.400
rs3740486 (SNP2) 0.091 0.497 0.452
rs3740487 (SNP3) 0.169 0.498 0.414
rs3824783 (SNP4) 0.171 0.478 0.397
All SNP Loci (SNP1-4) 0.152 0.490 0.416
ClOorflloci in Tibeto-Burman populations
rs3740485 (SNP1) 0.076 0.415 0.383
rs3740486 (SNP2) 0.119 0.387 0.341
rs3740487 (SNP3) 0.069 0.482 0.448
rs3824783 (SNP4) 0.132 0.488 0.424
All SNP Loci (SNP1-4) 0.099 0.443 0.399
ClOortlloci in Dravidian populations
rs3740485 (SNPI) 0.173 0.466 0.386
rs3740486 (SNP2) 0.081 0.489 0.449
rs3740487 (SNP3) 0.151 0.491 0.417
rs3824783 (SNP4) 0.037 0.485 0.467
All SNP Loci (SNPI-4) 0.110 0.483 0.430
ClOorflloci in Austro-Asiatic populations
rs3740485 (SNP1) 0.091 0.460 0.418
rs3740486 (SNP2) 0.135 0.498 0.430
rs3740487 (SNP3) 0.164 0.497 0.415
rs3824783 (SNP4) 0.108 0.484 0.432
All SNP Loci (SNP1-4) 0.125 0.485 0.424

Table XIII: Calculation of Chi square values and degree of freedom for Indo-European,
Tibeto-Burman, Dravidian and Austro-Asiatic linguistic groups using 4 loci of C1 Oorf2 gene.
p-Values from
Populations SNP Chi square Degree chi- square
of freedom (DF) statistics
rs3740485 265.28
rs3740486 178.7 Indo-European 30
rs3740487 342.86
rs3824783 340.52
rs3740485 19.34
rs3740486 28.18 Tibeto-Burman 3
rs3740487 21.05
rs3824783 39.73
rs3740485 110.73 <0.001
rs3740486 61.01 Dravidian ll
rs3740487 76.05
rs3824783 32.66
rs3740485 25.91
rs3740486 36.96 Austro-Asiatic 7
rs3740487 83.28
rs3824783 38.6

Table XIV: Mitochondrial mutations observed in sporadic Progressive External
Ophthalmoplegia patients in comparison to revised Cambridge Reference Sequence
(rCRS).
Variation Amino Nucleotide Samples Region
rCRS in blood acid Significance position affected affected
mtDNA change
NADH
dehydrogenase 5450 A G Fifth Synonymous Novel
subunit2
(ND2)
Tstem of 5576 A G Second -- Novel
tRNA-Trp
Non-coding Non-coding 5585 G A Second Reported
Nucleotides region
NADH Second
dehydrogenase 12705 c T Fourth Synonymous Reported
subunit 5 Fifth
(MDND5)
References
-
--
MITOMAP
MITOMAP
Cytapllltic La catian
(1'13740485, DJOllS, CIT, Palitian: 3300) (1'13740486, DJ0316, TIC, Palitian: 3302.)
j j 1. dSNP9, Mahennri, Cute,lbjuthu, IE 1. dSNP6, Bhil, Tribe, Rajuthu, IE 2. dSNP18, Rampria Sikh, CuteePuniab, IE 2. dSNP9, Mahennri, Cute, Rajuthu, IE 3. IISNPn., Chitpawan Brahmin, Cute, M11wutn, IE 4. dSNPl9, Munda, Tribe, Jlwkhmd, AA 5. dSNPll, Oqis, Tribe,Andm.u &N'~eabar, AA 6. dSNPl2, Kmku, Tribe, Malwutra, AA
3. dSNP18, Rampria Sikh, Cute, Punjab, II
4. IISNPn., Chitpawan Brahmin, Cute, Mllwutn, IE 5. dSNP14, Kunmum, Cute, Andhn Pndelh, DR
6. dSNPl9, Munda, Tribe, Jlwkhmd, AA
7. dSNPll, Oqis, Tribe, Andaman & N'~eabar, AA 8. dSNPl2, Kuru, Tribe, Mahamtn, AA
Figure 6: Diagrammatic illustration of the location of gene C10orf2 resides its five exons
and introns showing SNPs (rs3740485, i000315, CIT and rs3740486, i000316, T/C). The
Indian sub populations harboring the SNP has been shown in the figure along with
discovery sample 10 for Indian sub populations, name of populations, type of sub
population its distribution and linguistic type. The presence of two SNPs (rs3740485 and
rs3740486) in different Indian sub populations has also been seen.

Cytogenetic Ulcation
(lntron-4)
(n3740487, i000317, Cbange: CIA, Position: 3462) (n3824783, i000330, Change: G/A, Position: 3530)
1. dSNPl, Rarbi Brahmin, Caste, West Benga~ IE 2. dSNP9, Maheswari, Caste, Rajasthan, IE 3. dSNPl8, Ramgaria Sikb, Caste, Pnnjab, IE 4. dSNP22, Chitpawan Brahmin, Caste, IE S. dSNP29, Munda, Tribe, Jharkhand, AA 6. dSNPJl, Ongis, Tribe, Andaman & Nicobar, AA 7. dSNP32, Kurka, Tribe, Tribe, Maharastra, AA
Figure 7: Diagrammatic illustration of the gene C10orf2 resides its five exons and introns,
is showing SNPs (rs3740487, i000317, err and rs3824783, i000330, T/C) at position
3462 and 3530 in C10orf2. The Indian sub populations harboring the SNP has been
shown in the figure along with discovery sample 10, Indian SNP ID, name, type,
distribution and the linguistic type of sub populations.

Normal Freezed Sequence
CIT
rs3748415
G T T G G G A T G G [CIT] G C A G G A T C G C
(C3300T)
Figure 8: The chromatogr.ims are showing reference sequence (freezed) and site of
SNP (shown by black arrow) at position 3300 in gene C10orf2 where, the allele 'C' is
replaced by T for rs3740485. the sequence showing sNP in middle of the nucleotide
bases flanking in both the sidle of chdhde.

Normal Freezed Sequence
n3740486
(T3302C)
Figure 9: The chromatograms are showing reference sequence and site of SNP (shown
by black arrow) at position 3302 in C10orf2 gene where, the allele 'T' is replaced by 'C'
for rs37 40486.

1'83740487 HOMOZYGOUS
(CJ
Normal Freezed Sequence
183740487
~~~~~~~~~~~~~~~~~~-;~~
(C346lA)
Figure 10: The chromatograms are showing reference sequence and site of SNP (shown
by black arrow) at position 3462 in C1 Oorf2 gene where, the allele ·c· is replaced by 'A'
for rs3740487.

(G)
Nonnal Freezed Sequence
(G3530A)
Figure 11: The chromatograms are showing reference sequence and site of SNP (shown
by dotted rectangle) at position 3530 in C10orf2 gene where, the allele the allele 'G' is
replaced by 'A' for rs3824783. The SNP is also reported heterozygous in some
popufations.

GAG TTTT TCGACCAG
Figure 12: The chromatograms showing NCBI reference sequence and site of SNP
(shown by dotted rectangle) at position 2642 in MPG gene where, the allele 'C' is
replaced by 'r, for rs3176388. [1). NCBI reference sequerrce which was downloaded
from NCBI web site showing site of SNP in middle of 20bp sequence [2) heterozygous
status •cr and [3) homozygous status of the SNP.

(2280-2318)
Ideogram Chromosome 16
Cytogenetic Location p13.3
OMIM Morbid Map ~~~~~----------_.~~~~~~==~·~~
+
Total length ofMPG gene 8771bp
(Exon-2) (Exon-3) (Exon-4)
(5981-6185) (8330-8706)
(rs3176388, Change: err, Position: 2642)
! 1. dSNP 9, Maheswari, Caste, Rajasthan, IE 2. dSNPt 1, Parsis, Caste, Maharastra, IE
Figure 13: Diagrammatic showing cytogenetic location of MPG gene in ideogram of
chromosome 16, OMIM Morbid Map and position of the SNP rs3176388 and the
presence ofSNPs in two Indian sub populations are also shown.

., IE-S-IP _ HPK 0 .63
IE-N-IP_THR 0 .157
"ft IE-N-IP _ KNT 0 .153 -· CQ IE-NE-IP _H.JG 0..48
C IE-N.SP SYD 0 .84
i lE-N-S; _SHI 0.56 0 0
IE-N.SP _ SUI 1 0.84 ... j .,. IE-N-8P RAM 0.71
• IE-N-S;_ AGL 0 .70
, IE-N-LP KHT 1 0 .64 ~ - ~ .8 IE-H-LP _SPB ,. ..................................... 0 .6 1
C IE-N-LP _ RJH 0 .66
(1) IE- N-L_RJU 0 .715 5 IE- N-LP _ KOL 0 .70 ar IE-N-LP _KUP 0 .64
(/) IE-N-LP _ KSP 0 .64
O IE-N-LP _KKB 0 .74
...... IE-N-LP _ JAT 0.67
G) IE-N-LP _CMR 0 .71
- IE·W-LP _ SID 0 .67
!!!_ IE-W-LP _ PTD 0 .73
(i) IE..W-LP _ PAL 0 .63 -(1) IE-W-LP _ KOB 0.66
0 'I IE-W-LP _DEB , 0 .64
"""' ~ IE-W-IP _ DBH ~ 0.66
~ ii IE-W-IP _BHL -, 0.50 ;
~ !:!: IE-E-LP _ORB 0 .70 W u 0 ~ ~
:::1J IE-HE-LP _NSD 0 .6 1 ~
~ Ut ~J ............................................ .. (/) IE-E-LP _ MHA 0.67 ...,
~ IE-E-LP _KWB 0.61 ~ I\) IE·E-LP _CIB 0 .73
~ AA.C-IP_BAI 0.75
~ AA.C-IP _SHY 0 .1111
w AA.C-IP _KKU 0 .114
-· AA·NE-IP_ KHS 0.611
~ -~~~ ~ Q. AA-E-IP _JNCil 0.67
::::;ai AA-E· IP .,.MUN O.IHI
(1) AA-E-IP _STL 0 .711
CD OR-8-LP _ PDC 0 .70
:J ~-8-LP _ KIIII!I 0 .61
- OR-8-LP KLR 0.63
~ OR-8-LP =NOU 0.158
C" OR-8-IP _ KRM 0 .80
"0 OR-8-IP _HLK 0 .715
0 OR-8-IP _CNC 0.58
"0 OR.C-IP _GNO 0 .77
£. OR.C-LP _BHM 0 .83
el 0111-S-IP J>NY 0 .44
0 • 0111-8-LP _VKB 0.69
:J OR-E-IP _MOA 0 .153
C/) TB-NE-LP .,.MEl 0.52
0 TB-N..SP_ BUH 0.81
.... TB-N.SP _ BUD 0.53
:J TB-N-IP _ SPT 0 .87
9: 0 .00 0 .10 0 .20 0 .30 0 .40 0 .50 0 .80 0 .70 0 .110 0 .80
Q) Frequencies (G Allele)

., a· c ~ ~
9' ., CD .0 c: <D :::J () (6" en a ~
(')
m CD" CD" a (/) z "1J (jJ (A)
~ ~ co 01 -· :::J a. i CD 3. U) c: tr ~ 0 ~ c: !!. ()" :::J U)
a :::J a. m·
., 0
"C c:: iii -s· ::I en
IE·S-IP _HPK j 0.00
IE-N~P_THR 0.27
IE·N~P_KNT 0.33
IE·NE~P _HJG ~0 • .,.
IE-N·SP _SYO 0.12
IE-N.SP _SHl 0.60
IE·N·SP _SUI 0.32
IE·N·SP _RAM 0.55
IE-N.SP .)'GL 0.33
IE·N·LP _I(HT 0.25
IE·N·LP _51'8 0.00
IE-N-LP _RJH
IE·N·L_RJU
I&N·LP_KOL
IE·N-LP .)(UP
IE-N-LP_KSP
IE-N·LP _KKII
IE·N-LP _JAT
IE-N-t..P_CMR
IE·W·LP _SID
IE.W-LP _PTD
IE-W-LP _PAL
IE-W·LP_KOB
IE·W-LP _DEB
IE·W~P_DBH
IE-W~P_BHL
IE·E-LP _OIUl
IE·NE-LP _NSD
IE~_MHA
IE·I!·LP_KWII
IE·E-LP_CIB
AA.C-IP_BAI
AA.C-IP_SHY
AA.C-IP_I<I<U
AA-NE-IP_I<HS
AA·W·IP _I<LS
AA.£-IP_JNG
AA.£-IP_MUN
AA.£-IP_STL
DR-8-t.P_PDC
DR-5-t.P _I<RB ~ L -:::: -DR-5-t.P _KLR ...... --:-:- :'0! ;!.:'..,, -- ~:;--._ -~---
DR-5-t.P _NDU
DR-5-IP_KRM '·i , .. . -~- . .•:·.·_.-;...-"-J·:--:.!1.·;- -· ........ ·~;_>r:! ..: -: :o .• '--. -~·,·~~'-···. -:
DR-5-IP_HLK ;::::: -~~~ I , I
DR-5-IP_CNC o'\~.Jii. I
DR.C-IP_GND - 'J- .··-•;::,. :.:'·-~·~~~-~ '-':.M I •
DR.C-t.P _BHM
DR-5-IP_PNY
DR-5-t.P _VKB
DR.£-IP_MDA
TB-NE-t.P _MEl
TB-N..SP _BUH
TB-N..SP _BUD
TB-N.JP_SPT
0.00 0.20 O.AO 0.60 0.80 1.00
Frequencies (C Allele)
; w ~ .. ! en
1.20

"T1 IE-$-IP_HPK 0 .91
=· IE-N-IP_THR 1.00
c IE-N-IP_KNT 0.94
c; IE-NE-IP _HJG 0 .98 .. IE-N..SP _SYD 0.00 .....
IE-N-SP _SHI 1.00
en . IE-N..SP _SUI 1 .00 , IE-N-SP _RAM 0 .99
; IE-N..SP _AGL 1 .00
.a IE-N-LP _KHT 0 .90
c::: IE-N-LP _SPB 0 .82 <D ~ IE-N-LP _R.IH 1.00
n IE-N-L_R.IU 0 .96
<D. IE-N-LP _KOL 0.98
C/) IE-N-LP _KUP 1.00
a IE-N-LP _KSP 0.70
ci IE-N-LP _KKB 0 .98
IE-N-LP _JAT 1 .00
Q) IE-N-LP _CMR 0 .92
~ IE-W-LP _SID 0.85
<D IE-W-LP _PTD 0.51
a IE-W-LP _PAL 0 .94
IE-W-LP _KOB 0 .53
en IE-W-LP _DEB 0.82
z l IE-W-IP _DBH 0 .87
-o , iii t: IE-W-IP BHL 0.84
(iJ g IE-E-LP =ORB 0.19 w
w g IE-NE-LP _NSD ... 0.07 i ....., Cll
~ IE-E-LP _MHA 1.00 • •
~ IE-E-LP _KWB 0.96
IE-E-LP _CIS 1 .00
00 AA..C-IP_BAI 0." 0)
AA..C-IP_SHY 0 .79
~ AA..C·IP _KKU 0.90
Q. AA-NE-IP _KHS 0.93
i AA-W-IP_KLS 0 .97
AA-E-IP _.lNG 0.83 .., AA-E-IP _JIIUN 0 .91 <D :J AA-E-IP _STL 1.00 - DR..S·LP _PDC 0.50
t/J DR-8-LP _KRB 0 .84 c::: C"
DR-8-LP _KLR 0.88
"C DR-8-LP _NDU 0 .49
0 DR-8-IP_KRM Fz;l 0.07
"C DR-8-IP _HLK 0 .48
c::: DR-8-IP _CNC 0.61
m DR..C-IP_GND 0 .48 - DR..C·LP _BHM cr 0 .84
~ DR·S·IP _PNY 1.00
t/J DR-8-LP _ VKB 0.90
a DR-E-IP_MDA 0.97
TB-NE-LP _MEl 0.91 ..... TB-N..SP _BUH ::::J
0.97
Q. TB-N-sP _suo 0.96
ar TB-N-IP_SPT 0 .98
0 .00 0 .20 0.40 0.50 0.50 1.00 1.20
Frequencies (C Allele)
., cS" c ; ~ ..... . "'T1
~ c: CD :::l n m· a ci Q)
CD CD a (J) z "'0
UJ w ~ ~ 00
""""' :::l Q.
~ Ci1 :::l -en c: C'" "0 0
"'0 c: el. ()" :::l en a 3" a. iii"
l c i ;;· :I en
IE·s-4P _HPK
IE·N-IP_THR
IE-N-IP _ KNT
IE·NE-IP _H.JG
IE·N-SP _SYD
IE-N·SP _SHI
IE-N-SP _SUI
IE-N-SP _ RAM
IE-N-SP _ AGL
IE-N-LP _KHT
IE-N-LP _SPB
IE·N·LP _R.JH
IE-N-L_R.JU
IE·N-LP _KOL
IE-N-LP _KUP
IE·N-LP _ KSP
IE-N-LP _KKB
IE·N-LP _.JAT
IE-N-LP _CMR
IE-W-LP _SID
IE-W-LP _ PTD
IE-W-LP _PAL
IE-W-LP _KOB
IE-W-LP .J)EB
IE-W-IP _DBH
IE-W-IP _BHL
IE·E·LP _ORB
IE-NE-LP _ NSD
IE·E-LP _ MHA
IE-E-LP _KWB
IE·E-LP _CIS
AA-C· IP _BAI
AA-C -IP _SHY
AA-C -IP _KKU
AA-NE-IP _KHS
AA·W-IP_KLS
AA-E -IP _ .lNG
AA-1!-IP _MUN
AA·E·IP _STL
DR·S-LP _ PDC
DR-8-LP J<RB
DR-8-LP _KLR
DR-8-LP _ NDU
DR-S-IP_ KRM
DR·S-IP_ HLK
DR-S-IP _CNC
DR-C-IP _GND
DR-C-LP _BHM
DR-8-IP_ PNY
DR-S-LP_VKB
DR·E-IP _MDA
TB-NE-LP _ MEl
TB-N-SP _ BUH
TB-N-SP _ BUD
TB-N-IP _SPT +-
0 .00
0.75
0 .75
0.85
0.110
o.ae 0.75
0.73
o.ae 0 .74
0.711
0.74
0.711
1.00
0.711
0.51
0.54
0 .114
0.76
0 .83
0.57
0 .73
0.85
o.ae 0.68
0 .86
0 .77
0.72
0.75
0 .81
0 .83
0.83
o.ao
0 .112
.. I
0 .117
0 .71
0 .73
0 .87
0 .71
0 .91
0 .70
0 .111
0 .113
0 .67
0 .75
0 .74
0 .57
0 .75
0 .72
0 .70
0 .78
0 .70
0 .811
0 .78
0 .83
0 .81
0 .20 0 .40 0 .80 0 .80 1 .00
Frequencies (C Allele)

rs3176388
AA-C-IP _BAI 1.00
AA-E-IP _JNG 0.64
DR-S-LP _Kl.R -~~-' - ·- - - - ., 0.72
DR-S-LP _NDU 0.78
DR-S-IP _KRM - - - ...... ; ~ • •• I ·-~ !"'..__ ' ,~· ' . ' . - 0.74
DR-C-IP _GND 0.95
TB-NE-LP _MB 0.91
TB-N-SP _BUD 0.84
TB-N-IP _SPT 0.93
IE-N-IP_ THR 0.86 tn I: IE-tE-IP _HJG 0
0.93 ... IE-N-SP_SH ~
0.86
::s IE-N-LP _RJH Q.
0.84
0 D..
IE-N-LP _KSP 0.91
IE-N-LP_CMR 0.93
IE-W-IP _SID 0.65
IE-W-LP _PTD 0.63
IE-W-LP _PAL 0.89
IE-W-LP _KOB 0.73
IE-W-LP _DEB o.n IE-E-LP _ORB 0.89
IE-NE-LP _NSD 0.80
IE-E-LP _KWB o.n IE-E-IP _CIB 0.88
0.00 0.20 0.40 0.60 0.80 1.00 1.20
Frequencies (C Allele)
Figure: 18. Frequencies of ·c· allele of SNP rs3176388 in different sub populations of India.

(rCRS)
C A T A C AAA G CCC A CCCC A T T C
PEO Patient Sequence
Figure 19: Chromatograms showing mutation at nucleotide position 5450 where, allele
'A' is replaced by 'G' in ND2 !;Jene of mtDNA. Revised Cambrid~e Reference Sequence
(rCRS) is used as a reference sequence for Progressive External Ophthalmoplegia (PEO)
pafleflt_
I

(rCRS)
A G CCC T C A G T G A G TT G C AA T A C T PEO Patient Sequence
Fi9ure 20: Chromatograms showin~ mutation at nucleotide position 5576 where, allele
'A' is replaced by 'G' in T arm of Tryptophane gene of mtDNA This alteration at
nucleotide position 5576 is highly conserved in animal kingdom, and first time reported by
us as novel mtDNA mutation in PEO patient of North Indian origin.

(rCRS)
TT C T G T AA C AA C T AA GG A C T G C AA
PEO Patient Sequence
Figure 21: Chromato~rams showin~ mutation at nucleotide position 5585 where, allele
'G' is replaced by 'A', in non coding region of mtDNA.
(rCRS)
T A C T C A TTTT CC T AA TT
PEO Patient Sequence
Fi9ure 22: Chromato~rams showin~ mutation at nucleotide position 12705 where, allele
'C' is replaced by 'T' in ND5 gene of mtDNA.

0-domain
Acceptor stem
1 A G A A A T T
G 73
T c T T T A A
TTCAT
T-domain
c···;AGT A A14 AT
A TTGG
(~ AGACCA c··· G 53
21 A G A G
Anticodon domain C c
TAA 46 c c c G
A 33 T A 37
TeA
35 Anticodon
'A' replaced by 'G' at nucleotide position 5576
Figure 23: Illustration of tRNA-Trp sequences along with a novel mutation at position
5576 at highly conserved region of mtDNA sequence, where allele 'A' is replaced with 'G'.
The location of mutation in T-stem of tRNA is also illustrated (circled nucleotide). The
typical number of nucleotide is enclosed in the loop of the tRNA-Trp.


