Results 2012 - SOLARIA · EPC Own projects development in new markets for further EPC and...
15
Leading the PV business © 2011 Solaria Energía y Medio Ambiente S.A. © 2011 Solaria Energía y Medio Ambiente S.A. 1 Results 2012
Transcript of Results 2012 - SOLARIA · EPC Own projects development in new markets for further EPC and...

Leading the PV business
© 2
01
1 S
ola
ria
Ener
gía
y M
edio
Am
bie
nte
S.A
.
© 2
01
1 S
ola
ria
Ener
gía
y M
edio
Am
bie
nte
S.A
.
1
Results 2012

Leading the PV business
© 2
01
1 S
ola
ria
Ener
gía
y M
edio
Am
bie
nte
S.A
.
© 2
01
1 S
ola
ria
Ener
gía
y M
edio
Am
bie
nte
S.A
.
2
Improvements in Operational Results
Improvements in Corporate Debt
Compliance with Strategic Plan 2012-2014
Executive Summary

Leading the PV business
© 2
01
1 S
ola
ria
Ener
gía
y M
edio
Am
bie
nte
S.A
.
© 2
01
1 S
ola
ria
Ener
gía
y M
edio
Am
bie
nte
S.A
.
3
Improvements in Operational Results
EBITDA
Gross Margin /Sales
Operating costs
Staff costs
6,5
67%
25,2
12,2
+126%
+361%
-77%
-36%
2012 mm€ (*) Var. 11-12
In a very complex market environment, the company has been able to improve the main business indicators.
(*) Consolidated Operative Data, not including extraordinary data.

Leading the PV business
© 2
01
1 S
ola
ria
Ener
gía
y M
edio
Am
bie
nte
S.A
.
© 2
01
1 S
ola
ria
Ener
gía
y M
edio
Am
bie
nte
S.A
.
• The company has made a significant
adjustment in their operating costs
starting up a productivity and
efficiency plan, using synergies
between the different business areas.
Very important reduction of the fixed
costs turning them into variable costs,
making them flexible to the demand
fluctuations.
4
Improvements in Operational Results
Year 2011 Year 2012
109
25
Operating costs (mm€) (*)
-77%
(*) Consolidated Operative Data, not including extraordinary data.

Leading the PV business
© 2
01
1 S
ola
ria
Ener
gía
y M
edio
Am
bie
nte
S.A
.
© 2
01
1 S
ola
ria
Ener
gía
y M
edio
Am
bie
nte
S.A
.
5
Improvements in Operational Results
Organizational restructuring:
• Business areas rightsizing according to
current individual profitabilities.
• Fixed costs reduction by outsourcing
tasks without added value.
• General salaries restraint seeking a
higher competitiveness for each
business area.
Year 2011 Year 2012
19
12
Staff costs (mm€)
-36%

Leading the PV business
© 2
01
1 S
ola
ria
Ener
gía
y M
edio
Am
bie
nte
S.A
.
© 2
01
1 S
ola
ria
Ener
gía
y M
edio
Am
bie
nte
S.A
.
6
Improvements in Corporate Debt
-23%
Year 2011 Year 2012
48
37
Corporate debt.(mm€) Debt ratios improvement:
• Compliance with payment plans,
according to established budget.
• Early debt payment execution with
advantageous agreements.

Leading the PV business
© 2
01
1 S
ola
ria
Ener
gía
y M
edio
Am
bie
nte
S.A
.
© 2
01
1 S
ola
ria
Ener
gía
y M
edio
Am
bie
nte
S.A
.
7
Compliance with Strategic Plan
Focus on activities with higher added value
New markets opening
Generation assets divestment in Europe
Value chain development projects Lower manufacturing weight
LATAM and Caribbean Middle East South Africa
Strategic Plan financing
The photovoltaic industry is facing a business model change that forces to a strategy redefinition.

Leading the PV business
© 2
01
1 S
ola
ria
Ener
gía
y M
edio
Am
bie
nte
S.A
.
© 2
01
1 S
ola
ria
Ener
gía
y M
edio
Am
bie
nte
S.A
.
8
New Market Enviroment
Markets
Competitiveness
• The economic environment hampers
the bonus and subsidies continuity .
• Continuous cost reductions and
product efficiency improvement make
photovoltaic solar technology a valid
alternative not only to other
renewable sources, but also to
conventional technologies.
Environmental
analysis
Size
Customers
The market is focused on two big areas:
• Big on-grid PV plants with tight costs
structure and energy sales through PPA
scheme or free market
• Solar Net metering, with small
installations close to the end consumer .
• PV is now a real possibility of energy
generation and investment for traditional
electric utility companies.
• Further developments will be in those
markets where there is a growing
energy demand, not only in those
where there are direct subsidies.

Leading the PV business
© 2
01
1 S
ola
ria
Ener
gía
y M
edio
Am
bie
nte
S.A
.
© 2
01
1 S
ola
ria
Ener
gía
y M
edio
Am
bie
nte
S.A
.
9
Added Value Activities
Engineering
&
Consulting
Own
Developments
Power Generation and O&M
EPC
Own projects development in new markets for further
EPC and investment or third-party sale.
New activities in Engineering and Consulting to markets
with strong knowledge demand, without the need to
participate in other areas.
Own projects development and participation as partners
in Power Generation in different projects developed
for third parties
EPC capabilities development taking advantage of the experience achieved in
Europe during the past years.
Focus on activities with higher added value

Leading the PV business
© 2
01
1 S
ola
ria
Ener
gía
y M
edio
Am
bie
nte
S.A
.
© 2
01
1 S
ola
ria
Ener
gía
y M
edio
Am
bie
nte
S.A
.
Southamerica:
• Joint Venture with Fairway as local partner in Brazil.
• 3MW PV plant under construction with CEMIG as 50% partner.
• Developing opportunities based on Net-metering recent regulation.
• EPC development in Ecuador.
Mexico and the Caribbean
• More than 100 MW under development in Mexico.
• Developing EPC and Power Generation opportunittes with local electric utilities .
Europe: • Local sales offices in Germany and Italy with local projects development. • Pipeline and EPC development in United Kingdom (50 MW). • 250 MW pipeline in Spain, pool oriented. Starting also PPA opportunities. • Non-strategic generation assets divestment .
Saudí Arabia and UAE: • Joint Venture with
AB Group as local partner for development in manufacturing, EPC, and power generation investments under KACARE program.
Turkey: • Active search for
local partner
10
Opening up new markets
Opening up new markets with leading local partners support (AB Group, CEMIG...) and strategy according to their needs (modules, EPC, engineering...)
Southafrica: • Engineering and
consulting development.

Leading the PV business
© 2
01
1 S
ola
ria
Ener
gía
y M
edio
Am
bie
nte
S.A
.
© 2
01
1 S
ola
ria
Ener
gía
y M
edio
Am
bie
nte
S.A
.
11
New markets - Brazil
Solaria has consolidated with success its presence in Brazil during 2012
• Participation in over 30 tenders with leading enterprises and institutions:
Licitación MW Licitación MW
CPqD - CEMIG - Smart City (MG) 0,02 Aeropuerto Confins (MG) 0,00
ENERGY TEAM (TO) 23,30 Estado Pernambuco (PE) 3,00
GEL - EPP (BA) 1,00 Estado Pernambuco (PE) 8,00
GEL - EPP (RJ) 0,05 Estado Pernambuco (PE) 30,00
GEL - EPP (AM) 1,00 Puerto Seco (GO) 0,00
COPEL (PR) 2,00 CELG (GO) 1,00
ANAUGER (SP) 0,06 CEL Engenharia (GO) 0,05
BLUE SOL (SP) 0,06 UFG - Universidad Federal (GO) 0,40
SUNCOMEX (GO) 0,06 ISLA FERNANDO NORONHA (BA) 0,40
Estadio ARENA AMAZONICA (AM) 6,00 TRACTEBEL (SC) 3,00
Estadio ARENA PANTANAL (MT) 1,20 CONCEITO (RO) 1,00
Estadio BEIRA RIO (RS) 0,00 CEI - FURNAS (MG) 2,40
Estadio ITAQUERAO (SP) 0,00 EFFICIENTIA - CLIENTE TIM (MG) 1,00
Estadio ARENA FONTE NOVA (BA) 0,00 ENEL 5,00
Estadio ARENA DAS DUNAS (RN) 0,00 CPFL 5,00
Estadio CASTELAO (CE) 0,00 NEOENERGIA-IBERDROLA (RJ) 5,00
Estadio MANE GARRINCHA (DF) 2,50 CHESF (MA) 3,00
Estadio MINEIRINHO (MG) 1,10
Offices located in São Paulo, with local projects development
3 MW Plant under construction in Sete Lagoas
(50% CEMIG)

Leading the PV business
© 2
01
1 S
ola
ria
Ener
gía
y M
edio
Am
bie
nte
S.A
.
© 2
01
1 S
ola
ria
Ener
gía
y M
edio
Am
bie
nte
S.A
.
12
New Business Model in Spain
Solaria moves forward in a utility scale project development (253 MW). Energy will be delivered under Pool and Power Purchase Agreement (PPA) with customers schemes.
Power 253 MW
Substation 250 MVA - 220 kV
Structure Fixed
Equivalent hours 1.530 kWh/kWp
• Lands available.
• Projects in PLA phase.
• Under negotiations with customers
for direct sales via PPA.
Leading the PV business
© 2
01
1 S
ola
ria
Ener
gía
y M
edio
Am
bie
nte
S.A
.
© 2
01
1 S
ola
ria
Ener
gía
y M
edio
Am
bie
nte
S.A
.
13
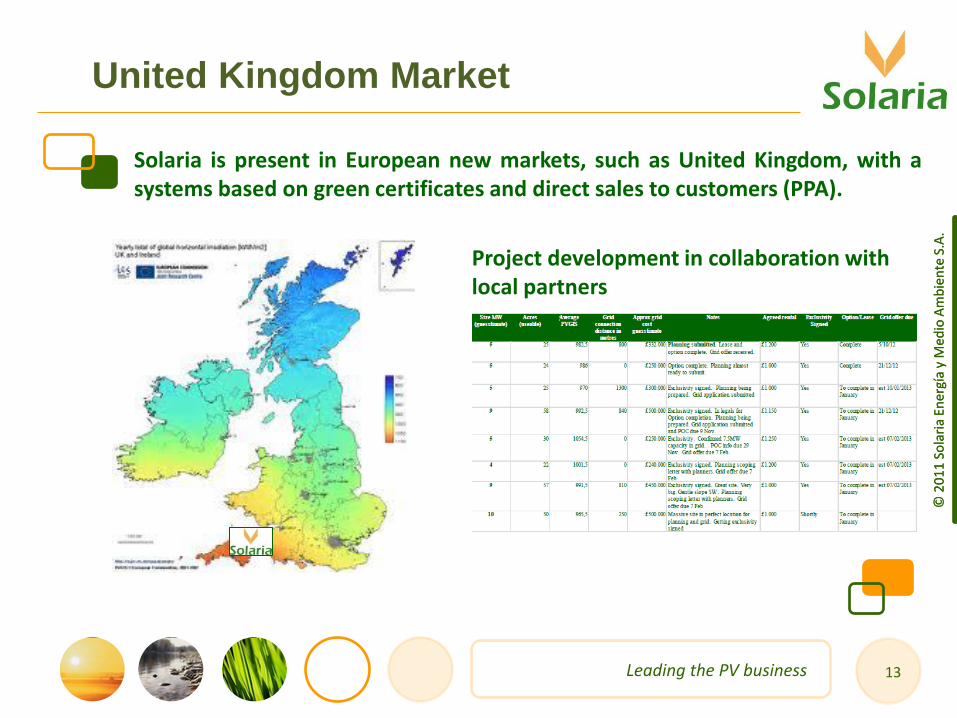
United Kingdom Market
Solaria is present in European new markets, such as United Kingdom, with a systems based on green certificates and direct sales to customers (PPA).
Project development in collaboration with local partners

Leading the PV business
© 2
01
1 S
ola
ria
Ener
gía
y M
edio
Am
bie
nte
S.A
.
© 2
01
1 S
ola
ria
Ener
gía
y M
edio
Am
bie
nte
S.A
.
14
Divestment of European Generation Assets
Spain 34,8 MWp
Czech Republic7 MWp
Greece 0.4 MWp
Italy28,8 MWp
• Divestment process, expected to be completed throughout 2013.
• Currently under negotiation with
some investors, interested in several assets.
• Expected incomes for financing
international expansion plans.
71 MW Power Generation Portfolio

C/ Princesa, 2 - 3ªplanta
28008 Madrid (Spain)
Headquarters
Puertollano Production Plant
Fuenmayor Production Plant
C/ Alemania 6 Pol. Industrial La Nava II.
13500 Puertollano, Ciudad Real (Spain)
Ctra. Nacional 232 - Km. 424,400
26360 - Fuenmayor , La Rioja (Spain)
www.solariaenergia.com
© 2
01
1 S
ola
ria
Ener
gía
y M
edio
Am
bie
nte
S.A
.