RESULT UPDATE COLGATE PALMOLIVE - …static-news.moneycontrol.com/.../COLGATE_PALMOLIVE... ·...
17
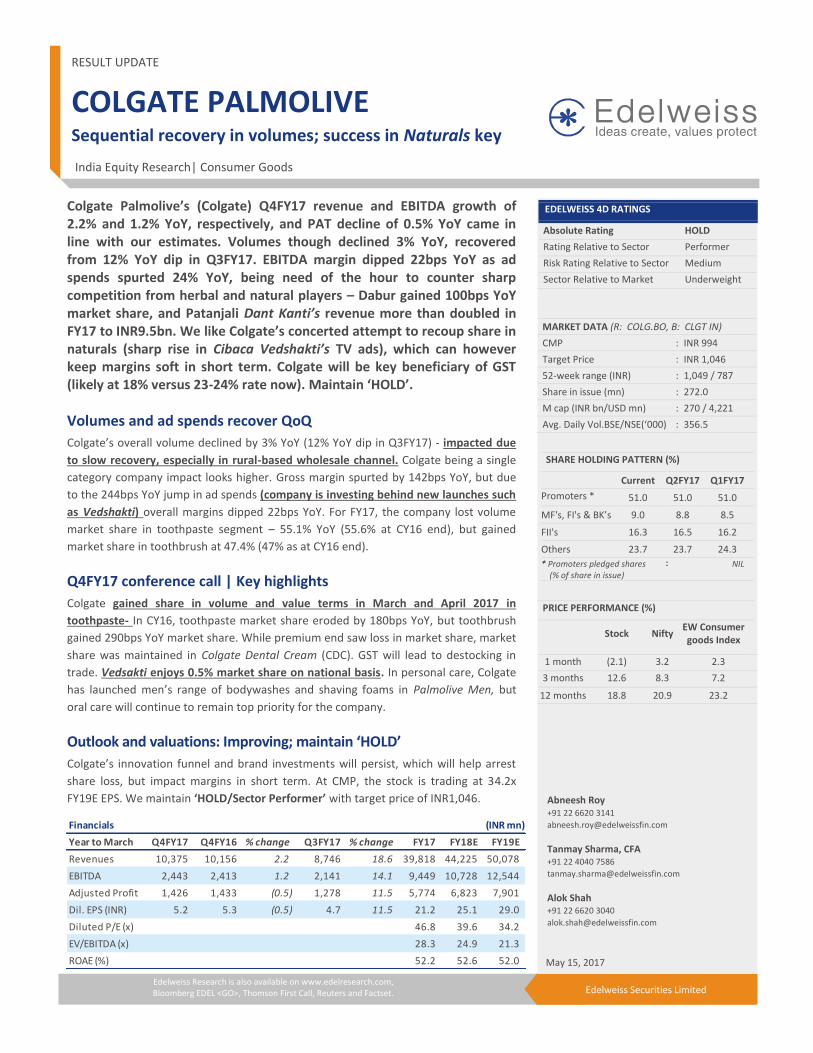
Edelweiss Research is also available on www.edelresearch.com, Bloomberg EDEL <GO>, Thomson First Call, Reuters and Factset. Edelweiss Securities Limited Colgate Palmolive’s (Colgate) Q4FY17 revenue and EBITDA growth of 2.2% and 1.2% YoY, respectively, and PAT decline of 0.5% YoY came in line with our estimates. Volumes though declined 3% YoY, recovered from 12% YoY dip in Q3FY17. EBITDA margin dipped 22bps YoY as ad spends spurted 24% YoY, being need of the hour to counter sharp competition from herbal and natural players – Dabur gained 100bps YoY market share, and Patanjali Dant Kanti’s revenue more than doubled in FY17 to INR9.5bn. We like Colgate’s concerted attempt to recoup share in naturals (sharp rise in Cibaca Vedshakti’s TV ads), which can however keep margins soft in short term. Colgate will be key beneficiary of GST (likely at 18% versus 23-24% rate now). Maintain ‘HOLD’. Volumes and ad spends recover QoQ Colgate’s overall volume declined by 3% YoY (12% YoY dip in Q3FY17) - impacted due to slow recovery, especially in rural-based wholesale channel. Colgate being a single category company impact looks higher. Gross margin spurted by 142bps YoY, but due to the 244bps YoY jump in ad spends (company is investing behind new launches such as Vedshakti) overall margins dipped 22bps YoY. For FY17, the company lost volume market share in toothpaste segment – 55.1% YoY (55.6% at CY16 end), but gained market share in toothbrush at 47.4% (47% as at CY16 end). Q4FY17 conference call | Key highlights Colgate gained share in volume and value terms in March and April 2017 in toothpaste- In CY16, toothpaste market share eroded by 180bps YoY, but toothbrush gained 290bps YoY market share. While premium end saw loss in market share, market share was maintained in Colgate Dental Cream (CDC). GST will lead to destocking in trade. Vedsakti enjoys 0.5% market share on national basis . In personal care, Colgate has launched men’s range of bodywashes and shaving foams in Palmolive Men, but oral care will continue to remain top priority for the company. Outlook and valuations: Improving; maintain ‘HOLD’ Colgate’s innovation funnel and brand investments will persist, which will help arrest share loss, but impact margins in short term. At CMP, the stock is trading at 34.2x FY19E EPS. We maintain ‘HOLD/Sector Performer’ with target price of INR1,046. RESULT UPDATE COLGATE PALMOLIVE Sequential recovery in volumes; success in Naturals key EDELWEISS 4D RATINGS Absolute Rating HOLD Rating Relative to Sector Performer Risk Rating Relative to Sector Medium Sector Relative to Market Underweight MARKET DATA (R: COLG.BO, B: CLGT IN) CMP : INR 994 Target Price : INR 1,046 52-week range (INR) : 1,049 / 787 Share in issue (mn) : 272.0 M cap (INR bn/USD mn) : 270 / 4,221 Avg. Daily Vol.BSE/NSE(‘000) : 356.5 SHARE HOLDING PATTERN (%) Current Q2FY17 Q1FY17 Promoters * 51.0 51.0 51.0 MF's, FI's & BK’s 9.0 8.8 8.5 FII's 16.3 16.5 16.2 Others 23.7 23.7 24.3 * Promoters pledged shares (% of share in issue) : NIL PRICE PERFORMANCE (%) Stock Nifty EW Consumer goods Index 1 month (2.1) 3.2 2.3 3 months 12.6 8.3 7.2 12 months 18.8 20.9 23.2 Abneesh Roy +91 22 6620 3141 [email protected] Tanmay Sharma, CFA +91 22 4040 7586 [email protected] Alok Shah +91 22 6620 3040 [email protected] India Equity Research| Consumer Goods May 15, 2017 Financials (INR mn) Year to March Q4FY17 Q4FY16 % change Q3FY17 % change FY17 FY18E FY19E Revenues 10,375 10,156 2.2 8,746 18.6 39,818 44,225 50,078 EBITDA 2,443 2,413 1.2 2,141 14.1 9,449 10,728 12,544 Adjusted Profit 1,426 1,433 (0.5) 1,278 11.5 5,774 6,823 7,901 Dil. EPS (INR) 5.2 5.3 (0.5) 4.7 11.5 21.2 25.1 29.0 Diluted P/E (x) 46.8 39.6 34.2 EV/EBITDA (x) 28.3 24.9 21.3 ROAE (%) 52.2 52.6 52.0
Transcript of RESULT UPDATE COLGATE PALMOLIVE - …static-news.moneycontrol.com/.../COLGATE_PALMOLIVE... ·...
Edelweiss Research is also available on www.edelresearch.com, Bloomberg EDEL <GO>, Thomson First Call, Reuters and Factset.
Edelweiss Securities Limited
Colgate Palmolive’s (Colgate) Q4FY17 revenue and EBITDA growth of 2.2% and 1.2% YoY, respectively, and PAT decline of 0.5% YoY came in line with our estimates. Volumes though declined 3% YoY, recovered from 12% YoY dip in Q3FY17. EBITDA margin dipped 22bps YoY as ad spends spurted 24% YoY, being need of the hour to counter sharp competition from herbal and natural players – Dabur gained 100bps YoY market share, and Patanjali Dant Kanti’s revenue more than doubled in FY17 to INR9.5bn. We like Colgate’s concerted attempt to recoup share in naturals (sharp rise in Cibaca Vedshakti’s TV ads), which can however keep margins soft in short term. Colgate will be key beneficiary of GST (likely at 18% versus 23-24% rate now). Maintain ‘HOLD’.
Volumes and ad spends recover QoQ
Colgate’s overall volume declined by 3% YoY (12% YoY dip in Q3FY17) - impacted due
to slow recovery, especially in rural-based wholesale channel. Colgate being a single
category company impact looks higher. Gross margin spurted by 142bps YoY, but due
to the 244bps YoY jump in ad spends (company is investing behind new launches such
as Vedshakti) overall margins dipped 22bps YoY. For FY17, the company lost volume
market share in toothpaste segment – 55.1% YoY (55.6% at CY16 end), but gained
market share in toothbrush at 47.4% (47% as at CY16 end).
Q4FY17 conference call | Key highlights
Colgate gained share in volume and value terms in March and April 2017 in
toothpaste- In CY16, toothpaste market share eroded by 180bps YoY, but toothbrush
gained 290bps YoY market share. While premium end saw loss in market share, market
share was maintained in Colgate Dental Cream (CDC). GST will lead to destocking in
trade. Vedsakti enjoys 0.5% market share on national basis. In personal care, Colgate
has launched men’s range of bodywashes and shaving foams in Palmolive Men, but
oral care will continue to remain top priority for the company.
Outlook and valuations: Improving; maintain ‘HOLD’
Colgate’s innovation funnel and brand investments will persist, which will help arrest
share loss, but impact margins in short term. At CMP, the stock is trading at 34.2x
FY19E EPS. We maintain ‘HOLD/Sector Performer’ with target price of INR1,046.
RESULT UPDATE
COLGATE PALMOLIVE
Sequential recovery in volumes; success in Naturals key
COMPANYNAME
EDELWEISS 4D RATINGS
Absolute Rating HOLD
Rating Relative to Sector Performer
Risk Rating Relative to Sector Medium
Sector Relative to Market Underweight
MARKET DATA (R: COLG.BO, B: CLGT IN)
CMP : INR 994
Target Price : INR 1,046
52-week range (INR) : 1,049 / 787
Share in issue (mn) : 272.0
M cap (INR bn/USD mn) : 270 / 4,221
Avg. Daily Vol.BSE/NSE(‘000) : 356.5
SHARE HOLDING PATTERN (%)
Current Q2FY17 Q1FY17
Promoters *
51.0 51.0 51.0
MF's, FI's & BK’s 9.0 8.8 8.5
FII's 16.3 16.5 16.2
Others 23.7 23.7 24.3
* Promoters pledged shares (% of share in issue)
: NIL
PRICE PERFORMANCE (%)
Stock Nifty
EW Consumer goods Index
1 month (2.1) 3.2 2.3
3 months 12.6 8.3 7.2
12 months 18.8 20.9 23.2
Abneesh Roy +91 22 6620 3141
Tanmay Sharma, CFA +91 22 4040 7586
Alok Shah +91 22 6620 3040
India Equity Research| Consumer Goods
May 15, 2017
Financials (INR mn)
Year to March Q4FY17 Q4FY16 % change Q3FY17 % change FY17 FY18E FY19E
Revenues 10,375 10,156 2.2 8,746 18.6 39,818 44,225 50,078
EBITDA 2,443 2,413 1.2 2,141 14.1 9,449 10,728 12,544
Adjusted Profit 1,426 1,433 (0.5) 1,278 11.5 5,774 6,823 7,901
Dil. EPS (INR) 5.2 5.3 (0.5) 4.7 11.5 21.2 25.1 29.0
Diluted P/E (x) 46.8 39.6 34.2
EV/EBITDA (x) 28.3 24.9 21.3
ROAE (%) 52.2 52.6 52.0
Consumer Goods
2 Edelweiss Securities Limited
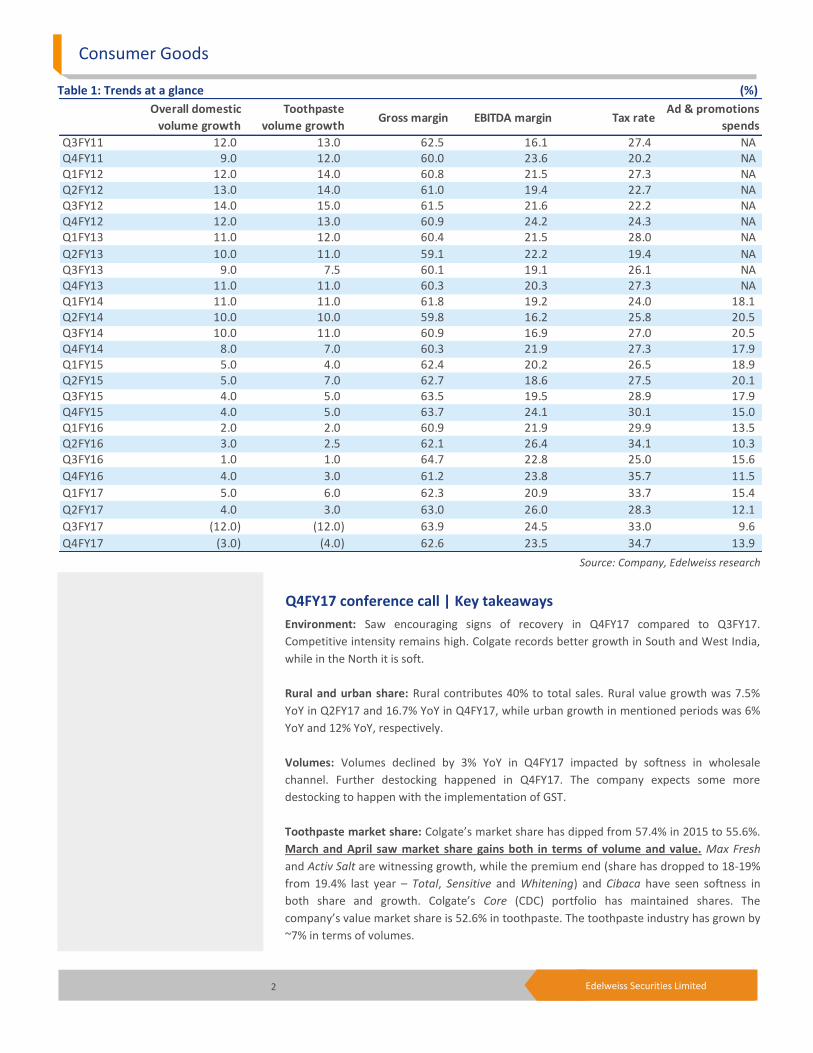
Table 1: Trends at a glance (%)
Source: Company, Edelweiss research
Q4FY17 conference call | Key takeaways
Environment: Saw encouraging signs of recovery in Q4FY17 compared to Q3FY17.
Competitive intensity remains high. Colgate records better growth in South and West India,
while in the North it is soft.
Rural and urban share: Rural contributes 40% to total sales. Rural value growth was 7.5%
YoY in Q2FY17 and 16.7% YoY in Q4FY17, while urban growth in mentioned periods was 6%
YoY and 12% YoY, respectively.
Volumes: Volumes declined by 3% YoY in Q4FY17 impacted by softness in wholesale
channel. Further destocking happened in Q4FY17. The company expects some more
destocking to happen with the implementation of GST.
Toothpaste market share: Colgate’s market share has dipped from 57.4% in 2015 to 55.6%.
March and April saw market share gains both in terms of volume and value. Max Fresh
and Activ Salt are witnessing growth, while the premium end (share has dropped to 18-19%
from 19.4% last year – Total, Sensitive and Whitening) and Cibaca have seen softness in
both share and growth. Colgate’s Core (CDC) portfolio has maintained shares. The
company’s value market share is 52.6% in toothpaste. The toothpaste industry has grown by
~7% in terms of volumes.
Overall domestic
volume growth
Toothpaste
volume growthGross margin EBITDA margin Tax rate
Ad & promotions
spends
Q3FY11 12.0 13.0 62.5 16.1 27.4 NAQ4FY11 9.0 12.0 60.0 23.6 20.2 NAQ1FY12 12.0 14.0 60.8 21.5 27.3 NAQ2FY12 13.0 14.0 61.0 19.4 22.7 NAQ3FY12 14.0 15.0 61.5 21.6 22.2 NAQ4FY12 12.0 13.0 60.9 24.2 24.3 NAQ1FY13 11.0 12.0 60.4 21.5 28.0 NA
Q2FY13 10.0 11.0 59.1 22.2 19.4 NAQ3FY13 9.0 7.5 60.1 19.1 26.1 NAQ4FY13 11.0 11.0 60.3 20.3 27.3 NAQ1FY14 11.0 11.0 61.8 19.2 24.0 18.1 Q2FY14 10.0 10.0 59.8 16.2 25.8 20.5 Q3FY14 10.0 11.0 60.9 16.9 27.0 20.5 Q4FY14 8.0 7.0 60.3 21.9 27.3 17.9 Q1FY15 5.0 4.0 62.4 20.2 26.5 18.9 Q2FY15 5.0 7.0 62.7 18.6 27.5 20.1 Q3FY15 4.0 5.0 63.5 19.5 28.9 17.9 Q4FY15 4.0 5.0 63.7 24.1 30.1 15.0 Q1FY16 2.0 2.0 60.9 21.9 29.9 13.5 Q2FY16 3.0 2.5 62.1 26.4 34.1 10.3 Q3FY16 1.0 1.0 64.7 22.8 25.0 15.6
Q4FY16 4.0 3.0 61.2 23.8 35.7 11.5
Q1FY17 5.0 6.0 62.3 20.9 33.7 15.4
Q2FY17 4.0 3.0 63.0 26.0 28.3 12.1
Q3FY17 (12.0) (12.0) 63.9 24.5 33.0 9.6
Q4FY17 (3.0) (4.0) 62.6 23.5 34.7 13.9

Colgate
3 Edelweiss Securities Limited
Naturals: Cibaca Vedshakti is not the lone offering in the herbal segment – the company
also has Activ Salt and its herbal range. Till now, Cibaca Vedshakti had been doing well for
the company and logged share gains in certain regions of launch. Cibaca Vedshakti enjoys
market share of 0.5-0.6% on national basis, while in the states where the company has
launched the product it is upwards of 1% (North and East India). Colgate significantly
increased its investment in Cibaca Vedshakti and gained share. The company will be carrying
out more innovations and have new launches in this segment. The natural segment is there
to stay in the market.
Colgate Dental Cream (CDC): The company has not lost share in CDC. Hence, it has been
taking price hikes in this brand.
Toothbrush market share: Colgate’s market share has increased from 44.4% in 2015 to
47.3% currently.
Personal care: A Men’s range of bodywashes and shaving foams in Palmolive Men has been
launched. Targeting modern trade, the chemist channel and e-commerce in personal care
are witnessing strong growth; not taken beyond these channels for the time being. Oral care
will remain top priority for the company.
Distribution: Total reach of 5.8mn outlets. Total number of vans in rural areas has increased
to 1,014 in 2016 from 340 in 2012. Colgate is trying to improve effective coverage by 10-
15% every year. Rural vans number has dropped YoY because of better effectiveness.
Penetration: In urban areas penetration of 92.3% and 74.1% in rural areas. Still 250mn
consumers do not use toothpaste in India. Per capita consumption of toothpaste in India is
158gms (in China it is 212gms while in Brazil it is 603gms). The company is running its ‘Brush
twice a day’ campaign in Tamil Nadu and Kerala to drive toothpaste consumption.
GST: GST will lead to some challenges in the short term. Colgate is at advanced stages of
preparation. However, expects challenges while transitioning to the GST environment,
including impact on trade pipeline inventory. Colgate is taking all necessary steps to
minimise business disruption during the transition.
Innovation: Innovations will pick up more momentum in FY18. Innovations done in FY17
were Colgate Cibaca Vedhsakti, Colgate Sensitive Clove, Colgate Maxfresh Power Freeze,
Colgate A1 Toothbrush, Colgate Star Toothbrush, Colgate Slim Soft Advanced Toothbrush,
Plax Spicy Fresh, Palmolive Body Wash Men’s Range, Palmolive Men’s Shaving Foams.
Launched sachets in pain management with Pain Out, but it remains in the chemist
channel.
Pricing and margins: Core segment of LUP remains at INR10, other segments saw 3-5% price
increase in LUP. Colgate is not concerned about margin pressure due to increasing salience
of Vedsakti. Gross margin improvement was helped by price hikes taken by the company. It
is focusing on taking 3-5% price increase per annum.
Promotions: Promotion intensity in the market remains high and expected to further
increase. Colgate is focusing on brand building and hence spending more on media than on
promotions.
Consumer Goods
4 Edelweiss Securities Limited
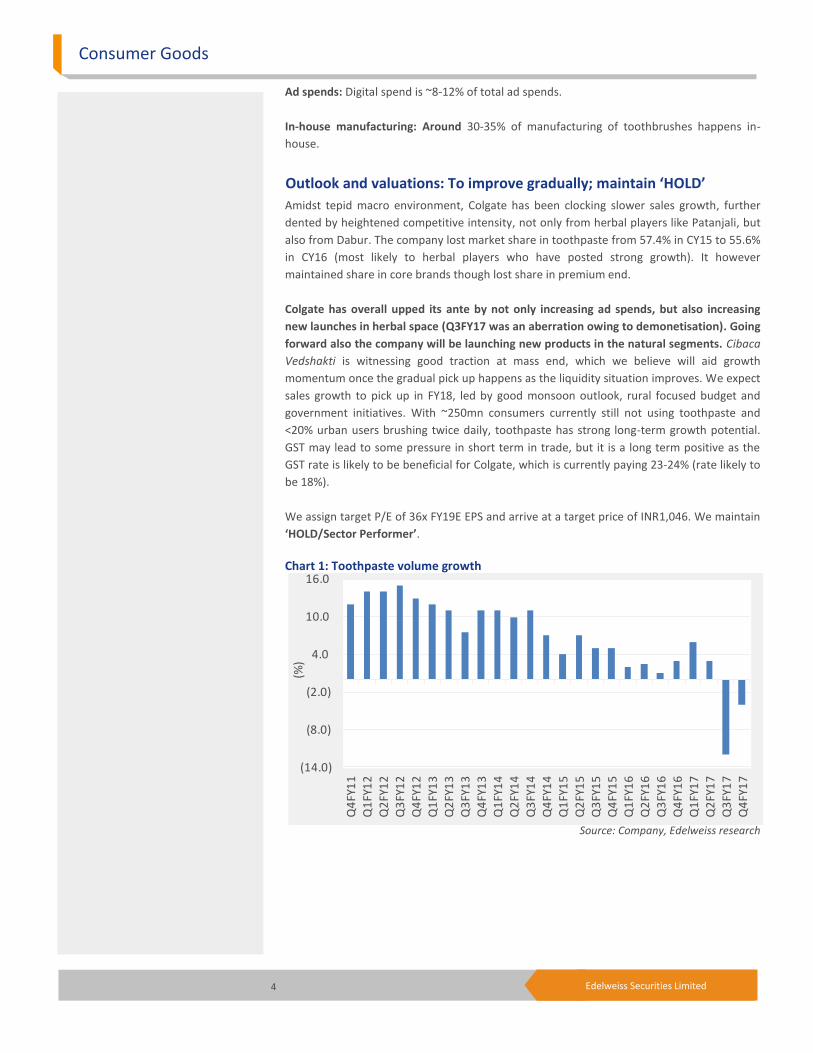
Ad spends: Digital spend is ~8-12% of total ad spends.
In-house manufacturing: Around 30-35% of manufacturing of toothbrushes happens in-
house.
Outlook and valuations: To improve gradually; maintain ‘HOLD’
Amidst tepid macro environment, Colgate has been clocking slower sales growth, further
dented by heightened competitive intensity, not only from herbal players like Patanjali, but
also from Dabur. The company lost market share in toothpaste from 57.4% in CY15 to 55.6%
in CY16 (most likely to herbal players who have posted strong growth). It however
maintained share in core brands though lost share in premium end.
Colgate has overall upped its ante by not only increasing ad spends, but also increasing
new launches in herbal space (Q3FY17 was an aberration owing to demonetisation). Going
forward also the company will be launching new products in the natural segments. Cibaca
Vedshakti is witnessing good traction at mass end, which we believe will aid growth
momentum once the gradual pick up happens as the liquidity situation improves. We expect
sales growth to pick up in FY18, led by good monsoon outlook, rural focused budget and
government initiatives. With ~250mn consumers currently still not using toothpaste and
<20% urban users brushing twice daily, toothpaste has strong long-term growth potential.
GST may lead to some pressure in short term in trade, but it is a long term positive as the
GST rate is likely to be beneficial for Colgate, which is currently paying 23-24% (rate likely to
be 18%).
We assign target P/E of 36x FY19E EPS and arrive at a target price of INR1,046. We maintain
‘HOLD/Sector Performer’. Chart 1: Toothpaste volume growth
Source: Company, Edelweiss research
(14.0)
(8.0)
(2.0)
4.0
10.0
16.0
Q4
FY1
1
Q1
FY1
2
Q2
FY1
2
Q3
FY1
2
Q4
FY1
2
Q1
FY1
3
Q2
FY1
3
Q3
FY1
3
Q4
FY1
3
Q1
FY1
4
Q2
FY1
4
Q3
FY1
4
Q4
FY1
4
Q1
FY1
5
Q2
FY1
5
Q3
FY1
5
Q4
FY1
5
Q1
FY1
6
Q2
FY1
6
Q3
FY1
6
Q4
FY1
6
Q1
FY1
7
Q2
FY1
7
Q3
FY1
7
Q4
FY1
7
(%)

Colgate
5 Edelweiss Securities Limited
Chart 2: Gross margin
Chart 3: EBITDA margin
Chart 4: Tax rate
Source: Company, Edelweiss research
45.0
50.0
55.0
60.0
65.0
70.0
Q4
FY1
1Q
1FY
12
Q2
FY1
2Q
3FY
12
Q4
FY1
2Q
1FY
13
Q2
FY1
3Q
3FY
13
Q4
FY1
3Q
1FY
14
Q2
FY1
4Q
3FY
14
Q4
FY1
4Q
1FY
15
Q2
FY1
5Q
3FY
15
Q4
FY1
5Q
1FY
16
Q2
FY1
6Q
3FY
16
Q4
FY1
6Q
1FY
17
Q2
FY1
7Q
3FY
17
Q4
FY1
7
(%)
10.0
14.0
18.0
22.0
26.0
30.0
Q4
FY1
1
Q1
FY1
2
Q2
FY1
2
Q3
FY1
2
Q4
FY1
2
Q1
FY1
3
Q2
FY1
3
Q3
FY1
3
Q4
FY1
3
Q1
FY1
4
Q2
FY1
4
Q3
FY1
4
Q4
FY1
4
Q1
FY1
5
Q2
FY1
5
Q3
FY1
5
Q4
FY1
5
Q1
FY1
6
Q2
FY1
6
Q3
FY1
6
Q4
FY1
6
Q1
FY1
7
Q2
FY1
7
Q3
FY1
7
Q4
FY1
7
(%)
0.0
8.0
16.0
24.0
32.0
40.0
Q4
FY1
1
Q1
FY1
2
Q2
FY1
2
Q3
FY1
2
Q4
FY1
2
Q1
FY1
3
Q2
FY1
3
Q3
FY1
3
Q4
FY1
3
Q1
FY1
4
Q2
FY1
4
Q3
FY1
4
Q4
FY1
4
Q1
FY1
5
Q2
FY1
5
Q3
FY1
5
Q4
FY1
5
Q1
FY1
6
Q2
FY1
6
Q3
FY1
6
Q4
FY1
6
Q1
FY1
7
Q2
FY1
7
Q3
FY1
7
Q4
FY1
7
(%)

Consumer Goods
6 Edelweiss Securities Limited
Chart 5: Per capita consumption of toothpaste low in India
Chart 6: Average selling price in USD per kg of toothpaste
Chart 7: Average selling price in USD per toothbrush
Source: Company, Edelweiss research
0
150
300
450
600
750
India China Phillipines USA Brazil
(Gra
ms/
year
)
Toothpaste per capita consumption 2016 (gms/1000)
3x
2.2x
1.8x
1x
0
4
8
12
16
20
USA Brazil China India
(Ave
rage
se
lling
pri
ce in
USD
pe
r kg
of
too
thp
aste
)
13.5x
8.5x
3x
1x
0.0
0.6
1.2
1.8
2.4
3.0
USA Brazil China India
(Ave
rage
se
lling
pri
ce in
USD
pe
r to
oth
bru
sh)

Colgate
7 Edelweiss Securities Limited
Chart 8: One year forward PE band
Source: Company, Edelweiss research
350
530
710
890
1,070
1,250
May
-11
No
v-1
1
May
-12
No
v-1
2
May
-13
No
v-1
3
May
-14
No
v-1
4
May
-15
No
v-1
5
May
-16
No
v-1
6
May
-17
(IN
R)
25x
30x
35x
40x
45x
Consumer Goods
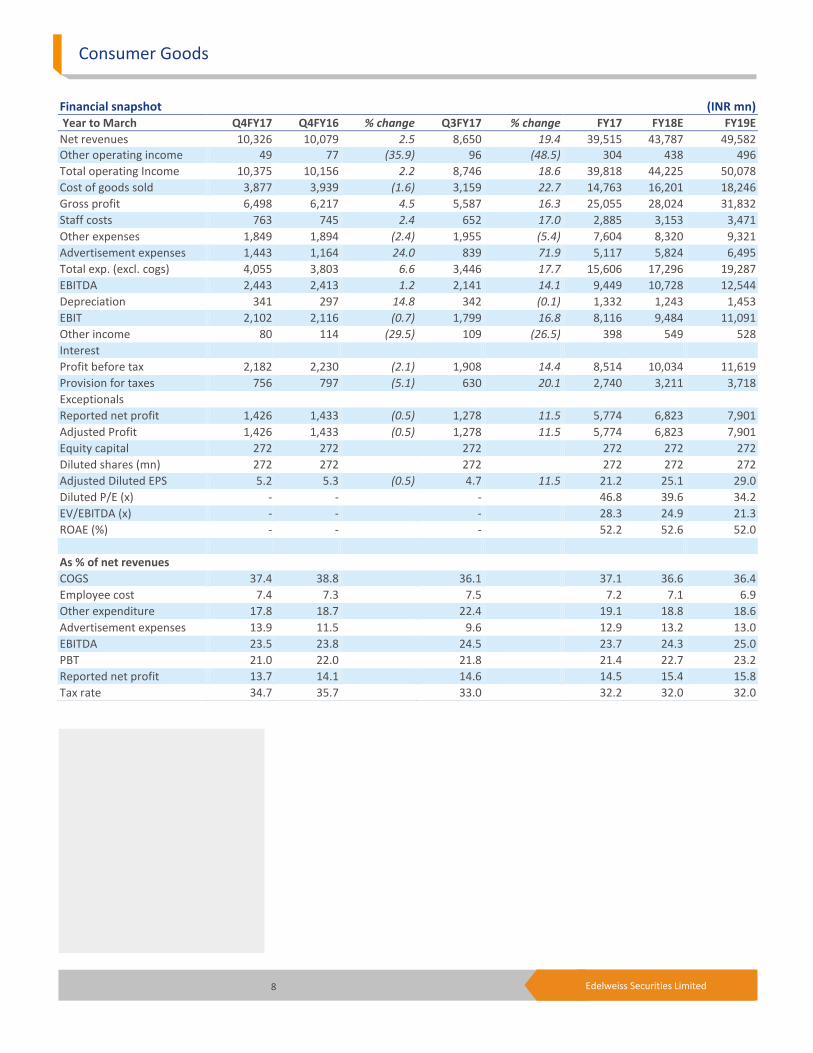
8 Edelweiss Securities Limited
Financial snapshot (INR mn) Year to March Q4FY17 Q4FY16 % change Q3FY17 % change FY17 FY18E FY19E
Net revenues 10,326 10,079 2.5 8,650 19.4 39,515 43,787 49,582 Other operating income 49 77 (35.9) 96 (48.5) 304 438 496
Total operating Income 10,375 10,156 2.2 8,746 18.6 39,818 44,225 50,078
Cost of goods sold 3,877 3,939 (1.6) 3,159 22.7 14,763 16,201 18,246
Gross profit 6,498 6,217 4.5 5,587 16.3 25,055 28,024 31,832
Staff costs 763 745 2.4 652 17.0 2,885 3,153 3,471
Other expenses 1,849 1,894 (2.4) 1,955 (5.4) 7,604 8,320 9,321
Advertisement expenses 1,443 1,164 24.0 839 71.9 5,117 5,824 6,495
Total exp. (excl. cogs) 4,055 3,803 6.6 3,446 17.7 15,606 17,296 19,287
EBITDA 2,443 2,413 1.2 2,141 14.1 9,449 10,728 12,544
Depreciation 341 297 14.8 342 (0.1) 1,332 1,243 1,453
EBIT 2,102 2,116 (0.7) 1,799 16.8 8,116 9,484 11,091
Other income 80 114 (29.5) 109 (26.5) 398 549 528
Interest
Profit before tax 2,182 2,230 (2.1) 1,908 14.4 8,514 10,034 11,619
Provision for taxes 756 797 (5.1) 630 20.1 2,740 3,211 3,718
Exceptionals
Reported net profit 1,426 1,433 (0.5) 1,278 11.5 5,774 6,823 7,901
Adjusted Profit 1,426 1,433 (0.5) 1,278 11.5 5,774 6,823 7,901
Equity capital 272 272 272 272 272 272
Diluted shares (mn) 272 272 272 272 272 272
Adjusted Diluted EPS 5.2 5.3 (0.5) 4.7 11.5 21.2 25.1 29.0
Diluted P/E (x) - - - 46.8 39.6 34.2
EV/EBITDA (x) - - - 28.3 24.9 21.3
ROAE (%) - - - 52.2 52.6 52.0
As % of net revenues
COGS 37.4 38.8 36.1 37.1 36.6 36.4
Employee cost 7.4 7.3 7.5 7.2 7.1 6.9
Other expenditure 17.8 18.7 22.4 19.1 18.8 18.6
Advertisement expenses 13.9 11.5 9.6 12.9 13.2 13.0
EBITDA 23.5 23.8 24.5 23.7 24.3 25.0
PBT 21.0 22.0 21.8 21.4 22.7 23.2
Reported net profit 13.7 14.1 14.6 14.5 15.4 15.8
Tax rate 34.7 35.7 33.0 32.2 32.0 32.0
Colgate
9 Edelweiss Securities Limited
Company Description
Colgate is India’s biggest oral care products company with ~ 97% of its sales coming from
this product category. The company has products across variants and price points in
toothpaste, white toothpowder and toothbrushes, and is the leader in each of these
categories. Investment Theme
The company is market leader in oral care category with 55.1% and 47.4% market share in
toothpaste and toothbrush category and enjoys strong brand equity, built over the years
through high investment on creating consumer awareness and brand recall. Volume growth
would also remain robust riding rise in both penetration and per capita consumption. Also,
new categories like sensitive toothpaste and mouthwash will further enhance growth and
premiumisation. However, higher competition will induce Colgate to increase its brand
spends, which could cap its margins.
Key Risks
Risks arise from down trading by consumers due to slowdown in rural wage growth and
reduced MSP crop prices.
Continued depreciation of the INR could increase cost of imported chemicals.
Increase in competitive intensity from new entrants.

10 Edelweiss Securities Limited
Consumer Goods
Financial Statements
Income statement (INR mn)
Year to March FY16 FY17 FY18E FY19E
Net revenue 38,381 39,515 43,787 49,582
Other Operating Income 301 304 438 496
Total operating income 38,682 39,818 44,225 50,078
Materials costs 14,763 14,763 16,201 18,246
Gross profit 23,919 25,055 28,024 31,832
Employee costs 2,624 2,885 3,153 3,471
Other Expenses 7,435 7,604 8,320 9,321
Ad. & sales costs 4,476 5,117 5,824 6,495
EBITDA 9,385 9,449 10,728 12,544
Depreciation 1,114 1,332 1,243 1,453
EBIT 8,271 8,116 9,484 11,091
Add: Other income 395.1 398.1 549.14 527.63
Add: Exceptional items (313) - - -
Profit Before Tax 8,353 8,514 10,034 11,619
Less: Provision for Tax 2,541 2,740 3,211 3,718
Reported Profit 5,812 5,774 6,823 7,901
Exceptional Items (313) - - -
Adjusted Profit 6,125 5,774 6,823 7,901
Shares o /s (mn) 272 272 272 272
Adjusted Basic EPS 22.5 21.2 25.1 29.0
Diluted shares o/s (mn) 272 272 272 272
Adjusted Diluted EPS 22.5 21.2 25.1 29.0
Adjusted Cash EPS 25.1 26.1 29.7 34.4
Dividend per share (DPS) 10.0 12.3 14.5 16.8
Dividend Payout Ratio(%) 56.3 69.8 69.8 69.8
Common size metrics
Year to March FY16 FY17 FY18E FY19E
Materials costs 38.2 37.1 36.6 36.4
Staff costs 6.8 7.2 7.1 6.9
Ad. & sales costs 11.6 12.9 13.2 13.0
Other expenses 19.2 19.1 18.8 18.6
EBITDA margins 24.3 23.7 24.3 25.0
EBIT margins 21.4 20.4 21.4 22.1
Net Profit margins 15.8 14.5 15.4 15.8
Growth ratios (%)
Year to March FY16 FY17 FY18E FY19E
Revenues 4.5 2.9 11.1 13.2
EBITDA 13.3 0.7 13.5 16.9
PBT 10.1 1.9 17.8 15.8
Adjusted Profit 8.7 (5.7) 18.2 15.8
EPS 8.7 (5.7) 18.2 15.8
Key Assumptions
Year to March FY16 FY17 FY18E FY19E
Macro
GDP(Y-o-Y %) 7.2 6.5 7.1 7.7
Inflation (Avg) 4.9 4.8 5.0 5.2
Repo rate (exit rate) 6.8 6.0 5.8 5.8
USD/INR (Avg) 65.0 67.5 69.0 69.0
Company
Volume growth 2.0 (2.0) 5.0 7.0
Pricing change 1.0 5.0 6.0 6.0
EBITDA margin assumpn
Chemicals 35.5 36.2 36.4 36.4
Tubes and Containers 19.4 21.9 21.9 21.9
Oils 8.4 12.0 13.0 13.0
Cartons 11.1 11.0 11.0 11.0
COGS as % of sales 38.2 37.1 36.6 36.4
Staff costs (% of rev) 6.5 7.3 7.2 7.0
A&P as % of sales 11.6 12.9 13.2 13.0
Financial assumptions
Tax rate (%) 29.3 32.2 32.0 32.0
EBITDA margin 24.3 23.7 24.3 25.0
Capex (INR mn) 2,944 3,416 3,500 3,500
Debtor days 7 9 9 9
Inventory days 67 72 70 70
Payable days 130 150 145 145
Cash conversion cycle (56) (69) (66) (66)
Dep. (% gross block) 7.8 7.7 6.0 6.0
Dividend payout 47.2 58.0 58.0 58.0
Yield on cash 12.4 11.5 16.0 16.0

11 Edelweiss Securities Limited
Colgate
Peer comparison valuation
Market cap Diluted P/E (X) EV / EBITDA (X) ROAE (%)
Name (USD mn) FY18E FY19E FY18E FY19E FY18E FY19E
Colgate 4,221 39.6 34.2 24.9 21.3 52.6 52.0
Dabur 7,573 33.5 28.6 28.7 24.1 27.5 27.7
Emami 3,883 51.0 38.6 27.1 22.4 28.5 32.1
GlaxoSmithKline Consumer Healthcare 3,481 31.4 28.1 21.5 19.1 24.2 23.8
Godrej Consumer 10,238 42.0 34.5 30.2 25.0 24.7 26.0
Hindustan Unilever 33,214 43.9 37.8 30.2 25.9 103.3 107.2
ITC 52,697 27.1 23.3 17.6 14.9 31.1 31.2
Marico 6,247 42.0 36.7 28.4 24.7 38.1 37.1
Median - 40.8 34.4 27.7 23.2 29.8 31.6
AVERAGE - 38.8 32.7 26.1 22.2 41.3 42.1
Source: Edelweiss research
Cash flow metrics
Year to March FY16 FY17 FY18E FY19E
Operating cash flow 6,729 7,695 8,128 9,628
Investing cash flow (2,366) (3,416) (3,500) (3,500)
Financing cash flow (3,758) (4,031) (4,763) (5,515)
Net cash Flow 605 248 (134) 613
Capex (2,944) (3,416) (3,500) (3,500)
Dividend paid (3,274) (4,031) (4,763) (5,515)
Share issue/(buyback) (136) - - -
Profitability and efficiency ratios
Year to March FY16 FY17 FY18E FY19E
ROAE (%) 68.4 52.2 52.6 52.0
ROACE (%) 96.8 76.9 77.4 76.5
Inventory Days 59 67 72 70
Debtors Days 6 7 9 9
Payable Days 126 130 150 145
Cash Conversion Cycle (61) (56) (69) (66)
Current Ratio 1.0 0.9 0.9 1.0
Operating ratios
Year to March FY16 FY17 FY18E FY19E
Total Asset Turnover 4.0 3.3 3.2 3.1
Fixed Asset Turnover 4.3 3.6 3.4 3.3
Equity Turnover 4.3 3.6 3.4 3.3
Valuation parameters
Year to March FY16 FY17 FY18E FY19E
Adj. Diluted EPS (INR) 22.5 21.2 25.1 29.0
Y-o-Y growth (%) 9.6 (5.7) 18.2 15.8
Adjusted Cash EPS (INR) 25.1 26.1 29.7 34.4
Diluted P/E (x) 44.2 46.8 39.6 34.2
P/B (x) 26.5 22.7 19.3 16.5
EV / Sales (x) 6.9 6.7 6.0 5.3
EV / EBITDA (x) 28.5 28.3 24.9 21.3
Dividend Yield (%) 1.0 1.2 1.5 1.7
Balance sheet (INR mn)
As on 31st March FY16 FY17 FY18E FY19E
Share capital 272 272 272 272
Reserves & Surplus 9,923 11,666 13,726 16,112
Shareholders' funds 10,195 11,938 13,998 16,384
Long Term Liabilities 643 643 643 643
Def. Tax Liability (net) 217 217 217 217
Sources of funds 11,054 12,798 14,858 17,243
Gross Block 15,773 18,973 22,473 25,973
Net Block 10,081 11,949 14,206 16,252
Capital work in progress 784 1,000 1,000 1,000
Total Fixed Assets 10,865 12,949 15,206 17,252
Non current investments 301 301 301 301
Cash and Equivalents 2,883 3,131 2,996 3,610
Inventories 2,927 2,912 3,107 3,499
Sundry Debtors 1,015 989 1,101 1,247
Loans & Advances 1,363 1,363 1,363 1,363
Other Current Assets 82 82 82 82
Current Assets (ex cash) 5,387 5,347 5,654 6,191
Trade payable 5,519 6,067 6,436 7,249
Other Current Liab 2,863 2,863 2,863 2,863
Total Current Liab 8,382 8,930 9,299 10,111
Net Curr Assets-ex cash (2,995) (3,583) (3,645) (3,920)
Uses of funds 11,054 12,798 14,858 17,243
BVPS (INR) 37.5 43.9 51.5 60.2
Free cash flow (INR mn)
Year to March FY16 FY17 FY18E FY19E
Reported Profit 5,812 5,774 6,823 7,901
Add : Non cash charge 570 2,509 1,368 2,002
Add: Depreciation 1,114 1,332 1,243 1,453
Others (544) 1,176 124 549
Less: Changes in WC (348) 588 62 274
Operating cash flow 6,729 7,695 8,128 9,628
Less: Capex 2,944 3,416 3,500 3,500
Free Cash Flow 3,785 4,279 4,628 6,128

12 Edelweiss Securities Limited
Consumer Goods
Top 10 holdings
Perc. Holding Perc. Holding
Life Insurance Corp Of India 5.22 Arisaig Partners Asia Pte 3.38
Vontobel Asset Management Ag 1.07 Wasatch Advisors Inc 0.76
FMR LLC 0.75 Vontobel Asset Management AG 0.61
Virtus Investment Partners Inc 0.60 UTI Asset Management Co 0.51
Jpmorgan Chase & Co 0.38 Royal Bank Of Scotland 0.38
*as per last available data
Insider Trades
Reporting Data Acquired / Seller B/S Qty Traded
No Data Available
*in last one year
Bulk Deals Data Acquired / Seller B/S Qty Traded Price
No Data Available
*in last one year
Additional Data
Directors Data Vinod Nambiar Chairman R.A. Shah Vice Chairman
P.K. Ghosh Deputy Chairman I. Bachaalani Managing Director
V.S. Mehta Non-executive Director J.K. Setna Non-executive Director
Dr. I. Shahani Non-executive Director M.S Jacob Whole-time Director & CFO
Shyamala Gopinath Non-executive Director M Chandrasekar Whole-time Director
Auditors - Price Waterhouse - Chartered Accountants
*as per last annual report
13 Edelweiss Securities Limited
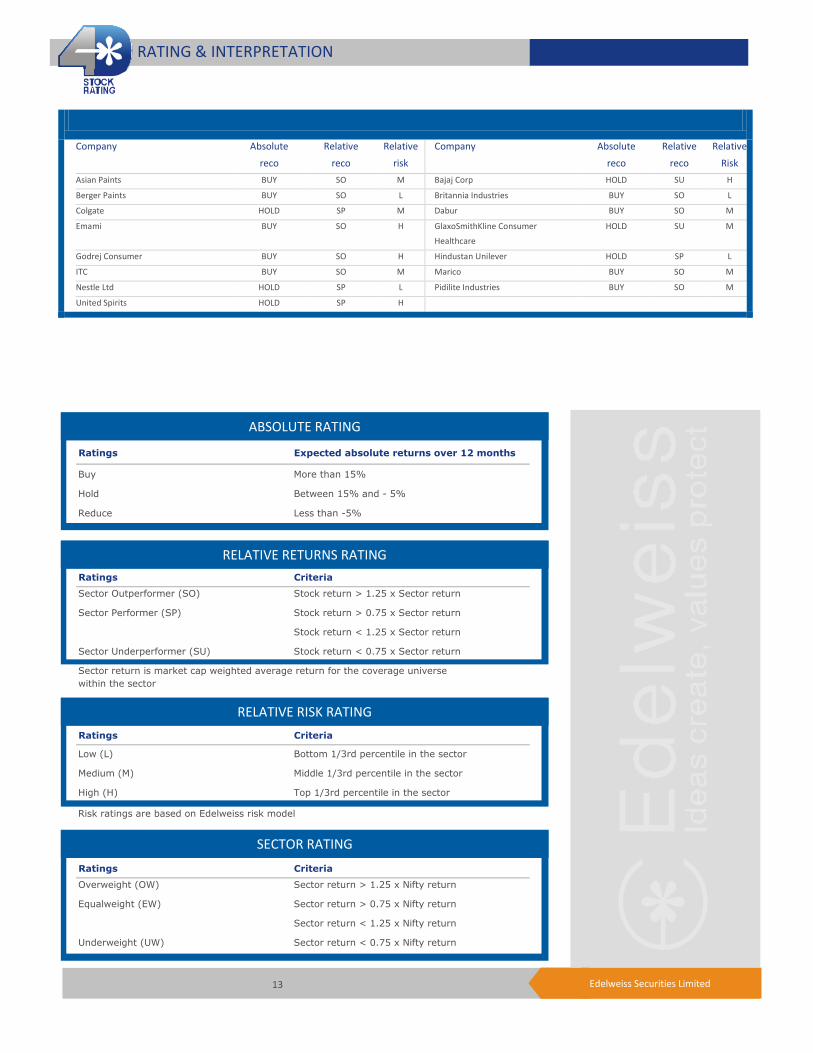
Company Absolute
reco
Relative
reco
Relative
risk
Company Absolute
reco
Relative
reco
Relative
Risk
Asian Paints BUY SO M Bajaj Corp HOLD SU H
Berger Paints BUY SO L Britannia Industries BUY SO L
Colgate HOLD SP M Dabur BUY SO M
Emami BUY SO H GlaxoSmithKline Consumer
Healthcare
HOLD SU M
Godrej Consumer BUY SO H Hindustan Unilever HOLD SP L
ITC BUY SO M Marico BUY SO M
Nestle Ltd HOLD SP L Pidilite Industries BUY SO M
United Spirits HOLD SP H
RATING & INTERPRETATION
ABSOLUTE RATING
Ratings Expected absolute returns over 12 months
Buy More than 15%
Hold Between 15% and - 5%
Reduce Less than -5%
RELATIVE RETURNS RATING
Ratings Criteria
Sector Outperformer (SO) Stock return > 1.25 x Sector return
Sector Performer (SP) Stock return > 0.75 x Sector return
Stock return < 1.25 x Sector return
Sector Underperformer (SU) Stock return < 0.75 x Sector return
Sector return is market cap weighted average return for the coverage universe
within the sector
RELATIVE RISK RATING
Ratings Criteria
Low (L) Bottom 1/3rd percentile in the sector
Medium (M) Middle 1/3rd percentile in the sector
High (H) Top 1/3rd percentile in the sector
Risk ratings are based on Edelweiss risk model
SECTOR RATING
Ratings Criteria
Overweight (OW) Sector return > 1.25 x Nifty return
Equalweight (EW) Sector return > 0.75 x Nifty return
Sector return < 1.25 x Nifty return
Underweight (UW) Sector return < 0.75 x Nifty return

14 Edelweiss Securities Limited
Consumer Goods
Edelweiss Securities Limited, Edelweiss House, off C.S.T. Road, Kalina, Mumbai – 400 098.
Board: (91-22) 4009 4400, Email: [email protected]
Aditya Narain
Head of Research
Coverage group(s) of stocks by primary analyst(s): Consumer Goods
Asian Paints, Bajaj Corp, Berger Paints, Britannia Industries, Colgate, Dabur, Godrej Consumer, Emami, Hindustan Unilever, ITC, Marico, Nestle Ltd, Pidilite Industries, GlaxoSmithKline Consumer Healthcare, United Spirits
Distribution of Ratings / Market Cap
Edelweiss Research Coverage Universe
Rating Distribution* 161 67 11 240 * 1stocks under review
Market Cap (INR) 156 62 11
Date Company Title Price (INR) Recos
Recent Research
12-May-17 GSK Consumer
Sequential recovery, but market share loss a concern; Result Update
5,246 Hold
11-May-17 Asian Paints Volumes back on track; margin hiccup; Result Update
1,166 Buy
09-May-17 Godrej Consumer Products
Hair care adds bright hue; margin sustains robust run; Result Update
1,929 Buy
> 50bn Between 10bn and 50 bn < 10bn
Buy Hold Reduce Total
Rating Interpretation
Buy appreciate more than 15% over a 12-month period
Hold appreciate up to 15% over a 12-month period
Reduce depreciate more than 5% over a 12-month period
Rating Expected to
-
149
297
446
594
743
Jan
-14
Feb
-14
Mar
-14
Ap
r-1
4
May
-14
Jun
-14
Jul-
14
Au
g-1
4
Sep
-14
Oct
-14
No
v-1
4
De
c-1
4
(IN
R)
One year price chart
700
780
860
940
1,020
1,100
May
-16
Jun
-16
Jun
-16
Jul-
16
Au
g-1
6
Au
g-1
6
Sep
-16
Oct
-16
Oct
-16
No
v-1
6
De
c-1
6
De
c-1
6
Jan
-17
Feb
-17
Mar
-17
Mar
-17
Ap
r-1
7
May
-17
(IN
R)
Colgate

15 Edelweiss Securities Limited
Colgate
DISCLAIMER
Edelweiss Securities Limited (“ESL” or “Research Entity”) is regulated by the Securities and Exchange Board of India (“SEBI”) and is licensed to carry on the business of broking, depository services and related activities. The business of ESL and its Associates (list available on www.edelweissfin.com) are organized around five broad business groups – Credit including Housing and SME Finance, Commodities, Financial Markets, Asset Management and Life Insurance.
This Report has been prepared by Edelweiss Securities Limited in the capacity of a Research Analyst having SEBI Registration No.INH200000121 and distributed as per SEBI (Research Analysts) Regulations 2014. This report does not constitute an offer or solicitation for the purchase or sale of any financial instrument or as an official confirmation of any transaction. Securities as defined in clause (h) of section 2 of the Securities Contracts (Regulation) Act, 1956 includes Financial Instruments and Currency Derivatives. The information contained herein is from publicly available data or other sources believed to be reliable. This report is provided for assistance only and is not intended to be and must not alone be taken as the basis for an investment decision. The user assumes the entire risk of any use made of this information. Each recipient of this report should make such investigation as it deems necessary to arrive at an independent evaluation of an investment in Securities referred to in this document (including the merits and risks involved), and should consult his own advisors to determine the merits and risks of such investment. The investment discussed or views expressed may not be suitable for all investors.
This information is strictly confidential and is being furnished to you solely for your information. This information should not be reproduced or redistributed or passed on directly or indirectly in any form to any other person or published, copied, in whole or in part, for any purpose. This report is not directed or intended for distribution to, or use by, any person or entity who is a citizen or resident of or located in any locality, state, country or other jurisdiction, where such distribution, publication, availability or use would be contrary to law, regulation or which would subject ESL and associates / group companies to any registration or licensing requirements within such jurisdiction. The distribution of this report in certain jurisdictions may be restricted by law, and persons in whose possession this report comes, should observe, any such restrictions. The information given in this report is as of the date of this report and there can be no assurance that future results or events will be consistent with this information. This information is subject to change without any prior notice. ESL reserves the right to make modifications and alterations to this statement as may be required from time to time. ESL or any of its associates / group companies shall not be in any way responsible for any loss or damage that may arise to any person from any inadvertent error in the information contained in this report. ESL is committed to providing independent and transparent recommendation to its clients. Neither ESL nor any of its associates, group companies, directors, employees, agents or representatives shall be liable for any damages whether direct, indirect, special or consequential including loss of revenue or lost profits that may arise from or in connection with the use of the information. Our proprietary trading and investment businesses may make investment decisions that are inconsistent with the recommendations expressed herein. Past performance is not necessarily a guide to future performance .The disclosures of interest statements incorporated in this report are provided solely to enhance the transparency and should not be treated as endorsement of the views expressed in the report. The information provided in these reports remains, unless otherwise stated, the copyright of ESL. All layout, design, original artwork, concepts and other Intellectual Properties, remains the property and copyright of ESL and may not be used in any form or for any purpose whatsoever by any party without the express written permission of the copyright holders.
ESL shall not be liable for any delay or any other interruption which may occur in presenting the data due to any reason including network (Internet) reasons or snags in the system, break down of the system or any other equipment, server breakdown, maintenance shutdown, breakdown of communication services or inability of the ESL to present the data. In no event shall ESL be liable for any damages, including without limitation direct or indirect, special, incidental, or consequential damages, losses or expenses arising in connection with the data presented by the ESL through this report.
We offer our research services to clients as well as our prospects. Though this report is disseminated to all the customers simultaneously, not all customers may receive this report at the same time. We will not treat recipients as customers by virtue of their receiving this report.
ESL and its associates, officer, directors, and employees, research analyst (including relatives) worldwide may: (a) from time to time, have long or short positions in, and buy or sell the Securities, mentioned herein or (b) be engaged in any other transaction involving such Securities and earn brokerage or other compensation or act as a market maker in the financial instruments of the subject company/company(ies) discussed herein or act as advisor or lender/borrower to such company(ies) or have other potential/material conflict of interest with respect to any recommendation and related information and opinions at the time of publication of research report or at the time of public appearance. ESL may have proprietary long/short position in the above mentioned scrip(s) and therefore should be considered as interested. The views provided herein are general in nature and do not consider risk appetite or investment objective of any particular investor; readers are requested to take independent professional advice before investing. This should not be construed as invitation or solicitation to do business with ESL.

16 Edelweiss Securities Limited
Consumer Goods
ESL or its associates may have received compensation from the subject company in the past 12 months. ESL or its associates may have managed or co-managed public offering of securities for the subject company in the past 12 months. ESL or its associates may have received compensation for investment banking or merchant banking or brokerage services from the subject company in the past 12 months. ESL or its associates may have received any compensation for products or services other than investment banking or merchant banking or brokerage services from the subject company in the past 12 months. ESL or its associates have not received any compensation or other benefits from the Subject Company or third party in connection with the research report. Research analyst or his/her relative or ESL’s associates may have financial interest in the subject company. ESL and/or its Group Companies, their Directors, affiliates and/or employees may have interests/ positions, financial or otherwise in the Securities/Currencies and other investment products mentioned in this report. ESL, its associates, research analyst and his/her relative may have other potential/material conflict of interest with respect to any recommendation and related information and opinions at the time of publication of research report or at the time of public appearance.
Participants in foreign exchange transactions may incur risks arising from several factors, including the following: ( i) exchange rates can be volatile and are subject to large fluctuations; ( ii) the value of currencies may be affected by numerous market factors, including world and national economic, political and regulatory events, events in equity and debt markets and changes in interest rates; and (iii) currencies may be subject to devaluation or government imposed exchange controls which could affect the value of the currency. Investors in securities such as ADRs and Currency Derivatives, whose values are affected by the currency of an underlying security, effectively assume currency risk.
Research analyst has served as an officer, director or employee of subject Company: No
ESL has financial interest in the subject companies: No
ESL’s Associates may have actual / beneficial ownership of 1% or more securities of the subject company at the end of the month immediately preceding the date of publication of research report.
Research analyst or his/her relative has actual/beneficial ownership of 1% or more securities of the subject company at the end of the month immediately preceding the date of publication of research report: No
ESL has actual/beneficial ownership of 1% or more securities of the subject company at the end of the month immediately preceding the date of publication of research report: No
Subject company may have been client during twelve months preceding the date of distribution of the research report.
There were no instances of non-compliance by ESL on any matter related to the capital markets, resulting in significant and material disciplinary action during the last three years except that ESL had submitted an offer of settlement with Securities and Exchange commission, USA (SEC) and the same has been accepted by SEC without admitting or denying the findings in relation to their charges of non registration as a broker dealer.
A graph of daily closing prices of the securities is also available at www.nseindia.com
Analyst Certification:
The analyst for this report certifies that all of the views expressed in this report accurately reflect his or her personal views about the subject company or companies and its or their securities, and no part of his or her compensation was, is or will be, directly or indirectly related to specific recommendations or views expressed in this report.
Additional Disclaimers
Disclaimer for U.S. Persons
This research report is a product of Edelweiss Securities Limited, which is the employer of the research analyst(s) who has prepared the research report. The research analyst(s) preparing the research report is/are resident outside the United States (U.S.) and are not associated persons of any U.S. regulated broker-dealer and therefore the analyst(s) is/are not subject to supervision by a U.S. broker-dealer, and is/are not required to satisfy the regulatory licensing requirements of FINRA or required to otherwise comply with U.S. rules or regulations regarding, among other things, communications with a subject company, public appearances and trading securities held by a research analyst account.
This report is intended for distribution by Edelweiss Securities Limited only to "Major Institutional Investors" as defined by Rule 15a-6(b)(4) of the U.S. Securities and Exchange Act, 1934 (the Exchange Act) and interpretations thereof by U.S. Securities and Exchange Commission (SEC) in reliance on Rule 15a 6(a)(2). If the recipient of this report is not a Major Institutional Investor as specified above, then it should not act upon this report and return the same to the sender. Further, this report may not be copied, duplicated and/or transmitted onward to any U.S. person, which is not the Major Institutional Investor.
17 Edelweiss Securities Limited
Colgate
Access the entire repository of Edelweiss Research on www.edelresearch.com
In reliance on the exemption from registration provided by Rule 15a-6 of the Exchange Act and interpretations thereof by the SEC in order to conduct certain business with Major Institutional Investors, Edelweiss Securities Limited has entered into an agreement with a U.S. registered broker-dealer, Edelweiss Financial Services Inc. ("EFSI"). Transactions in securities discussed in this research report should be effected through Edelweiss Financial Services Inc. Disclaimer for U.K. Persons
The contents of this research report have not been approved by an authorised person within the meaning of the Financial Services and Markets Act 2000 ("FSMA"). In the United Kingdom, this research report is being distributed only to and is directed only at (a) persons who have professional experience in matters relating to investments falling within Article 19(5) of the FSMA (Financial Promotion) Order 2005 (the “Order”); (b) persons falling within Article 49(2)(a) to (d) of the Order (including high net worth companies and unincorporated associations); and (c) any other persons to whom it may otherwise lawfully be communicated (all such persons together being referred to as “relevant persons”). This research report must not be acted on or relied on by persons who are not relevant persons. Any investment or investment activity to which this research report relates is available only to relevant persons and will be engaged in only with relevant persons. Any person who is not a relevant person should not act or rely on this research report or any of its contents. This research report must not be distributed, published, reproduced or disclosed (in whole or in part) by recipients to any other person. Disclaimer for Canadian Persons
This research report is a product of Edelweiss Securities Limited ("ESL"), which is the employer of the research analysts who have prepared the research report. The research analysts preparing the research report are resident outside the Canada and are not associated persons of any Canadian registered adviser and/or dealer and, therefore, the analysts are not subject to supervision by a Canadian registered adviser and/or dealer, and are not required to satisfy the regulatory licensing requirements of the Ontario Securities Commission, other Canadian provincial securities regulators, the Investment Industry Regulatory Organization of Canada and are not required to otherwise comply with Canadian rules or regulations regarding, among other things, the research analysts' business or relationship with a subject company or trading of securities by a research analyst. This report is intended for distribution by ESL only to "Permitted Clients" (as defined in National Instrument 31-103 ("NI 31-103")) who are resident in the Province of Ontario, Canada (an "Ontario Permitted Client"). If the recipient of this report is not an Ontario Permitted Client, as specified above, then the recipient should not act upon this report and should return the report to the sender. Further, this report may not be copied, duplicated and/or transmitted onward to any Canadian person. ESL is relying on an exemption from the adviser and/or dealer registration requirements under NI 31-103 available to certain international advisers and/or dealers. Please be advised that (i) ESL is not registered in the Province of Ontario to trade in securities nor is it registered in the Province of Ontario to provide advice with respect to securities; (ii) ESL's head office or principal place of business is located in India; (iii) all or substantially all of ESL's assets may be situated outside of Canada; (iv) there may be difficulty enforcing legal rights against ESL because of the above; and (v) the name and address of the ESL's agent for service of process in the Province of Ontario is: Bamac Services Inc., 181 Bay Street, Suite 2100, Toronto, Ontario M5J 2T3 Canada. Disclaimer for Singapore Persons
In Singapore, this report is being distributed by Edelweiss Investment Advisors Private Limited ("EIAPL") (Co. Reg. No. 201016306H) which is a holder of a capital markets services license and an exempt financial adviser in Singapore and (ii) solely to persons who qualify as "institutional investors" or "accredited investors" as defined in section 4A(1) of the Securities and Futures Act, Chapter 289 of Singapore ("the SFA"). Pursuant to regulations 33, 34, 35 and 36 of the Financial Advisers Regulations ("FAR"), sections 25, 27 and 36 of the Financial Advisers Act, Chapter 110 of Singapore shall not apply to EIAPL when providing any financial advisory services to an accredited investor (as defined in regulation 36 of the FAR. Persons in Singapore should contact EIAPL in respect of any matter arising from, or in connection with this publication/communication. This report is not suitable for private investors.
Copyright 2009 Edelweiss Research (Edelweiss Securities Ltd). All rights reserved