Restructuring of the international clothing and textile ... · Restructuring of the international...
29
Restructuring of the international clothing and textile trade network: the role of Italy and Portugal Marlies Hanna Schütz * and Nicole Palan 1 Background Production processes in recent years have been continuously fragmenting internation- ally (Jones and Kierzkowski 1990; Johnson and Noguera 2012) leading so to a finer divi- sion of labor and a rise in productivity. In addition, this increasing “multi-country nature of single products” (Stehrer et al. 2011: 1) has been accompanied by the establishment of global value chains (Feenstra and Hanson 1996) and worldwide competition thus more and more plays out at the level of production activities within industries and hence, at the level of a single commodity, rather than in competitive advantages between indus- tries (Fujita and isse 2006, 2013). Abstract Since the 1990s, the clothing and textile (C&T )-industry has been tremendously affected by changes in technology, trade costs, and the institutional environment. This paper studies the restructuring of C&T-trade from the perspective of Europe’s two most prominent C&T-goods producing countries—Italy and Portugal. We explore these two countries’ situation in a global context and concentrate our analysis to two distinct economic variables, C&T-value added and C&T-labor. Moreover, we contribute to the existing literature by distinguishing between domestically and internationally traded C&T-goods as well as between trade in intermediate and final demand C&T-goods, which enables us to give a more full-fledged picture on restructuring of C&T-trade. We show that international C&T-production became more concentrated between 1995 and 2009. In a further step, we investigate changes with regard to import penetration of C&T-trade, international outsourcing, the distance to final demand for C&T-goods, and another range of country-specific trade patterns. Our main findings reveal that Italy was more oriented toward C&T-production activities which generate high value added, whereas Portugal was less productive and relatively more specialized into the production of labor-intensive C&T-goods. Thus, Portugal was more prone to the rising international pressure from low-wage countries, whereas in Italy restructuring of C&T- trade had comparatively less severe effects. Keywords: Restructuring, Clothing and textile industry, International trade network, Trade of intermediate and final demand C&T-goods, Directly embodied C&T-value added and -labor, Italy and Portugal JEL Classification: C67, F14, O12 Open Access © 2016 Schütz and Palan. This article is distributed under the terms of the Creative Commons Attribution 4.0 International License (http://creativecommons.org/licenses/by/4.0/), which permits unrestricted use, distribution, and reproduction in any medium, provided you give appropriate credit to the original author(s) and the source, provide a link to the Creative Commons license, and indicate if changes were made. RESEARCH Schütz and Palan Economic Structures (2016) 5:16 DOI 10.1186/s40008-016-0046-7 *Correspondence: [email protected] Graz Schumpeter Centre, University of Graz, Universitätsstraße 15/FE, 8010 Graz, Austria
Transcript of Restructuring of the international clothing and textile ... · Restructuring of the international...
Restructuring of the international clothing and textile trade network: the role of Italy and PortugalMarlies Hanna Schütz* and Nicole Palan
1 BackgroundProduction processes in recent years have been continuously fragmenting internation-ally (Jones and Kierzkowski 1990; Johnson and Noguera 2012) leading so to a finer divi-sion of labor and a rise in productivity. In addition, this increasing “multi-country nature of single products” (Stehrer et al. 2011: 1) has been accompanied by the establishment of global value chains (Feenstra and Hanson 1996) and worldwide competition thus more and more plays out at the level of production activities within industries and hence, at the level of a single commodity, rather than in competitive advantages between indus-tries (Fujita and Thisse 2006, 2013).
Abstract
Since the 1990s, the clothing and textile (C&T)-industry has been tremendously affected by changes in technology, trade costs, and the institutional environment. This paper studies the restructuring of C&T-trade from the perspective of Europe’s two most prominent C&T-goods producing countries—Italy and Portugal. We explore these two countries’ situation in a global context and concentrate our analysis to two distinct economic variables, C&T-value added and C&T-labor. Moreover, we contribute to the existing literature by distinguishing between domestically and internationally traded C&T-goods as well as between trade in intermediate and final demand C&T-goods, which enables us to give a more full-fledged picture on restructuring of C&T-trade. We show that international C&T-production became more concentrated between 1995 and 2009. In a further step, we investigate changes with regard to import penetration of C&T-trade, international outsourcing, the distance to final demand for C&T-goods, and another range of country-specific trade patterns. Our main findings reveal that Italy was more oriented toward C&T-production activities which generate high value added, whereas Portugal was less productive and relatively more specialized into the production of labor-intensive C&T-goods. Thus, Portugal was more prone to the rising international pressure from low-wage countries, whereas in Italy restructuring of C&T-trade had comparatively less severe effects.
Keywords: Restructuring, Clothing and textile industry, International trade network, Trade of intermediate and final demand C&T-goods, Directly embodied C&T-value added and -labor, Italy and Portugal
JEL Classification: C67, F14, O12
Open Access
© 2016 Schütz and Palan. This article is distributed under the terms of the Creative Commons Attribution 4.0 International License (http://creativecommons.org/licenses/by/4.0/), which permits unrestricted use, distribution, and reproduction in any medium, provided you give appropriate credit to the original author(s) and the source, provide a link to the Creative Commons license, and indicate if changes were made.
RESEARCH
Schütz and Palan Economic Structures (2016) 5:16 DOI 10.1186/s40008-016-0046-7
*Correspondence: [email protected] Graz Schumpeter Centre, University of Graz, Universitätsstraße 15/FE, 8010 Graz, Austria
Page 2 of 29Schütz and Palan Economic Structures (2016) 5:16
A prime example for a globalized industry is the clothing and textile (C&T)-industry, where since the early 1990s increased mechanization and automation processes as well as fundamental changes in the institutional environment have been important drivers for the restructuring of production and trade (Kowalski and Molnár 2009). Particularly noteworthy are the changes in the institutional environment, where the replacement of the 1974 Multifibre Agreement by the WTO Agreement on Textile and Clothing by the end of 1994 foresaw a full integration of this industry into WTO/GATT by 2005. These changes have led to strong international competition for the European national C&T-industries from low-wage countries (e.g., China entered the WTO in 2000) as C&T-pro-duction is a field in which newly industrializing countries are usually quickly entering due to its low capital content.
In light of the changing institutional environment and the increased international competition for Europe’s national C&T-industries, the European Commission tried to implement effective policy measures to stabilize the situation of European C&T-pro-duction and -trade. In 2003 the European Commission thus initiated a task force, the so-called High Level Group on Textiles and Clothing (European Commission 2004a, b). Discussing the situation observed in European national C&T-industries, the High Level Group emphasizes: “[w]hile the Euro-Mediterranean Zone provides the conditions nec-essary to allow the sector to remain an important contributor to European industrial production, policymakers cannot ignore the fact that a permanent process of restructur-ing and modernisation will continue to lead to falling employment [and value added] for some years to come.” (European Commission 2004b: 7, emphasis added)
Tying in with this observation, this paper addresses the restructuring of Italy’s and Portugal’s C&T-trade in an international context between the two years 1995 and 2009. The special interest for the development in Italy and Portugal is owed to the hypothesis that C&T-production and accordingly C&T-trade in these two countries are expected to have faced the most intense restructuring. This is due to first, the C&T-industry’s signifi-cance for their national economies, and second, these two countries’ role in European C&T-production.1 We focus in our empirical analysis on a meso-level, and our smallest unit of analysis is constituted by C&T-goods at the two-digit level, which are traded both domestically and internationally. We adopt a systemic perspective in our study and to account for the spatial dimension of C&T-trade on a global scale we use a rich country-sample of 40 countries. More precisely, we embed the study of country-specific C&T-trade patterns for our two case study countries into an international setting. This we consider as necessary, since international C&T-trade perceives of a rather integrated structure. We further separate between trade in intermediate demand and final demand C&T-goods which proves beneficial in order to do justice to the increasing global nature of production processes. Our systemic approach mirrors also in the fact that we limit our analysis not to a single economic variable but instead we are interested in two dis-tinct economic variables, namely (1) employment and (2) value added in the C&T-indus-try. We consider this as a strong point of our approach as it helps to create a more
1 This reflects for instance in the fact that Italy’s share of value-added generation in the EU-15 C&T-industry was 32.5 % and its employment share 31.4 % in 1995. For Portugal, the importance of C&T-production gets evident more in its national economic structure, where the share of C&T-employment in total manufacturing employment in 1995 was 18.3 % and value-added generated in its C&T-industry accounted for 11.3 % in total manufacturing value-added genera-tion.
Page 3 of 29Schütz and Palan Economic Structures (2016) 5:16
full-fledged picture of the experienced restructuring of both countries’ C&T-trade. In particular, the focus set on employment brings in novel aspects, since this indicator has been neglected to some extent in this type of analysis. This, however, is an unsatisfactory fact, as employment dynamics spurred by restructuring processes should be equally high on the political agenda as changes in value-added generation.
Before we explore country-specific C&T-trade patterns for Italy and Portugal as well as changes therein, we focus on global production of C&T-goods and look at whether it is more concentrated or more dispersed in 2009 compared to 1995. Moreover, we inves-tigate productivity of C&T-workers in different regions around the world and its change between 1995 and 2009. In a next step, we concentrate our analysis to global C&T-trade and Italy’s and Portugal’s role therein. In detail, we figure out (changes in) spatial trade patterns in terms of C&T-value added and C&T-labor directly embodied in international C&T-trade flows. In a final step, we identify another range of similarities and differences between C&T-trade patterns of Italy and Portugal, where some measures applied let us draw inference about the two countries’ C&T-production activities. Aspects addressed include: (1) import penetration of C&T-trade and international outsourcing; (2) speciali-zation patterns with respect to the direct C&T-value-added content and direct C&T-labor intensity of C&T-trade flows; and (3) the distance to final demand for C&T-goods, where we use the economic space for defining proximity.
From an analytical viewpoint, we apply the Hirschman-Herfindahl Index (Herfindahl 1950; Hirschman 1958) and the coefficient of sectoral variation for exploring concentra-tion patterns of C&T-production on a global scale. In a further step, we choose a net-work-based approach since this allows us investigating the interdependent structure of global trade in C&T-goods. Our analytical starting point are two C&T-trade networks (TNs) one for C&T-value added and the other one for C&T-labor directly embodied in domestic and international C&T-trade flows. We build our networks based on the graph theoretical concept of an edge-weighted directed graph. The main data source for deriv-ing our C&T-TNs are two world input–output tables (WIOTs)—one for 1995 and one for 2009, which we take from the World Input–Output Database (WIOD) (Timmer et al. 2015).
Since we trace multiple aspects of restructuring of C&T-trade and embed the analysis for our two case study countries into an international setting, we contribute to a bet-ter understanding of the nature of restructuring of trade in a single commodity—C&T-goods—as triggered by changes in the institutional and technological environment. Moreover, the study of both similarities and differences between restructuring of Italian and Portuguese C&T-trade proves decisive for effective policy design.
The paper proceeds as follows. We start with a discussion on the methods and an explanation of data handling and related preparatory work in Sect. 2. Section 3 reports empirical results, and Sect. 4 concludes.
2 Methods2.1 Concentration measures
The degree to which the C&T-industry is concentrated, is measured in two differ-ent ways: We first investigate absolute concentration, i.e., whether C&T-value added (-employment) is located in a few countries only despite the fact that the C&T-industry
Page 4 of 29Schütz and Palan Economic Structures (2016) 5:16
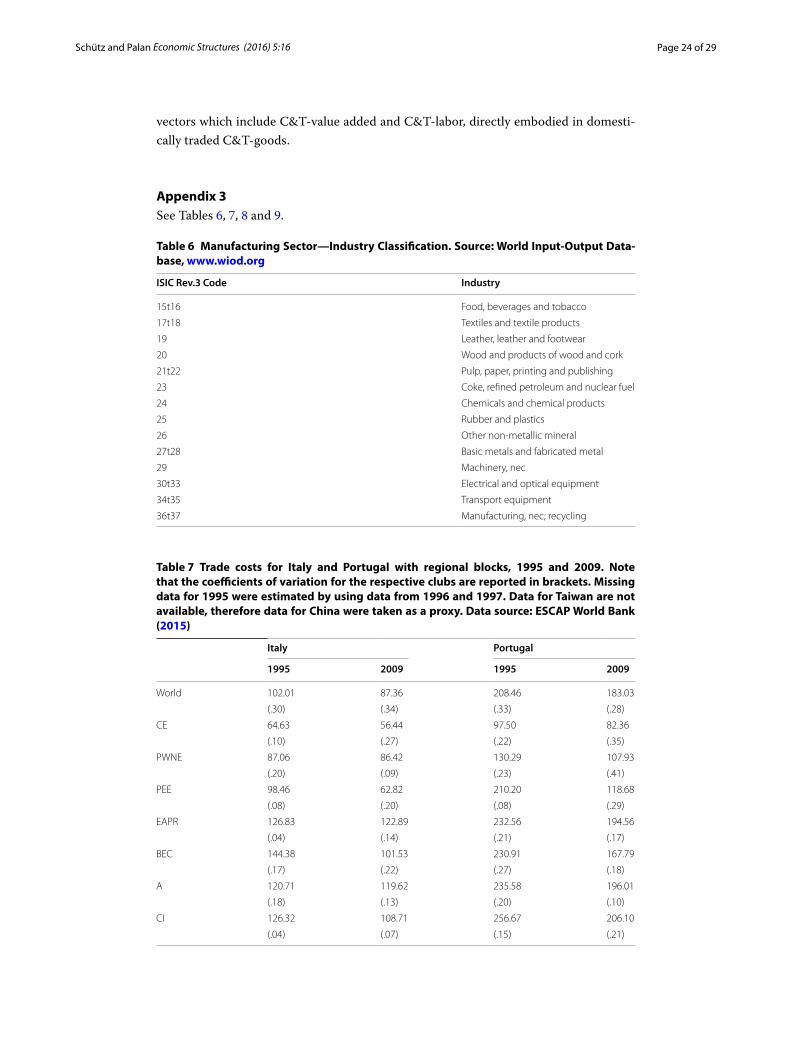
is one of the most prominent examples of a globalized industry. Second, we use a relative concentration index. This concept analyzes to which degree the shares of each country’s C&T-industry as a portion of each country’s manufacturing sector are different from the share of the international C&T-industry as a portion of the international manufacturing sector. The manufacturing sector contains the industries 15–37 according to the ISIC rev. 3 code (see Appendix 3: Table 6). By applying both concepts of concentration, we gain a more detailed understanding of the underlying forces of the concentration pat-terns at hand. For instance, the differences with respect to country size in our sample are large, thus facilitating absolute concentration. Since the level of economic development as well as wage levels are quite diverse as well, the shares of the C&T-industry could also be very heterogeneous, implying relative concentration.
We capture absolute concentration by the Hirschman-Herfindahl Index (HHI) (Her-findahl 1950; Hirschman 1958). The HHI takes the following form for C&T-value added and C&T-labor (denoted by 1 and 2, respectively):
Based on a vector v of dimension k × 1, in Eq. (1a), for k countries with i, h = 1, . . . , k a generic element vi, respectively vh of this vector contains value added in the C&T-industry of a single country i, respectively h. In Eq. (1b), the starting point is vector l of dimension k × 1 and the generic elements li and lh, respectively, contain hours worked in the C&T-industry. Most empirical studies on concentration choose α = 2 (Davis 1998; Storper et al. 2002; Aiginger and Pfaffermayr 2004; Beine and Coulombe 2007), and we follow this approach. The maximum level of absolute concentration would be reached if total C&T-value added (-employment) would occur in one country only; the lower bound of absolute concentration would occur if all countries (irrespective of their country size) were characterized by the same amount of value added (number of hours worked). In our case, the HHI can thus range between 1 and 0.025.
With regard to relative concentration, we apply the coefficient of sectoral variation (CV) which is based on the well-established Krugman Index (Krugman 1991a) but cor-rects for the (evolving) size of the industry and thus makes intertemporal comparisons more robust. For value added and labor, the CV reads as:
(1a)HHI1 =
k∑
h=1
(
vh∑k
i=1 vi
)α
(1b)HHI2 =
k∑
h=1
(
lh∑k
i=1 li
)α
(2a)CV1 =1
k
k∑
h=1
∣∣∣∣
vivmanufi
−
∑ki=1 vi
∑ki=1 v
manufi
∣∣∣∣
∑ki=1 vi
∑ki=1 v
manufi
(2b)CV2 =
1
k
k∑
h=1
∣∣∣∣
lilmanufi
−
∑ki=1 li
∑ki=1 l
manufi
∣∣∣∣
∑ki=1 li
∑ki=1 l
manufi
Page 5 of 29Schütz and Palan Economic Structures (2016) 5:16
In Eqs. (2a) and (2b), vmanufi and lmanuf
i correspond to value added, respectively, employ-ment in the manufacturing sector of a single country i. With regard to relative concen-tration, the reference level is the share of the worldwide C&T-industry as a portion of the worldwide manufacturing sector. Therefore, if all countries have the same share of C&T-industries measured as a percentage of their manufacturing sectors, there would be no relative concentration. This indicates the lower bound of concentration and the index would thus take the value zero. The upper bound of the index cannot be unam-biguously defined as it depends not only on the number of countries k in the sample but also on the relative size of the other manufacturing industries and the relative size of the countries under study.
2.2 International C&T‑trade networks
Our analytical network-based approach resides at the crossroads of two strands of the literature which have a similar research focus—the study of structural properties of pro-duction and trade on a global scale. The first strand of the literature is anchored in mul-tiregional input–output analysis, and the second one can be associated with the study of “socio-economic systems in the framework of network analysis” (Fagiolo et al. 2010: 480), or alternatively, as Prell et al. (2014: 405) describe it, with “world systems theory”. In the field of multiregional input–output analysis there exists a range of papers (e.g., Stehrer 2012; Stehrer et al. 2012; Los et al. 2014, 2015a), where the research focus is pri-marily on the global dimension of production. For instance, they analyze the factor con-tent of global trade linkages or factor income components and value added directly and indirectly embodied in global trade flows. We depart from this literature from a concep-tual viewpoint as we concentrate our analysis to only C&T-labor and C&T-value added directly embodied in C&T-trade flows. Related to this, another difference is that we iso-late C&T-trade flows and do not work on the ‘full’ production structure as reflected in a (multiregional) input–output table. We do so, since we seek to obtain an as detailed as possible picture on the structure of trade in C&T-goods only. With respect to this latter difference to multiregional input–output analysis, we are closer to the second strand of the literature, where in recent years an extensive body of papers has been published. On the one side, there are several works which focus primarily on topological characteristics of global TNs in either an aggregate or a commodity-specific context, such as Serrano and Boguñá (2003), Barigozzi et al. (2010), Fagiolo et al. (2010), or De Benedictis et al. (2014). On the other side, there exist several works (e.g., Kali and Reyes 2007; Reyes et al. 2010; Benedictis and Tajoli 2011; Amighini and Gorgoni 2014) which put the explora-tion of specific economic phenomena related to international trade into the foreground. Main differences to our paper are: (1) in all of these works no trade in directly embodied value added or factor inputs of a single commodity is examined, which we consider as a crucial issue to understand the nature of restructuring of C&T-trade. (2) In none of these works a distinction between intermediate and final demand goods is made, which, however, proves important as shown inter alia by Miroudot et al. (2009). (3) In some of these works either binary or even undirected graphs are investigated. On the con-trary, since both the direction and the intensity of trade do reflect important properties of C&T-trade, we work on an edge-weighted directed graph. We add thus to this existing literature in several different ways.
Page 6 of 29Schütz and Palan Economic Structures (2016) 5:16
The basic concept for constructing each of our international C&T-TNs is an edge-weighted directed graph G. Following partly the definition of Harary et al. (1965), a directed graph consists of a pair (V, X) where V is a finite and non-empty set of elements i, h called nodes and X is a finite set of elements eih called edges, with i, h = 1, . . . , k. An edge-weighted directed graph is described by two functions f1, f2 : X → V and to each eih ∈ X finally a weight wih > 0 is assigned. In our case, each node of V corresponds to a single country, while the set of edges X contains trade linkages between the nodes, which are weighted by C&T-trade volumes wih. As explained in more detail in Appendix 1, we derive two adjacency matrices A1 and A2 for each year, 1995 and 2009, from the basic edge-weighted directed graph G to map our C&T-TNs, where the first adjacency matrix A1 shows flows of C&T-value added directly embodied in domestically and internationally traded C&T-goods, and the second one A2 refers to C&T-labor directly embodied in domestic and international C&T-trade flows. These two adjacency matrices are the starting point for exploring a range of quantitative and qualitative properties of restructuring of C&T-trade. Moreover, to concentrate our analysis on international C&T-trade patterns and to explore the spatial dimension of C&T-trade on a global scale, in one case we slightly modify our two adjacency matrices A1 and A2 through setting all elements on the main diagonal to zero.
2.3 Strength centrality
There exist multiple measures in network analysis for characterizing the structure of a network. In general, one can distinguish between local and global measures, where the former describe node-specific characteristics and the latter are used to specify topologi-cal characteristics of the whole network. We focus on a node-specific measure, since this allows us analyzing the restructuring from the perspective of our two case study coun-tries. At the same time we do not lose sight of the entire network structure (i.e., the international environment). One class of local measures are centrality measures,2 which provide information on the status of a single node within a network according to some topological characteristic. In the following we apply strength centrality to the C&T-TNs as explained in more detail in Appendix 2. We decide for this measure, since it consti-tutes a simple but convenient metric to determine and compare the importance of single countries in the C&T-TNs, according to the overall intensity of C&T-trade linkages they share.
The overall intensity of C&T-trade linkages is defined by the volume of (1) C&T-value added and (2) C&T-labor directly embodied in traded C&T-goods, both domestically and internationally. As the adjacency matrices are not symmetric, in-strength centrality s1,INi (s2,INi ) identifies the position of a single country i in the C&T-TNs according to the volume of C&T-value added (C&T-labor) directly embodied in domestically and inter-nationally purchased C&T-goods, whereas out-strength centrality s1,OUT
i (s2,OUTi ) does
so according to the volume of C&T-value added (C&T-labor) directly embodied in its domestic and C&T-deliveries to other countries.3 The economic interpretation of
2 Depending on the characteristics of the graph, a diversity of centrality measures exists. They include strength (in the weighted case) or degree centrality (in the unweighted, binary case), eigenvector centrality, closeness, and betweenness centrality measures. See, e.g., Borgatti (2005) for a comprehensive discussion.3 Note that in the following we refer to flows associated with in-strength centrality as ‘inflows’, and in an analogous man-ner, to flows associated with out-strength centrality to ‘outflows’. Moreover, C&T-inflows of a single country from abroad are denoted as ‘imports’ and alike, C&T-goods which a single country delivers to other countries are called ‘exports’.
Page 7 of 29Schütz and Palan Economic Structures (2016) 5:16
strength centrality pertains to the following: By comparing strength centrality scores across countries, this provides information on the ‘global players’ in the respective net-work and allows us distinguishing between those countries which dominate global C&T-trade and those which are less engaged in global C&T-trade. Moreover, by adding a time component to our analysis this enables us to figure out shifts in country rankings.
In a next step, we decompose strength centrality into its sectoral components and cal-culate ‘partial strength centralities’ for C&T-value added (C&T-labor) directly embodied in intermediate demand and final demand C&T-goods. We do this by using matrix W (see Appendix 1). Matrix W is derived just by summing over matrix Z (showing interme-diate demand C&T-trade flows) and matrix F (mapping final demand C&T-trade flows). It follows that the adjacency matrices A1 and A2 are also composed of both intermediate and final demand deliveries of C&T-goods. Let Z ≡ Z ⊘W and F ≡ F ⊘W be two matrices of dimension k × k, where the symbol ⊘ indicates elementwise division, and hence, one generic element zih(f ih) with i, h = 1, . . . , k of matrix Z (F ) corresponds to the share of intermediate (final) demand C&T-trade flows in total C&T-trade flows from country i to country h. Using this definition, partial strength centralities for each varia-ble C&T-value added and C&T-labor can be derived as follows:4
In Eqs. (3a) and (3b), the symbol ⊗ denotes elementwise multiplication, subscripts Z and F refer to intermediate, respectively, final demand, and e is a summation vector of dimension k × 1. Studying the different versions of strength centrality with respect to intermediate (s·,INZ and s·,OUT
Z ) and final demand (s·,INF and s·,OUTF ) for C&T-goods, we gain
deeper knowledge about restructuring of C&T-trade as we can figure out differential characteristics of C&T-trade patterns for single countries. In doing so, we again separate between directly embodied C&T-value added and C&T-labor.
2.4 Strength centrality‑based measures: node analysis
After having obtained information on the status of single countries within the networks, we excavate strength centrality and derive another range of measures from it. Even if some of these metrics are not conventional in network analysis, they allow us figuring out multiple characteristics of the structure of the C&T-TNs from the perspective of sin-gle countries. The economic interpretation of our measures pertains to (1) the degree of import penetration and of international outsourcing; (2) the direct C&T-value-added content and C&T-labor intensity of C&T-trade; and (3) the distance to final demand for C&T-goods.
4 Note that in the following the dot-symbol ‘·’ is used to indicate that the formulae refer to variable 1 (C&T-value added) and likewise to variable 2 (C&T-labor).
(3a)s·,IN = eT
(Z ⊗ A·
)
︸ ︷︷ ︸
s·,INZ
+ eT(F ⊗ A·
)
︸ ︷︷ ︸
s·,INF
(3b)s·,OUT =
(Z ⊗ A·
)e
︸ ︷︷ ︸
s·,OUTZ
+(F ⊗ A·
)e
︸ ︷︷ ︸
s·,OUTF
,
Page 8 of 29Schütz and Palan Economic Structures (2016) 5:16
2.4.1 Import penetration and international outsourcing
To obtain information on the degree to which a single country i is integrated in the net-work with respect to vertical interaction with adjacent nodes, we calculate a centrality coefficient. Similar to a measure introduced by De Backer and Yamano (2008), this cen-trality coefficient from an economic viewpoint enables us to identify the import content of C&T-absorption of a single country i and hence, the degree of ‘import penetration’. The centrality coefficient to figure out this property is determined by:
In Eq. (4a), s·,IN,fori corresponds to the volume of C&T-value added (C&T-labor) directly
embodied in C&T-imports of a single country i and s·,OUT,domi refers to C&T-value
added (C&T-labor) directly embodied in domestic C&T-deliveries (see Appendix 2). The higher the centrality coefficient, the lower the degree to which a single country’s domes-tic absorption of C&T-goods is satisfied by domestic C&T-trade and vice versa, the more dependent it is on C&T-imports with respect to directly embodied C&T-value added and/or C&T-labor.
In order to figure out the degree of international outsourcing we again follow De Backer and Yamano (2008), who build on the outsourcing measure introduced by Feen-stra and Hanson (1996, 1999). We break down the measure to our single commodity—C&T-goods—and we calculate a second centrality coefficient, which is given by the following formula:
In Eq. (4b), sZ ·,IN,fori denotes the volume of C&T-value added (C&T-labor) directly
embodied in intermediate demand C&T-imports of a single country i and similarly, sZ ·,INi
shows the volume of C&T-value added (C&T-labor) directly embodied in intermediate demand C&T-inflows, including those of a domestic and foreign origin. The higher the centrality coefficient in Eq. (4b), the higher the degree of international outsourcing. On the contrary, the lower the centrality coefficient, the lower is the volume of C&T-value added (C&T-labor) directly embodied in intermediate demand C&T-imports of a single country i relative to intermediate demand C&T-inflows and the lower is its dependence on foreign C&T-production activities.
2.4.2 Direct C&T‑value‑added content and direct C&T‑labor intensity
For the next indicator, we focus on differences between C&T-value added and C&T-labor directly embodied in C&T-trade flows in order to examine specialization patterns in C&T-trade. Since nodes are the same for the two C&T-TNs, we are able to compare strength centralities derived from A1 with those of A2 in order to figure out the direct C&T-value-added content or, on the opposite, the direct C&T-labor intensity of C&T-trade from the perspective of single countries. As a measure for detecting this qualitative property of C&T-trade we suggest using the ratios between in-strength centralities as
(4a)c·,IN,for/(IN,for+OUT,dom)i =
s·,IN,fori(
s·,IN,fori + s·,OUT,dom
i
)
(4b)cZ·,IN,for/INi =
sZ·,IN,fori
sZ·,INi
Page 9 of 29Schütz and Palan Economic Structures (2016) 5:16
well as those between out-strength centralities of the two C&T-TNs. Formally for a sin-gle country i:
The higher qINi (qOUTi ) for a single country i, the higher is the direct C&T-value-added
content, respectively, the lower is the direct C&T-labor intensity of its C&T-inflows (C&T-outflows). From an economic point of view, if then for a single country i it holds that qINi ≤ qOUT
i , this indicates that the C&T-goods which a country delivers both domes-tically and to other countries perceive of a relatively lower direct C&T-labor intensity than the C&T-goods it acquires from both the domestic and international market. On the contrary, they then have a relatively higher direct C&T-value-added content which can be associated with high-quality products. Vice versa, if a country is characterized by C&T-inflows which have a relatively higher direct C&T-value-added content than outflows and therefore qINi > qOUT
i , it specializes in trade of C&T-goods which are more C&T-labor-demanding, commonly associated in C&T-production with lower-quality goods.
2.4.3 Distance to final demand for C&T‑goods
In a final step, we investigate a country’s trade patterns with respect to the distance to final demand for C&T-goods, or vice versa, the proximity to intermediate demand for C&T-goods. From this distance measure we again draw inference about C&T-production pat-terns in a single country. For defining proximity with respect to the final demand sector or the intermediate demand sector, we use the economic space as the domain. To derive our measure, we use only partial out-strength centralities. Based on the mathematical pro-cedure for constructing our two C&T-TNs, as discussed in Appendix 1, at this point it makes no difference whether we take partial out-strength centralities for C&T-value added or for C&T-labor to measure the distance to final demand, as both deliver the same result. Figure 1 summarizes the criteria for determining the distance to final demand.
If it holds for a single country i that sZ·,OUTi
sF·,OUTi
> 1 then a relatively larger proportion
of its C&T-outflows is directed toward the intermediate demand sector than to final demand, which means a country is expected to be closer to the production of intermedi-ate demand than to final demand C&T-goods. On the contrary, if sZ
·,OUTi
sF·,OUTi
≤ 1 and hence, C&T-outflows are to a larger extent final demand C&T-goods then a country’s distance to final demand is smaller than to intermediate demand. Similar to an idea put forth by De Backer and Miroudot (2013), the higher the distance to final demand, the more a country i is involved in C&T-production activities which are located upstream; whereas the closer a country i is to final demand the more it is specialized on downstream C&T-production activities. Changes in values of partial out-strength centralities over time then indicate shifts in the distance to final demand: If the gap to final demand shrinks then a country moves into a downstream direction, and vice versa this indicates a move into an upstream direction.
(5a)qINi =s1,INi
s2,INi
(5b)qOUTi =
s1,OUTi
s2,OUTi
Page 10 of 29Schütz and Palan Economic Structures (2016) 5:16
2.5 Data
We decided to use data from the WIOD (Timmer et al. 2015) on various grounds: Its main advantage over other datasets is that it includes a wide range of different indicators within a single database. Since we take both value-added and employment data from the WIOD, we avoid differences in methodology and limited comparability—which could be the case if mixing databases. WIOD also fits our research purpose since it offers detailed data on an industry-level (classified according to ISIC Rev. 3, two-digit level into 35 industries) for a rich country-sample of 40 countries. The large country-sample is beneficial to our empirical analysis, since different from other databases in this field of research (e.g., OECD STAN 2015), major C&T-producing countries such as India, China, and Indonesia are included. We decided against using the UN Comtrade Data-base (UN Comtrade Database 2015), which provides a more comprehensive country-sample at a more disaggregated product-level (five-digit code). The reason is that this database is not appropriate for our research purpose as no trade data on employment or value added are available and moreover it alwlows no distinction between trade in inter-mediate and final demand goods. Our decision is supported by recent research which emphasized problems in using only gross output data for measuring international trade (Daudin et al. 2014; Jones et al. 2013). Beyond, also the WTO highlights the importance of focusing on both employment and value-added data for reaching trade policy recom-mendations (Elms and Low 2013).
For our empirical analysis, the C&T-industry and manufacturing industries value-added and labor data are taken from the 2012 version of the WIOD socioeconomic accounts (Erumban et al. 2012). Specifically, we use hours worked, since this is the best measure available for the actual amount of labor used in a specific industry. The value-added data provided in the socioeconomic accounts have been slightly modified: Since it is expressed in national currencies, we used the exchange rate table provided by the WIOD to convert values into US$. The WIOD also provides WIOTs5 on an annual basis (values are expressed in current prices and denoted in US$), where we take the two tables for 1995 and 2009 as the basis for constructing our C&T-TNs. WIOTs are harmo-nized with the socioeconomic accounts data and cover again 35 industries and 40 coun-tries as well as one extra region called ‘rest of the world’ (RoW), which we exclude from the analysis throughout.6
5 See Dietzenbacher et al. (2013) for a detailed explanation on the construction and structure of WIOTs.6 The latter region is added for balancing and calculation purposes (Dietzenbacher et al. 2013) and serves as a proxy for countries not included in the sample. It is therefore not amenable to interpretation (Timmer 2012). A consequence of omitting RoW from our empirical analysis is that we create an upward bias in the technology structure underlying the WIOT. After deflating our data, we therefore make a few corrections to mitigate this bias: The value-added vectors and the labor vectors, referring initially to the whole country-sample including RoW, are down-scaled by the share of the reduced real gross output vector (excluding then intermediate and final demand deliveries of the 40 countries to RoW) in total real gross output (including RoW). Down-scaling implies that in 1995 just 87.3 % of actual trade in C&T-goods are covered. Similarly, calculated based on nominal figures, 82.8 % of trade in C&T-goods are included in 2009.
Fig. 1 Criteria for determining a single country’s distance to final demand for C&T-goods
Page 11 of 29Schütz and Palan Economic Structures (2016) 5:16
Since the WIOD reports price indicators for various variables we are able to deflate all the data. The deflation procedure was accomplished row-wise, using multiple price indexes.7 Since real gross output is no longer equal to the sum of real intermediate and real final demand deliveries after row-wise deflation, the sum of real intermediate and real final demand is used as a corrected version of real gross output for the analysis.
To concentrate our analysis on Italy and Portugal, the other countries are clustered into country groupings (i.e., regional blocks). In line with other studies, the most appro-priate classification for our research purpose is the grouping of countries according to trade costs (Baldwin 2006; Chortareas and Pelagidis 2004). In addition, the recent debate on the ‘distance puzzle’ proves a classification as per mere distance measures inferior to a grouping according to trade costs (Bosquet and Boulhol 2015). One database that tries to capture the variety of factors influencing the level of trade costs is the ESCAP World Bank Database on International Trade Costs (ESCAP World Bank 2015).8 This is the most suitable database for our purpose since it provides bilateral trade costs for all coun-tries in our sample but Taiwan (for which the trade costs of China are taken as a proxy) and data are available on an annual basis between 1995 and 2009.9 However, since data are not available at the industry-level, we use data for the manufacturing sector as a proxy. The task is to assign the individual 40 countries in such a manner that those within a regional block are characterized by a more similar level of bilateral trade costs with Italy and Portugal, respectively, compared to the other countries in the sample. In order to achieve homogeneous clubs, thus the deviations between the levels of bilateral trade costs within a club must be sufficiently small. At the same time, we require the level of bilateral trade costs to be sufficiently different from those in other clubs. Then, for each group we calculate the unweighted average level of bilateral trade costs and the standard deviation for both 1995 and 2009. For our sample, the coefficients of variation in bilateral trade costs between country pairs could be minimized by clustering coun-tries in the following way (see Appendix 3: Table 7):
• Central Europe (CE): Austria, Belgium, France, Germany, Italy, Netherlands, Slove-nia, Spain, and UK;
• Periphery West and North Europe (PWNE): Denmark, Finland, Greece, Ireland, Luxembourg, Malta, Portugal, and Sweden;
• Periphery East Europe (PEE): Bulgaria, Czech Republic, Hungary, Poland, Romania, Slovakia;
• Baltic and Eurasian Countries (BEC): Cyprus, Estonia, Latvia, Lithuania, Russia, and Turkey;
7 Intermediate demand levels are deflated using the intermediate demand industry-level price index. The industry gross output, respectively, value-added vectors are deflated by using the corresponding gross output, respectively, value-added price index. Since there are no price indexes for final demand components (except for gross fixed capital formation), final demand vectors were deflated using the corresponding intermediate demand industry-level price index.8 International trade costs in this setting capture all additional costs involved in trading goods bilaterally, relative to those involved in trading goods domestically. These additional costs are shipping and logistic costs, both tariff and non-tariff costs (such as costs with trade procedures and regulations) as well as costs which arise from differences in lan-guage, culture, and currencies.9 The drawbacks of other databases are the following: For instance, in the CEPII database bilateral trade costs are held constant over time (Mayer and Zignano 2011). The OECD database on Maritime Transport Costs (OECD 2015) pro-vides annual data at the industry-level, but data are not available for country pairs, i.e., EU-15 is treated as an entity for imports and exports. Furthermore, there does not exist data for non-OECD countries, above all the Eastern European countries. No figures are reported for Canada.
Page 12 of 29Schütz and Palan Economic Structures (2016) 5:16
• Americas (A): Brazil, Canada, Mexico, and the USA; • East Asia and the Pacific Region (EAPR): Australia, Indonesia, Japan, South Korea,
and Taiwan; • China and India (CI).
3 Results and discussion3.1 Restructuring on a global scale
3.1.1 Descriptive statistics, concentration patterns, and labor productivity
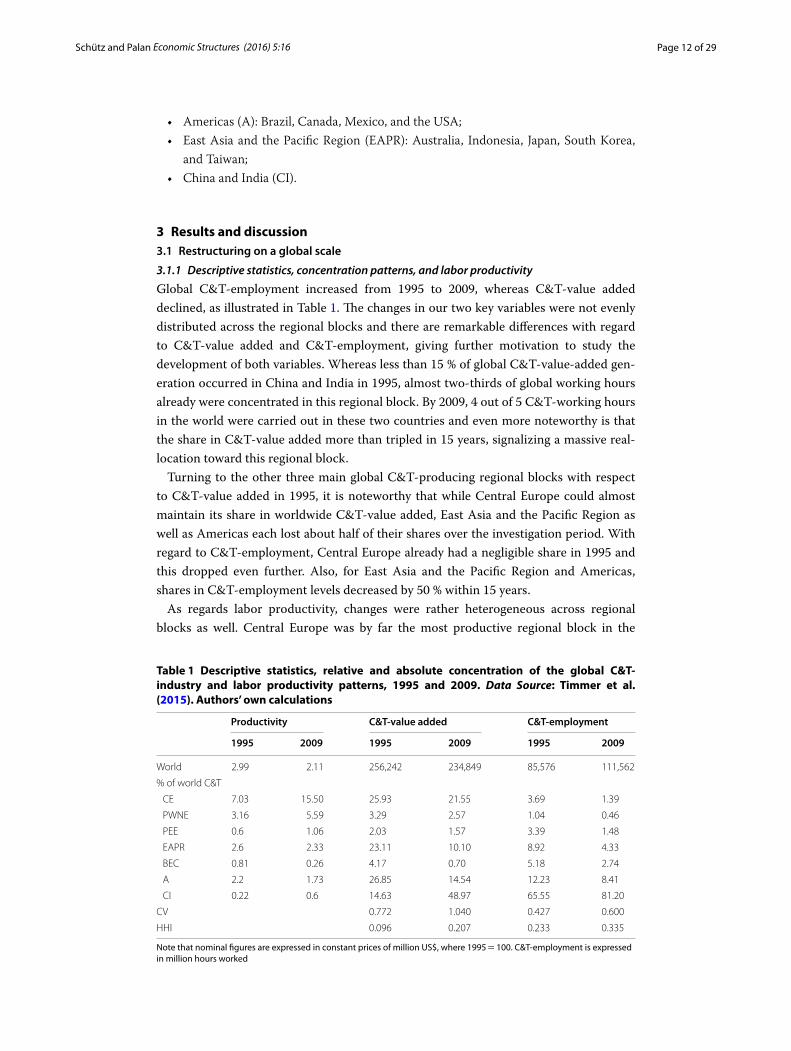
Global C&T-employment increased from 1995 to 2009, whereas C&T-value added declined, as illustrated in Table 1. The changes in our two key variables were not evenly distributed across the regional blocks and there are remarkable differences with regard to C&T-value added and C&T-employment, giving further motivation to study the development of both variables. Whereas less than 15 % of global C&T-value-added gen-eration occurred in China and India in 1995, almost two-thirds of global working hours already were concentrated in this regional block. By 2009, 4 out of 5 C&T-working hours in the world were carried out in these two countries and even more noteworthy is that the share in C&T-value added more than tripled in 15 years, signalizing a massive real-location toward this regional block.
Turning to the other three main global C&T-producing regional blocks with respect to C&T-value added in 1995, it is noteworthy that while Central Europe could almost maintain its share in worldwide C&T-value added, East Asia and the Pacific Region as well as Americas each lost about half of their shares over the investigation period. With regard to C&T-employment, Central Europe already had a negligible share in 1995 and this dropped even further. Also, for East Asia and the Pacific Region and Americas, shares in C&T-employment levels decreased by 50 % within 15 years.
As regards labor productivity, changes were rather heterogeneous across regional blocks as well. Central Europe was by far the most productive regional block in the
Table 1 Descriptive statistics, relative and absolute concentration of the global C&T-industry and labor productivity patterns, 1995 and 2009. Data Source: Timmer et al. (2015). Authors’ own calculations
Note that nominal figures are expressed in constant prices of million US$, where 1995 = 100. C&T-employment is expressed in million hours worked
Productivity C&T‑value added C&T‑employment
1995 2009 1995 2009 1995 2009
World 2.99 2.11 256,242 234,849 85,576 111,562
% of world C&T
CE 7.03 15.50 25.93 21.55 3.69 1.39
PWNE 3.16 5.59 3.29 2.57 1.04 0.46
PEE 0.6 1.06 2.03 1.57 3.39 1.48
EAPR 2.6 2.33 23.11 10.10 8.92 4.33
BEC 0.81 0.26 4.17 0.70 5.18 2.74
A 2.2 1.73 26.85 14.54 12.23 8.41
CI 0.22 0.6 14.63 48.97 65.55 81.20
CV 0.772 1.040 0.427 0.600
HHI 0.096 0.207 0.233 0.335
Page 13 of 29Schütz and Palan Economic Structures (2016) 5:16
international C&T-industry in both years and could even increase its lead in labor productivity. Periphery West and North Europe substantially improved its level and became the second most productive regional block in the world and also the regional block China and India almost tripled its labor productivity. For Americas and East Asia and the Pacific Region, C&T-value added dropped even more than C&T-employment, implying that labor productivity in these regional blocks decreased over the investiga-tion period. The reason for labor productivity to decline on a global scale is, however, to be found in the fact that large parts of worldwide C&T-value added were reallocated toward the far less productive countries—China and India.
Analyzing absolute concentration, the level for C&T-value added was near the lower bound in 1995 implying that C&T-value added was rather equally distributed across the 40 countries (see Table 1). With regard to C&T-employment, absolute concentration was more than double as high compared to C&T-value added in 1995. Similar to results which were obtained for absolute concentration, relative concentration also increased between 1995 and 2009 for both variables. Yet, whereas absolute concentration was higher with regard to C&T-employment and was driven mainly by large countries such as China, relative concentration was more pronounced with regard to C&T-value added and was more influenced by countries with high shares in global C&T-value added such as Portugal or Turkey. As both absolute and relative concentration indexes with regard to both C&T-employment and C&T-value added increased significantly over time, it becomes evident that institutional changes and the reduction of transportation costs facilitated concentration as predicted in models of economic geography (Krugman 1991a, b).
3.1.2 Spatial trade patterns of C&T‑goods
As regards the distribution of C&T-trade volumes on a global scale, we observe that international trade got more important relatively to domestic trade in terms of directly embodied C&T-value added, whereas for C&T-labor the change prevailed in the oppo-site direction. Results show thus that for C&T-value added a comparatively stronger global integration took place, whereas C&T-labor got more integrated within national borders over the investigation period (see Appendix 3: Table 8).
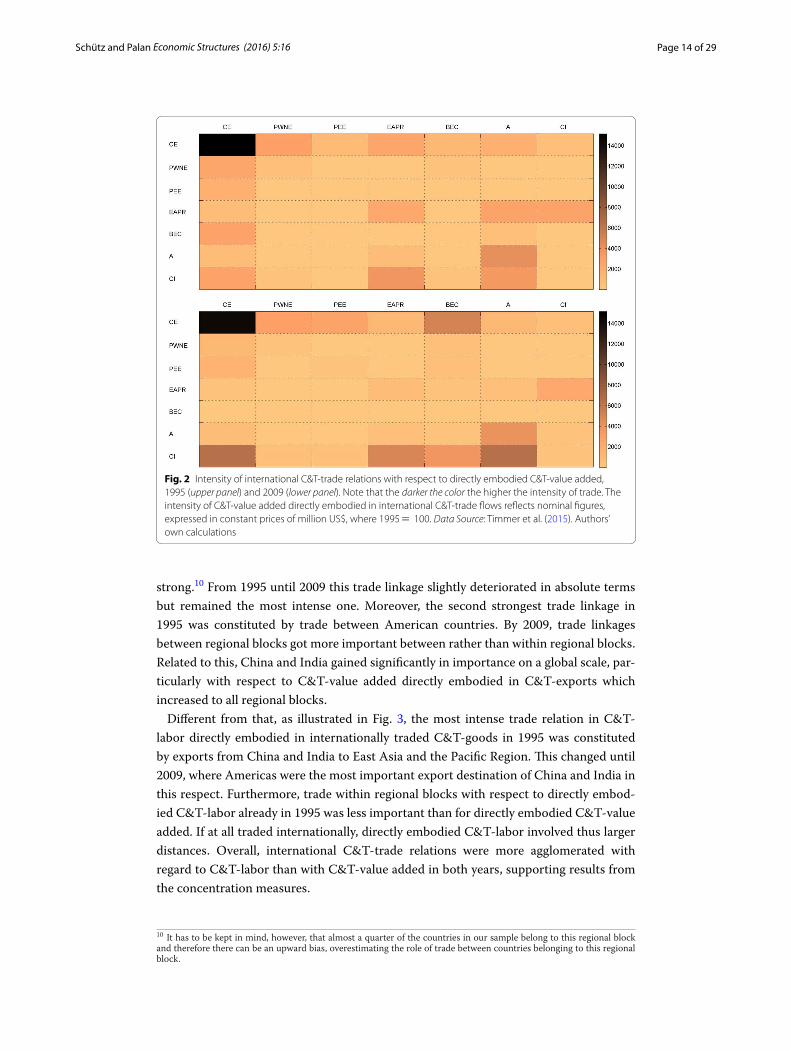
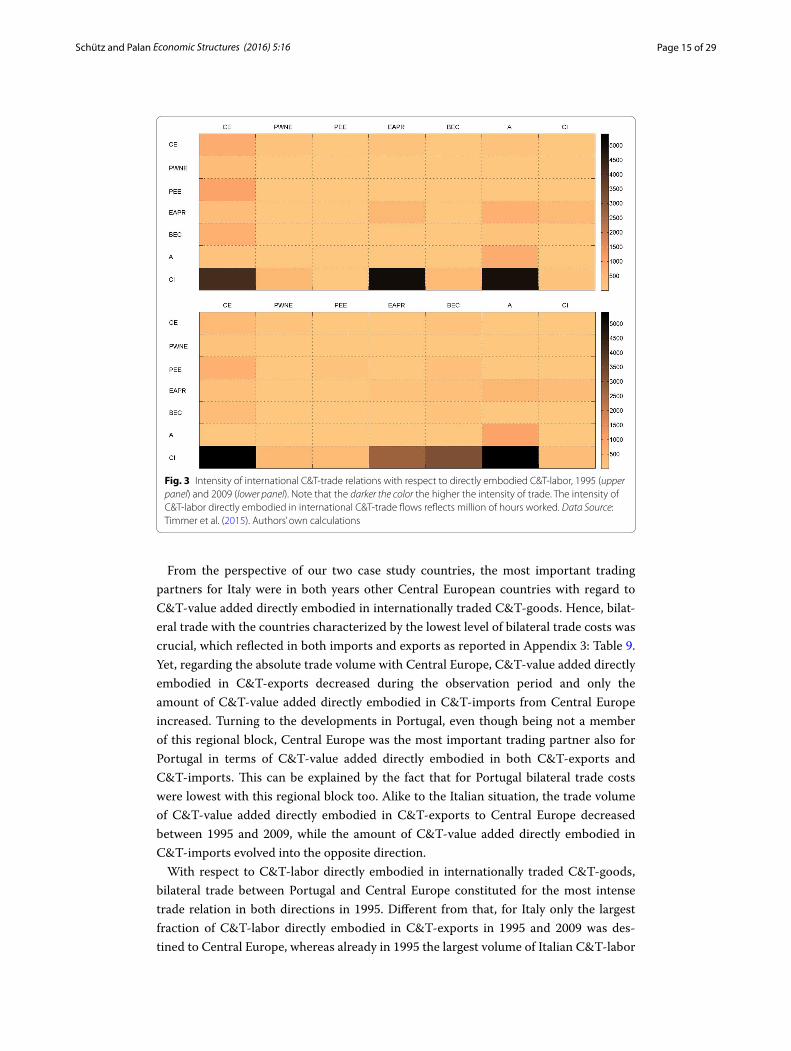
Even if only a comparatively low fraction of both C&T-value added and C&T-labor were directly embodied in internationally traded C&T-goods compared to domestically traded ones, it is interesting to look in a next step at the spatial dimension of interna-tional C&T-trade. Figure 2 shows the C&T-TN in terms of C&T-value added directly embodied in international C&T-trade flows in 1995 (upper panel) and in 2009 (lower panel). Likewise, Fig. 3 maps the C&T-TN in terms of C&T-labor directly embodied in internationally traded C&T-goods in 1995 (upper panel) and in 2009 (lower panel). Note that the darker the color, the more intense is the respective international trade relation between any two regional blocks.
It becomes evident that international trade in neither directly embodied C&T-value added nor directly embodied C&T-labor was evenly distributed across space and only a few trade linkages dominated international trade. As can be seen from Fig. 2, the most intense trade relation in 1995 for directly embodied C&T-value added was trade among Central European countries themselves and no other trade relations were equally
Page 14 of 29Schütz and Palan Economic Structures (2016) 5:16
strong.10 From 1995 until 2009 this trade linkage slightly deteriorated in absolute terms but remained the most intense one. Moreover, the second strongest trade linkage in 1995 was constituted by trade between American countries. By 2009, trade linkages between regional blocks got more important between rather than within regional blocks. Related to this, China and India gained significantly in importance on a global scale, par-ticularly with respect to C&T-value added directly embodied in C&T-exports which increased to all regional blocks.
Different from that, as illustrated in Fig. 3, the most intense trade relation in C&T-labor directly embodied in internationally traded C&T-goods in 1995 was constituted by exports from China and India to East Asia and the Pacific Region. This changed until 2009, where Americas were the most important export destination of China and India in this respect. Furthermore, trade within regional blocks with respect to directly embod-ied C&T-labor already in 1995 was less important than for directly embodied C&T-value added. If at all traded internationally, directly embodied C&T-labor involved thus larger distances. Overall, international C&T-trade relations were more agglomerated with regard to C&T-labor than with C&T-value added in both years, supporting results from the concentration measures.
10 It has to be kept in mind, however, that almost a quarter of the countries in our sample belong to this regional block and therefore there can be an upward bias, overestimating the role of trade between countries belonging to this regional block.
Fig. 2 Intensity of international C&T-trade relations with respect to directly embodied C&T-value added, 1995 (upper panel) and 2009 (lower panel). Note that the darker the color the higher the intensity of trade. The intensity of C&T-value added directly embodied in international C&T-trade flows reflects nominal figures, expressed in constant prices of million US$, where 1995 = 100. Data Source: Timmer et al. (2015). Authors’ own calculations
Page 15 of 29Schütz and Palan Economic Structures (2016) 5:16
From the perspective of our two case study countries, the most important trading partners for Italy were in both years other Central European countries with regard to C&T-value added directly embodied in internationally traded C&T-goods. Hence, bilat-eral trade with the countries characterized by the lowest level of bilateral trade costs was crucial, which reflected in both imports and exports as reported in Appendix 3: Table 9. Yet, regarding the absolute trade volume with Central Europe, C&T-value added directly embodied in C&T-exports decreased during the observation period and only the amount of C&T-value added directly embodied in C&T-imports from Central Europe increased. Turning to the developments in Portugal, even though being not a member of this regional block, Central Europe was the most important trading partner also for Portugal in terms of C&T-value added directly embodied in both C&T-exports and C&T-imports. This can be explained by the fact that for Portugal bilateral trade costs were lowest with this regional block too. Alike to the Italian situation, the trade volume of C&T-value added directly embodied in C&T-exports to Central Europe decreased between 1995 and 2009, while the amount of C&T-value added directly embodied in C&T-imports evolved into the opposite direction.
With respect to C&T-labor directly embodied in internationally traded C&T-goods, bilateral trade between Portugal and Central Europe constituted for the most intense trade relation in both directions in 1995. Different from that, for Italy only the largest fraction of C&T-labor directly embodied in C&T-exports in 1995 and 2009 was des-tined to Central Europe, whereas already in 1995 the largest volume of Italian C&T-labor
Fig. 3 Intensity of international C&T-trade relations with respect to directly embodied C&T-labor, 1995 (upper panel) and 2009 (lower panel). Note that the darker the color the higher the intensity of trade. The intensity of C&T-labor directly embodied in international C&T-trade flows reflects million of hours worked. Data Source: Timmer et al. (2015). Authors’ own calculations
Page 16 of 29Schütz and Palan Economic Structures (2016) 5:16
directly embodied in C&T-imports came from China and India. For Portugal the situ-ation evolved into the same direction: By 2009 Central Europe was no longer its most important import source but this was overtaken by China and India; also the volume of C&T-labor directly embodied in C&T-imports from China and India increased for both countries (see Appendix 3: Table 9).
With respect to the development of less prominent trade relations, differences between Italy and Portugal are observable to a small dimension, whereas intertemporal changes were more significant. Moreover, by comparing international trade of directly embodied C&T-value added with that of directly embodied C&T-labor, it gets evident that intertem-poral changes in the latter variable in general were more pronounced for both case study countries. This shows, that even if the share of international trade of directly embodied C&T-labor decreased on a global scale relative to domestic trade, for Italy and Portugal trade patterns of this factor input were exposed to massive changes over the investigation period, whereas for C&T-value added the situation was relatively more stable.
3.2 Local restructuring: the perspective of Italy and Portugal
3.2.1 Italy’s and Portugal’s status in the C&T‑TNs
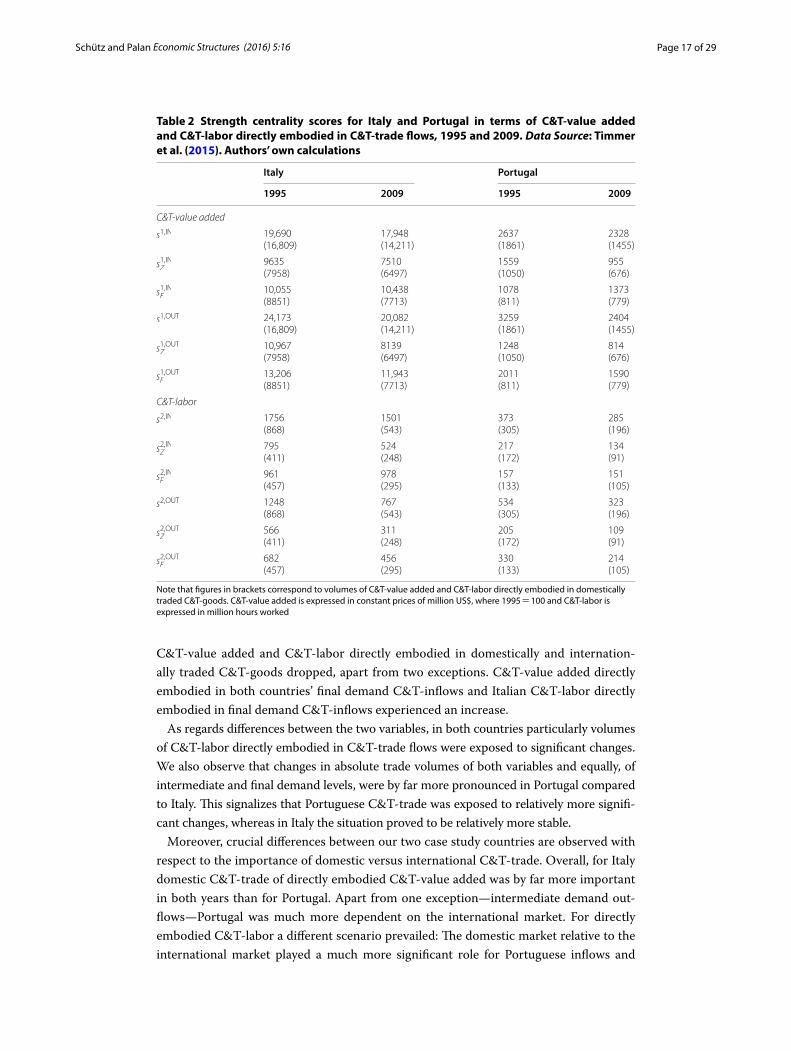
In a next step, we zoom into our networks and concentrate on country-specific patterns of restructuring of C&T-trade. Table 2 shows strength centrality scores for Italy and Portugal for 1995 and 2009. These figures provide information on the amount of C&T-value added and C&T-labor directly embodied in (1) total C&T-trade flows (both in- and out-flows), (2) intermediate and final demand C&T-goods and (3) domestic C&T-trade flows.11
Italy’s position in the networks was more central compared to Portugal’s in both years, which, however, is not surprising due to differences in scale between the two countries. In an international comparison, Italy in terms of both in- and outflows of directly embodied C&T-value added ranked among the top 5 in 1995 and its status got even more important. Compared to C&T-value added, in terms of C&T-labor directly embodied in C&T-outflows Italy had a lower status in the network but nevertheless got slightly more central. For C&T-labor directly embodied in C&T-inflows Italy expe-rienced the opposite change and its ranking position in 1995 was 10 and in 2009 the country ranked 11th. Portugal was ranked 18th (16th) in 1995 and 17th (14th) in 2009 with respect to C&T-value added directly embodied in C&T-inflows (-outflows). Portu-gal could also extend its status in the network in terms of C&T-labor directly embodied in both in- and outflows. Results of centrality positions of our two case study countries relative to other countries show that at least Italy in terms of C&T-value added directly embodied in C&T-outflows was a global player in the respective C&T-TN. On the con-trary, even if Portugal’s status increased it was less significant compared to other coun-tries. This, however, does not preclude that it’s C&T-industry was bound to a serious restructuring between the two years.
Apart from shifts in ranking positions for Italy and Portugal relative to other countries, both experienced substantial changes in volumes of C&T-value added and C&T-labor directly embodied in C&T-trade flows. As can be seen from Table 2, for both countries the direction of changes in absolute trade volumes was almost the same: Volumes of
11 See Appendix 3: Table 8 for strength centrality scores of other countries than Italy and Portugal.
Page 17 of 29Schütz and Palan Economic Structures (2016) 5:16
C&T-value added and C&T-labor directly embodied in domestically and internation-ally traded C&T-goods dropped, apart from two exceptions. C&T-value added directly embodied in both countries’ final demand C&T-inflows and Italian C&T-labor directly embodied in final demand C&T-inflows experienced an increase.
As regards differences between the two variables, in both countries particularly volumes of C&T-labor directly embodied in C&T-trade flows were exposed to significant changes. We also observe that changes in absolute trade volumes of both variables and equally, of intermediate and final demand levels, were by far more pronounced in Portugal compared to Italy. This signalizes that Portuguese C&T-trade was exposed to relatively more signifi-cant changes, whereas in Italy the situation proved to be relatively more stable.
Moreover, crucial differences between our two case study countries are observed with respect to the importance of domestic versus international C&T-trade. Overall, for Italy domestic C&T-trade of directly embodied C&T-value added was by far more important in both years than for Portugal. Apart from one exception—intermediate demand out-flows—Portugal was much more dependent on the international market. For directly embodied C&T-labor a different scenario prevailed: The domestic market relative to the international market played a much more significant role for Portuguese inflows and
Table 2 Strength centrality scores for Italy and Portugal in terms of C&T-value added and C&T-labor directly embodied in C&T-trade flows, 1995 and 2009. Data Source: Timmer et al. (2015). Authors’ own calculations
Note that figures in brackets correspond to volumes of C&T-value added and C&T-labor directly embodied in domestically traded C&T-goods. C&T-value added is expressed in constant prices of million US$, where 1995 = 100 and C&T-labor is expressed in million hours worked
Italy Portugal
1995 2009 1995 2009
C&T-value added
s1,IN 19,690(16,809)
17,948(14,211)
2637(1861)
2328(1455)
s1,INZ
9635(7958)
7510(6497)
1559(1050)
955(676)
s1,INF
10,055(8851)
10,438(7713)
1078(811)
1373(779)
s1,OUT 24,173(16,809)
20,082(14,211)
3259(1861)
2404(1455)
s1,OUTZ
10,967(7958)
8139(6497)
1248(1050)
814(676)
s1,OUTF
13,206(8851)
11,943(7713)
2011(811)
1590(779)
C&T-labor
s2,IN 1756(868)
1501(543)
373(305)
285(196)
s2,INZ
795(411)
524(248)
217(172)
134(91)
s2,INF
961(457)
978(295)
157(133)
151(105)
s2,OUT 1248(868)
767(543)
534(305)
323(196)
s2,OUTZ
566(411)
311(248)
205(172)
109(91)
s2,OUTF
682(457)
456(295)
330(133)
214(105)
Page 18 of 29Schütz and Palan Economic Structures (2016) 5:16
also for intermediate demand outflows. With respect to C&T-labor directly embodied in final demand C&T-outflows it was, however, again Italy, which was less open to the international market. As regards intertemporal changes, we observe that overall the importance of the domestic market relative to the international market in terms of C&T-value added and C&T-labor directly embodied in C&T-trade flows increased for C&T-outflows and decreased for C&T-inflows for both countries which gives a first hint that outsourcing activities took place. To sum up, our findings also indicate that the relative importance of the domestic versus the international market for directly embodied C&T-value added and C&T-labor could be a source of different degrees of vulnerability to the restructuring of C&T-trade in the two case study countries.
3.2.2 Import penetration and international outsourcing
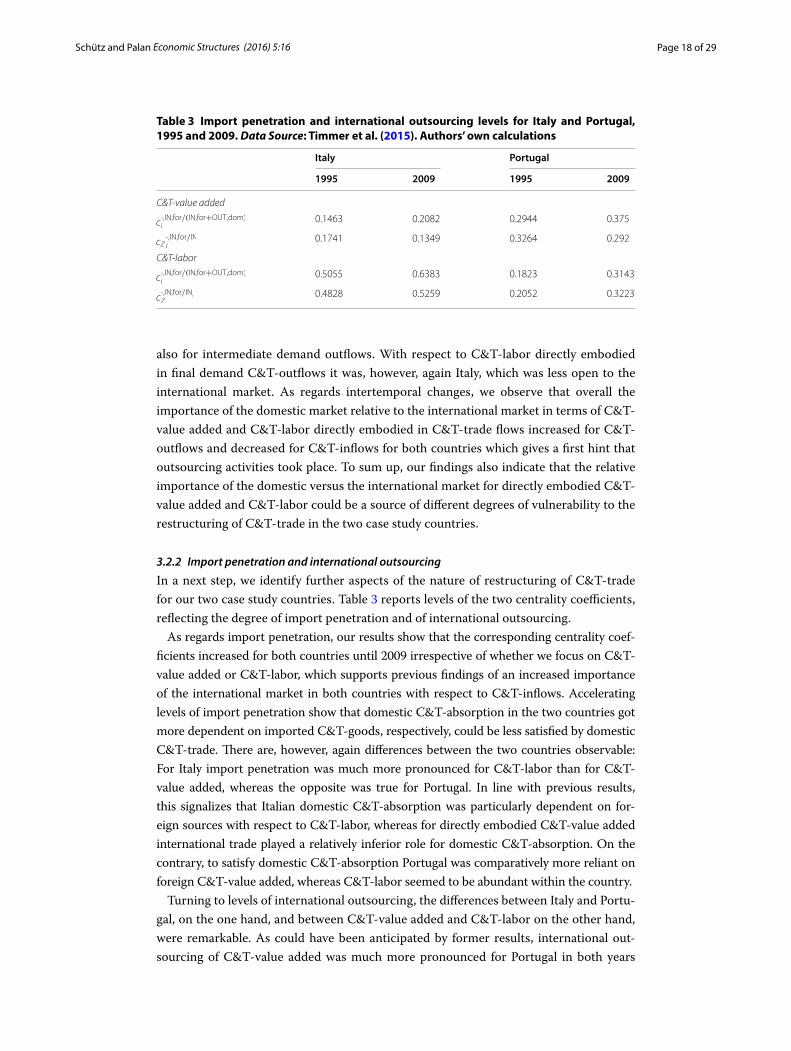
In a next step, we identify further aspects of the nature of restructuring of C&T-trade for our two case study countries. Table 3 reports levels of the two centrality coefficients, reflecting the degree of import penetration and of international outsourcing.
As regards import penetration, our results show that the corresponding centrality coef-ficients increased for both countries until 2009 irrespective of whether we focus on C&T-value added or C&T-labor, which supports previous findings of an increased importance of the international market in both countries with respect to C&T-inflows. Accelerating levels of import penetration show that domestic C&T-absorption in the two countries got more dependent on imported C&T-goods, respectively, could be less satisfied by domestic C&T-trade. There are, however, again differences between the two countries observable: For Italy import penetration was much more pronounced for C&T-labor than for C&T-value added, whereas the opposite was true for Portugal. In line with previous results, this signalizes that Italian domestic C&T-absorption was particularly dependent on for-eign sources with respect to C&T-labor, whereas for directly embodied C&T-value added international trade played a relatively inferior role for domestic C&T-absorption. On the contrary, to satisfy domestic C&T-absorption Portugal was comparatively more reliant on foreign C&T-value added, whereas C&T-labor seemed to be abundant within the country.
Turning to levels of international outsourcing, the differences between Italy and Portu-gal, on the one hand, and between C&T-value added and C&T-labor on the other hand, were remarkable. As could have been anticipated by former results, international out-sourcing of C&T-value added was much more pronounced for Portugal in both years
Table 3 Import penetration and international outsourcing levels for Italy and Portugal, 1995 and 2009. Data Source: Timmer et al. (2015). Authors’ own calculations
Italy Portugal
1995 2009 1995 2009
C&T-value added
c·,IN,for/(IN,for+OUT,dom)i
0.1463 0.2082 0.2944 0.375
cZ·,IN,for/INi
0.1741 0.1349 0.3264 0.292
C&T-labor
c·,IN,for/(IN,for+OUT,dom)i
0.5055 0.6383 0.1823 0.3143
c·,IN,for/INi
Z0.4828 0.5259 0.2052 0.3223
Page 19 of 29Schütz and Palan Economic Structures (2016) 5:16
than for Italy, whereas for C&T-labor it was the other way round. Hence, Portuguese intermediate C&T-demand built by far more on the international market with respect to directly embodied C&T-value added than was the case for Italy. In contrast, Italy out-sourced the C&T-labor required for its C&T-production activities to a higher degree. Noteworthy, for both countries outsourcing of C&T-value added decreased until 2009 and together with the observation that Portuguese and Italian international outsourcing of C&T-labor increased also slightly, this indicates that C&T-production in both coun-tries got more productive.
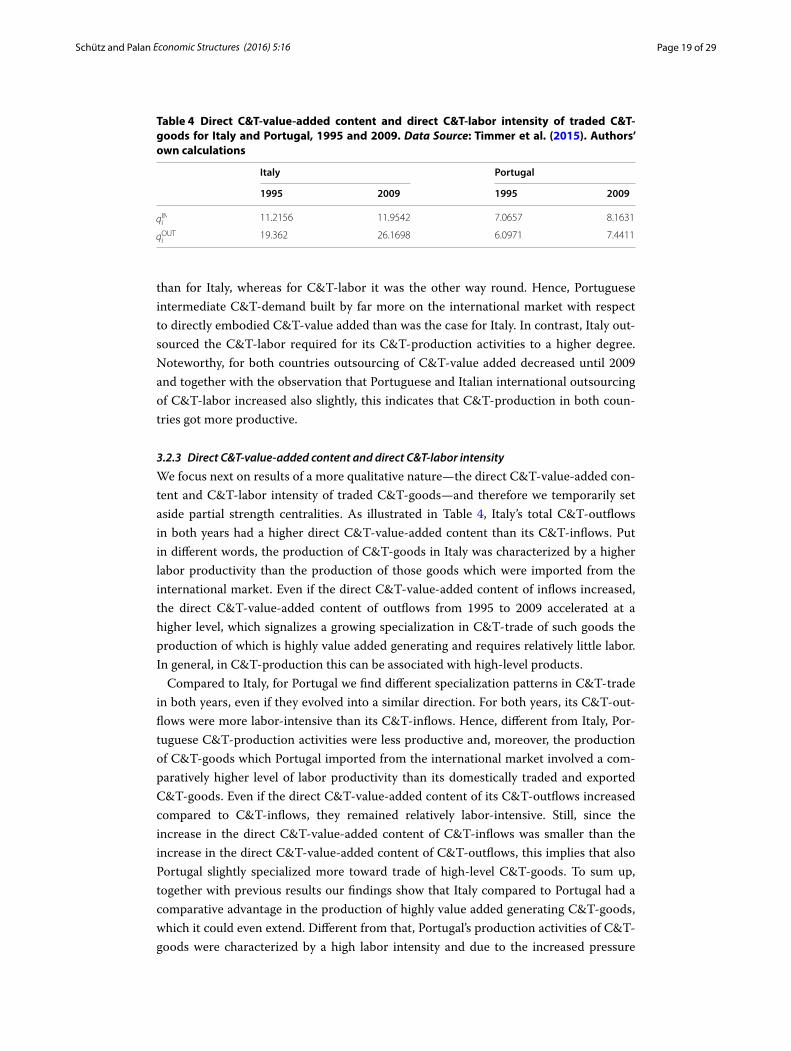
3.2.3 Direct C&T‑value‑added content and direct C&T‑labor intensity
We focus next on results of a more qualitative nature—the direct C&T-value-added con-tent and C&T-labor intensity of traded C&T-goods—and therefore we temporarily set aside partial strength centralities. As illustrated in Table 4, Italy’s total C&T-outflows in both years had a higher direct C&T-value-added content than its C&T-inflows. Put in different words, the production of C&T-goods in Italy was characterized by a higher labor productivity than the production of those goods which were imported from the international market. Even if the direct C&T-value-added content of inflows increased, the direct C&T-value-added content of outflows from 1995 to 2009 accelerated at a higher level, which signalizes a growing specialization in C&T-trade of such goods the production of which is highly value added generating and requires relatively little labor. In general, in C&T-production this can be associated with high-level products.
Compared to Italy, for Portugal we find different specialization patterns in C&T-trade in both years, even if they evolved into a similar direction. For both years, its C&T-out-flows were more labor-intensive than its C&T-inflows. Hence, different from Italy, Por-tuguese C&T-production activities were less productive and, moreover, the production of C&T-goods which Portugal imported from the international market involved a com-paratively higher level of labor productivity than its domestically traded and exported C&T-goods. Even if the direct C&T-value-added content of its C&T-outflows increased compared to C&T-inflows, they remained relatively labor-intensive. Still, since the increase in the direct C&T-value-added content of C&T-inflows was smaller than the increase in the direct C&T-value-added content of C&T-outflows, this implies that also Portugal slightly specialized more toward trade of high-level C&T-goods. To sum up, together with previous results our findings show that Italy compared to Portugal had a comparative advantage in the production of highly value added generating C&T-goods, which it could even extend. Different from that, Portugal’s production activities of C&T-goods were characterized by a high labor intensity and due to the increased pressure
Table 4 Direct C&T-value-added content and direct C&T-labor intensity of traded C&T-goods for Italy and Portugal, 1995 and 2009. Data Source: Timmer et al. (2015). Authors’ own calculations
Italy Portugal
1995 2009 1995 2009
qINi 11.2156 11.9542 7.0657 8.1631
qOUTi19.362 26.1698 6.0971 7.4411
Page 20 of 29Schütz and Palan Economic Structures (2016) 5:16
from low-wage countries this comparative advantage deteriorated and severe effects on C&T-employment prevailed within the country.
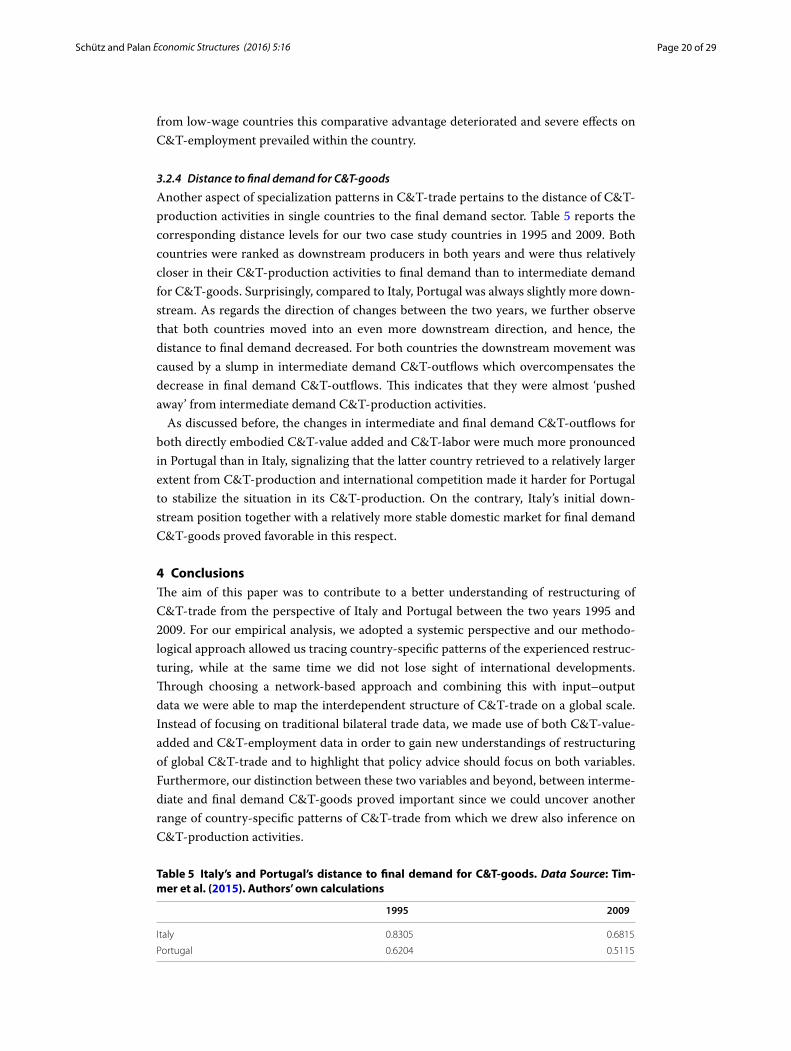
3.2.4 Distance to final demand for C&T‑goods
Another aspect of specialization patterns in C&T-trade pertains to the distance of C&T-production activities in single countries to the final demand sector. Table 5 reports the corresponding distance levels for our two case study countries in 1995 and 2009. Both countries were ranked as downstream producers in both years and were thus relatively closer in their C&T-production activities to final demand than to intermediate demand for C&T-goods. Surprisingly, compared to Italy, Portugal was always slightly more down-stream. As regards the direction of changes between the two years, we further observe that both countries moved into an even more downstream direction, and hence, the distance to final demand decreased. For both countries the downstream movement was caused by a slump in intermediate demand C&T-outflows which overcompensates the decrease in final demand C&T-outflows. This indicates that they were almost ‘pushed away’ from intermediate demand C&T-production activities.
As discussed before, the changes in intermediate and final demand C&T-outflows for both directly embodied C&T-value added and C&T-labor were much more pronounced in Portugal than in Italy, signalizing that the latter country retrieved to a relatively larger extent from C&T-production and international competition made it harder for Portugal to stabilize the situation in its C&T-production. On the contrary, Italy’s initial down-stream position together with a relatively more stable domestic market for final demand C&T-goods proved favorable in this respect.
4 ConclusionsThe aim of this paper was to contribute to a better understanding of restructuring of C&T-trade from the perspective of Italy and Portugal between the two years 1995 and 2009. For our empirical analysis, we adopted a systemic perspective and our methodo-logical approach allowed us tracing country-specific patterns of the experienced restruc-turing, while at the same time we did not lose sight of international developments. Through choosing a network-based approach and combining this with input–output data we were able to map the interdependent structure of C&T-trade on a global scale. Instead of focusing on traditional bilateral trade data, we made use of both C&T-value-added and C&T-employment data in order to gain new understandings of restructuring of global C&T-trade and to highlight that policy advice should focus on both variables. Furthermore, our distinction between these two variables and beyond, between interme-diate and final demand C&T-goods proved important since we could uncover another range of country-specific patterns of C&T-trade from which we drew also inference on C&T-production activities.
Table 5 Italy’s and Portugal’s distance to final demand for C&T-goods. Data Source: Tim-mer et al. (2015). Authors’ own calculations
1995 2009
Italy 0.8305 0.6815
Portugal 0.6204 0.5115
Page 21 of 29Schütz and Palan Economic Structures (2016) 5:16
Our findings show that in an international context the C&T-industry became more concentrated in absolute and in relative terms and also with regard to both variables, C&T-value added and C&T-labor. The changes in global production patterns and the substantial reallocations toward low-wage countries in our sample, namely China and India, are noteworthy. Hence, restructuring of global C&T-trade between the two years 1995 and 2009 involved inter alia a growing dependence of global C&T-demand on C&T-goods being produced in China and India. Going alongside with an increased importance of these two countries in the global C&T-TNs—each country could either maintain its leading centrality position or even extend its status. Moreover, this regional block got more productive, signalizing that also the character of the C&T-goods which sourced from these two countries did change and C&T-production activities became slightly more value added generating and less labor-intensive. Nevertheless, the lead-ing positions in labor productivity on a global scale, which partly were also extended, were bound to ‘traditional’ C&T-producing countries. This shows that high-wage coun-tries increasingly came under pressure mainly in those C&T-production activities which could be easily transferred to low-wage countries, i.e., labor-intensive C&T-production tasks. Yet, those C&T-production activities which are ‘highly’ productive and generate high C&T-value added could be maintained relatively more easily. This is confirmed if one glances at international C&T-trade patterns only, where it became evident that for C&T-value added proximity played a much more significant role than for C&T-labor and this factor input could thus relatively more easily be traded internationally.
Focusing on the situation in Portugal and Italy, our results revealed both similarities and differences in the nature of restructuring of C&T-trade between them. Both were characterized by a growing dependence on the international market with respect to C&T-inflows, reflecting in increased import penetration and international outsourcing. It is remarkable that the differences in specialization between Italian and Portuguese C&T-trade were quite significant and remained so over the investigation period, sig-nalizing a high path-dependency of C&T-production in these two countries. The posi-tion of Italy in this respect seemed to be the more sustainable and more rewarding one, however. For Italy our findings show that the production of labor-intensive C&T-goods was outsourced to other countries at a higher scale, whereas production activities of C&T-goods which are highly value added generating remained relatively more within the country. On the contrary, for Portugal which was relatively more engaged in trade of labor-intensive C&T-goods, the competition from low-wage countries was ever becom-ing fiercer and thus had a direct negative impact on the generation of C&T-value added as well. Moreover, Portugal was not able to move sufficiently toward a more value added oriented way of C&T-production and together with comparatively less stable domestic C&T-trade in this respect, this made the country vulnerable and to suffer a lot under the restructuring of C&T-trade. Last it has to be kept in mind that Italy had easier access to its trading partners compared to Portugal as trade costs for Portugal on average were twice as high than for Italy. Thus, irrespective of the economic policy undertaken, the level of trade costs proves to be a crucial factor as well.
Based on the empirical evidence we conclude that C&T-producing firms in both countries can only stabilize their situation if they are productive, innovative, and able to modernize their production. While Italy seemed to proceed into the right direction,
Page 22 of 29Schütz and Palan Economic Structures (2016) 5:16
Portugal’s situation constitutes a textbook example of the negative effects of restructur-ing processes. We suggest that stabilizing the situation in Italy and Portugal requires tak-ing country-specific action. As an essential precondition for effective policy-design we consider the identification of country-specific patterns of C&T-trade and beyond, their relation to international developments, as were identified in this paper.
AcknowledgementsThis article was funded by the Austrian Science Fund (FWF) under Grant P24915-G11: “Diffusion Processes in economic systems” and supported by funds of the Oesterreichische Nationalbank, Anniversary Fund, Project No. 15482. The authors like to thank the FWF and the Oesterreichische Nationalbank for financial support. Furthermore, we are grateful to Jacques Thisse, Henryk Gurgul, and Heinz D. Kurz for fruitful discussions on earlier drafts of this paper as well as to Nadia Simoes and Nuno Crespo for helpful comments. Our thanks go to Benjamin Marussig and Stefan Palan for supporting us in this work. Finally, we like to thank two anonymous referees for their valuable hints on how to improve the paper.
Competing interestsBoth authors declare that they have no competing interests.
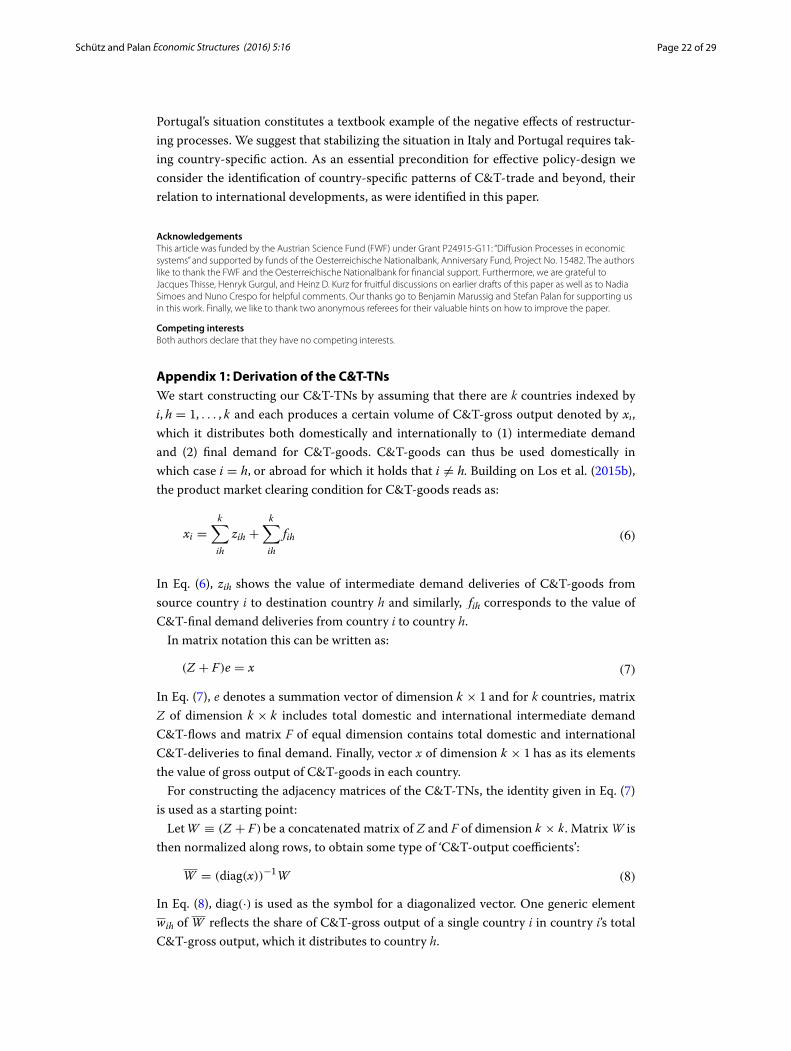
Appendix 1: Derivation of the C&T-TNsWe start constructing our C&T-TNs by assuming that there are k countries indexed by i, h = 1, . . . , k and each produces a certain volume of C&T-gross output denoted by xi , which it distributes both domestically and internationally to (1) intermediate demand and (2) final demand for C&T-goods. C&T-goods can thus be used domestically in which case i = h, or abroad for which it holds that i �= h. Building on Los et al. (2015b), the product market clearing condition for C&T-goods reads as:
In Eq. (6), zih shows the value of intermediate demand deliveries of C&T-goods from source country i to destination country h and similarly, fih corresponds to the value of C&T-final demand deliveries from country i to country h.
In matrix notation this can be written as:
In Eq. (7), e denotes a summation vector of dimension k × 1 and for k countries, matrix Z of dimension k × k includes total domestic and international intermediate demand C&T-flows and matrix F of equal dimension contains total domestic and international C&T-deliveries to final demand. Finally, vector x of dimension k × 1 has as its elements the value of gross output of C&T-goods in each country.
For constructing the adjacency matrices of the C&T-TNs, the identity given in Eq. (7) is used as a starting point:
Let W ≡ (Z + F) be a concatenated matrix of Z and F of dimension k × k. Matrix W is then normalized along rows, to obtain some type of ‘C&T-output coefficients’:
In Eq. (8), diag(·) is used as the symbol for a diagonalized vector. One generic element wih of W reflects the share of C&T-gross output of a single country i in country i’s total C&T-gross output, which it distributes to country h.
(6)xi =
k∑
ih
zih +
k∑
ih
fih
(7)(Z + F)e = x
(8)W = (diag(x))−1W
Page 23 of 29Schütz and Palan Economic Structures (2016) 5:16
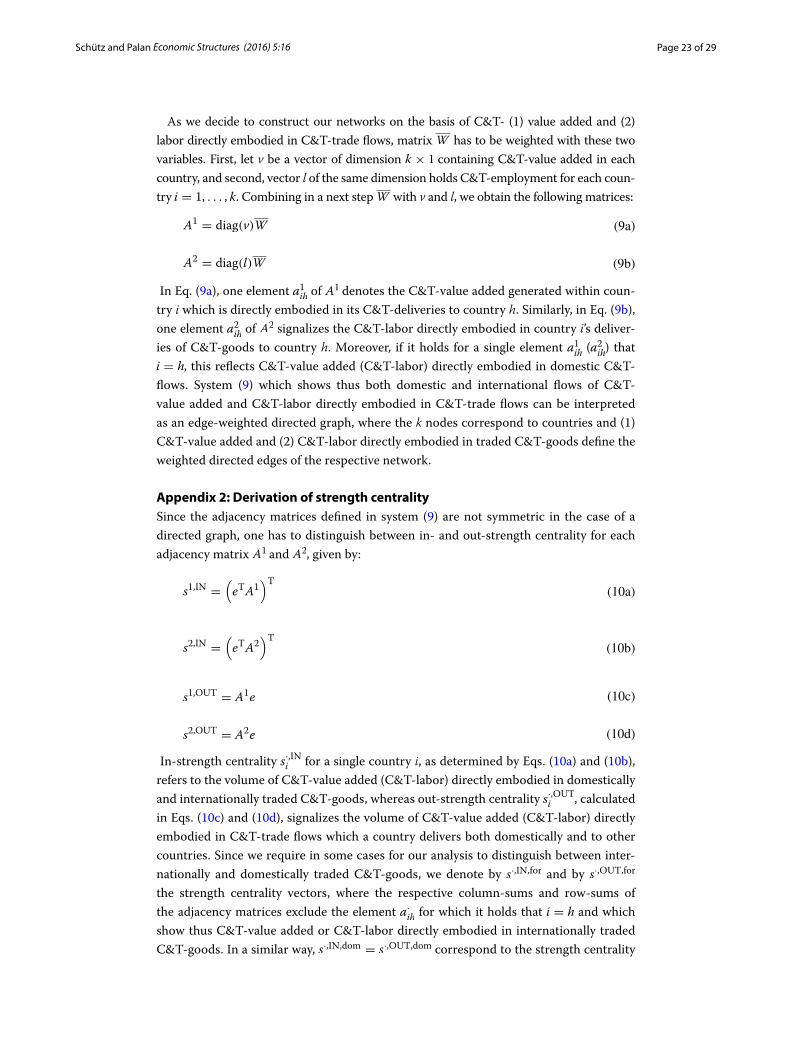
As we decide to construct our networks on the basis of C&T- (1) value added and (2) labor directly embodied in C&T-trade flows, matrix W has to be weighted with these two variables. First, let v be a vector of dimension k × 1 containing C&T-value added in each country, and second, vector l of the same dimension holds C&T-employment for each coun-try i = 1, . . . , k. Combining in a next step W with v and l, we obtain the following matrices:
In Eq. (9a), one element a1ih of A1 denotes the C&T-value added generated within coun-try i which is directly embodied in its C&T-deliveries to country h. Similarly, in Eq. (9b), one element a2ih of A2 signalizes the C&T-labor directly embodied in country i’s deliver-ies of C&T-goods to country h. Moreover, if it holds for a single element a1ih (a
2ih) that
i = h, this reflects C&T-value added (C&T-labor) directly embodied in domestic C&T-flows. System (9) which shows thus both domestic and international flows of C&T-value added and C&T-labor directly embodied in C&T-trade flows can be interpreted as an edge-weighted directed graph, where the k nodes correspond to countries and (1) C&T-value added and (2) C&T-labor directly embodied in traded C&T-goods define the weighted directed edges of the respective network.
Appendix 2: Derivation of strength centralitySince the adjacency matrices defined in system (9) are not symmetric in the case of a directed graph, one has to distinguish between in- and out-strength centrality for each adjacency matrix A1 and A2, given by:
In-strength centrality s·,INi for a single country i, as determined by Eqs. (10a) and (10b), refers to the volume of C&T-value added (C&T-labor) directly embodied in domestically and internationally traded C&T-goods, whereas out-strength centrality s·,OUT
i , calculated in Eqs. (10c) and (10d), signalizes the volume of C&T-value added (C&T-labor) directly embodied in C&T-trade flows which a country delivers both domestically and to other countries. Since we require in some cases for our analysis to distinguish between inter-nationally and domestically traded C&T-goods, we denote by s·,IN,for and by s·,OUT,for the strength centrality vectors, where the respective column-sums and row-sums of the adjacency matrices exclude the element a·ih for which it holds that i = h and which show thus C&T-value added or C&T-labor directly embodied in internationally traded C&T-goods. In a similar way, s·,IN,dom = s·,OUT,dom correspond to the strength centrality
(9a)A1 = diag(v)W
(9b)A2 = diag(l)W
(10a)s1,IN =
(
eTA1)T
(10b)s2,IN =
(
eTA2)T
(10c)s1,OUT = A1e
(10d)s2,OUT = A2e
Page 24 of 29Schütz and Palan Economic Structures (2016) 5:16
vectors which include C&T-value added and C&T-labor, directly embodied in domesti-cally traded C&T-goods.
Appendix 3See Tables 6, 7, 8 and 9.
Table 6 Manufacturing Sector—Industry Classification. Source: World Input-Output Data-base, www.wiod.org
ISIC Rev.3 Code Industry
15t16 Food, beverages and tobacco
17t18 Textiles and textile products
19 Leather, leather and footwear
20 Wood and products of wood and cork
21t22 Pulp, paper, printing and publishing
23 Coke, refined petroleum and nuclear fuel
24 Chemicals and chemical products
25 Rubber and plastics
26 Other non-metallic mineral
27t28 Basic metals and fabricated metal
29 Machinery, nec
30t33 Electrical and optical equipment
34t35 Transport equipment
36t37 Manufacturing, nec; recycling
Table 7 Trade costs for Italy and Portugal with regional blocks, 1995 and 2009. Note that the coefficients of variation for the respective clubs are reported in brackets. Missing data for 1995 were estimated by using data from 1996 and 1997. Data for Taiwan are not available, therefore data for China were taken as a proxy. Data source: ESCAP World Bank (2015)
Italy Portugal
1995 2009 1995 2009
World 102.01 87.36 208.46 183.03
(.30) (.34) (.33) (.28)
CE 64.63 56.44 97.50 82.36
(.10) (.27) (.22) (.35)
PWNE 87.06 86.42 130.29 107.93
(.20) (.09) (.23) (.41)
PEE 98.46 62.82 210.20 118.68
(.08) (.20) (.08) (.29)
EAPR 126.83 122.89 232.56 194.56
(.04) (.14) (.21) (.17)
BEC 144.38 101.53 230.91 167.79
(.17) (.22) (.27) (.18)
A 120.71 119.62 235.58 196.01
(.18) (.13) (.20) (.10)
CI 126.32 108.71 256.67 206.10
(.04) (.07) (.15) (.21)
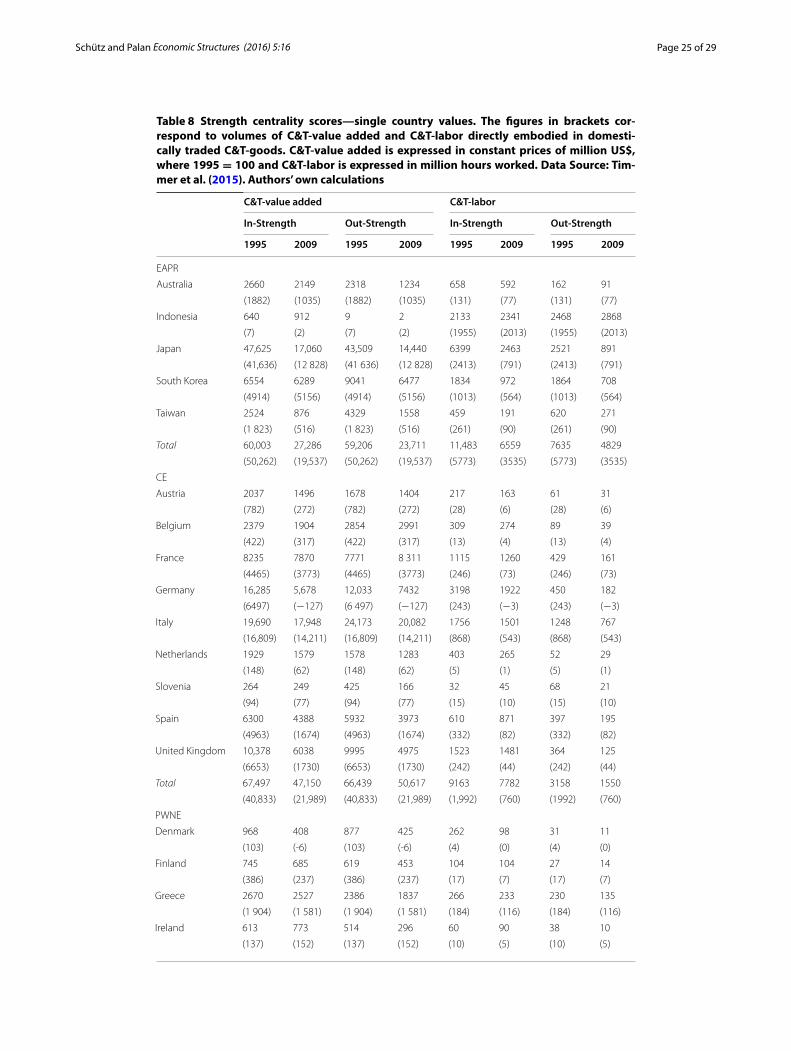
Page 25 of 29Schütz and Palan Economic Structures (2016) 5:16
Table 8 Strength centrality scores—single country values. The figures in brackets cor-respond to volumes of C&T-value added and C&T-labor directly embodied in domesti-cally traded C&T-goods. C&T-value added is expressed in constant prices of million US$, where 1995 = 100 and C&T-labor is expressed in million hours worked. Data Source: Tim-mer et al. (2015). Authors’ own calculations
C&T‑value added C&T‑labor
In‑Strength Out‑Strength In‑Strength Out‑Strength
1995 2009 1995 2009 1995 2009 1995 2009
EAPR
Australia 2660 2149 2318 1234 658 592 162 91
(1882) (1035) (1882) (1035) (131) (77) (131) (77)
Indonesia 640 912 9 2 2133 2341 2468 2868
(7) (2) (7) (2) (1955) (2013) (1955) (2013)
Japan 47,625 17,060 43,509 14,440 6399 2463 2521 891
(41,636) (12 828) (41 636) (12 828) (2413) (791) (2413) (791)
South Korea 6554 6289 9041 6477 1834 972 1864 708
(4914) (5156) (4914) (5156) (1013) (564) (1013) (564)
Taiwan 2524 876 4329 1558 459 191 620 271
(1 823) (516) (1 823) (516) (261) (90) (261) (90)
Total 60,003 27,286 59,206 23,711 11,483 6559 7635 4829
(50,262) (19,537) (50,262) (19,537) (5773) (3535) (5773) (3535)
CE
Austria 2037 1496 1678 1404 217 163 61 31
(782) (272) (782) (272) (28) (6) (28) (6)
Belgium 2379 1904 2854 2991 309 274 89 39
(422) (317) (422) (317) (13) (4) (13) (4)
France 8235 7870 7771 8 311 1115 1260 429 161
(4465) (3773) (4465) (3773) (246) (73) (246) (73)
Germany 16,285 5,678 12,033 7432 3198 1922 450 182
(6497) (−127) (6 497) (−127) (243) (−3) (243) (−3)
Italy 19,690 17,948 24,173 20,082 1756 1501 1248 767
(16,809) (14,211) (16,809) (14,211) (868) (543) (868) (543)
Netherlands 1929 1579 1578 1283 403 265 52 29
(148) (62) (148) (62) (5) (1) (5) (1)
Slovenia 264 249 425 166 32 45 68 21
(94) (77) (94) (77) (15) (10) (15) (10)
Spain 6300 4388 5932 3973 610 871 397 195
(4963) (1674) (4963) (1674) (332) (82) (332) (82)
United Kingdom 10,378 6038 9995 4975 1523 1481 364 125
(6653) (1730) (6653) (1730) (242) (44) (242) (44)
Total 67,497 47,150 66,439 50,617 9163 7782 3158 1550
(40,833) (21,989) (40,833) (21,989) (1,992) (760) (1992) (760)
PWNE
Denmark 968 408 877 425 262 98 31 11
(103) (-6) (103) (-6) (4) (0) (4) (0)
Finland 745 685 619 453 104 104 27 14
(386) (237) (386) (237) (17) (7) (17) (7)
Greece 2670 2527 2386 1837 266 233 230 135
(1 904) (1 581) (1 904) (1 581) (184) (116) (184) (116)
Ireland 613 773 514 296 60 90 38 10
(137) (152) (137) (152) (10) (5) (10) (5)
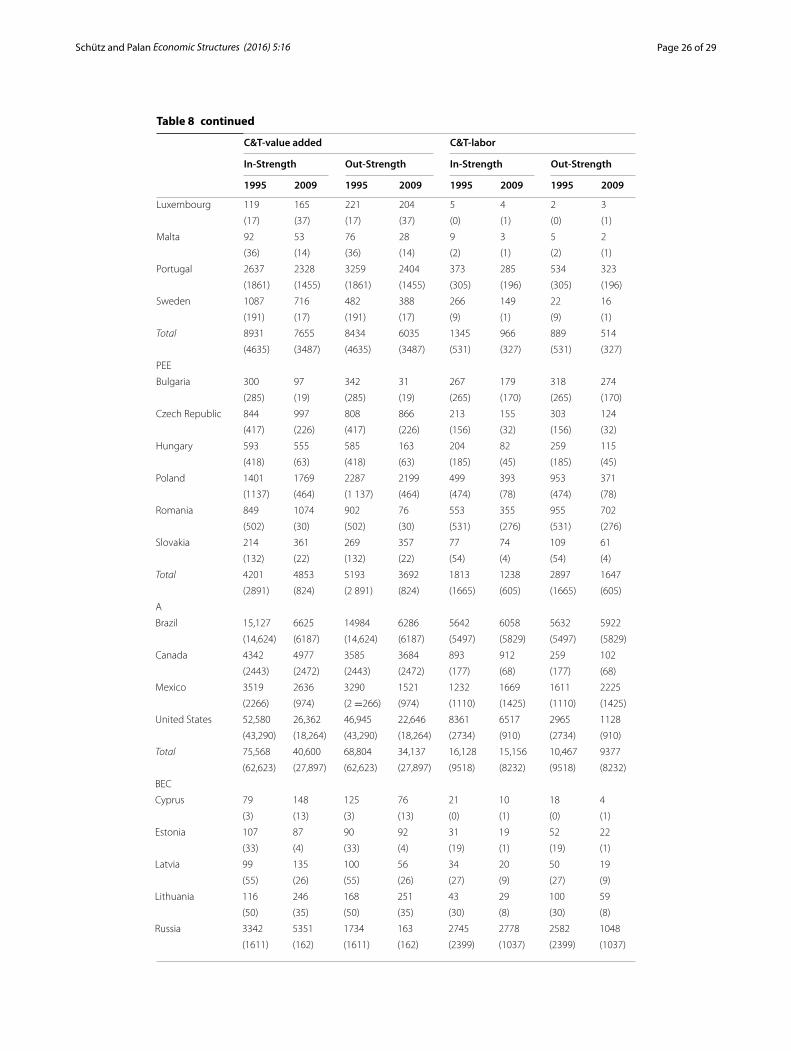
Page 26 of 29Schütz and Palan Economic Structures (2016) 5:16
Table 8 continued
C&T‑value added C&T‑labor
In‑Strength Out‑Strength In‑Strength Out‑Strength
1995 2009 1995 2009 1995 2009 1995 2009
Luxembourg 119 165 221 204 5 4 2 3
(17) (37) (17) (37) (0) (1) (0) (1)
Malta 92 53 76 28 9 3 5 2
(36) (14) (36) (14) (2) (1) (2) (1)
Portugal 2637 2328 3259 2404 373 285 534 323
(1861) (1455) (1861) (1455) (305) (196) (305) (196)
Sweden 1087 716 482 388 266 149 22 16
(191) (17) (191) (17) (9) (1) (9) (1)
Total 8931 7655 8434 6035 1345 966 889 514
(4635) (3487) (4635) (3487) (531) (327) (531) (327)
PEE
Bulgaria 300 97 342 31 267 179 318 274
(285) (19) (285) (19) (265) (170) (265) (170)
Czech Republic 844 997 808 866 213 155 303 124
(417) (226) (417) (226) (156) (32) (156) (32)
Hungary 593 555 585 163 204 82 259 115
(418) (63) (418) (63) (185) (45) (185) (45)
Poland 1401 1769 2287 2199 499 393 953 371
(1137) (464) (1 137) (464) (474) (78) (474) (78)
Romania 849 1074 902 76 553 355 955 702
(502) (30) (502) (30) (531) (276) (531) (276)
Slovakia 214 361 269 357 77 74 109 61
(132) (22) (132) (22) (54) (4) (54) (4)
Total 4201 4853 5193 3692 1813 1238 2897 1647
(2891) (824) (2 891) (824) (1665) (605) (1665) (605)
A
Brazil 15,127 6625 14984 6286 5642 6058 5632 5922
(14,624) (6187) (14,624) (6187) (5497) (5829) (5497) (5829)
Canada 4342 4977 3585 3684 893 912 259 102
(2443) (2472) (2443) (2472) (177) (68) (177) (68)
Mexico 3519 2636 3290 1521 1232 1669 1611 2225
(2266) (974) (2 =266) (974) (1110) (1425) (1110) (1425)
United States 52,580 26,362 46,945 22,646 8361 6517 2965 1128
(43,290) (18,264) (43,290) (18,264) (2734) (910) (2734) (910)
Total 75,568 40,600 68,804 34,137 16,128 15,156 10,467 9377
(62,623) (27,897) (62,623) (27,897) (9518) (8232) (9518) (8232)
BEC
Cyprus 79 148 125 76 21 10 18 4
(3) (13) (3) (13) (0) (1) (0) (1)
Estonia 107 87 90 92 31 19 52 22
(33) (4) (33) (4) (19) (1) (19) (1)
Latvia 99 135 100 56 34 20 50 19
(55) (26) (55) (26) (27) (9) (27) (9)
Lithuania 116 246 168 251 43 29 100 59
(50) (35) (50) (35) (30) (8) (30) (8)
Russia 3342 5351 1734 163 2745 2778 2582 1048
(1611) (162) (1611) (162) (2399) (1037) (2399) (1037)
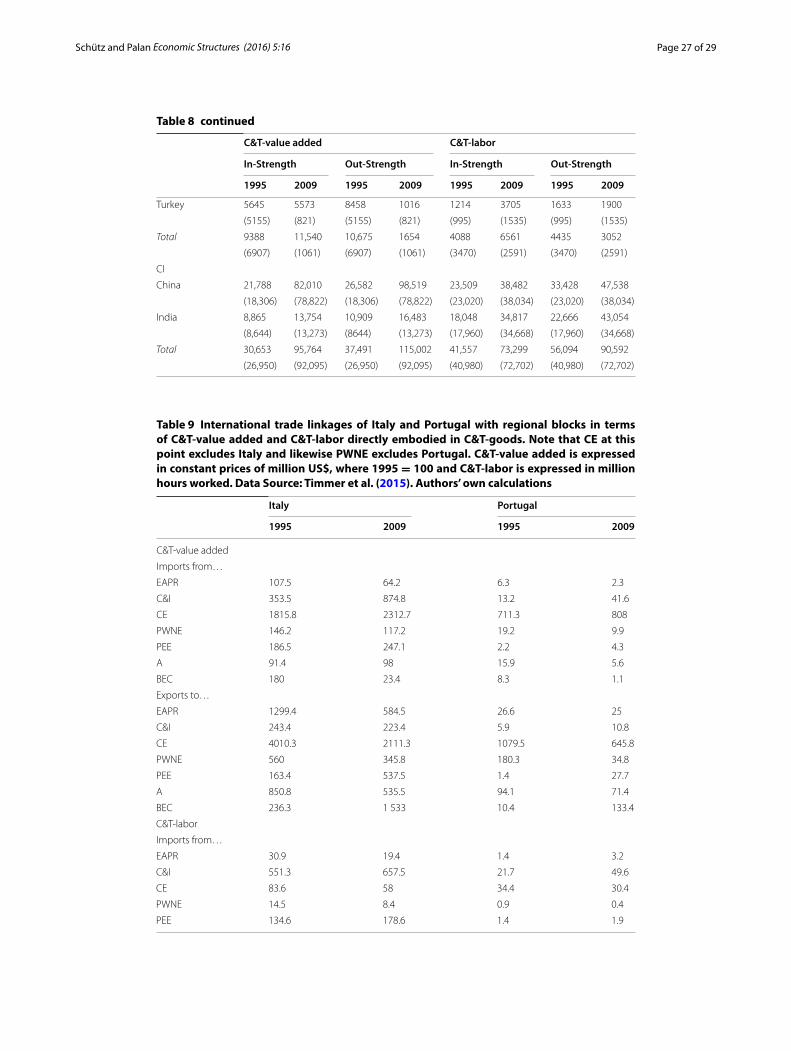
Page 27 of 29Schütz and Palan Economic Structures (2016) 5:16
Table 8 continued
C&T‑value added C&T‑labor
In‑Strength Out‑Strength In‑Strength Out‑Strength
1995 2009 1995 2009 1995 2009 1995 2009
Turkey 5645 5573 8458 1016 1214 3705 1633 1900
(5155) (821) (5155) (821) (995) (1535) (995) (1535)
Total 9388 11,540 10,675 1654 4088 6561 4435 3052
(6907) (1061) (6907) (1061) (3470) (2591) (3470) (2591)
CI
China 21,788 82,010 26,582 98,519 23,509 38,482 33,428 47,538
(18,306) (78,822) (18,306) (78,822) (23,020) (38,034) (23,020) (38,034)
India 8,865 13,754 10,909 16,483 18,048 34,817 22,666 43,054
(8,644) (13,273) (8644) (13,273) (17,960) (34,668) (17,960) (34,668)
Total 30,653 95,764 37,491 115,002 41,557 73,299 56,094 90,592
(26,950) (92,095) (26,950) (92,095) (40,980) (72,702) (40,980) (72,702)
Table 9 International trade linkages of Italy and Portugal with regional blocks in terms of C&T-value added and C&T-labor directly embodied in C&T-goods. Note that CE at this point excludes Italy and likewise PWNE excludes Portugal. C&T-value added is expressed in constant prices of million US$, where 1995 = 100 and C&T-labor is expressed in million hours worked. Data Source: Timmer et al. (2015). Authors’ own calculations
Italy Portugal
1995 2009 1995 2009
C&T-value added
Imports from…
EAPR 107.5 64.2 6.3 2.3
C&I 353.5 874.8 13.2 41.6
CE 1815.8 2312.7 711.3 808
PWNE 146.2 117.2 19.2 9.9
PEE 186.5 247.1 2.2 4.3
A 91.4 98 15.9 5.6
BEC 180 23.4 8.3 1.1
Exports to…
EAPR 1299.4 584.5 26.6 25
C&I 243.4 223.4 5.9 10.8
CE 4010.3 2111.3 1079.5 645.8
PWNE 560 345.8 180.3 34.8
PEE 163.4 537.5 1.4 27.7
A 850.8 535.5 94.1 71.4
BEC 236.3 1 533 10.4 133.4
C&T-labor
Imports from…
EAPR 30.9 19.4 1.4 3.2
C&I 551.3 657.5 21.7 49.6
CE 83.6 58 34.4 30.4
PWNE 14.5 8.4 0.9 0.4
PEE 134.6 178.6 1.4 1.9
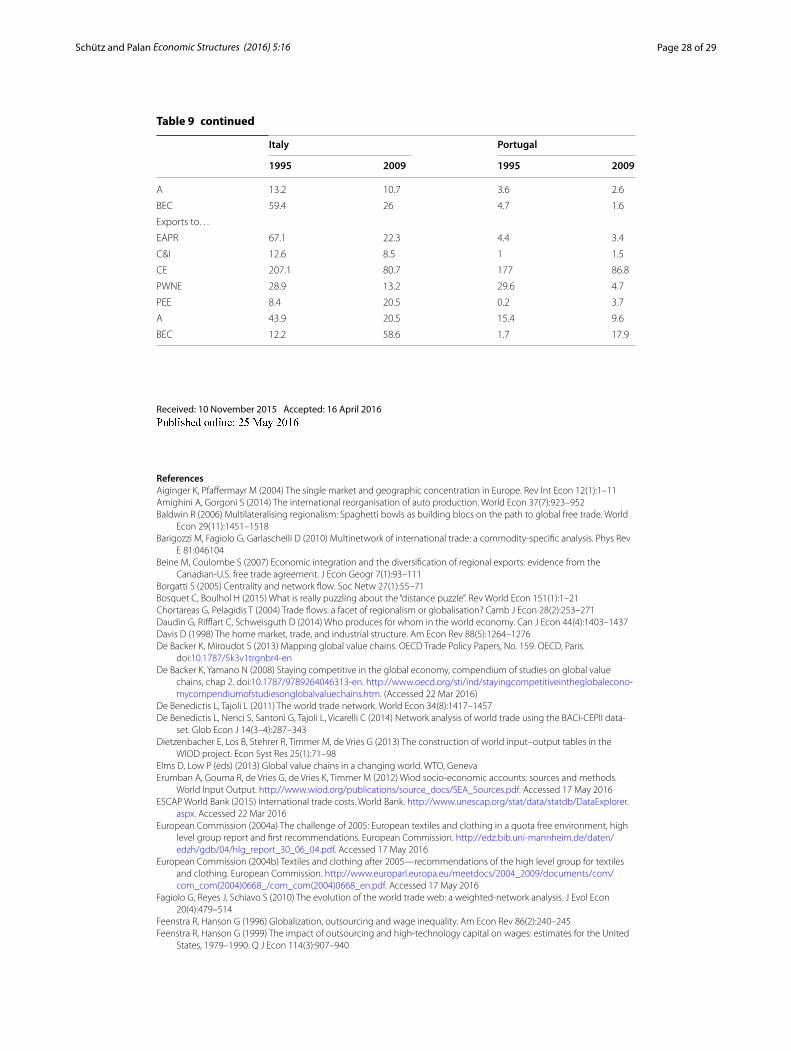
Page 28 of 29Schütz and Palan Economic Structures (2016) 5:16
Received: 10 November 2015 Accepted: 16 April 2016
ReferencesAiginger K, Pfaffermayr M (2004) The single market and geographic concentration in Europe. Rev Int Econ 12(1):1–11Amighini A, Gorgoni S (2014) The international reorganisation of auto production. World Econ 37(7):923–952Baldwin R (2006) Multilateralising regionalism: Spaghetti bowls as building blocs on the path to global free trade. World
Econ 29(11):1451–1518Barigozzi M, Fagiolo G, Garlaschelli D (2010) Multinetwork of international trade: a commodity-specific analysis. Phys Rev
E 81:046104Beine M, Coulombe S (2007) Economic integration and the diversification of regional exports: evidence from the
Canadian-U.S. free trade agreement. J Econ Geogr 7(1):93–111Borgatti S (2005) Centrality and network flow. Soc Netw 27(1):55–71Bosquet C, Boulhol H (2015) What is really puzzling about the “distance puzzle”. Rev World Econ 151(1):1–21Chortareas G, Pelagidis T (2004) Trade flows: a facet of regionalism or globalisation? Camb J Econ 28(2):253–271Daudin G, Rifflart C, Schweisguth D (2014) Who produces for whom in the world economy. Can J Econ 44(4):1403–1437Davis D (1998) The home market, trade, and industrial structure. Am Econ Rev 88(5):1264–1276De Backer K, Miroudot S (2013) Mapping global value chains. OECD Trade Policy Papers, No. 159. OECD, Paris.
doi:10.1787/5k3v1trgnbr4-enDe Backer K, Yamano N (2008) Staying competitive in the global economy, compendium of studies on global value
chains, chap 2. doi:10.1787/9789264046313-en. http://www.oecd.org/sti/ind/stayingcompetitiveintheglobalecono-mycompendiumofstudiesonglobalvaluechains.htm. (Accessed 22 Mar 2016)
De Benedictis L, Tajoli L (2011) The world trade network. World Econ 34(8):1417–1457De Benedictis L, Nenci S, Santoni G, Tajoli L, Vicarelli C (2014) Network analysis of world trade using the BACI-CEPII data-
set. Glob Econ J 14(3–4):287–343Dietzenbacher E, Los B, Stehrer R, Timmer M, de Vries G (2013) The construction of world input–output tables in the
WIOD project. Econ Syst Res 25(1):71–98Elms D, Low P (eds) (2013) Global value chains in a changing world. WTO, GenevaErumban A, Gouma R, de Vries G, de Vries K, Timmer M (2012) Wiod socio-economic accounts: sources and methods.
World Input Output. http://www.wiod.org/publications/source_docs/SEA_Sources.pdf. Accessed 17 May 2016ESCAP World Bank (2015) International trade costs. World Bank. http://www.unescap.org/stat/data/statdb/DataExplorer.
aspx. Accessed 22 Mar 2016European Commission (2004a) The challenge of 2005: European textiles and clothing in a quota free environment, high
level group report and first recommendations. European Commission. http://edz.bib.uni-mannheim.de/daten/edzh/gdb/04/hlg_report_30_06_04.pdf. Accessed 17 May 2016
European Commission (2004b) Textiles and clothing after 2005—recommendations of the high level group for textiles and clothing. European Commission. http://www.europarl.europa.eu/meetdocs/2004_2009/documents/com/com_com(2004)0668_/com_com(2004)0668_en.pdf. Accessed 17 May 2016
Fagiolo G, Reyes J, Schiavo S (2010) The evolution of the world trade web: a weighted-network analysis. J Evol Econ 20(4):479–514
Feenstra R, Hanson G (1996) Globalization, outsourcing and wage inequality. Am Econ Rev 86(2):240–245Feenstra R, Hanson G (1999) The impact of outsourcing and high-technology capital on wages: estimates for the United
States, 1979–1990. Q J Econ 114(3):907–940
Italy Portugal
1995 2009 1995 2009
A 13.2 10.7 3.6 2.6
BEC 59.4 26 4.7 1.6
Exports to…
EAPR 67.1 22.3 4.4 3.4
C&I 12.6 8.5 1 1.5
CE 207.1 80.7 177 86.8
PWNE 28.9 13.2 29.6 4.7
PEE 8.4 20.5 0.2 3.7
A 43.9 20.5 15.4 9.6
BEC 12.2 58.6 1.7 17.9
Table 9 continued
Page 29 of 29Schütz and Palan Economic Structures (2016) 5:16
Fujita M, Thisse JF (2006) Globalization and the evolution of the supply chain: who gains and who loses. Int Econ Rev 47(3):811–836
Fujita M, Thisse JF (2013) Economics of agglomeration: cities, industrial location and globalization, 2nd edn. Cambridge University Press, Cambridge
Harary F, Norman R, Cartwright D (1965) Structural models: an introduction to the theory of directed graphs. Wiley, New York
Herfindahl O (1950) Concentration in the steel industry. PhD. thesis, Columbia UniversityHirschman A (1958) The strategy of economic development. Yale University Press, New HavenJohnson R, Noguera G (2012) Accounting for intermediates: production sharing and trade in value added. J Int Econ
86(2):224–236Jones L, Powers W, Ubee R (2013) Making global value chain research more accessible. U.S. International Trade Commis-
sion Office of Economics Working Paper No. 2013-10A. doi:10.2139/ssrn.2384026. (Accessed 22 Mar 2016)Jones R, Kierzkowski H (1990) The role of services in production and international trade: a theoretical framework. In:
Jones R, Krueger A (eds) The political economy of international trade, Festschrift in honor of Robert Baldwin. Basil Blackwell, Oxford, pp 31–48
Kali R, Reyes J (2007) The architecture of globalization: a network approach to international economic integration. J Int Bus Stud 38(4):595–620
Kowalski P, Molnár M (2009) Economic impacts of the phase-out in 2005 of quantitative restrictions under the agreement on textiles and clothing. OECD Trade Policy Papers, No. 90. OECD, Paris. doi:10.1787/220185234525
Krugman P (1991a) Geography and trade. MIT Press, CambridgeKrugman P (1991b) Increasing returns and economic geography. J Polit Econ 99(3):483–499Los B, Timmer M, de Vries G (2014) The demand for skills 1995–2008: a global supply chain perspective. OECD Economics
Department Working Papers, No. 1141. OECD, Paris. doi:10.1787/5jz123g0f5lp-enLos B, Timmer M, de Vries G (2015a) How global are global value chains? A new approach to measure international
fragmentation. J Reg Sci 55(1):66–92Los B, Timmer M, de Vries G (2015b) How important are exports for job growth in China? A demand side analysis. J Comp
Econ 43(1):19–32Mayer T, Zignano S (2011) Notes on CEPII’s distances measures: the geodist database. CEPII, No. 2011-25, CEPII Working
Paper. CEPII. http://www.cepii.fr/CEPII/en/publications/wp/abstract.asp?NoDoc=3877. (Accessed 22 Mar 2016)Miroudot S, Lanz R, Ragoussis A (2009) Trade in intermediate goods and services. OECD Trade Policy Papers, No. 93.
OECD, Paris. doi:10.1787/5kmlcxtdlk8r-enOECD Database on Maritime Transport Costs (2015). https://stats.oecd.org/Index.aspx?DataSetCode=MTC. (Accessed 22
Mar 2016)OECD STAN Database for Structural Analysis (2015). https://stats.oecd.org/Index.aspx?DataSetCode=STAN08BIS.
(Accessed 22 Mar 2016)Prell C, Feng K, Sun L, Geores M, Hubacek K (2014) The economic gains and environmental losses of us consumption: a
world-systems and input–output approach. Soc Forces 93(1):405–428Reyes J, Schiavo S, Fagiolo G (2010) Using complex networks analysis to assess the evolution of international economic
integration: the cases of East Asia and Latin America. J Int Trade Econ Dev 19(2):215–239Serrano Boguñá M (2003) Topology of the world trade web. Phys Rev E 68:015101Stehrer R (2012) Trade in value added and the value added in trade. No. 81, WIIW Working Papers, The Vienna Institute for
International Economic Studies. http://wiiw.ac.at/trade-in-value-added-and-the-valued-added-in-trade-dlp-2620.pdf. (Accessed 22 Mar 2016)
Stehrer R, Ali-Yrkkö J, Hanzl-Weiss D, Foster N, Rouvinen P, Seppälä T, Stöllinger R, Ylä-Anttila P (2011) Trade in intermediate products and EU manufacturing supply chains. WIIW Research Report No. 369, The Vienna Institute for International Economic Studies. http://wiiw.ac.at/trade-inintermediate-products-and-eu-manufacturing-supply-chains-dlp-769.pdf. Accessed 17 May 2016
Stehrer R, Foster N, de Vries G (2012) Value added and factors in trade: a comprehensive approach. No. 80, WIIW Working Papers. http://wiiw.ac.at/value-added-and-factors-in-trade-a-comprehensive-approach-dlp-2591.pdf. (Accessed 22 Mar 2016)
Storper M, Chen Y, De Paolis F (2002) Trade and the location of industries in OECD and European Union. J Econ Geogr 2(1):73–107
Timmer M (ed) (2012) The world input–output database (WIOD): contents, sources and methods. World Input Output Database. http://www.wiod.org/publications/source_docs/WIOD_sources.pdf. Accessed 17 May 2016
Timmer M, Dietzenbacher E, Los B, Stehrer R, de Vries G (2015) An illustrated user guide to the world input–output data-base: the case of global automotive production. Rev Int Econ 23(3):575–605
UN Comtrade Database (2015). http://comtrade.un.org/. (Accessed 22 Mar 2016)