Restructuring, employment and social dialogue in the ...ed_dialogue/@sector/documents/... ·...
115
INTERNATIONAL LABOUR ORGANIZATION Sectoral Activities Programme TMCPI/2011 Restructuring, employment and social dialogue in the chemicals and pharmaceutical industries Report for discussion at the Tripartite Meeting on Promoting Social Dialogue on Restructuring and its Effects on Employment in the Chemical and Pharmaceutical Industries (24–27 October 2011) Geneva, 2011 INTERNATIONAL LABOUR OFFICE, GENEVA
Transcript of Restructuring, employment and social dialogue in the ...ed_dialogue/@sector/documents/... ·...
INTERNATIONAL LABOUR ORGANIZATION
Sectoral Activities Programme TMCPI/2011
Restructuring, employment and social dialogue in the chemicals and pharmaceutical industries
Report for discussion at the Tripartite Meeting on Promoting Social Dialogue on Restructuring and its Effects on Employment in the Chemical and Pharmaceutical Industries (24–27 October 2011)
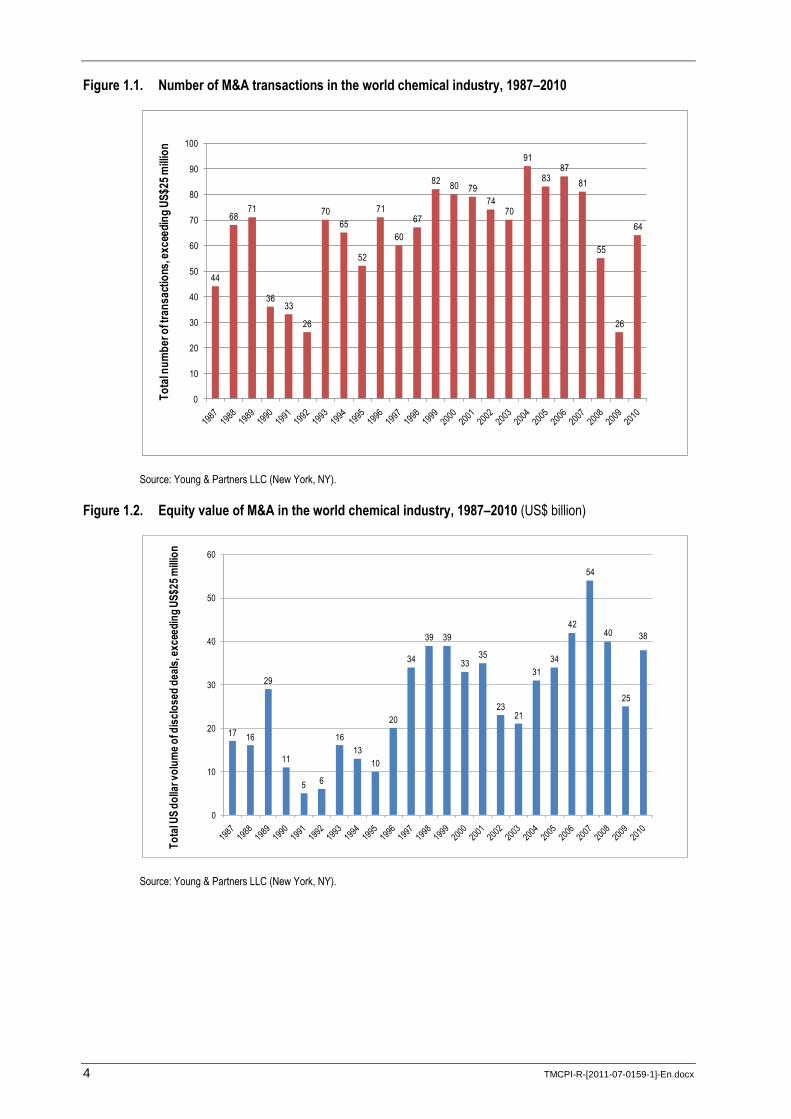
Geneva, 2011
INTERNATIONAL LABOUR OFFICE, GENEVA

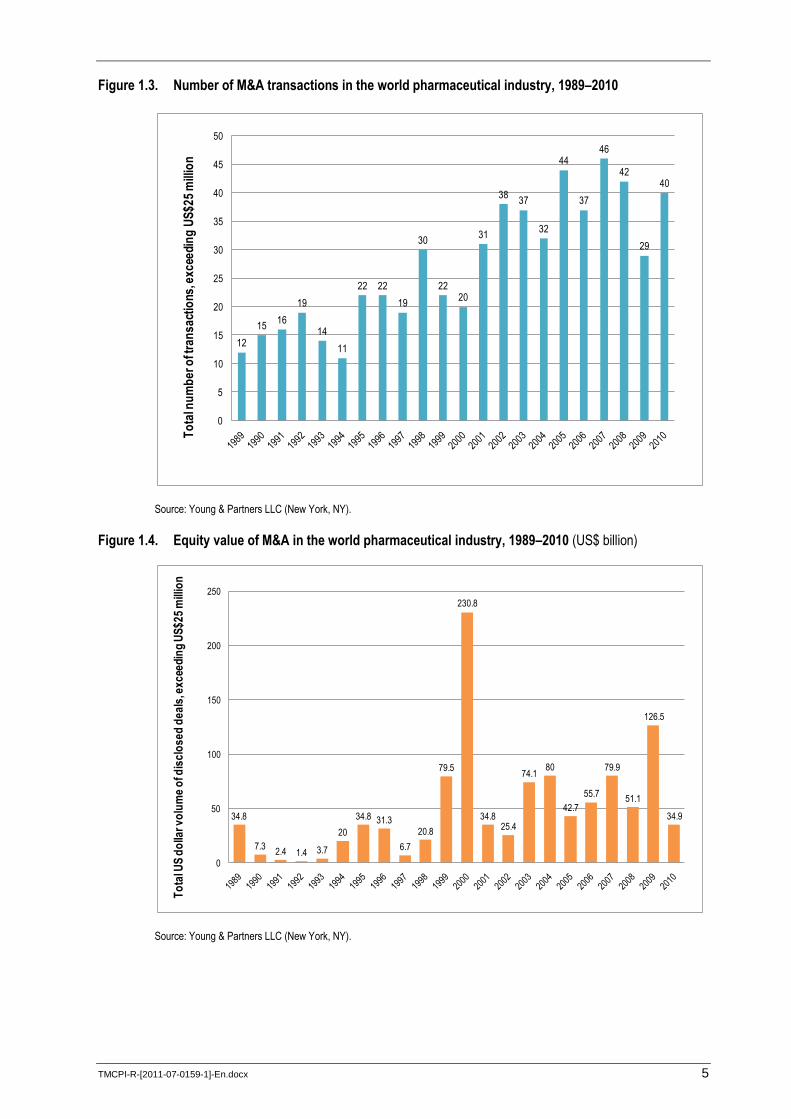
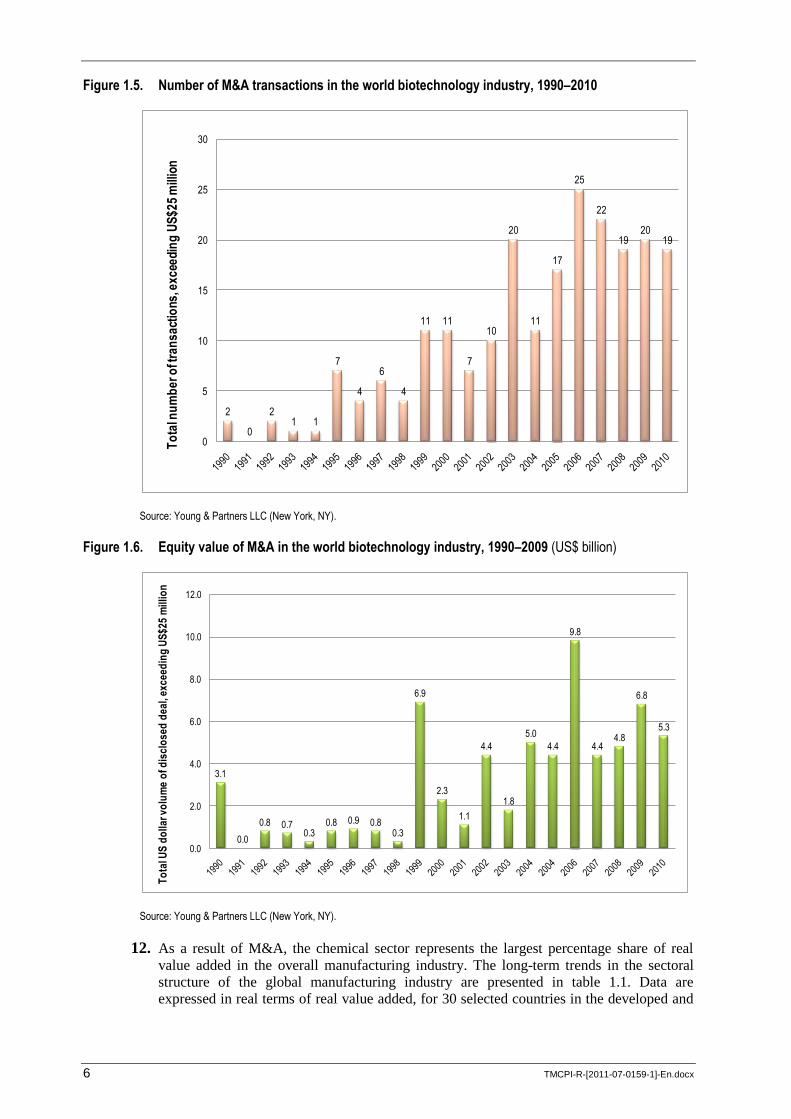
INTERNATIONAL LABOUR ORGANIZATION
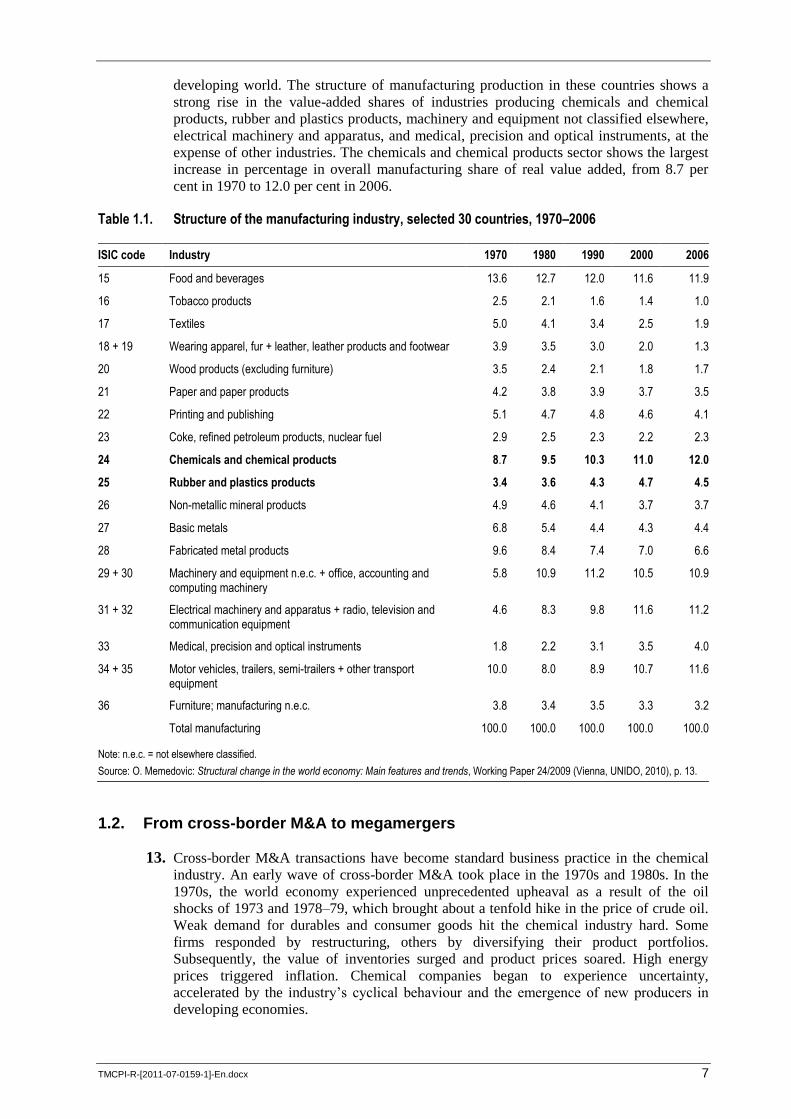
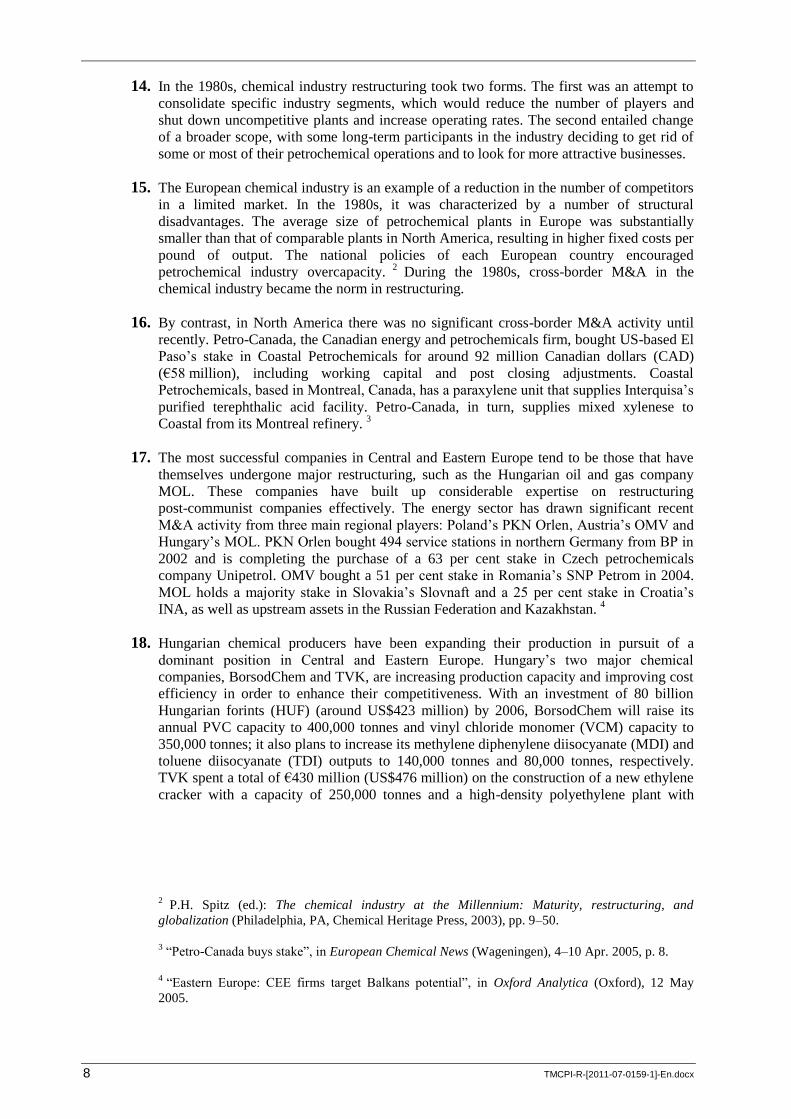
Sectoral Activities Programme TMCPI/2011
Restructuring, employment and social dialogue in the chemicals and pharmaceutical industries
Report for discussion at Tripartite Meeting on Promoting Social Dialogue on Restructuring and its Effects on Employment in the Chemical and Pharmaceutical Industries (24–27 October 2011)
Geneva, 2011
INTERNATIONAL LABOUR OFFICE, GENEVA
Copyright © International Labour Organization 2011
First edition 2011
Publications of the International Labour Office enjoy copyright under Protocol 2 of the Universal Copyright
Convention. Nevertheless, short excerpts from them may be reproduced without authorization, on condition that
the source is indicated. For rights of reproduction or translation, application should be made to ILO Publications
(Rights and Permissions), International Labour Office, CH-1211 Geneva 22, Switzerland. The International
Labour Office welcomes such applications.
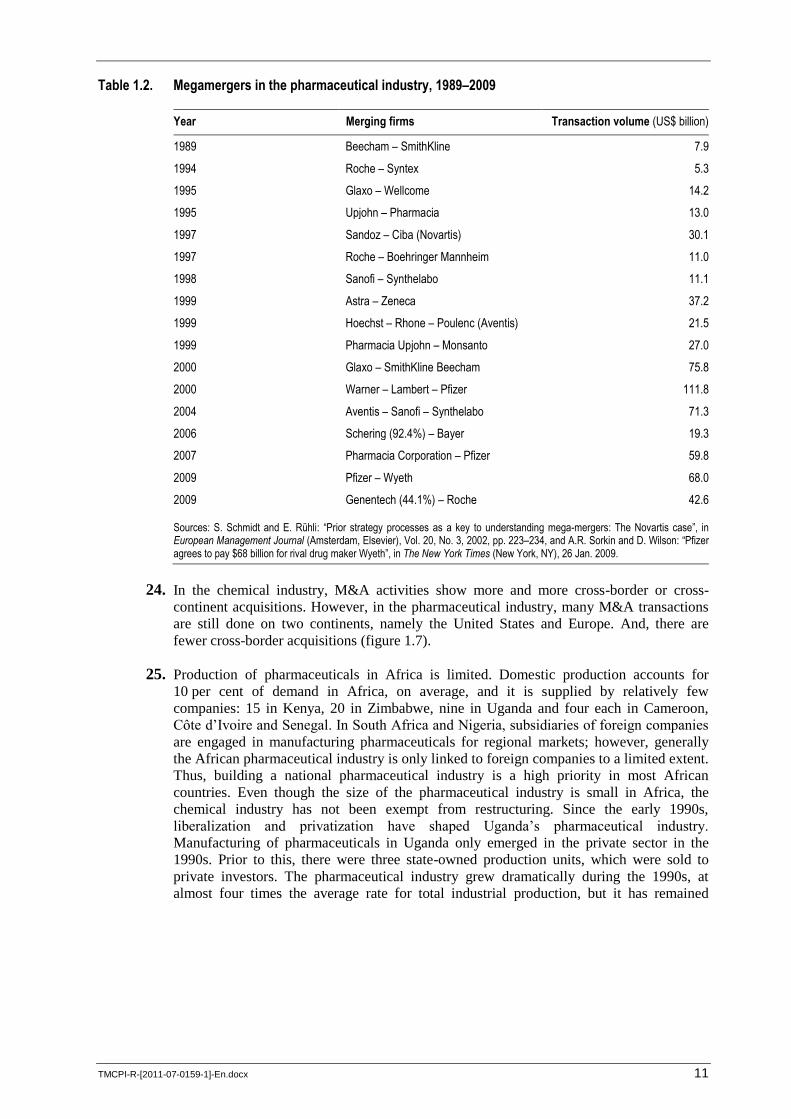
Libraries, institutions and other users registered with reproduction rights organizations may make copies in
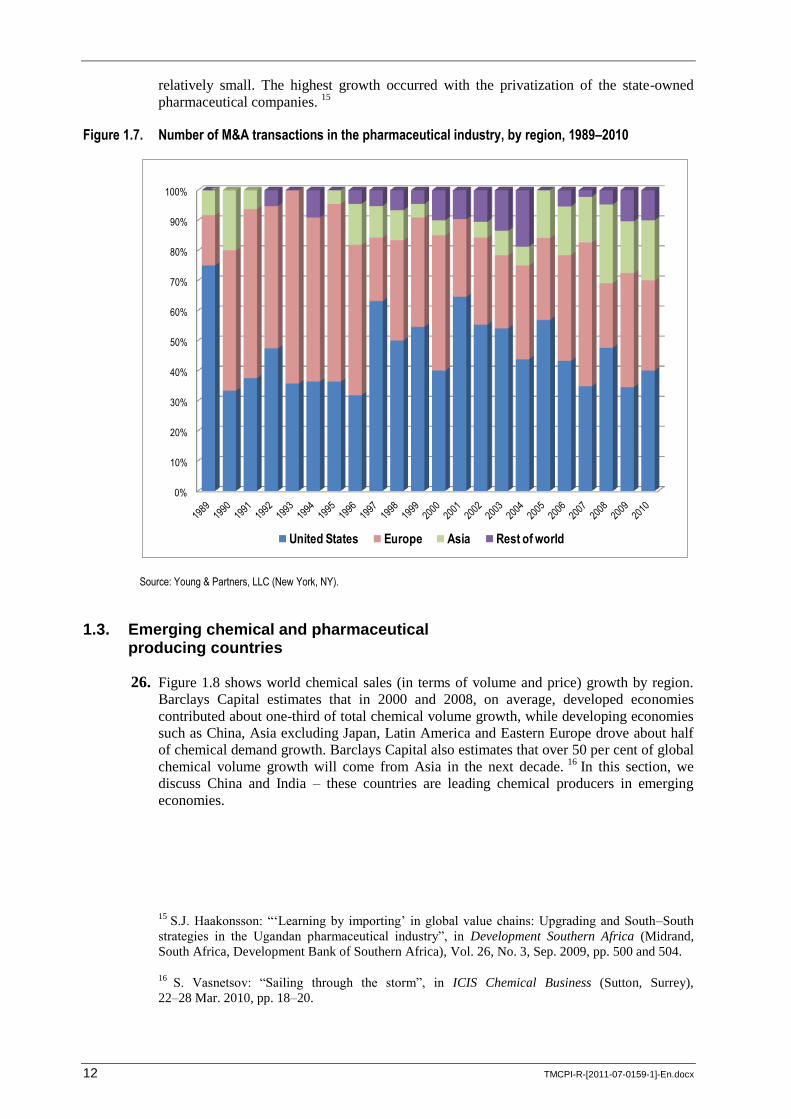
accordance with the licences issued to them for this purpose. Visit www.ifrro.org to find the reproduction rights
organization in your country.
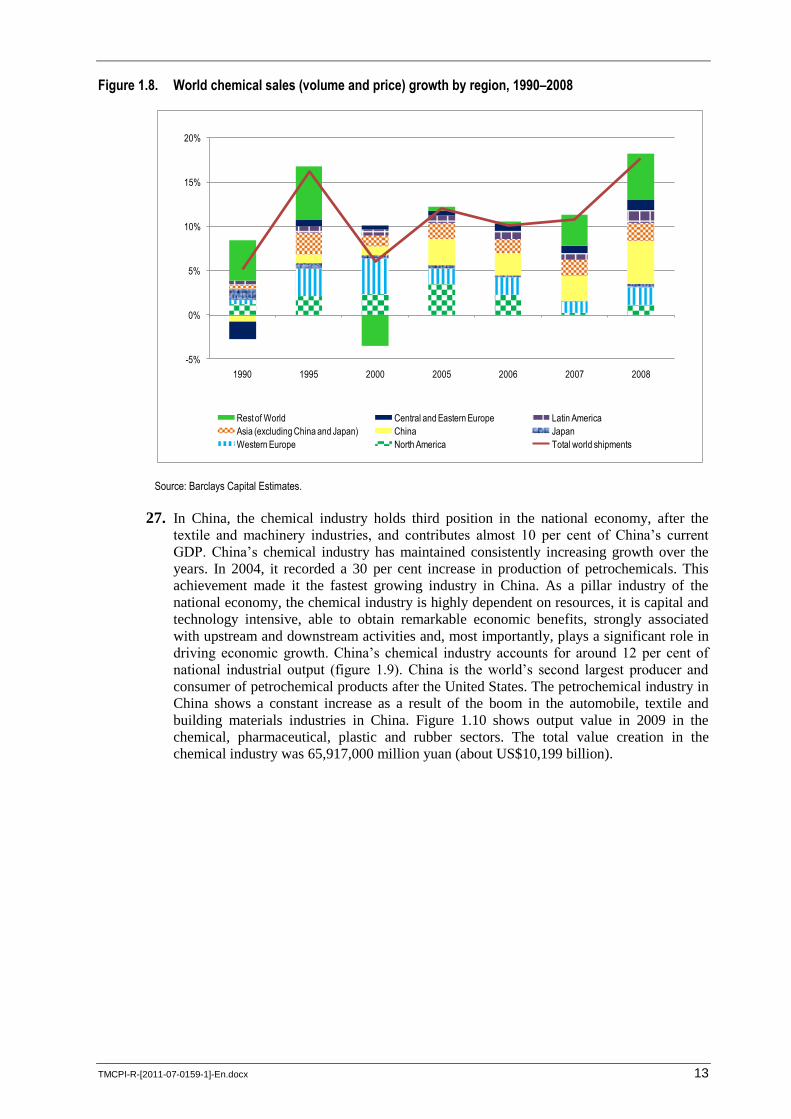
ISBN 978-92-2-124711-1 (print)
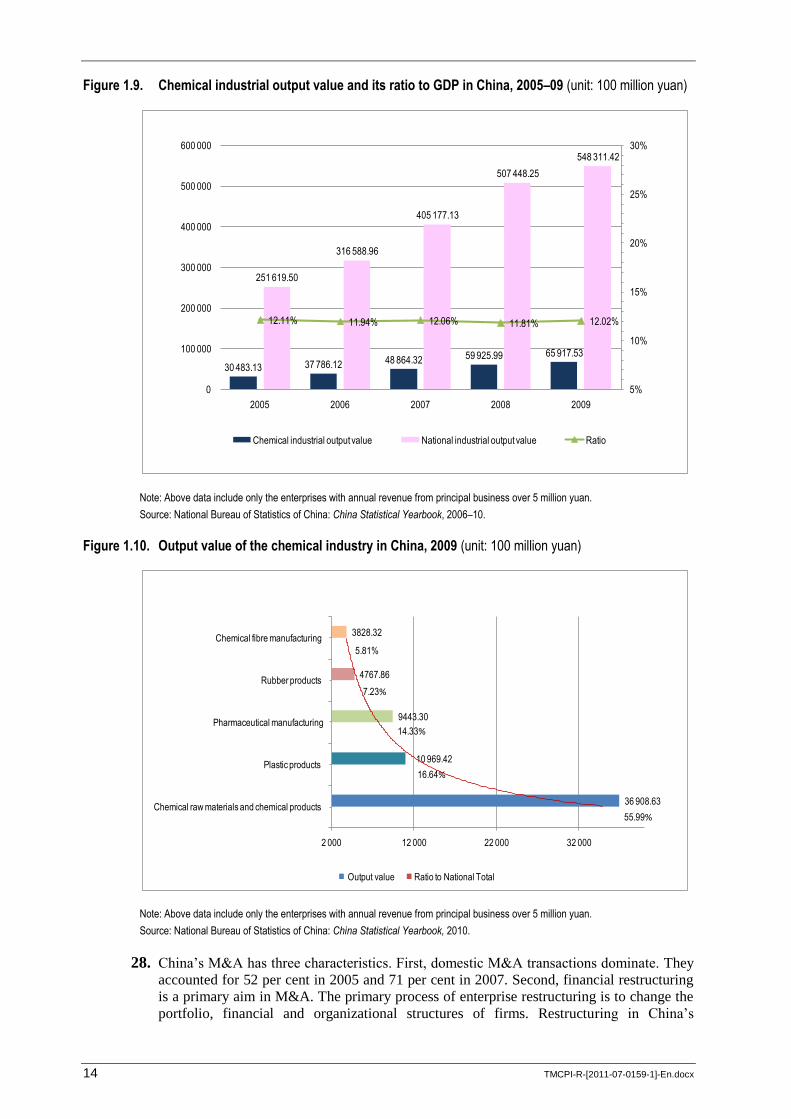
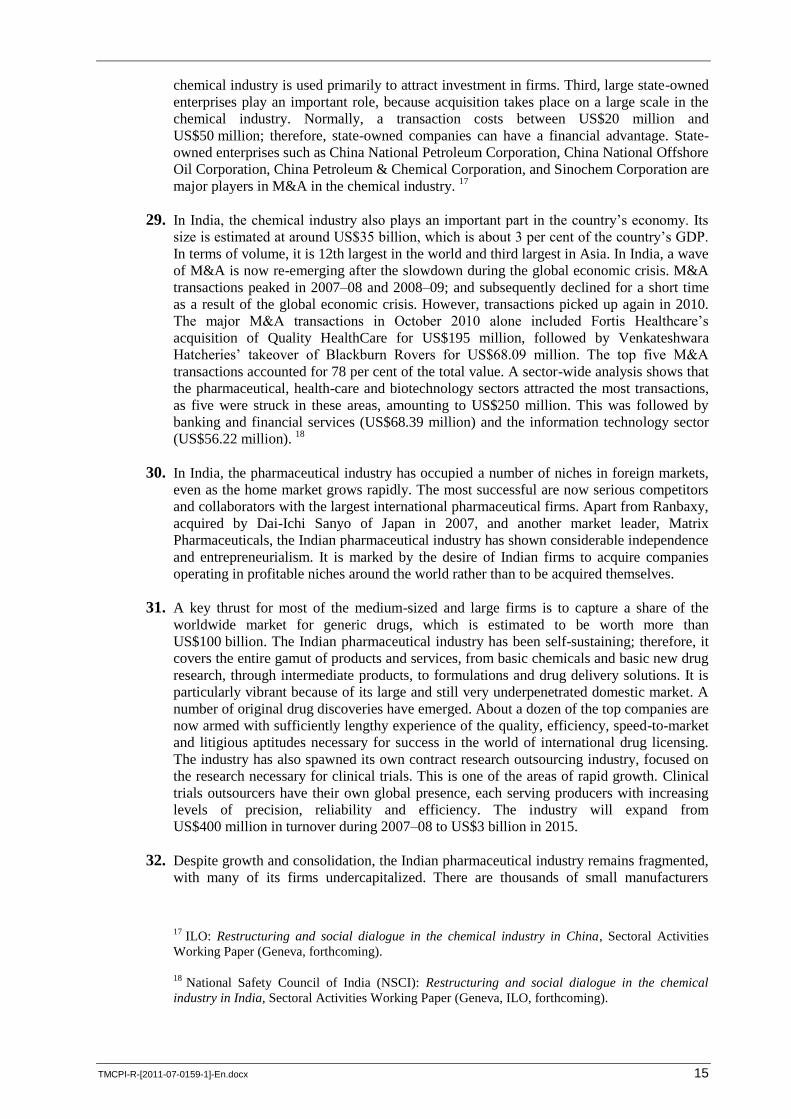
ISBN 978-92-2-124712-8 (Web pdf)
chemical industry / pharmaceutical industry / restructuring / corporate structural change / employment / social
dialogue / industrial relations / employer–employee relations / mergers and acquisitions / M&A / megamergers /
remuneration / wage / pay / working conditions / working time / condition of work
ILO Cataloguing in Publication Data
The designations employed in ILO publications, which are in conformity with United Nations practice, and the
presentation of material therein do not imply the expression of any opinion whatsoever on the part of the
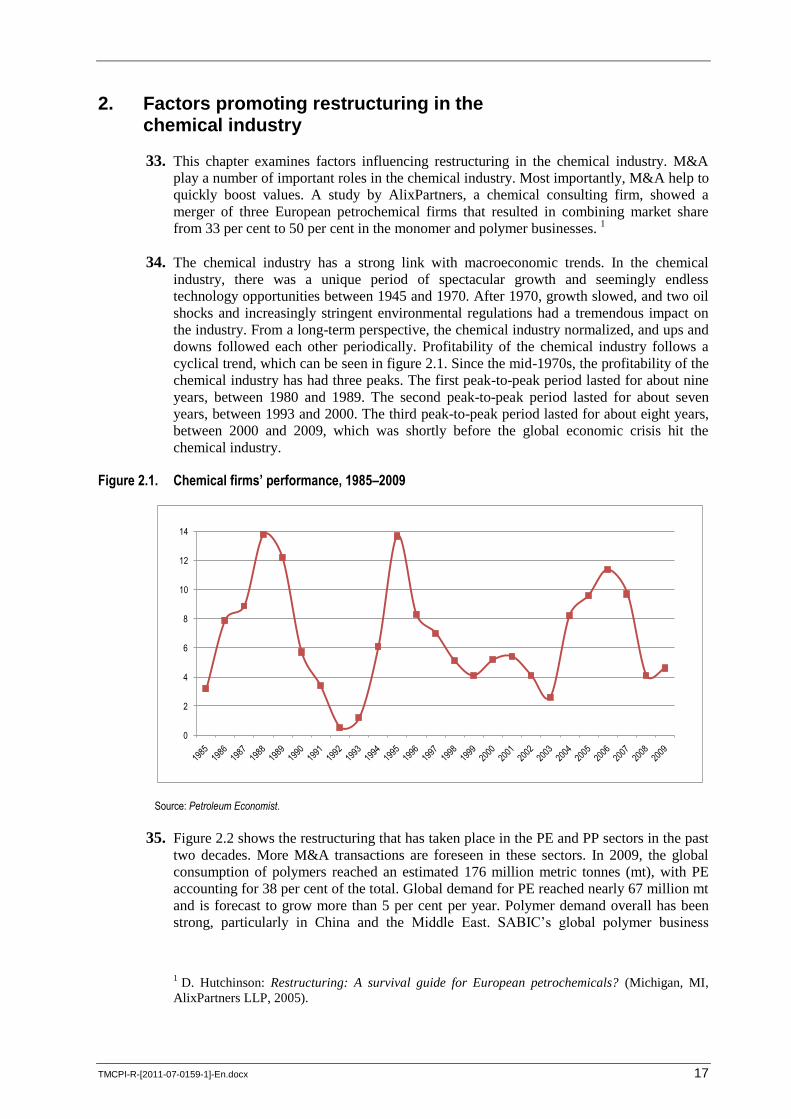
International Labour Office concerning the legal status of any country, area or territory or of its authorities, or
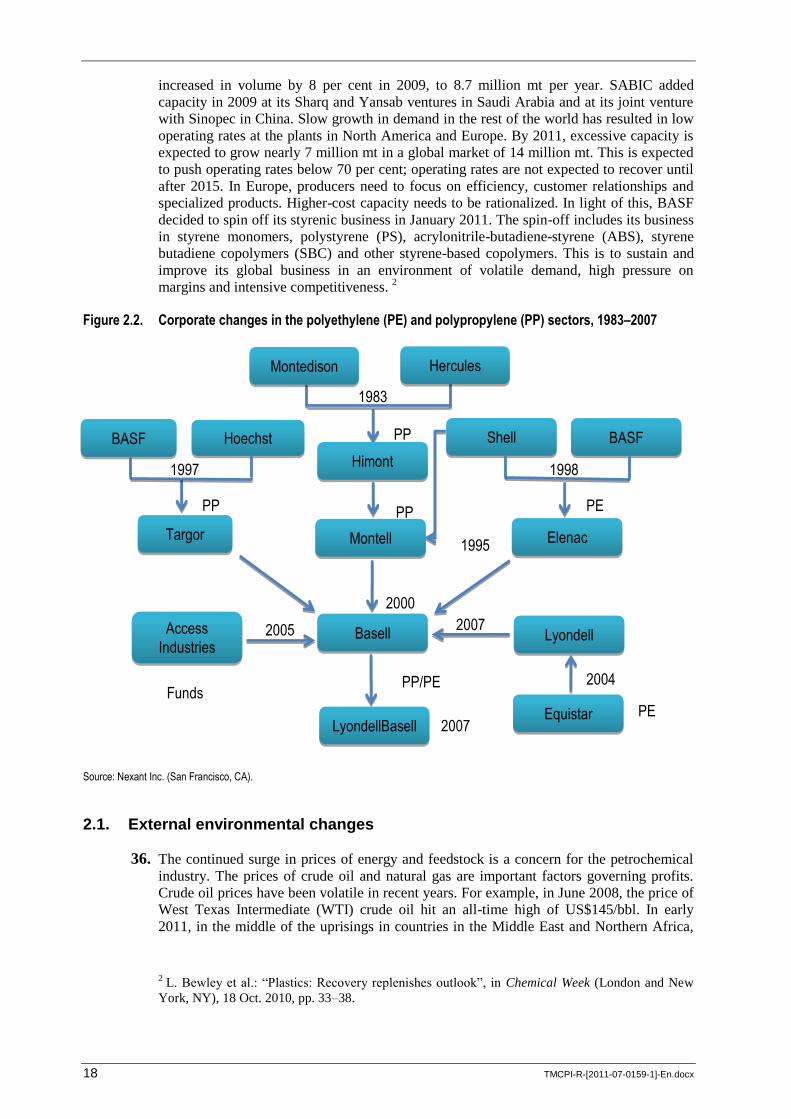
concerning the delimitation of its frontiers.
The responsibility for opinions expressed in signed articles, studies and other contributions rests solely with their
authors, and publication does not constitute an endorsement by the International Labour Office of the opinions
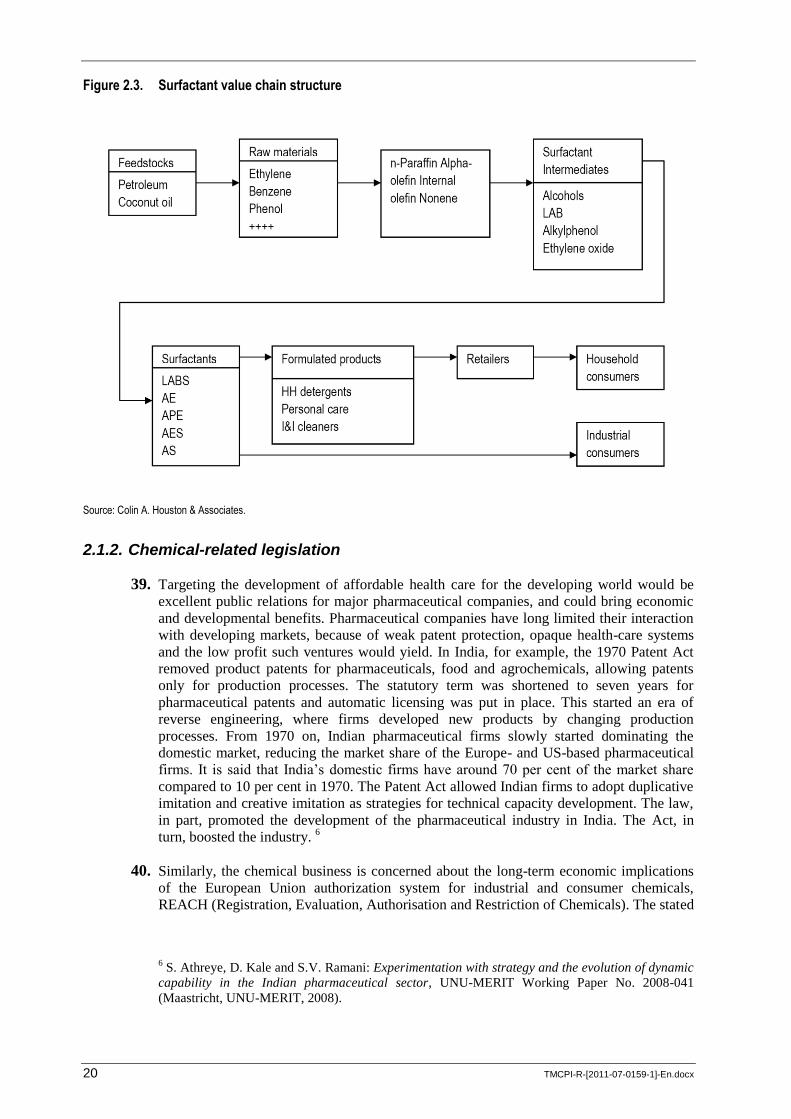
expressed in them.
Reference to names of firms and commercial products and processes does not imply their endorsement by the
International Labour Office, and any failure to mention a particular firm, commercial product or process is not a
sign of disapproval.
ILO publications and electronic products can be obtained through major booksellers or ILO local offices in many
countries, or direct from ILO Publications, International Labour Office, CH-1211 Geneva 22, Switzerland.
Catalogues or lists of new publications are available free of charge from the above address, or by email:
Visit our website: www.ilo.org/publns.
Printed by the International Labour Office, Geneva, Switzerland
TMCPI-R-[2011-07-0159-1]-En.docx iii
Contents
Page
Acknowledgements ........................................................................................................................... v
Abbreviations and acronyms ............................................................................................................. vii
Introduction ....................................................................................................................................... 1
Context and outline of the report ............................................................................................ 1
Background to the meeting ..................................................................................................... 2
1. Recent M&A in the chemical industry ...................................................................................... 3
1.1. Evolution of M&A in the chemical industry ................................................................ 3
1.2. From cross-border M&A to megamergers .................................................................... 7
1.3. Emerging chemical and pharmaceutical producing countries ...................................... 12
2. Factors promoting restructuring in the chemical industry......................................................... 17
2.1. External environmental changes ................................................................................... 18
2.1.1. Loss of pricing power ...................................................................................... 19
2.1.2. Chemical-related legislation ............................................................................ 20
2.1.3. Increasing presence of financial firms ............................................................. 21
2.2. Why chemical firms restructure .................................................................................... 22
2.2.1. Maximizing value ............................................................................................ 22
2.2.2. Synergies .......................................................................................................... 24
2.2.3. Moving into growing markets .......................................................................... 25
2.2.4. Cost-efficiency in research and development .................................................. 25
3. The impact of restructuring on employment and conditions of work ....................................... 27
3.1. Employment .................................................................................................................. 27
3.1.1. Global employment trends in the chemical industry........................................ 27
3.1.2. Employment in Europe .................................................................................... 33
3.1.3. Employment in Latin America ......................................................................... 39
3.1.4. Employment in the United States..................................................................... 40
3.1.5. Employment in China ...................................................................................... 43
3.1.6. Employment in India ........................................................................................ 44
3.1.7. Employment in Japan ....................................................................................... 46
3.1.8. Women workers in the chemical industry ........................................................ 47
3.1.9. Shortages of skilled workers ............................................................................ 53
3.1.10. Enhancing employability – The Global Jobs Pact ........................................... 56
3.2. Remuneration ................................................................................................................ 57
3.2.1. Wage system .................................................................................................... 57
3.2.2. Pay levels ......................................................................................................... 58
3.2.3. Gender and remuneration ................................................................................. 63
iv TMCPI-R-[2011-07-0159-1]-En.docx
3.3. Working time ................................................................................................................ 65
3.3.1. Working-time arrangements and family-friendly initiatives ............................ 72
4. The implications of restructuring for industrial relations .......................................................... 73
4.1. Overcoming the cultural differences ............................................................................. 73
4.2. Outsourcing and contract labour ................................................................................... 74
4.3. Collective bargaining in times of restructuring ............................................................. 77
4.4. Termination of employment ......................................................................................... 79
5. Social dialogue in times of restructuring ................................................................................... 82
5.1. The role of social dialogue ............................................................................................ 82
5.2. Why consultation is important ...................................................................................... 84
5.3. When and how to consult .............................................................................................. 86
5.4. How to promote social dialogue ................................................................................... 89
5.5. Responses to globalization ............................................................................................ 93
5.6. Global framework agreements ...................................................................................... 96
5.7. Corporate social responsibility ..................................................................................... 97
6. Summary and suggested points for discussion .......................................................................... 100
6.1. Summary ....................................................................................................................... 100
Suggested points for discussion .............................................................................................. 105
TMCPI-R-[2011-07-0159-1]-En.docx v
Acknowledgements
The report is published under the authority of the International Labour Office. It was
prepared by Yasuhiko Kamakura, Technical Specialist in the Sectoral Activities
Department. Since the issues discussed between employers and employees are often
confidential, publicly available information concerning social dialogue at the chemical
industry company level is extremely limited. The ILO wishes to thank the affiliated
organizations of the International Chemical Employers‟ Labour Relations Committee
(LRC) under the International Organisation of Employers (IOE), the International
Federation of Chemical, Energy, Mine and General Workers‟ Unions (ICEM) and the
International Trade Union Confederation (ITUC) for providing valuable data and
information. Substantial background information and case studies were provided by the
ILO library.

TMCPI-R-[2011-07-0159-1]-En.docx vii
Abbreviations and acronyms
BAVC Bundesarbeitgeberverband Chemie e.V.
(German Federation of Chemical Employers‟ Associations)
CEFIC European Chemical Industry Council
ECEG European Chemical Employers‟ Group
EMCEF European Mine, Chemical and Energy Workers‟ Federation
EWC European Works Council
GFA Global Framework Agreement
ICEM International Federation of Chemical, Energy, Mine and
General Workers‟ Unions
IFA International Framework Agreement
IG BCE Industriegewerkschaft Bergbau, Chemie, Energie
(German Mining, Chemical and Energy Industrial Union)
LRC International Chemical Employers‟ Labour Relations Committee
M&A mergers and acquisitions
Mt metric tonnes
NAFTA North American Free Trade Agreement
PE polyethylene
PET polyethylene terephthalate
PP polypropylene
R&D research and development
REACH Registration, Evaluation, Authorisation and Restriction of Chemicals
TCA transnational company agreement
UNIDO United Nations Industrial Development Organization

TMCPI-R-[2011-07-0159-1]-En.docx 1
Introduction
1. The chemical industry is of strategic importance to the sustainable development of national
economies. A few figures are sufficient to show the scale of the industry. In 2009, world
chemical sales were estimated at €1,871 billion (US$2,700 billion). Total sales from Asia,
European Union countries and the countries belonging to the North American Free Trade
Agreement (NAFTA) accounted for 89.7 per cent of world turnover in terms of chemical
sales. 1 The ILO estimated, in 1999, that the world chemical industry, not including the
pharmaceutical and the rubber and tyre industries, employed over 16 million people. 2 The
ILO estimates that there are up to 20 million people employed in the global chemical,
pharmaceutical and rubber and tyre industries today. The ILO has noted the importance of
this sector since the early stages of the Organization‟s activities and has actively promoted
social dialogue in the sector for many years.
Context and outline of the report
2. This report examines restructuring and investigates the methods of employer–employee
dialogue that have best served in improving industrial relations in the chemical industry. It
provides governments, employers and workers in the chemical industry with examples of
good industrial relations practices in the context of restructuring, and in particular gives
advice on how to improve employer–employee relations. Note that because social partners
in the chemical industry at the ILO also represent the rubber and tyre industries,
information from these industries is also included in the report.
3. The context and outline of the report are as follows:
■ Chapter 1 reviews recent mergers and acquisitions (M&A) in the chemical industry
on a global scale in order to identify their main characteristics.
■ Chapter 2 looks at some primary external factors that influence restructuring in the
chemical industry and provides models showing how chemical firms carry out the
restructuring process.
■ Chapter 3 examines how restructuring affects jobs and conditions of work in the
chemical industry, in particular its impact on employment, wages and working time.
■ Chapter 4 explores the impact of restructuring on workers in the context of industrial
relations.
■ Chapter 5 examines the role of social dialogue in times of restructuring. It examines
why and how it should be carried out, what issues must be addressed, and what is best
practice in social dialogue in the chemical industry.
1 European Chemical Industry Council (CEFIC): Facts and figures 2010 (Brussels).
2 ILO: Report on sectoral activities in 2002–03 and progress in the implementation of the
programme for 2004–05, Governing Body document GB.289/STM/1, 289th Session, March 2004
(Geneva), p. 19.
2 TMCPI-R-[2011-07-0159-1]-En.docx
Background to the meeting
4. This meeting is part of the ILO‟s Sectoral Activities Programme, the purpose of which is
to facilitate the exchange of information among constituents on labour and social
developments related to particular economic sectors, complemented by practical research
on topical sectoral issues. This objective has traditionally been pursued by holding
international tripartite sectoral meetings to exchange ideas and experiences with a view to
fostering a broader understanding of sector-specific issues and problems, promoting an
international tripartite consensus on sectoral concerns and providing guidance for national
and international policies and measures to deal with the related issues and problems,
promoting harmonization of all ILO activities of a sectoral character, and acting as a focal
point between the Office and its constituents, and providing technical advice, practical
assistance and concrete support to ILO constituents in their efforts to overcome problems
in ensuring decent work throughout the sectors concerned. (Further information on the
meeting is available at www.ilo.org/sector.)
5. At the 304th Session of the Governing Body (March 2009), the ILO‟s constituents selected
Promoting social dialogue on restructuring and its effects on employment in the chemical
and pharmaceutical industries as the topic for this tripartite sectoral meeting. At this
session, it was also decided to invite ten Employer and ten Worker representatives, after
consultation with their respective groups in the Governing Body, and to invite
representatives from the government of any ILO member State that indicated its wish to
attend. 3 At the 310th Session of the Governing Body (March 2011), it was decided that
five additional Employer and five additional Worker representatives, selected after
consultation with their respective groups, be invited to attend the meeting. 4
6. The purpose of the meeting, as decided by the Governing Body, is to examine the best
social dialogue practices to facilitate a constructive and conducive atmosphere during
structural changes and M&A; to adopt conclusions that include proposals for action by
governments, by employers‟ and workers‟ organizations, and by the ILO; and to adopt a
report on its discussions.
3 Opening sectoral meetings to representatives of all member States is part of a range of measures to
improve the relevance and impact of sectoral activities in the ILO. Others include the collection,
analysis and dissemination of relevant information on best practices, such as this report.
4 GB.310/14(Rev.).
TMCPI-R-[2011-07-0159-1]-En.docx 3
1. Recent M&A in the chemical industry
7. The evolution of the chemical industry is to some extent a history of M&A. Many names
of chemical firms no longer exist as a result of M&A. In the past decade, several of the
chemical industry‟s most venerable and notable names have faded away through M&A:
Ciba Specialty Chemicals, ICI, Rohm and Haas, and Union Carbide were among the once
leading names that have either disappeared or have been reduced to brand names by their
acquirers. The present chapter reviews M&A activity in the chemical industry.
1.1. Evolution of M&A in the chemical industry
8. M&A activities in the chemical and pharmaceutical industries show increases in terms of
the number of transactions and of equity. All figures on M&A transactions include only
those exceeding US$25 million (megamergers), which are publicly disclosed.
9. Figure 1.1 shows the number of M&A transactions in the world chemical industry between
1987 and the third quarter of 2009. Between 1999 and 2007, the volume of transactions
shows a steady increase, averaging between 70 and 80 megamergers per year. However, in
2008 and 2009, M&A transactions declined worldwide because of the global economic
crisis. The total equity value of transactions increased prior to the recent economic crisis,
and in 2007 the total equity value of transactions peaked at US$54 billion. Since 2007, the
number of transactions and their value has declined (figure 1.2). A chemical M&A firm,
Young and Partners, reported that the number of M&A transactions in the chemical
industry has gradually increased since 2009. In the first half of 2011, in equity value,
US$40 billion of transactions were completed. This exceeded US$39 billion for the whole
of 2010. 1
10. In the pharmaceutical industry, the number of megamergers worldwide has been constantly
increasing in the past two decades. After a record high of 46 transactions in 2007, a
cooling in the number of M&A transactions worldwide was seen in 2008 and 2009
(figure 1.3). The M&A dollar value peaked in 2000. Since 2000, no single transaction has
exceeded US$100 billion (figure 1.4).
11. Since the early 2000s, the number of biotechnology M&A transactions worldwide has also
been constantly increasing. At its peak in 2006, 25 megamergers were reported
(figure 1.5), with a dollar value of around US$10 billion. Since 2006, the number of
transactions has declined and the value remains relatively low, but steady, in terms of the
number of transactions (figure 1.6).
1 “Mergers and acquisitions”, in ICIS Chemical Business (Sutton Surrey), 15–28 August 2011,
pp. 16–17.
4 TMCPI-R-[2011-07-0159-1]-En.docx
Figure 1.1. Number of M&A transactions in the world chemical industry, 1987–2010
Source: Young & Partners LLC (New York, NY).
Figure 1.2. Equity value of M&A in the world chemical industry, 1987–2010 (US$ billion)
Source: Young & Partners LLC (New York, NY).
44
6871
3633
26
70
65
52
71
60
67
8280 79
7470
91
8387
81
55
26
64
0
10
20
30
40
50
60
70
80
90
100
To
tal n
um
be
r o
f tra
ns
act
ion
s, e
xc
eed
ing
US
$2
5 m
illio
n
17 16
29
11
5 6
16
13
10
20
34
39 39
3335
2321
31
34
42
54
40
25
38
0
10
20
30
40
50
60
To
tal U
S d
olla
r v
olu
me
of d
isc
los
ed
de
als
, ex
cee
din
g U
S$
25
mill
ion
TMCPI-R-[2011-07-0159-1]-En.docx 5
Figure 1.3. Number of M&A transactions in the world pharmaceutical industry, 1989–2010
Source: Young & Partners LLC (New York, NY).
Figure 1.4. Equity value of M&A in the world pharmaceutical industry, 1989–2010 (US$ billion)
Source: Young & Partners LLC (New York, NY).
12
1516
19
14
11
22 22
19
30
2220
31
3837
32
44
37
46
42
29
40
0
5
10
15
20
25
30
35
40
45
50
To
tal n
um
be
r o
f tra
ns
act
ion
s, e
xc
eed
ing
US
$2
5 m
illio
n
34.8
7.32.4 1.4 3.7
20
34.8 31.3
6.7
20.8
79.5
230.8
34.825.4
74.180
42.7
55.7
79.9
51.1
126.5
34.9
0
50
100
150
200
250
To
tal U
S d
olla
r v
olu
me
of d
isc
los
ed
de
als
, ex
cee
din
g U
S$
25
mill
ion
6 TMCPI-R-[2011-07-0159-1]-En.docx
Figure 1.5. Number of M&A transactions in the world biotechnology industry, 1990–2010
Source: Young & Partners LLC (New York, NY).
Figure 1.6. Equity value of M&A in the world biotechnology industry, 1990–2009 (US$ billion)
Source: Young & Partners LLC (New York, NY).
12. As a result of M&A, the chemical sector represents the largest percentage share of real
value added in the overall manufacturing industry. The long-term trends in the sectoral
structure of the global manufacturing industry are presented in table 1.1. Data are
expressed in real terms of real value added, for 30 selected countries in the developed and
2
0
21 1
7
4
6
4
11 11
7
10
20
11
17
25
22
1920
19
0
5
10
15
20
25
30
To
tal n
um
be
r o
f tra
ns
act
ion
s, e
xc
eed
ing
US
$2
5 m
illio
n
3.1
0.0
0.8 0.70.3
0.8 0.9 0.80.3
6.9
2.3
1.1
4.4
1.8
5.0
4.4
9.8
4.44.8
6.8
5.3
0.0
2.0
4.0
6.0
8.0
10.0
12.0
To
tal U
S d
olla
r v
olu
me
of d
isc
los
ed
de
al,
ex
ce
ed
ing
US
$2
5 m
illio
n
TMCPI-R-[2011-07-0159-1]-En.docx 7
developing world. The structure of manufacturing production in these countries shows a
strong rise in the value-added shares of industries producing chemicals and chemical
products, rubber and plastics products, machinery and equipment not classified elsewhere,
electrical machinery and apparatus, and medical, precision and optical instruments, at the
expense of other industries. The chemicals and chemical products sector shows the largest
increase in percentage in overall manufacturing share of real value added, from 8.7 per
cent in 1970 to 12.0 per cent in 2006.
Table 1.1. Structure of the manufacturing industry, selected 30 countries, 1970–2006
ISIC code Industry 1970 1980 1990 2000 2006
15 Food and beverages 13.6 12.7 12.0 11.6 11.9
16 Tobacco products 2.5 2.1 1.6 1.4 1.0
17 Textiles 5.0 4.1 3.4 2.5 1.9
18 + 19 Wearing apparel, fur + leather, leather products and footwear 3.9 3.5 3.0 2.0 1.3
20 Wood products (excluding furniture) 3.5 2.4 2.1 1.8 1.7
21 Paper and paper products 4.2 3.8 3.9 3.7 3.5
22 Printing and publishing 5.1 4.7 4.8 4.6 4.1
23 Coke, refined petroleum products, nuclear fuel 2.9 2.5 2.3 2.2 2.3
24 Chemicals and chemical products 8.7 9.5 10.3 11.0 12.0
25 Rubber and plastics products 3.4 3.6 4.3 4.7 4.5
26 Non-metallic mineral products 4.9 4.6 4.1 3.7 3.7
27 Basic metals 6.8 5.4 4.4 4.3 4.4
28 Fabricated metal products 9.6 8.4 7.4 7.0 6.6
29 + 30 Machinery and equipment n.e.c. + office, accounting and computing machinery
5.8 10.9 11.2 10.5 10.9
31 + 32 Electrical machinery and apparatus + radio, television and communication equipment
4.6 8.3 9.8 11.6 11.2
33 Medical, precision and optical instruments 1.8 2.2 3.1 3.5 4.0
34 + 35 Motor vehicles, trailers, semi-trailers + other transport equipment
10.0 8.0 8.9 10.7 11.6
36 Furniture; manufacturing n.e.c. 3.8 3.4 3.5 3.3 3.2
Total manufacturing 100.0 100.0 100.0 100.0 100.0
Note: n.e.c. = not elsewhere classified.
Source: O. Memedovic: Structural change in the world economy: Main features and trends, Working Paper 24/2009 (Vienna, UNIDO, 2010), p. 13.
1.2. From cross-border M&A to megamergers
13. Cross-border M&A transactions have become standard business practice in the chemical
industry. An early wave of cross-border M&A took place in the 1970s and 1980s. In the
1970s, the world economy experienced unprecedented upheaval as a result of the oil
shocks of 1973 and 1978–79, which brought about a tenfold hike in the price of crude oil.
Weak demand for durables and consumer goods hit the chemical industry hard. Some
firms responded by restructuring, others by diversifying their product portfolios.
Subsequently, the value of inventories surged and product prices soared. High energy
prices triggered inflation. Chemical companies began to experience uncertainty,
accelerated by the industry‟s cyclical behaviour and the emergence of new producers in
developing economies.
8 TMCPI-R-[2011-07-0159-1]-En.docx
14. In the 1980s, chemical industry restructuring took two forms. The first was an attempt to
consolidate specific industry segments, which would reduce the number of players and
shut down uncompetitive plants and increase operating rates. The second entailed change
of a broader scope, with some long-term participants in the industry deciding to get rid of
some or most of their petrochemical operations and to look for more attractive businesses.
15. The European chemical industry is an example of a reduction in the number of competitors
in a limited market. In the 1980s, it was characterized by a number of structural
disadvantages. The average size of petrochemical plants in Europe was substantially
smaller than that of comparable plants in North America, resulting in higher fixed costs per
pound of output. The national policies of each European country encouraged
petrochemical industry overcapacity. 2
During the 1980s, cross-border M&A in the
chemical industry became the norm in restructuring.
16. By contrast, in North America there was no significant cross-border M&A activity until
recently. Petro-Canada, the Canadian energy and petrochemicals firm, bought US-based El
Paso‟s stake in Coastal Petrochemicals for around 92 million Canadian dollars (CAD)
(€58 million), including working capital and post closing adjustments. Coastal
Petrochemicals, based in Montreal, Canada, has a paraxylene unit that supplies Interquisa‟s
purified terephthalic acid facility. Petro-Canada, in turn, supplies mixed xylenese to
Coastal from its Montreal refinery. 3
17. The most successful companies in Central and Eastern Europe tend to be those that have
themselves undergone major restructuring, such as the Hungarian oil and gas company
MOL. These companies have built up considerable expertise on restructuring
post-communist companies effectively. The energy sector has drawn significant recent
M&A activity from three main regional players: Poland‟s PKN Orlen, Austria‟s OMV and
Hungary‟s MOL. PKN Orlen bought 494 service stations in northern Germany from BP in
2002 and is completing the purchase of a 63 per cent stake in Czech petrochemicals
company Unipetrol. OMV bought a 51 per cent stake in Romania‟s SNP Petrom in 2004.
MOL holds a majority stake in Slovakia‟s Slovnaft and a 25 per cent stake in Croatia‟s
INA, as well as upstream assets in the Russian Federation and Kazakhstan. 4
18. Hungarian chemical producers have been expanding their production in pursuit of a
dominant position in Central and Eastern Europe. Hungary‟s two major chemical
companies, BorsodChem and TVK, are increasing production capacity and improving cost
efficiency in order to enhance their competitiveness. With an investment of 80 billion
Hungarian forints (HUF) (around US$423 million) by 2006, BorsodChem will raise its
annual PVC capacity to 400,000 tonnes and vinyl chloride monomer (VCM) capacity to
350,000 tonnes; it also plans to increase its methylene diphenylene diisocyanate (MDI) and
toluene diisocyanate (TDI) outputs to 140,000 tonnes and 80,000 tonnes, respectively.
TVK spent a total of €430 million (US$476 million) on the construction of a new ethylene
cracker with a capacity of 250,000 tonnes and a high-density polyethylene plant with
2 P.H. Spitz (ed.): The chemical industry at the Millennium: Maturity, restructuring, and
globalization (Philadelphia, PA, Chemical Heritage Press, 2003), pp. 9–50.
3 “Petro-Canada buys stake”, in European Chemical News (Wageningen), 4–10 Apr. 2005, p. 8.
4 “Eastern Europe: CEE firms target Balkans potential”, in Oxford Analytica (Oxford), 12 May
2005.
TMCPI-R-[2011-07-0159-1]-En.docx 9
annual capacity of 200,000 tonnes. These expansion plans were meant to boost TVK‟s
capacity and size before Hungary‟s accession to the European Union. 5
19. However, not all deals today are necessarily successful. For example, Poland is still
struggling to pursue a privatization plan for its chemical sector because of the global
economic crisis. In August 2009, PKN Orlen postponed the sale of PVC and nitrogen
subsidiary Anwil. The company had planned to raise around US$2 billion from the sale of
Anwil to invest in Orlen Transportation and a 25 per cent stake in Polkomtel. Many
Central Eastern European (CEE) economies suffered from the global economic crisis.
Hungary‟s deep economic malaise has been reflected in the results of the country‟s
national chemical firm TVK, the chemicals business of energy giant MOL. Sales slumped
from US$2.3 billion in 2007 to US$1.7 billion in 2008, while operating profits slumped
from US$236 million to US$24 million. 6 Although information on M&A in the Russian
Federation is limited, it is reported that the Federal Anti-Monopoly Service has approved a
merger between Soda Sterlitamak and Caustic Sterlitamak in Sterlitamak. 7
20. Brazil and Mexico dominate the Latin American chemical industry. The Brazilian
chemical giant, Braskem, is actively acquiring chemical interests in Brazil and Mexico. In
2008, Braskem reported sales of US$7,670 million, followed by Petróleos Mexicanos
(PEMEX), which has the petrochemical business at PPQ (PEMEX Petroquímica), with
sales of US$5,870 million. The total sales of these companies accounted for around half
the total sales in Latin American chemical companies. Braskem has been seeking the
acquisition of Quattor, created in June 2008, following a major restructuring of the
Brazilian petrochemical sector, and this would help it achieve its goal of becoming one of
the world‟s ten largest petrochemical companies. Braskem is also considering investing in
Mexico, where plans to build a large-scale petrochemical project were being considered.
The Brazilian group has joined Mexican companies Alpek, Mexichem and IDESA to form
a consortium that planned to bid for an ethane supply contract with PEMEX. In Mexico,
Alpek, the petrochemical business of the ALFA industrial group, started a polypropylene
(PP) plant in Altamira, Mexico. It also completed the integration of two polyethylene
terephthalate (PET) plants it acquired in 2007 in Argentina and Mexico. The PP plant is
part of Alpek‟s Indelpro PP joint venture with LyondellBasell. Mexichem‟s 2008 revenues
were boosted by acquisitions that included Brazilian PVC pipe producer Plastubos. 8 In
2010, Braskem and the Bolivarian Republic of Venezuela‟s state-owned petrochemical
company Pequiven reached an agreement to evaluate a new model for creating a joint
venture of PP and polyethylene (PE) businesses in the Bolivarian Republic of Venezuela. 9
Braskem is also investing US$50 million in the US polypropylene sites. 10
5 “Hungary: Chemical firms have ambitious expansion plans”, in Oxford Analytica (Oxford), 9 Sep.
2003.
6 W. Beacham: “Global impact”, in ICIS Chemical Business (Sutton, Surrey), 21–27 Sep. 2009,
pp. 18–20.
7 “Russian caustic soda players to merge”, in ICIS Chemical Business (Sutton, Surrey),
28 Feb.–6 Mar. 2011, p. 9.
8 A. Jagger: “Global impact”, in ICIS Chemical Business (Sutton, Surrey), 21–27 Sep. 2009.
9 K. Sissell: “Braskem and Pequiven scale back Venezuela projects”, in Chemical Week (London
and New York, NY), 3 May 2010, p. 10.
10 A. Jagger: “Braskem invests in US polypropylene sites”, in ICIS Chemical Business (Sutton,
Surrey), 4–10 Oct. 2010, p. 26.
10 TMCPI-R-[2011-07-0159-1]-En.docx
21. In Asia, too, M&A activity is on the increase, although most capital investment is still
limited to within national borders. In the Republic of Korea, LG Chem and Honam
Petrochemical bought Hyundai Petrochemical for 1,740 billion South Korean won (KRW)
(US$1.45 billion) in early 2003. 11
Hyundai Petrochemical split into three companies, with
LG Chem and Honam Petrochemicals each operating one of the company‟s two complexes
based in the city of Daesan, and jointly holding stakes in a separate utilities company.
Honam owns Lotte Daesan Petrochemical and took control of No. 2 Complex at Daesan,
which includes a 600,000 tonnes per year cracker. LG Chem owns LG Daesan
Petrochemical and has control of No. 1 Complex, which includes a 450,000 tonnes per
year cracker, an EO/EG plant, a PP plant, a low-density PE unit, a linear low-density
polyethylene (LLDPE) facility, a high-density PE unit and a styrene plant. 12
22. Recent M&A transactions in Japan show that the Japanese chemical firms are taking
advantage of M&A to acquire key technologies and production of mainly specialist
chemicals in order to strengthen their portfolios by entering into promising new areas. In
2001, Kuraray acquired polyvinyl butyral (PVB) production in Germany from the
acquisition of Clariant‟s business. The company is focusing on developing core materials
businesses such as vinyl-acetate materials, isoprene chemicals and man-made leathers to
create and expand new business. Mitsui Chemical and other Japanese firms are targeting
M&A to boost specialty businesses. In 2008, Mitsui Chemical acquired SDC Technologies
in the United States, which manufactures and sells high-performance coating materials for
plastics and non-ferrous material. 13
In 2008, Mitsubishi Rayon acquired Lucite
International. Between 2010 and 2011, Asahi Kasei and Mitsubishi Chemical created a
joint venture, to be implemented from 1 April 2011, for unified cracker operations at
Mizushima. Mitsui Chemical and Japanese refiner Idemitsu Kosan integrated ethylene
production at Chiba. Mitsui Chemical and Teijin merged PET operations. Although
cultural issues have made it difficult to implement M&A in Japan in the past, a changing
corporate culture in the past ten years has gradually led to more reasonable M&A
arrangements. 14
23. The 1990s were the decade of megamergers. For example, in 1997, the merger between
Sandoz and Ciba created Novartis. With a market value of US$80 billion, the merger was
the world‟s largest at the time. It had a lasting effect, particularly on the European
chemical industry. Several megamergers are listed in table 1.2.
11 “LG Chem and Honam take over Hyundai”, in European Chemical News (Wageningen), 3–9 Feb.
2003, p. 7.
12 “Hyundai Petrochemical splits”, in European Chemical News (Wageningen), 15–21 Nov. 2004,
p. 6.
13 R. Westervelt: “Japan: Sustaining recovery in chemicals”, in Chemical Week (London and New
York, NY), 12–19 May 2008, pp. 20–24.
14 M. Hariharan: “Japanese chemical industry reinvents itself to counter pressures from the Middle
East and China”, in ICIS Chemical Business (Sutton, Surrey), 18–24 Oct. 2010, pp. 35–36.
TMCPI-R-[2011-07-0159-1]-En.docx 11
Table 1.2. Megamergers in the pharmaceutical industry, 1989–2009
Year Merging firms Transaction volume (US$ billion)
1989 Beecham – SmithKline 7.9
1994 Roche – Syntex 5.3
1995 Glaxo – Wellcome 14.2
1995 Upjohn – Pharmacia 13.0
1997 Sandoz – Ciba (Novartis) 30.1
1997 Roche – Boehringer Mannheim 11.0
1998 Sanofi – Synthelabo 11.1
1999 Astra – Zeneca 37.2
1999 Hoechst – Rhone – Poulenc (Aventis) 21.5
1999 Pharmacia Upjohn – Monsanto 27.0
2000 Glaxo – SmithKline Beecham 75.8
2000 Warner – Lambert – Pfizer 111.8
2004 Aventis – Sanofi – Synthelabo 71.3
2006 Schering (92.4%) – Bayer 19.3
2007 Pharmacia Corporation – Pfizer 59.8
2009 Pfizer – Wyeth 68.0
2009 Genentech (44.1%) – Roche 42.6
Sources: S. Schmidt and E. Rühli: “Prior strategy processes as a key to understanding mega-mergers: The Novartis case”, in European Management Journal (Amsterdam, Elsevier), Vol. 20, No. 3, 2002, pp. 223–234, and A.R. Sorkin and D. Wilson: “Pfizer agrees to pay $68 billion for rival drug maker Wyeth”, in The New York Times (New York, NY), 26 Jan. 2009.
24. In the chemical industry, M&A activities show more and more cross-border or cross-
continent acquisitions. However, in the pharmaceutical industry, many M&A transactions
are still done on two continents, namely the United States and Europe. And, there are
fewer cross-border acquisitions (figure 1.7).
25. Production of pharmaceuticals in Africa is limited. Domestic production accounts for
10 per cent of demand in Africa, on average, and it is supplied by relatively few
companies: 15 in Kenya, 20 in Zimbabwe, nine in Uganda and four each in Cameroon,
Côte d‟Ivoire and Senegal. In South Africa and Nigeria, subsidiaries of foreign companies
are engaged in manufacturing pharmaceuticals for regional markets; however, generally
the African pharmaceutical industry is only linked to foreign companies to a limited extent.
Thus, building a national pharmaceutical industry is a high priority in most African
countries. Even though the size of the pharmaceutical industry is small in Africa, the
chemical industry has not been exempt from restructuring. Since the early 1990s,
liberalization and privatization have shaped Uganda‟s pharmaceutical industry.
Manufacturing of pharmaceuticals in Uganda only emerged in the private sector in the
1990s. Prior to this, there were three state-owned production units, which were sold to
private investors. The pharmaceutical industry grew dramatically during the 1990s, at
almost four times the average rate for total industrial production, but it has remained
12 TMCPI-R-[2011-07-0159-1]-En.docx
relatively small. The highest growth occurred with the privatization of the state-owned
pharmaceutical companies. 15
Figure 1.7. Number of M&A transactions in the pharmaceutical industry, by region, 1989–2010
Source: Young & Partners, LLC (New York, NY).
1.3. Emerging chemical and pharmaceutical producing countries
26. Figure 1.8 shows world chemical sales (in terms of volume and price) growth by region.
Barclays Capital estimates that in 2000 and 2008, on average, developed economies
contributed about one-third of total chemical volume growth, while developing economies
such as China, Asia excluding Japan, Latin America and Eastern Europe drove about half
of chemical demand growth. Barclays Capital also estimates that over 50 per cent of global
chemical volume growth will come from Asia in the next decade. 16
In this section, we
discuss China and India – these countries are leading chemical producers in emerging
economies.
15 S.J. Haakonsson: “„Learning by importing‟ in global value chains: Upgrading and South–South
strategies in the Ugandan pharmaceutical industry”, in Development Southern Africa (Midrand,
South Africa, Development Bank of Southern Africa), Vol. 26, No. 3, Sep. 2009, pp. 500 and 504.
16 S. Vasnetsov: “Sailing through the storm”, in ICIS Chemical Business (Sutton, Surrey),
22–28 Mar. 2010, pp. 18–20.
0%
10%
20%
30%
40%
50%
60%
70%
80%
90%
100%
United States Europe Asia Rest of world
TMCPI-R-[2011-07-0159-1]-En.docx 13
Figure 1.8. World chemical sales (volume and price) growth by region, 1990–2008
Source: Barclays Capital Estimates.
27. In China, the chemical industry holds third position in the national economy, after the
textile and machinery industries, and contributes almost 10 per cent of China‟s current
GDP. China‟s chemical industry has maintained consistently increasing growth over the
years. In 2004, it recorded a 30 per cent increase in production of petrochemicals. This
achievement made it the fastest growing industry in China. As a pillar industry of the
national economy, the chemical industry is highly dependent on resources, it is capital and
technology intensive, able to obtain remarkable economic benefits, strongly associated
with upstream and downstream activities and, most importantly, plays a significant role in
driving economic growth. China‟s chemical industry accounts for around 12 per cent of
national industrial output (figure 1.9). China is the world‟s second largest producer and
consumer of petrochemical products after the United States. The petrochemical industry in
China shows a constant increase as a result of the boom in the automobile, textile and
building materials industries in China. Figure 1.10 shows output value in 2009 in the
chemical, pharmaceutical, plastic and rubber sectors. The total value creation in the
chemical industry was 65,917,000 million yuan (about US$10,199 billion).
-5%
0%
5%
10%
15%
20%
1990 1995 2000 2005 2006 2007 2008
Rest of World Central and Eastern Europe Latin America
Asia (excluding China and Japan) China Japan
Western Europe North America Total world shipments
14 TMCPI-R-[2011-07-0159-1]-En.docx
Figure 1.9. Chemical industrial output value and its ratio to GDP in China, 2005–09 (unit: 100 million yuan)
Note: Above data include only the enterprises with annual revenue from principal business over 5 million yuan.
Source: National Bureau of Statistics of China: China Statistical Yearbook, 2006–10.
Figure 1.10. Output value of the chemical industry in China, 2009 (unit: 100 million yuan)
Note: Above data include only the enterprises with annual revenue from principal business over 5 million yuan.
Source: National Bureau of Statistics of China: China Statistical Yearbook, 2010.
28. China‟s M&A has three characteristics. First, domestic M&A transactions dominate. They
accounted for 52 per cent in 2005 and 71 per cent in 2007. Second, financial restructuring
is a primary aim in M&A. The primary process of enterprise restructuring is to change the
portfolio, financial and organizational structures of firms. Restructuring in China‟s
30 483.13 37 786.12 48 864.32 59 925.99 65 917.53
251 619.50
316 588.96
405 177.13
507 448.25
548 311.42
12.11% 11.94% 12.06% 11.81% 12.02%
5%
10%
15%
20%
25%
30%
0
100 000
200 000
300 000
400 000
500 000
600 000
2005 2006 2007 2008 2009
Chemical industrial output value National industrial output value Ratio
36 908.63
10 969.42
9443.30
4767.86
3828.32
2 000 12 000 22 000 32 000
Chemical raw materials and chemical products
Plastic products
Pharmaceutical manufacturing
Rubber products
Chemical fibre manufacturing
Output value Ratio to National Total
5.81%
7.23%
14.33%
16.64%
55.99%
TMCPI-R-[2011-07-0159-1]-En.docx 15
chemical industry is used primarily to attract investment in firms. Third, large state-owned
enterprises play an important role, because acquisition takes place on a large scale in the
chemical industry. Normally, a transaction costs between US$20 million and
US$50 million; therefore, state-owned companies can have a financial advantage. State-
owned enterprises such as China National Petroleum Corporation, China National Offshore
Oil Corporation, China Petroleum & Chemical Corporation, and Sinochem Corporation are
major players in M&A in the chemical industry. 17
29. In India, the chemical industry also plays an important part in the country‟s economy. Its
size is estimated at around US$35 billion, which is about 3 per cent of the country‟s GDP.
In terms of volume, it is 12th largest in the world and third largest in Asia. In India, a wave
of M&A is now re-emerging after the slowdown during the global economic crisis. M&A
transactions peaked in 2007–08 and 2008–09; and subsequently declined for a short time
as a result of the global economic crisis. However, transactions picked up again in 2010.
The major M&A transactions in October 2010 alone included Fortis Healthcare‟s
acquisition of Quality HealthCare for US$195 million, followed by Venkateshwara
Hatcheries‟ takeover of Blackburn Rovers for US$68.09 million. The top five M&A
transactions accounted for 78 per cent of the total value. A sector-wide analysis shows that
the pharmaceutical, health-care and biotechnology sectors attracted the most transactions,
as five were struck in these areas, amounting to US$250 million. This was followed by
banking and financial services (US$68.39 million) and the information technology sector
(US$56.22 million). 18
30. In India, the pharmaceutical industry has occupied a number of niches in foreign markets,
even as the home market grows rapidly. The most successful are now serious competitors
and collaborators with the largest international pharmaceutical firms. Apart from Ranbaxy,
acquired by Dai-Ichi Sanyo of Japan in 2007, and another market leader, Matrix
Pharmaceuticals, the Indian pharmaceutical industry has shown considerable independence
and entrepreneurialism. It is marked by the desire of Indian firms to acquire companies
operating in profitable niches around the world rather than to be acquired themselves.
31. A key thrust for most of the medium-sized and large firms is to capture a share of the
worldwide market for generic drugs, which is estimated to be worth more than
US$100 billion. The Indian pharmaceutical industry has been self-sustaining; therefore, it
covers the entire gamut of products and services, from basic chemicals and basic new drug
research, through intermediate products, to formulations and drug delivery solutions. It is
particularly vibrant because of its large and still very underpenetrated domestic market. A
number of original drug discoveries have emerged. About a dozen of the top companies are
now armed with sufficiently lengthy experience of the quality, efficiency, speed-to-market
and litigious aptitudes necessary for success in the world of international drug licensing.
The industry has also spawned its own contract research outsourcing industry, focused on
the research necessary for clinical trials. This is one of the areas of rapid growth. Clinical
trials outsourcers have their own global presence, each serving producers with increasing
levels of precision, reliability and efficiency. The industry will expand from
US$400 million in turnover during 2007–08 to US$3 billion in 2015.
32. Despite growth and consolidation, the Indian pharmaceutical industry remains fragmented,
with many of its firms undercapitalized. There are thousands of small manufacturers
17 ILO: Restructuring and social dialogue in the chemical industry in China, Sectoral Activities
Working Paper (Geneva, forthcoming).
18 National Safety Council of India (NSCI): Restructuring and social dialogue in the chemical
industry in India, Sectoral Activities Working Paper (Geneva, ILO, forthcoming).
16 TMCPI-R-[2011-07-0159-1]-En.docx
operating in most parts of the country, all of them attracted by the industry‟s still
perennially high margins. Backed by a large and underserved domestic market, and with
massive growth potential in generics exports and research outsourcing, the Indian
pharmaceutical industry is primed for substantial expansion in the coming years. 19
19 “India: Pharmaceutical industry is primed for growth”, in Oxford Analytica (Oxford), 24 Apr.
2009.
TMCPI-R-[2011-07-0159-1]-En.docx 17
2. Factors promoting restructuring in the chemical industry
33. This chapter examines factors influencing restructuring in the chemical industry. M&A
play a number of important roles in the chemical industry. Most importantly, M&A help to
quickly boost values. A study by AlixPartners, a chemical consulting firm, showed a
merger of three European petrochemical firms that resulted in combining market share
from 33 per cent to 50 per cent in the monomer and polymer businesses. 1
34. The chemical industry has a strong link with macroeconomic trends. In the chemical
industry, there was a unique period of spectacular growth and seemingly endless
technology opportunities between 1945 and 1970. After 1970, growth slowed, and two oil
shocks and increasingly stringent environmental regulations had a tremendous impact on
the industry. From a long-term perspective, the chemical industry normalized, and ups and
downs followed each other periodically. Profitability of the chemical industry follows a
cyclical trend, which can be seen in figure 2.1. Since the mid-1970s, the profitability of the
chemical industry has had three peaks. The first peak-to-peak period lasted for about nine
years, between 1980 and 1989. The second peak-to-peak period lasted for about seven
years, between 1993 and 2000. The third peak-to-peak period lasted for about eight years,
between 2000 and 2009, which was shortly before the global economic crisis hit the
chemical industry.
Figure 2.1. Chemical firms’ performance, 1985–2009
Source: Petroleum Economist.
35. Figure 2.2 shows the restructuring that has taken place in the PE and PP sectors in the past
two decades. More M&A transactions are foreseen in these sectors. In 2009, the global
consumption of polymers reached an estimated 176 million metric tonnes (mt), with PE
accounting for 38 per cent of the total. Global demand for PE reached nearly 67 million mt
and is forecast to grow more than 5 per cent per year. Polymer demand overall has been
strong, particularly in China and the Middle East. SABIC‟s global polymer business
1 D. Hutchinson: Restructuring: A survival guide for European petrochemicals? (Michigan, MI,
AlixPartners LLP, 2005).
0
2
4
6
8
10
12
14
18 TMCPI-R-[2011-07-0159-1]-En.docx
increased in volume by 8 per cent in 2009, to 8.7 million mt per year. SABIC added
capacity in 2009 at its Sharq and Yansab ventures in Saudi Arabia and at its joint venture
with Sinopec in China. Slow growth in demand in the rest of the world has resulted in low
operating rates at the plants in North America and Europe. By 2011, excessive capacity is
expected to grow nearly 7 million mt in a global market of 14 million mt. This is expected
to push operating rates below 70 per cent; operating rates are not expected to recover until
after 2015. In Europe, producers need to focus on efficiency, customer relationships and
specialized products. Higher-cost capacity needs to be rationalized. In light of this, BASF
decided to spin off its styrenic business in January 2011. The spin-off includes its business
in styrene monomers, polystyrene (PS), acrylonitrile-butadiene-styrene (ABS), styrene
butadiene copolymers (SBC) and other styrene-based copolymers. This is to sustain and
improve its global business in an environment of volatile demand, high pressure on
margins and intensive competitiveness. 2
Figure 2.2. Corporate changes in the polyethylene (PE) and polypropylene (PP) sectors, 1983–2007
Source: Nexant Inc. (San Francisco, CA).
2.1. External environmental changes
36. The continued surge in prices of energy and feedstock is a concern for the petrochemical
industry. The prices of crude oil and natural gas are important factors governing profits.
Crude oil prices have been volatile in recent years. For example, in June 2008, the price of
West Texas Intermediate (WTI) crude oil hit an all-time high of US$145/bbl. In early
2011, in the middle of the uprisings in countries in the Middle East and Northern Africa,
2 L. Bewley et al.: “Plastics: Recovery replenishes outlook”, in Chemical Week (London and New
York, NY), 18 Oct. 2010, pp. 33–38.
1983
BASF Shell PP Hoechst BASF
Himont 1998 1997
PP PP
Targor Montell Elenac 1995
2000
2007 2005 Access
Industries Lyondell Basell
Funds PP/PE 2004
LyondellBasell 2007 PE Equistar
Montedison Hercules
PE
TMCPI-R-[2011-07-0159-1]-En.docx 19
crude oil prices exceeded US$100/bbl. 3 Royal Dutch Shell has warned that in 2011 the
world is entering a year of volatile transitions and intensified economic cycles. Price
volatility is likely to be a long-term trend. The oil industry is concerned that the recession
interrupted the oil and commodity price boom, but it may return. Emerging countries are
going through materially intensive development and a tighter market will continue to put
pressure on prices and generate volatility. 4
Some of the other major external
environmental changes for the chemical industry are discussed below.
2.1.1. Loss of pricing power
37. Chemical companies are losing their profits to “price leakage”, meaning the difference
between the price listed on an invoice and the actual amount a chemical producer retains.
Price leakage can occur as a result of negotiated discounts, freight costs, transportation
costs and extended payment terms. Large bulk chemical companies are using information
technology data-mining tools to examine price information for tactical and strategic
purposes. Chemical companies have been overhauling pricing procedures by reducing
contract lengths, particularly in the bulk petrochemical markets. For example, since the
early 2000s phenol producers have been pushing for a switch from quarterly to monthly
contracts, because of the volatility of feedstock prices. Subsequently, benzene and styrene
in Europe switched to monthly prices. Chemical firms are trying to get more flexibility in
contract terms. 5
38. Another pressure on pricing power comes from downstream. A notable change in the
supply and demand of chemicals is the growing negotiating power of chemical retailers
compared to chemical manufacturers. The increasing presence of chemical retailers is an
important factor in the restructuring of chemical suppliers. Surfactant suppliers have been
hard hit by a shift in power in the product value chain from surfactants to detergents.
Figure 2.3 shows the potential for value to be added and costs to be passed on at each step
along the value chain. However, in the past decade, retail chains have grown so large and
influential that they now dictate terms to the detergent producers and can successfully
reject cost increases. Surfactant producers are caught in the middle when raw material
price increases cannot be passed on to the mega-retailers and they are increasingly forced
to absorb the cost increases that develop as products move along the chain.
3 Energy Weekly, Roubini Global Economics (New York, NY), 9 June 2011.
4 “Shell warns world energy demand will outpace supply”, PennEnergy Research, 16 Feb. 2011.
5 “Dow Europe looks for PE hikes of €60/tonne”, in European Chemical News (Wageningen),
11–17 July 2005, p. 15.
20 TMCPI-R-[2011-07-0159-1]-En.docx
Figure 2.3. Surfactant value chain structure
Source: Colin A. Houston & Associates.
2.1.2. Chemical-related legislation
39. Targeting the development of affordable health care for the developing world would be
excellent public relations for major pharmaceutical companies, and could bring economic
and developmental benefits. Pharmaceutical companies have long limited their interaction
with developing markets, because of weak patent protection, opaque health-care systems
and the low profit such ventures would yield. In India, for example, the 1970 Patent Act
removed product patents for pharmaceuticals, food and agrochemicals, allowing patents
only for production processes. The statutory term was shortened to seven years for
pharmaceutical patents and automatic licensing was put in place. This started an era of
reverse engineering, where firms developed new products by changing production
processes. From 1970 on, Indian pharmaceutical firms slowly started dominating the
domestic market, reducing the market share of the Europe- and US-based pharmaceutical
firms. It is said that India‟s domestic firms have around 70 per cent of the market share
compared to 10 per cent in 1970. The Patent Act allowed Indian firms to adopt duplicative
imitation and creative imitation as strategies for technical capacity development. The law,
in part, promoted the development of the pharmaceutical industry in India. The Act, in
turn, boosted the industry. 6
40. Similarly, the chemical business is concerned about the long-term economic implications
of the European Union authorization system for industrial and consumer chemicals,
REACH (Registration, Evaluation, Authorisation and Restriction of Chemicals). The stated
6 S. Athreye, D. Kale and S.V. Ramani: Experimentation with strategy and the evolution of dynamic
capability in the Indian pharmaceutical sector, UNU-MERIT Working Paper No. 2008-041
(Maastricht, UNU-MERIT, 2008).
TMCPI-R-[2011-07-0159-1]-En.docx 21
objective of REACH is to ensure a high level of protection of human health and the
environment from the risks that can be posed by chemicals through better and earlier
identification of the intrinsic properties of chemical substances. It requires manufacturers
and importers to identify and manage the risks linked to the substances they manufacture
or import, and to have submitted a registration dossier for each substance to that effect to
the European Chemicals Agency.
41. However, chemical control overlaps with many other areas of governance, such as
cosmetics, pharmaceuticals, wastes, products, pollution, food and radiation; and in fields
such as health care and environmental management, risks from multiple stressors are
addressed, and need to be linked with chemical risks. The transposition of REACH and the
harmonization of its implementation remains a challenge to the chemical industry.
Legislative and institutional structures and functions are in flux, and the European
Chemical Industry Council (CEFIC) estimates that the average cost of putting a dossier
together for substances over 1,000 tonnes per year is around €2–3 million
(US$3–4 million), and there are examples where costs have spiked to more than
€10 million, when additional work is needed. This includes the total cost of tests,
administration, safety reports and management of the Substance Information Exchange
Forum (SIEF). 7 REACH is a contemporary representation of chemical control that will be
revised in 2012. While REACH attracts the most attention, other countries have also been
establishing or strengthening their own programmes for the regulation of chemicals,
including Canada, China, Japan, Switzerland, Turkey and the United States.
2.1.3. Increasing presence of financial firms
42. The weakening financial position of chemical firms in the early 1990s led to the growing
presence of financial investors in M&A activity in the industry. The takeover of chemical
businesses by finance groups has become a common phenomenon. The share of private
equity firms in overall M&A activity in the chemical industry increased from around 5 per
cent in 1997 to about 29 per cent of deals up to September 2004. 8 This trend continued
before the global economic crisis, and private equity firms have made a comeback after the
crisis as financing has become more available. In the first quarter of 2010, private equity
buyers completed 12 transactions of more than US$25 million, representing 26 per cent of
total deals. In 2009, private equity buyers completed only four deals, comprising 14 per
cent of total deals. Private equity can also wind up with a majority stake through the
bankruptcy process. In 2010, a consortium of Apollo Management and Access Industries
gained control of LyondellBasell through the United States bankruptcy process. 9 In 2010,
Apollo Management announced that it would merge Momentive Performance Materials
and Hexion to create one of the world‟s largest specialty chemicals and materials firms,
expanding the business from the United States and Europe to Asia and Latin America. 10
The traditional model is that private equity companies either strip the costs out of their
investments or bundle them with similar or complementary businesses before selling them
7 “News Focus: New era of REACH begins”, in ICIS Chemical Business (Sutton, Surrey), 6–12
Dec. 2010, p. 9.
8 E. Burridge: “M&A takes centre stage”, in ICIS Chemical Business (Sutton, Surrey),
29 Nov.–5 Dec. 2004, pp. 2–3.
9 J. Chang: “Chemical M&A to roar ahead in 2011”, in ICIS Chemical Business (Sutton, Surrey),
6–12 Dec. 2010, pp. 26–30.
10 R. Coons: “Apollo to merge Momentive and Hexion”, in Chemical Week (London and New York,
NY), 20 Sep. 2010, p. 6.
22 TMCPI-R-[2011-07-0159-1]-En.docx
on. The average life of an investment up to the point of sale is three-and-a-half to five
years. However, private equity companies do more than just acquire chemical firms; they
get involved in the firms‟ management in order to boost the profits of their investment.
2.2. Why chemical firms restructure
43. Chemical firms restructure in order to strengthen their competitive advantage. For
example, BASF promotes portfolio management to ensure long-term sustainability and
competitiveness. Since 2006, BASF‟s recent acquisitions have included the interests of
former Engelhard and Degussa in 2006, Ciba in 2009, and Cognis in 2010. A number of
structural measures, such as splitting operating/functional units, legal entity consolidations,
reallocation of resources, and divestures owing to anti-trust obligations, have been
involved in the integration of these acquisitions. In 2011, the company intends to carve out
its styrenics business into a joint venture established with INEOS. When it is involved in
M&A transactions, BASF takes into consideration the following factors: optimizing
processes, avoiding redundancies, improving cost structures, developing new markets,
inventing new ideas and knowledge, concentrating the workforce on/in future
businesses. 11
UBE Chemical Europe stated that it considered improving its effectiveness
in the international market and its standards of quality and service improvement were
deemed to be key. 12
Solvay Ibérica stated that in order to implement the group‟s global
strategies based on innovation and geographic growth, the company focused on the
promotion of green chemistry and energy and resource savings measures. 13
The following
sections provide some examples of how chemical firms foster competitive advantages.
2.2.1. Maximizing value
44. Schmidt and Rühli (2002) examined how the merger of Sandoz and Ciba (creating
Novartis) boosted the value of the two merging companies. As shown in table 2.1, when
the merger was announced in 1995, both Sandoz and Ciba were already successful in the
pharmaceutical, agricultural, chemical, and nutrition industries.
Table 2.1. Pre-merger profiles of Sandoz and Ciba, 1995
Sandoz Ciba
Revenue (Swiss francs) 15 billion 20.5 billion
Profit (Swiss francs) 2 billion 2 billion
R&D budget (Swiss francs) 1.5 billion 2 billion
Workforce 50 000 84 000
Divisional revenue breakdown Pharma (50%) Health care (39%)
Nutrition (26%) Agriculture (23%)
Agriculture and seeds (16%) Industry (38%)
Construction chemicals (8%)
Source: S. Schmidt and E. Rühli: “Prior strategy processes as a key to understanding mega-mergers: The Novartis case”, in European Management Journal (Amsterdam, Elsevier), Vol. 20, No. 3, 2002, pp. 223–234.
11 Information provided to the ILO by BASF SE.
12 Information provided to the ILO by UBE Chemical Europe SA.
13 Information provided to the ILO by Solvay Ibérica SL.
TMCPI-R-[2011-07-0159-1]-En.docx 23
45. The Novartis case was a merger of equals through an exchange of equity, so that no
takeover premiums had to be paid. Novartis rapidly became the world‟s number one in the
pharmaceuticals and agriculture sectors. At the same time, important parts of the former
businesses of both firms were separated through spin-offs, such as specialty chemicals at
Ciba or the construction chemicals of Master Builder Technology (MBT) at Sandoz. At
Ciba and Sandoz alike, health care was the most important business unit in terms of both
strategy and sales. It was also given top priority within Novartis. Health care includes the
pharmaceuticals, consumer health, generics and Ciba Vision divisions. Each of the
combined units reached leading market positions, as shown in table 2.2. The Ciba and
Sandoz merger is still relevant today.
Table 2.2. Positions of health-care divisions before and after the Ciba–Sandoz merger
Before After
Ciba Sandoz Novartis
Pharmaceuticals Worldwide: No. 10 Worldwide: No.11 Worldwide: No. 2
Consumer health Europe: >No. 5 Europe: >No.10 Europe: No. 5
USA: >No. 5 USA: >No.10 USA: No. 7
Generics Worldwide: Retail: No. 2 Worldwide: Industrial (biochemistry): No. 2
Worldwide: No. 1
Ciba Vision Worldwide: Eye care: No. 2; Ophthalmic: No. 5
None Worldwide: Eye care: No. 2; Ophthalmic: No. 5
Source: S. Schmidt and E. Rühli: “Prior strategy processes as a key to understanding mega-mergers: The Novartis case”, in European Management Journal (Amsterdam, Elsevier), Vol. 20, No. 3, 2002, pp. 223–234.
46. Table 2.3 shows a comparison of Pfizer and Wyeth; the former acquired the latter in 2009.
Similar to the Ciba–Sandoz merger, this table shows how Pfizer has created value out of
this acquisition. Before the merger, 25 per cent of Pfizer‟s revenue came from Lipitor, but
the drug is due to lose patent protection in November 2011. The company needed a
diversified portfolio of new drugs and had been unable to create enough of them on its
own. Wyeth was in a similar situation. After the merger, the new company had 17 different
prescription drugs on the market in 2009, each of which brought in around US$1 billion or
more. 14
14 “Pfizer CEO: Wyeth takeover will be different”, in Bloomberg Businessweek (New York, NY),
26 Jan. 2009.
24 TMCPI-R-[2011-07-0159-1]-En.docx
Table 2.3. Corporate data of two pharmaceutical companies, Pfizer and Wyeth
Pfizer Wyeth
Employees About 83 000 About 47 000
Estimated 2008 revenue US$49 billion US$23.5 billion
Market value US$117 billion US$58 billion
Key products and sales (US$ billion)
Lipitor US$13.0 (cholesterol) Effexor US$4.0 (depression)
Lyrica US$2.6 (pain) Enbrel US$3.5 (arthritis)
Novasc US$2.3 (blood pressure) Prevnar US$2.2 (vaccine)
Viagra US$2.0 (impotence) Infant nutritionals US$1.6
Xalatan US$1.8 (glaucoma) Zosyn US$1.3 (antibiotic)
Detrol US$1.2 (bladder control) Premarin US$1.1 (menopause)
Source: “Pfizer agrees to pay US$68 billion for rival drug maker Wyeth”, in The New York Times (New York, NY), 26 Jan. 2009.
2.2.2. Synergies
47. Tait et al. (2002) examined how chemical firms choose their business partners in light of
technical innovation to strengthen synergies between their products. In a series of
takeovers and mergers in the 1970s, multinational agrochemical firms were looking for a
new research and development (R&D) trajectory that would enable them to avoid
becoming mere producers of commodity chemicals. Biotechnology was deemed to provide
the solution to this problem. The agrochemical industry had become relatively
concentrated in the late 1990s. Turnover of each of the world‟s top nine agrochemical
firms exceeded US$2 billion. The top ten companies represented more than 75 per cent of
the world market. During the late 1990s, mergers reduced these ten to seven: AgroEvo and
Rhône Poulenc merged to form Aventis Crop Science; BASF acquired American
Cyanamid; and the agrochemical divisions of Novartis and Zeneca merged to form
Syngenta. The subsequent process separating agrochemical from pharmaceutical divisions,
begun by Syngenta, has spread to most multinational chemical firms. In the biotechnology
arena, public and private finance combined to create a sustainable example of technology
push that continues today.
48. Life science increased its significance throughout the 1990s. In practice, there were
synergies between agro-biotechnology and pharmaceutical innovation, and life science
emerged from those synergies, which became the prime movers of chemical firms.
However, synergies between pharmaceutical and agricultural areas of biotechnology
became less important. Discovery-level synergy works well where pharmaceutical and
agro-biotechnology sectors are interested in sources of chemical novelty, but not in the
gene area. Functional genomics can help both sides to invent novel and profitable
chemicals, but the major commercial opportunities in the creation of genetically modified
crops have no parallel in pharmaceuticals. Chemical firms do not provide the link between
the agrochemical and pharmaceutical divisions of companies. Managers of the agricultural
arms of biotechnology companies see alignment with other agribusinesses, fighting for
agricultural investment. The result of this change in the relationships between agro-
biotechnology and pharmaceutical sectors of companies can be seen in the changed pattern
of mergers and de-mergers among life science companies. This can be seen in the splitting
off from their pharmaceutical divisions of the agrochemical and seeds divisions of
Novartis and Zeneca to form Syngenta. In the merger of Zeneca with Astra in 1999,
Zeneca had argued for a life sciences model that included agrochemicals, but there was no
apparent model for the agrochemicals unit in the merged company. Novartis described
1999 as the year in which it took further steps to focus its business portfolio, moving from
TMCPI-R-[2011-07-0159-1]-En.docx 25
a life science company to a pure health-care company. The demise of pharmaceutical and
agrochemical links, and the focusing of attention on the synergy between chemicals and
biotechnology, is leading to new patterns of alliance among life science companies. 15
2.2.3. Moving into growing markets
49. The production of chemicals is moving closer to the major consumers. Chemical
companies have been implementing restructuring programmes aimed at tipping the
companies towards the growth markets in China and other emerging economies. For
example, in 1980, nylon accounted for more than 10 per cent of global fibre production,
but by 2000, nylon‟s share had fallen to 7.4 per cent, and by 2009 to only 5.4 per cent. At
half the cost of nylon, polyester now dominates the market for synthetic fibres. Demand
for fibres has expanded so rapidly over the same period that nylon has lost no ground in
absolute terms. From 3 million tonnes in 1980, global production of nylon fibre grew to
3.7 million tonnes in 2009, and it may continue growing at just under 2 per cent per year to
4.4 million tonnes in 2020. Nylon‟s displacement by polyester is unlikely to proceed much
further. However, the geographic distribution of both demand and production has changed
significantly, and the trend may continue. Nylon filament yarn production in North
America has fallen at an average rate of 5.2 per cent per year since 2005, and 2.5 per cent
for Europe. By contrast, China has been taking up the slack. In 2009, the country produced
1.4 million tonnes of nylon filament yarn. Downstream demand growth for nylon is
gradually becoming concentred in China. Nylon demand in China is expected to grow in
line with the country‟s GDP – probably more than 10 per cent per year over the next two
or three years. 16
2.2.4. Cost-efficiency in research and development
50. The pharmaceutical industry is characterized by large amounts of R&D. It is also an
industry that depends on that research to be productive and generate revenue to finance
future research. There is a positive correlation between firms‟ knowledge diversification
and performance. Today, drug development has become an interactive process, where the
timing, type and impact of marketing is balanced and managed through certain
organizational mechanisms throughout the R&D process. One significant reason for M&A
is to reduce the burden of expenditure, in particular R&D. Addressing the
2002 GlaxoWellcome and SmithKline Beecham merger to form GlaxoSmithKline (GSK),
Heracleous and Murray (2001) stated that an increasing percentage of sales following the
M&A had been spent on R&D, which had risen from around US$20 billion annually in the
early 1990s to around US$35 billion in 1999. AstraZeneca spent 19.8 per cent of its 1998
sales on R&D; Hoffmann-LaRoche, 19.1 per cent; and Eli Lilly, 18.8 per cent. 17
51. The global economic crisis has led drug firms to improve productivity and offset the
impact of generic competition; the major drug companies are making drastic cuts to their
R&D operations. For example, in early 2010 GSK announced that it would carve
15 J. Tait et al.: “The life science industry sector: Evolution of agro-biotechnology in Europe”, in
Science and Public Policy (Guildford, Surrey, Beech Tree Publishing), Vol. 29, No. 4, Aug. 2002,
pp. 253–258.
16 J. Lin: “Nylon shifts toward Asia”, in ICIS Chemical Business (Sutton, Surrey), 30 Aug.–5 Sep.
2010, pp. 32–33.
17 L. Heracleous and J. Murray: “The urge to merge in the pharmaceutical industry”, in European
Management Journal (Amsterdam, Elsevier), Vol. 19, No. 4, Aug. 2001, pp. 430–437.
26 TMCPI-R-[2011-07-0159-1]-En.docx
US$800 million out of its cost structure by 2012; half of that amount will come from R&D.
AstraZeneca has slashed over 23,000 positions since 2007. The company has also dropped
20 compounds from development and formed a portfolio investment board that will make
decisions about funding individual R&D projects. Pfizer will spend far less on research in
coming years. In 2009, the R&D budget was nearly flat at US$10.6 billion, compared with
2008, and the company will spend US$9.1 billion to US$9.6 billion in 2010. By 2012, it is
forecast that R&D spending will be US$8 billion. 18
52. Too great a reduction in investment in R&D may harm the long-term prospects of the
chemical industry. The Dutch chemical company DSM has survived for more than a
century by transforming itself from a coal-mining company to a fertilizer producer to a
diversified bulk chemicals company, and again to a company focused on fine chemicals
and high-performance materials. The history of DSM shows how the in-house R&D unit
has played a crucial role in developing the company‟s businesses, both by helping
diversification and improving existing processes and products. While this is not the only
company unit responsible for the success or failure of innovation processes, it is the source
of potentially profitable innovations. In the long term, it is clear that an integrated part of
R&D is concern about its productiveness and its relation to business. The main challenge a
company faces in organizing R&D has not changed; companies need to keep their research
focused on areas that are related to the markets in which they operate and the technologies
they use. At the same time, they must find ways to accommodate an organization that
formulates visions and generates ideas that might be removed from current interests, that
might be long term and that might fail, but at the same time hold promise of profit and
success. 19
18 L. Jarvis: “More R&D cuts from big pharma”, in C&EN (Washington, DC, American Chemical
Society), 4 Feb. 2010.
19 A. van Rooij: “How R&D helped transform DSM”, in Research-Technology Management
(Arlington, VA, Industrial Research Institute Inc.), Vol. 51, No. 1, Jan.–Feb. 2008, pp. 43–48.
TMCPI-R-[2011-07-0159-1]-En.docx 27
3. The impact of restructuring on employment and conditions of work
53. In the first two chapters we examined the evolution of restructuring in the chemical
industry. Our focus now turns to the impact of restructuring on workers in the industry,
with ILO constituents illustrating how restructuring has affected their working conditions.
For example, the Chemical, Petroleum, Rubber and Plastic Industries Employers‟
Association of Turkey (KIPLAS) reported that restructuring had led to significant
improvements in working conditions and financial incentives at work for employees and
chemical companies alike. It had also observed a shift from collective incentives to
individual incentives on workers‟ remuneration. KIPLAS pointed out that Turkish
chemical firms and their employees made a priority of flexibility at work and job security
for workers. 1 Similarly, Boehringer Ingelheim Austria reported that the company had
introduced shift work in plants, as well as additional meals services for the new three-shift
systems. 2 These subjects are examined in this chapter.
3.1. Employment
3.1.1. Global employment trends in the chemical industry
54. According to the United Nations Industrial Development Organization (UNIDO) Industrial
Statistics database, it is estimated that more than 11.5 million people are currently
employed in the global chemical industry, including the pharmaceutical and the rubber and
plastic products sectors. As mentioned in the Introduction, the ILO estimates that there are
up to 20 million people working in the global chemical and pharmaceutical industries and
rubber and tyre industries. Table 3.1 shows global employment in the chemical and
pharmaceutical industries for 2000–06. Global chemical employment displays the
following trends.
55. First, global chemical employment is showing a gradual and constant decline over time. In
2000, more than 13 million people were employed in the global chemical industry;
however, between 2000 and 2006, the global chemical industry lost more than 1.5 million
jobs.
56. Second, the share of chemical employment within overall manufacturing industry
employment is decreasing over time. In the early 2000s, the share of chemical employment
within overall manufacturing industry employment accounted for slightly over 10 per cent;
however, in 2006 the share declined to around 7 per cent.
57. Third, chemical employment in the basic chemicals and the other chemicals sectors
declined, while employment in the rubber products sector remained relatively unchanged.
This indicates, among other things, that rationalization of the workforce has been carried
out, particularly in the petrochemicals and the industrial chemicals sectors, although
because the rubber production process is more labour-intensive than the petrochemicals
sector, employment in the rubber products sector has remained stable (figure 3.1).
1 Information provided to the ILO by KIPLAS.
2 Information provided to the ILO by Boehringer Ingelheim Austria.
28 TMCPI-R-[2011-07-0159-1]-En.docx
58. Fourth, employment in the subsectors within the chemical industry shows those that have
been evolving over time. The specific numbers of jobs created and lost can be seen in
table 3.1; and figures 3.2(a) and 3.2(b) show a comparison of global chemical employment
by subsector in 2000 and 2006. Jobs were created in seven subsectors – basic chemicals,
except fertilizers; fertilizers and nitrogen compounds; plastics in primary forms and
synthetic rubber; pharmaceuticals and medicinal chemicals; soap, cleaning and cosmetic
preparations; other rubber products; and plastic products. Jobs were lost in two sectors –
pesticides and other agrochemical products; and other chemical products not elsewhere
classified. Employment remained unchanged in the three remaining sectors – paints,
varnishes, printing ink and mastics; man-made fibres; and rubber tyres and tubes
(figures 3.2(a) and 3.2(b)).
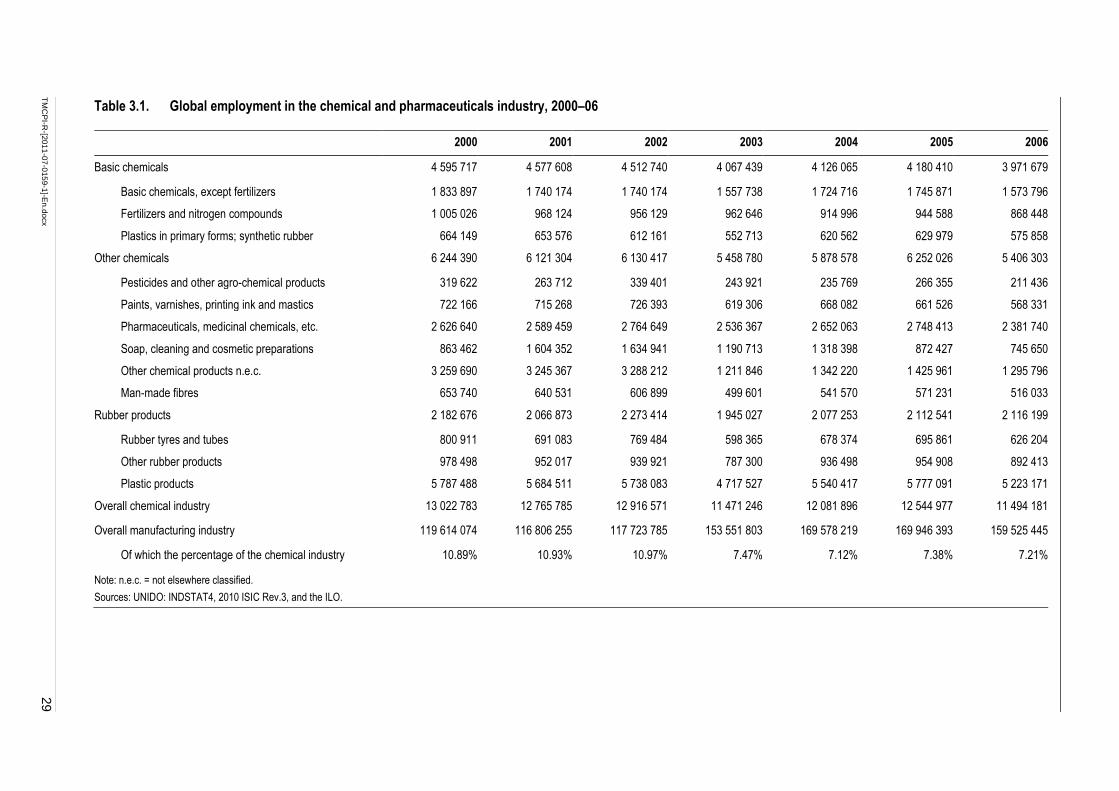
TM
CP
I-R-[2
01
1-0
7-0
15
9-1
]-En
.do
cx
29
Table 3.1. Global employment in the chemical and pharmaceuticals industry, 2000–06
2000 2001 2002 2003 2004 2005 2006
Basic chemicals 4 595 717 4 577 608 4 512 740 4 067 439 4 126 065 4 180 410 3 971 679
Basic chemicals, except fertilizers 1 833 897 1 740 174 1 740 174 1 557 738 1 724 716 1 745 871 1 573 796
Fertilizers and nitrogen compounds 1 005 026 968 124 956 129 962 646 914 996 944 588 868 448
Plastics in primary forms; synthetic rubber 664 149 653 576 612 161 552 713 620 562 629 979 575 858
Other chemicals 6 244 390 6 121 304 6 130 417 5 458 780 5 878 578 6 252 026 5 406 303
Pesticides and other agro-chemical products 319 622 263 712 339 401 243 921 235 769 266 355 211 436
Paints, varnishes, printing ink and mastics 722 166 715 268 726 393 619 306 668 082 661 526 568 331
Pharmaceuticals, medicinal chemicals, etc. 2 626 640 2 589 459 2 764 649 2 536 367 2 652 063 2 748 413 2 381 740
Soap, cleaning and cosmetic preparations 863 462 1 604 352 1 634 941 1 190 713 1 318 398 872 427 745 650
Other chemical products n.e.c. 3 259 690 3 245 367 3 288 212 1 211 846 1 342 220 1 425 961 1 295 796
Man-made fibres 653 740 640 531 606 899 499 601 541 570 571 231 516 033
Rubber products 2 182 676 2 066 873 2 273 414 1 945 027 2 077 253 2 112 541 2 116 199
Rubber tyres and tubes 800 911 691 083 769 484 598 365 678 374 695 861 626 204
Other rubber products 978 498 952 017 939 921 787 300 936 498 954 908 892 413
Plastic products 5 787 488 5 684 511 5 738 083 4 717 527 5 540 417 5 777 091 5 223 171
Overall chemical industry 13 022 783 12 765 785 12 916 571 11 471 246 12 081 896 12 544 977 11 494 181
Overall manufacturing industry 119 614 074 116 806 255 117 723 785 153 551 803 169 578 219 169 946 393 159 525 445
Of which the percentage of the chemical industry 10.89% 10.93% 10.97% 7.47% 7.12% 7.38% 7.21%
Note: n.e.c. = not elsewhere classified.
Sources: UNIDO: INDSTAT4, 2010 ISIC Rev.3, and the ILO.
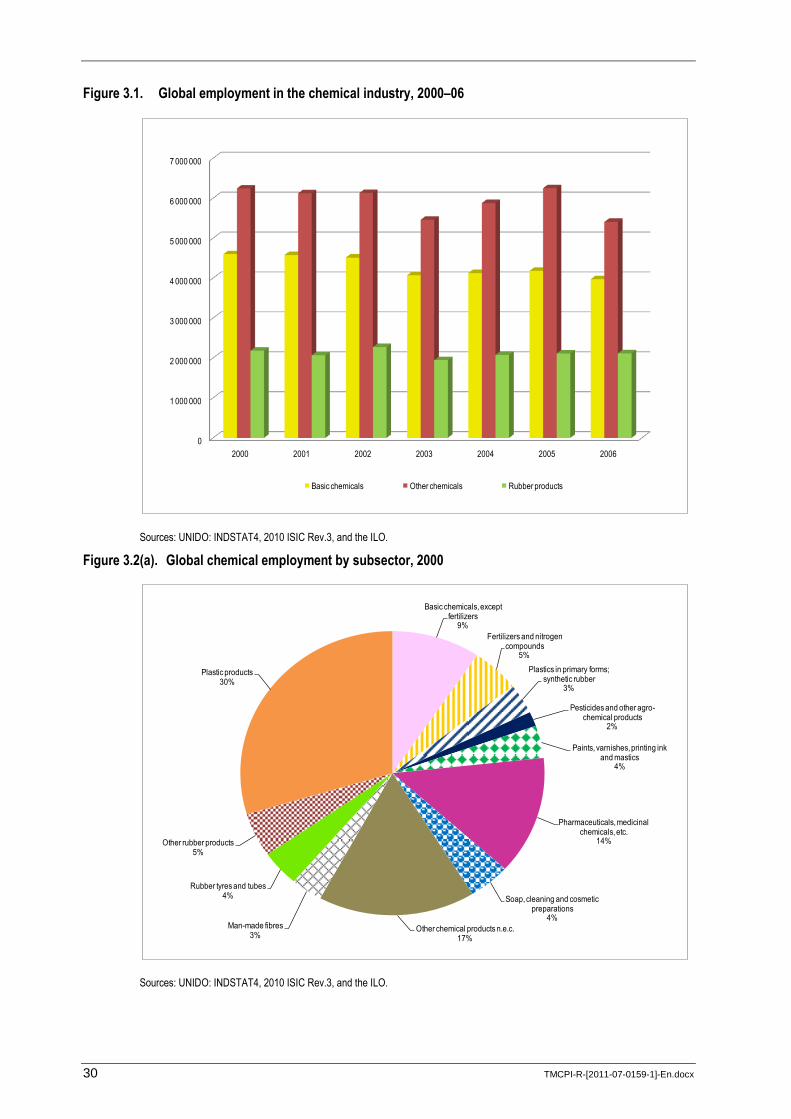
30 TMCPI-R-[2011-07-0159-1]-En.docx
Figure 3.1. Global employment in the chemical industry, 2000–06
Sources: UNIDO: INDSTAT4, 2010 ISIC Rev.3, and the ILO.
Figure 3.2(a). Global chemical employment by subsector, 2000
Sources: UNIDO: INDSTAT4, 2010 ISIC Rev.3, and the ILO.
0
1 000 000
2 000 000
3 000 000
4 000 000
5 000 000
6 000 000
7 000 000
2000 2001 2002 2003 2004 2005 2006
Basic chemicals Other chemicals Rubber products
Basic chemicals, except fertilizers
9%
Fertilizers and nitrogen compounds
5%
Plastics in primary forms; synthetic rubber
3%
Pesticides and other agro-chemical products
2%
Paints, varnishes, printing ink and mastics
4%
Pharmaceuticals, medicinal chemicals, etc.
14%
Soap, cleaning and cosmetic preparations
4%
Other chemical products n.e.c.17%
Man-made fibres3%
Rubber tyres and tubes4%
Other rubber products5%
Plastic products30%
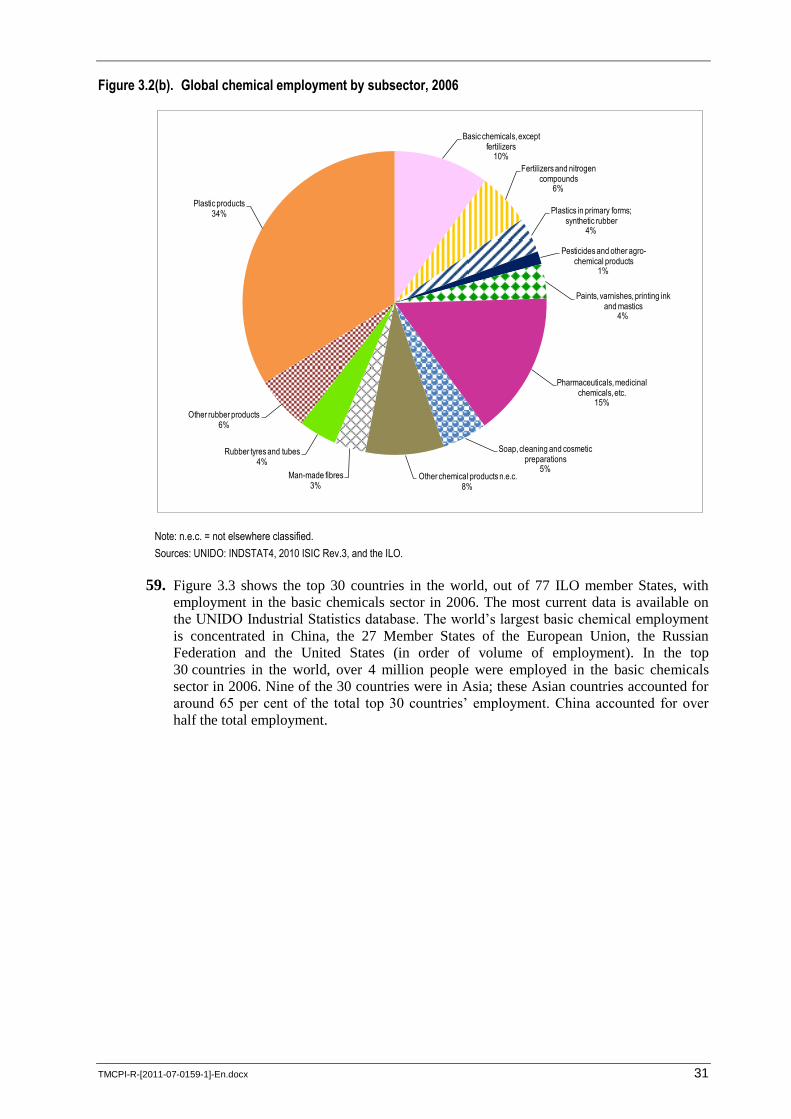
TMCPI-R-[2011-07-0159-1]-En.docx 31
Figure 3.2(b). Global chemical employment by subsector, 2006
Note: n.e.c. = not elsewhere classified.
Sources: UNIDO: INDSTAT4, 2010 ISIC Rev.3, and the ILO.
59. Figure 3.3 shows the top 30 countries in the world, out of 77 ILO member States, with
employment in the basic chemicals sector in 2006. The most current data is available on
the UNIDO Industrial Statistics database. The world‟s largest basic chemical employment
is concentrated in China, the 27 Member States of the European Union, the Russian
Federation and the United States (in order of volume of employment). In the top
30 countries in the world, over 4 million people were employed in the basic chemicals
sector in 2006. Nine of the 30 countries were in Asia; these Asian countries accounted for
around 65 per cent of the total top 30 countries‟ employment. China accounted for over
half the total employment.
Basic chemicals, except fertilizers
10%
Fertilizers and nitrogen compounds
6%
Plastics in primary forms; synthetic rubber
4%
Pesticides and other agro-chemical products
1%
Paints, varnishes, printing ink and mastics
4%
Pharmaceuticals, medicinal chemicals, etc.
15%
Soap, cleaning and cosmetic preparations
5%Other chemical products n.e.c.
8%
Man-made fibres3%
Rubber tyres and tubes4%
Other rubber products 6%
Plastic products34%
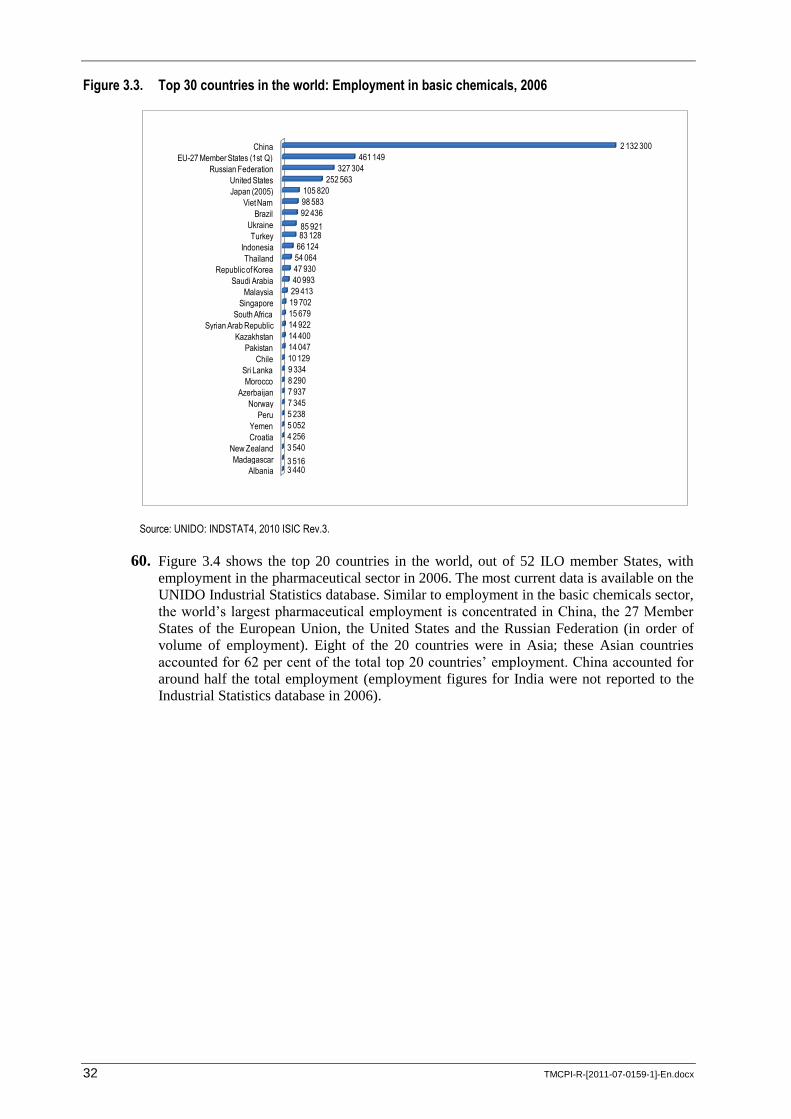
32 TMCPI-R-[2011-07-0159-1]-En.docx
Figure 3.3. Top 30 countries in the world: Employment in basic chemicals, 2006
Source: UNIDO: INDSTAT4, 2010 ISIC Rev.3.
60. Figure 3.4 shows the top 20 countries in the world, out of 52 ILO member States, with
employment in the pharmaceutical sector in 2006. The most current data is available on the
UNIDO Industrial Statistics database. Similar to employment in the basic chemicals sector,
the world‟s largest pharmaceutical employment is concentrated in China, the 27 Member
States of the European Union, the United States and the Russian Federation (in order of
volume of employment). Eight of the 20 countries were in Asia; these Asian countries
accounted for 62 per cent of the total top 20 countries‟ employment. China accounted for
around half the total employment (employment figures for India were not reported to the
Industrial Statistics database in 2006).
Albania
Madagascar
New Zealand
Croatia
Yemen
Peru
Norway
Azerbaijan
Morocco
Sri Lanka
Chile
Pakistan
Kazakhstan
Syrian Arab Republic
South Africa
Singapore
Malaysia
Saudi Arabia
Republic of Korea
Thailand
Indonesia
Turkey
Ukraine
Brazil
Viet Nam
Japan (2005)
United States
Russian Federation
EU-27 Member States (1st Q)
China
3 4403 516
3 540
4 256
5 052
5 238
7 345
7 937
8 290
9 334
10 129
14 047
14 400
14 922
15 679
19 702
29 413
40 993
47 930
54 064
66 124
83 12885 921
92 436
98 583
105 820
252 563
327 304
461 149
2 132 300
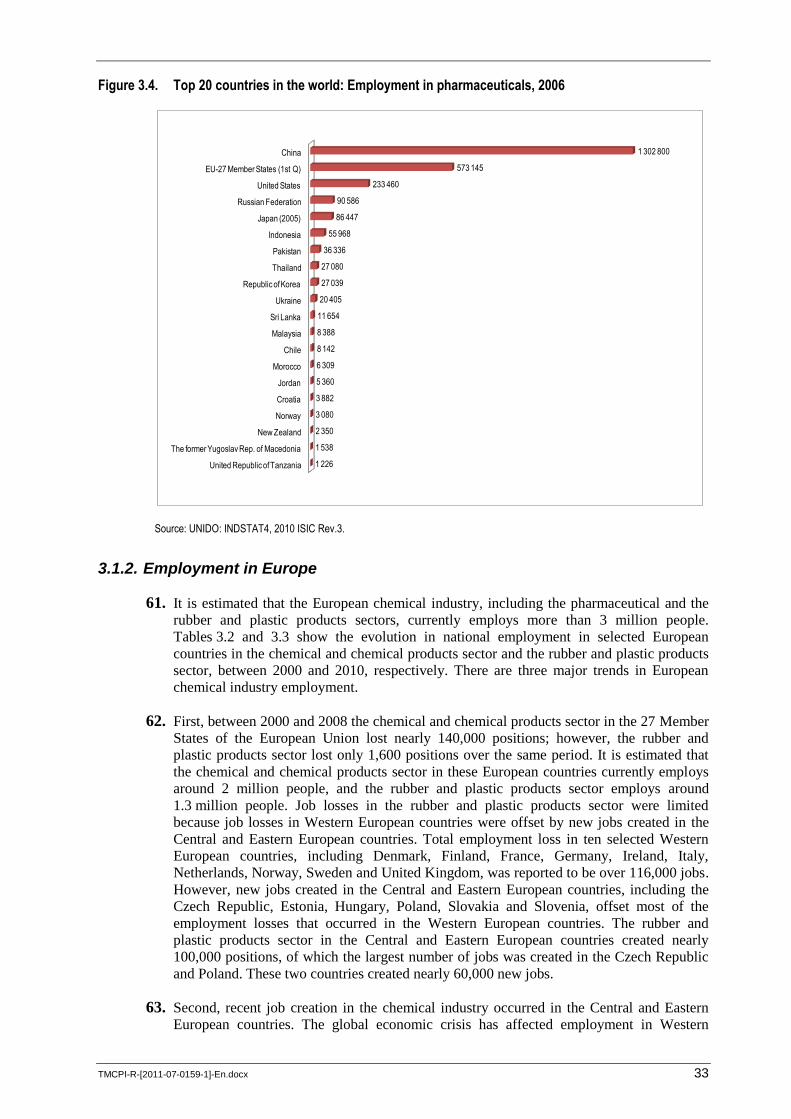
TMCPI-R-[2011-07-0159-1]-En.docx 33
Figure 3.4. Top 20 countries in the world: Employment in pharmaceuticals, 2006
Source: UNIDO: INDSTAT4, 2010 ISIC Rev.3.
3.1.2. Employment in Europe
61. It is estimated that the European chemical industry, including the pharmaceutical and the
rubber and plastic products sectors, currently employs more than 3 million people.
Tables 3.2 and 3.3 show the evolution in national employment in selected European
countries in the chemical and chemical products sector and the rubber and plastic products
sector, between 2000 and 2010, respectively. There are three major trends in European
chemical industry employment.
62. First, between 2000 and 2008 the chemical and chemical products sector in the 27 Member
States of the European Union lost nearly 140,000 positions; however, the rubber and
plastic products sector lost only 1,600 positions over the same period. It is estimated that
the chemical and chemical products sector in these European countries currently employs
around 2 million people, and the rubber and plastic products sector employs around
1.3 million people. Job losses in the rubber and plastic products sector were limited
because job losses in Western European countries were offset by new jobs created in the
Central and Eastern European countries. Total employment loss in ten selected Western
European countries, including Denmark, Finland, France, Germany, Ireland, Italy,
Netherlands, Norway, Sweden and United Kingdom, was reported to be over 116,000 jobs.
However, new jobs created in the Central and Eastern European countries, including the
Czech Republic, Estonia, Hungary, Poland, Slovakia and Slovenia, offset most of the
employment losses that occurred in the Western European countries. The rubber and
plastic products sector in the Central and Eastern European countries created nearly
100,000 positions, of which the largest number of jobs was created in the Czech Republic
and Poland. These two countries created nearly 60,000 new jobs.
63. Second, recent job creation in the chemical industry occurred in the Central and Eastern
European countries. The global economic crisis has affected employment in Western
United Republic of Tanzania
The former Yugoslav Rep. of Macedonia
New Zealand
Norway
Croatia
Jordan
Morocco
Chile
Malaysia
Sri Lanka
Ukraine
Republic of Korea
Thailand
Pakistan
Indonesia
Japan (2005)
Russian Federation
United States
EU-27 Member States (1st Q)
China
1 226
1 538
2 350
3 080
3 882
5 360
6 309
8 142
8 388
11 654
20 405
27 039
27 080
36 336
55 968
86 447
90 586
233 460
573 145
1 302 800
34 TMCPI-R-[2011-07-0159-1]-En.docx
European countries, while the chemical industry in the Central and Eastern European
countries was less affected or has even been growing during the crisis. In one year,
between 2007 and 2008, more than 16,000 jobs were lost in the Western European
countries, including Greece, Ireland, Italy, Luxemburg, Norway, Sweden and United
Kingdom, of which one-third were lost in the United Kingdom alone. By contrast, over the
same period, around 39,000 new jobs were created in some Western European countries
and the Central and Eastern European countries, including Austria, Belgium, Czech
Republic, Denmark, Estonia, Finland, France, Portugal, Slovenia and Spain, although a
large volume of the new jobs created were concentrated in the Central and Eastern
European countries.
64. A similar trend can be observed in the rubber and plastic products sector, where more than
12,000 jobs disappeared in 2007 and 2008, over half of which were in the United
Kingdom. By contrast, more than 22,000 jobs were created in the Central and Eastern
European countries, the majority of which were in Poland.
65. It should be noted that chemical workers in small and medium-sized firms have been most
affected by the global economic crisis. In the European Union, the available data suggests
that the number of workers employed at small and medium-sized enterprises with fewer
than 250 employees in the manufacture of chemicals and chemical products declined from
19,000 in 2006 to 18,607 in 2007, and to 10,500 in 2008. 1 The actual figures may be even
greater.
1 European Commission: Eurostat.
TM
CP
I-R-[2
01
1-0
7-0
15
9-1
]-En
.do
cx
35
Table 3.2. Employment in the chemical and chemical product sector in selected European countries, 2000–10
2000 2001 2002 2003 2004 2005 2006 2007 2008 2009 2010 (first quarter)
Change in employment
Between 2007 and 2008
Between 2000 and 2008 or latest year data is available
EU-27 Member States n.a. n.a. n.a. n.a. n.a. 1 655 964 (b) 1 672 505 (b) 1 707 455 (b) 1 559 529 (b) 1 747 624 (b) 1 761 746 (b) n.a. n.a.
Austria 57 205 (a) 57 101 (a) 56 525 (a) 56 435 (a) 55 209 (a) 55 022 (a) 56 288 (a) 58 171 (a) 59 614 (a) 31 237 (b) 32 188 (b) 1 443 2 409
Belgium 103 507 (a) 105 210 (a) 103 104 (a) 101 922 (a) 101 166 (a) 101 166 (a) 100 719( a) 100 532 (a) 100 681 (a) n.a. n.a. 149 -2 826
Czech Republic 43 032 (a) 43 074 (a) 41 536 (a) 41 908 (a) 41 119 (a) 42 660 (a) 41 049 (a) 39 899 (a) 49 966 (b) 50 310 (b) 51 053 (b) 10 067 6 934
Denmark 47 087 (a) 49 493 (a) 48 577 (a) 50 419 (a) 49 440 (a) 48 901 (a) 48 050 (a) 50 551 (a) 50 976 (a) n.a. n.a. 425 3 889
Estonia 5 700 (a) 6 600 (a) 4 000 (a) 4 800 (a) 7 000 (a) 7 000 (a) 8 100 (a) 8 300 (a) 10 200 (a) n.a. n.a. 1 900 4 500
Finland 40 900 (a) 40 600 (a) 40 300 (a) 38 500 (a) 38 100 (a) 37 000 (a) 36 300 (a) 36 500 (a) 36 700 (a) 17 126 (b) 17 073 (b) 200 -4 200
France 388 036 (a) 386 700 (a) 385 046 (a) 383 955 (a) 380 180 (a) 378 517 (a) 369 482 (a) 363 407 (a) 282 246 (b) 290 384 (b) 310 853 (b) n.a. -24 629
Germany 943 000 (a) 948 000 (a) 923 000 (a) 912 000 (a) 881 000 (a) 861 000 (a) 856 000 (a) 868 000 (a) 565 754 (b) 567 287 (b) 561 978 (b) n.a. -75 000
Greece 38 416 (a) 46 458 (a) 47 887 (a) 42 204 (a) 49 832 (a) 46 314 (a) 47 012 (a) 47 199 (a) 45 523 (a) 27 101(b) 28 367 (b) -1 676 7 107
Hungary 97 455 (a) 89 623 (a) 92 845 (a) 87 885 (a) 87 799 (a) 87 990 (a) 87 793 (a) 86 326 (a) n.a. n.a. n.a. n.a. -11 129
Ireland 36 703 (a) 37 868 (a) 38 404 (a) 37 768 (a) 37 878 (a) 37 709 (a) 38 322 (a) 38 312 (a) 36 872 (a) n.a. n.a. -1 440 169
Italy 430 900 (a) 428 300 (a) 433 300 (a) 425 100 (a) 418 800 (a) 418 900 (a) 414 100 (a) 415 000 (a) 408 700 (a) n.a. n.a. -6 300 -22 200
Lithuania n.a. n.a. n.a. n.a. n.a. n.a. n.a. n.a. 6 830 (b) 7 270 (b) n.a. n.a. n.a.
Luxembourg 5 600 (a) 5 500 (a) 5 200 (a) 6 000 (a) 5 900 (a) 5 700 (a) 5 400 (a) 5 100 (a) 5 100 (a) n.a. n.a. 0 -500
Malta n.a. n.a. n.a. n.a. n.a. n.a. n.a. n.a. 610 (b) 938 (b) 1 212 (b) n.a. n.a.
Netherlands 114 574 (a) 115 228 (a) 115 184 (a) 112 378 (a) 109 940 (a) 108 043 (a) 107 478 (a) 107 165 (a) 107 113 (a) 64 464 (b) 68 912 (b) -52 -7 461
Norway 22 400 (a) 21 200 (a) 20 500 (a) 20 800 (a) 20 700 (a) 21 500 (a) 22 100 (a) 22 000 (a) 15 124 (b) 12 458 (b) 11 814 (b) n.a. -400
Poland 285 166 (a) 270 500 (a) 244 900 (a) 229 100 (a) 252 400 (a) 257 000 (a) 270 900 (a) 287 300 (a) 312 800 (a) 125 419 (b) 134 042 (b) 25 500 27 634
36
T
MC
PI-R
-[20
11
-07
-015
9-1
]-En
.do
cx
2000 2001 2002 2003 2004 2005 2006 2007 2008 2009 2010 (first quarter)
Change in employment
Between 2007 and 2008
Between 2000 and 2008 or latest year data is available
Portugal 23 173 (a) 22 128 (a) 23 058 (a) 22 567 (a) 21 960 (a) 21 780 (a) 21 166 (a) n.a. 28 078 (b) 26 631 (b) 21 374 (b) n.a. -2 007
Romania n.a. n.a. n.a. n.a. n.a. n.a. n.a. n.a. 48 212 (b) 46 383 (b) 49 020 (b) n.a. n.a.
Slovakia 42 385 (a) 42 054 (a) 41 894 (a) 41 829 (a) 38 774 (a) 37 151 (a) 38 532 (a) 40 788 (a) 44 698 (a) 14 521 (b) 11 439 (b) 3 910 2 313
Slovenia 13 843 (a) 13 788 (a) 13 750 (a) 13 965 (a) 13 919 (a) 13 763 (a) 13 630 (a) 13 585 (a) 13 550 (a) n.a. n.a. -35 -293
Spain 270 300 (a) 276 500 (a) 285 700 (a) 292 400 (a) 295 400 (a) 297 700 (a) 294 200 (a) 297 700 (a) 300 200 (a) 171 907 (b) 176 490 (b) 2 500 29 900
Sweden 41 600 (a) 42 500 (a) 43 400 (a) 41 500 (a) 38 700 (a) 38 000 (a) 37 900 (a) 37 600 (a) 35 900 (a) 27 599 (b) 24 744 (b) -1 700 -5 700
Switzerland n.a. n.a. n.a. n.a. n.a. n.a. n.a. n.a. 13 465 (b) 12 844 (b) n.a. n.a. n.a.
United Kingdom 237 075 (a) 232 325 (a) 232 775 (a) 223 600 (a) 208 100 (a) 197 600 (a) 192 025 (a) 184 850 (a) 179 725 (a) 222 649 (b) 213 434 (b) -5 125 -57 350
Notes: Data before 2007 (inclusive) refer to the NACE Rev.1 classification. Data after 2009 (inclusive) refer to the NACE Rev.2 classification. n.a. = not available.
Sources: (a) OECD: STAN Structural Analysis Database. (b) European Commission: Eurostat.
TM
CP
I-R-[2
01
1-0
7-0
15
9-1
]-En
.do
cx
37
Table 3.3. Employment in the rubber and plastics products sector in selected European countries, 2000–10
2000 2001 2002 2003 2004 2005 2006 2007 2008 2009 2010 (first quarter)
Change in employment
Between 2007 and 2008
Between 2000 and 2008 or the data available latest year
EU-27 Member States n.a. n.a. n.a. n.a. n.a. 1 365 710 (b) 1 371 390 (b) 1 415 647 (b) 1 242 243 (b) 1 296 383 (b) 1 307 055 (b) n.a. n.a.
Austria n.a. 24 107 (b) 24 200 (b) 22 587 (b) 19 200 (b) 20 187 (b) 23 950 (b) 26 800 (b) 26 349 (b) 22 288 (b) 26 238(b) n.a. n.a.
Belgium 25 245 (a) 27 092 (a) 26 215 (a) 25 367 (a) 25 457 (a) 25 568 (a) 24 827 (a) 25 305 (a) 25 391 (a) n.a. n.a. 86 146
Czech Republic 53 543 (a) 59 339 (a) 60 198 (a) 63 058 (a) 66 771 (a) 71 471 (a) 80 481 (a) 86 545 (a) 86 030 (a) 76 316 (b) 69 990 (b) -515 32 487
Denmark 21 363 (a) 21 472 (a) 20 884 (a) 21 067 (a) 20 353 (a) 19 687 (a) 19 550 (a) n.a. n.a. n.a. n.a. n.a. -1 813
Estonia 2 300 (a) 1 900 (a) 1 200 (a) 2 400 (a) 3 600 (a) 2 900 (a) 4 700 (a) 5 400 (a) 5 600 (a) 3 584 (b) 3 798 (b) 200 3 300
Finland 18 600 (a) 18 000 (a) 18 000 (a) 16 600 (a) 16 500 (a) 16 400 (a) 15 900 (a) 15 800 (a) 15 900 (a) 14 822 (b) 13 033 (b) 100 -2 700
France 207 877 (a) 214 035 (a) 212 900 (a) 211 126 (a) 212 620 (a) 209 066 (a) 203 503 (a) 199 436 (a) n.a. 200 100 (b) 214 221 (b) n.a. -8 441
Germany 413 000 (a) 418 000 (a) 406 000 (a) 397 000 (a) 399 000 (a) 390 000 (a) 386 000 (a) 394 000 (a) n.a. 328 133 (b) 332 650 (b) n.a. -19 000
Greece 12 916 (a) 17 629 (a) 17 534 (a) 16 120 (a) 18 219 (a) 14 614 (a) 15 950 (a) 13 859 (a) 15 064 (a) 13 928 (b) 13 087 (b) 1 205 2 148
Hungary 40 799 (a) 37 660 (a) 41 949 (a) 36 780 (a) 36 981 (a) 36 195 (a) 40 150 (a) 41 168 (a) 48 845 (b) 43 308 (b) 43 595 (b) n.a. 369
Ireland 11 693 (a) 10 607 (a) 10 383 (a) 10 846 (a) 11 002 (a) 11 170 (a) 10 913 (a) 10 911 (a) 10 501 (a) n.a. n.a. -410 -1 192
Italy 200 300 (a) 200 200 (a) 202 200 (a) 200 300 (a) 195 600 (a) 191 000 (a) 184 900 (a) 184 800 (a) 181 900 (a) n.a. n.a. -2 900 -18 400
Lithuania n.a. 2 971 (b) 5 692 (b) 5 833 (b) 8 425 (b) 10 535 (b) 10 661 (b) 9 834 (b) 8 355 (b) 8 520 (b) 7 313 (b) n.a. n.a.
Luxembourg 4 100 (a) 4 000 (a) 3 800 (a) 4 500 (a) 4 400 (a) 4 300 (a) 4 300 (a) 4 300 (a) 4 300 (a) 2 547(b) 2 618 (b) 0 200
Malta n.a. n.a. 1 798 (b) 1 857 (b) 1 403 (b) 1 686 (b) 1 568 (b) 1 600 (b) 1 458 (b) 1 477 (b) 1 286 (b) n.a. n.a.
Netherlands 36 070 (a) 36 632 (a) 35 654 (a) 34 430 (a) 34 105 (a) 33 748 (a) 33 472 (a) 33 868 (a) 34 228 (a) 30 277 (b) 29 505 (b) 360 -1 842
Norway 6 000 (a) 5 500 (a) 5 000 (a) 5 000 (a) 4 700 (a) 4 700 (a) 4 700 (a) 5 000 (a) 4 966 (b) 4 800 (b) n.a. n.a. -1 000
Poland 121 073 (a) 122 900 (a) 106 600 (a) 105 800 (a) 121 800 (a) 129 100 (a) 141 400 (a) 153 200 (a) 167 500 (a) 154 110 (b) 152 072 (b) 14 300 46 427
38
T
MC
PI-R
-[20
11
-07
-015
9-1
]-En
.do
cx
2000 2001 2002 2003 2004 2005 2006 2007 2008 2009 2010 (first quarter)
Change in employment
Between 2007 and 2008
Between 2000 and 2008 or the data available latest year
Portugal 24 548 (a) 25 111 (a) 26 268 (a) 26 332 (a) 26 385 (a) 26 302 (a) 27 109 (a) n.a. 23 825 (b) 24 364 (b) 24 516 (b) n.a. 2 561
Romania n.a. n.a. n.a. n.a. 46 040 (b) 48 527 (b) 51 976 (b) 51 420 (b) 56 188 (b) 53 774 (b) 50 195 (b) n.a. n.a.
Slovakia 16 596 (a) 16 302 (a) 17 915 (a) 20 786 (a) 20 744 (a) 20 730 (a) 22 336 (a) 25 078 (a) 28 514 (a) 31 925 (b) 34 911 (b) 3 436 11 918
Slovenia 11 648 (a) 11 935 (a) 12 230 (a) 12 571 (a) 12 848 (a) 13 101 (a) 13 368 (a) 13 452 (a) 13 709 (a) n.a. n.a. 257 2 061
Spain 115 800 (a) 119 500 (a) 124 600 (a) 126 500 (a) 126 800 (a) 126 800 (a) 124 500 (a) 125 700 (a) 128 200( a) 100 514 (b) 96 706 (b) 2 500 12 400
Sweden 26 900 (a) 26 800 (a) 26 100 (a) 26 400 (a) 23 900 (a) 23 100 (a) 23 400 (a) 23 300 (a) 22 300 (a) 21 249 (b) 20 249 (b) -1 000 -4 600
Switzerland n.a. 5 464 (b) 4 160 (b) 4 570 (b) 4 957 (b) 5 441 (b) 4 829 (b) 4 576 (b) 5 138( b) 4 400 (b) n.a. 562 n.a.
United Kingdom 235 150 (a) 228 050 (a) 221 050 (a) 213 425 (a) 210 275 (a) 200 525 (a) 195 075 (a) 185 800 (a) 178 475 (a) 164 007 (b) 169 889 (b) -7 325 -56 675
Notes: Data before 2007 (inclusive) refer to the NACE Rev.1 classification. Data after 2009 (inclusive) refer to the NACE Rev.2 classification. n.a. = not available.
Sources: (a) OECD: STAN Structural Analysis Database. (b) European Commission: Eurostat.
TMCPI-R-[2011-07-0159-1]-En.docx 39
66. Third, the European chemical industry seems to be recovering from the global economic
crisis. Employment figures, including the chemical and chemical products and the rubber
and plastic products sectors in the 27 Member States of the European Union, have
increased by around 100,000 positions, from 3,021,674 in 2005, to 3,123,102 in 2007.
However, the global economic crisis has had an impact on recent employment, with a
decrease to 2,801,772 in 2008. Employment increased to 3,044,007 in 2009, reaching
nearly 3.1 million in the first quarter of 2010.
67. Figure 3.5 shows the evolution in employment in the chemical industry in the 27 Member
States of the European Union between 2008 and the first quarter of 2010. The European
chemical industry added around 37,000 new jobs every quarter. Employment in the
27 Member States of the European Union was reported at around 2.77 million in the first
quarter of 2008. It increased to slightly over 3 million in the first quarter of 2010. An
increase in employment occurred across all sectors. The chemical and chemical products
sector increased by around 75,000 – an increase from 1.05 million in the first quarter of
2008 to 1.12 million in the first quarter of 2010. The basic pharmaceutical products and
pharmaceutical preparations sector increased by around 158,000 – an increase from
479,000 in the first quarter of 2008 to 637,000 in the first quarter of 2010. The rubber and
plastic products sector increased by around 67,000 – an increase from 1.24 million in the
first quarter of 2008 to 1.31 million in the first quarter of 2010.
Figure 3.5. Employment in the chemical industry in 27 EU Member States, 2008–10
Source: European Commission.
3.1.3. Employment in Latin America
68. Table 3.4 shows employment in the chemicals and chemical products sector in nine
selected countries in Latin America for 2000–08. Employment in the industry grew
continuously in all the countries during the period. Between 2000 and 2006, the chemical
0
500 000
1 000 000
1 500 000
2 000 000
2 500 000
3 000 000
3 500 000
2008-Q1 2008-Q2 2008-Q3 2008-Q4 2009-Q1 2009-Q2 2009-Q3 2009-Q4 2010-Q1
Total of manufacture of rubber and plastic products
Total of manufacture of basic pharmaceutical products and pharmaceutical preparations
Total of manufacture of chemicals and chemical products
40 TMCPI-R-[2011-07-0159-1]-En.docx
industry in those countries created nearly 350,000 new jobs. The chemical industry in
Latin America is experiencing its longest period of sustained growth in more than a
generation. Many chemical firms in the region have benefited from rich crude oil and
feedstock. Brazil, for example, is self-sufficient in crude oil and has a highly integrated
upstream production business in oil and gas and petrochemicals, which improves
availability of petrochemical feedstock and thereby increases competitive advantage.
Table 3.4. Employment in the manufacturing of chemicals and chemical products sector in selected countries in Latin America, 2000–08
2000 2001 2002 2003 2004 2005 2006 2007 2008
Argentina 87 340 92 523 83 000 98 206 95 245 87 985 96 994 n.a. n.a.
Brazil n.a. n.a. 506 000 619 000 685 000 619 000 678 000 788 350 n.a.
Colombia 38 887 41 611 39 909 39 726 40 736 55 947 n.a. n.a. n.a.
Costa Rica 9 500 8 332 n.a. 10 846 11 081 15 660 11 999 12 100 12 740
Dominican Republic n.a. n.a. n.a. n.a. 21 935 19 222 22 614 23 612 n.a.
Ecuador n.a. n.a. 10 039 14 986 18 424 23 183 15 255 n.a. n.a.
El Salvador 12 525 14 028 16 068 12 980 15 642 14 726 11 701 13 065 n.a.
Mexico 250 959 253 035 242 557 215 096 252 420 248 720 226 753 239 052 267 493
Peru 17 390 31 131 31 034 15 070 28 011 18 190 36 465 34 100 28 248
n.a. = not available.
Source: ILO: Laborsta.
3.1.4. Employment in the United States
69. The US chemical industry may be the industry most severely affected by the global
economic crisis among the countries for which reliable data is available. More than
66,000 jobs were lost in the US chemical industry between 2008 and 2009, or around
5.1 per cent of the total workforce in the US chemical industry. The plastic products
manufacturing sector was the most severely affected, with a loss of 74,000 jobs, or 19 per
cent of overall employment in the sector. The rubber products sector lost the second largest
number of jobs, around 24,000, or a decline of nearly 30 per cent in overall employment in
the sector. The resins, synthetic rubber and fibres, and filaments sector lost around
21,000 jobs, or around 30 per cent of overall employment in the sector. These sectors are
major suppliers to the automobile manufacturing industry and the construction industry,
which were directly affected by the global economic crisis. Prior to the crisis, these sectors
had been experiencing steady growth in employment. In fact, the resins, synthetic rubber
and fibres, and filaments sector was one of the fastest growing sectors in the chemical
industry in recent years, followed by the pharmaceuticals and medicines sector, accounting
for nearly 40 per cent of overall employment in the US chemical industry (table 3.5 and
figure 3.6).
70. Employment in the US chemical industry improved in 2010. First, small firms started to
increase numbers of staff. This was possibly because small firms may have had additional
motivation to recruit given that the Small Business Jobs Act of 2010 will provide them
with tax breaks, better access to credit, and other incentives. Second, the number of green-
chemistry-based jobs also began to increase. Stimulus funding is supporting the
development of many green-chemistry-based businesses, creating new jobs in the process.
For example, Dow Chemical received US$20 million in Department of Energy funding to
develop its Powerhouse Solar Shingle. In total, the company aimed to create more than
1,200 new jobs by 2014 to support production of green roofing material. Third, the number
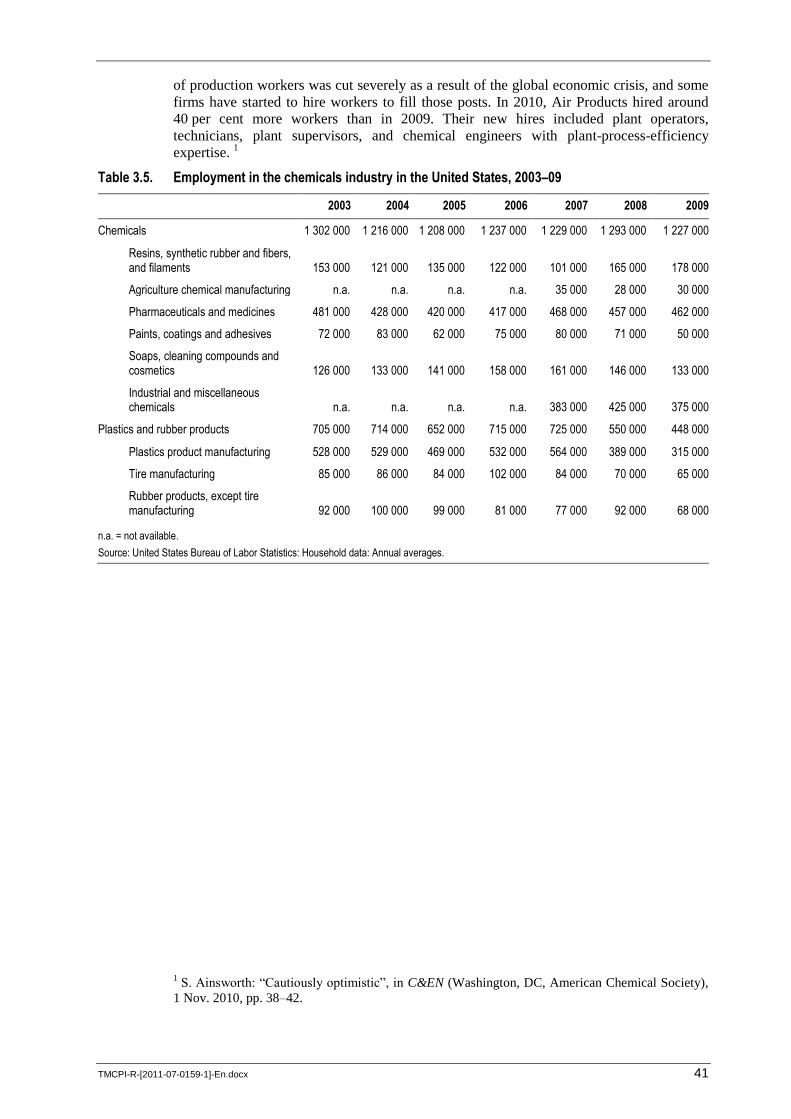
TMCPI-R-[2011-07-0159-1]-En.docx 41
of production workers was cut severely as a result of the global economic crisis, and some
firms have started to hire workers to fill those posts. In 2010, Air Products hired around
40 per cent more workers than in 2009. Their new hires included plant operators,
technicians, plant supervisors, and chemical engineers with plant-process-efficiency
expertise. 1
Table 3.5. Employment in the chemicals industry in the United States, 2003–09
2003 2004 2005 2006 2007 2008 2009
Chemicals 1 302 000 1 216 000 1 208 000 1 237 000 1 229 000 1 293 000 1 227 000
Resins, synthetic rubber and fibers, and filaments 153 000 121 000 135 000 122 000 101 000 165 000 178 000
Agriculture chemical manufacturing n.a. n.a. n.a. n.a. 35 000 28 000 30 000
Pharmaceuticals and medicines 481 000 428 000 420 000 417 000 468 000 457 000 462 000
Paints, coatings and adhesives 72 000 83 000 62 000 75 000 80 000 71 000 50 000
Soaps, cleaning compounds and cosmetics 126 000 133 000 141 000 158 000 161 000 146 000 133 000
Industrial and miscellaneous chemicals n.a. n.a. n.a. n.a. 383 000 425 000 375 000
Plastics and rubber products 705 000 714 000 652 000 715 000 725 000 550 000 448 000
Plastics product manufacturing 528 000 529 000 469 000 532 000 564 000 389 000 315 000
Tire manufacturing 85 000 86 000 84 000 102 000 84 000 70 000 65 000
Rubber products, except tire manufacturing 92 000 100 000 99 000 81 000 77 000 92 000 68 000
n.a. = not available.
Source: United States Bureau of Labor Statistics: Household data: Annual averages.
1 S. Ainsworth: “Cautiously optimistic”, in C&EN (Washington, DC, American Chemical Society),
1 Nov. 2010, pp. 38–42.
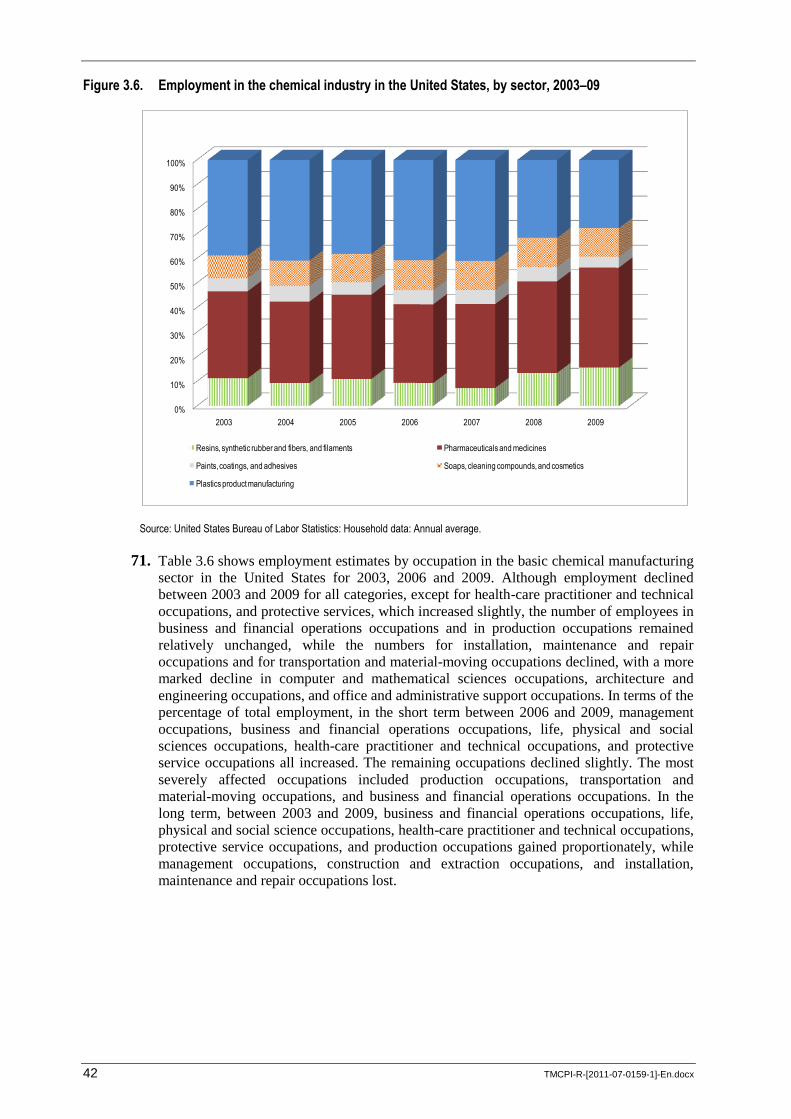
42 TMCPI-R-[2011-07-0159-1]-En.docx
Figure 3.6. Employment in the chemical industry in the United States, by sector, 2003–09
Source: United States Bureau of Labor Statistics: Household data: Annual average.
71. Table 3.6 shows employment estimates by occupation in the basic chemical manufacturing
sector in the United States for 2003, 2006 and 2009. Although employment declined
between 2003 and 2009 for all categories, except for health-care practitioner and technical
occupations, and protective services, which increased slightly, the number of employees in
business and financial operations occupations and in production occupations remained
relatively unchanged, while the numbers for installation, maintenance and repair
occupations and for transportation and material-moving occupations declined, with a more
marked decline in computer and mathematical sciences occupations, architecture and
engineering occupations, and office and administrative support occupations. In terms of the
percentage of total employment, in the short term between 2006 and 2009, management
occupations, business and financial operations occupations, life, physical and social
sciences occupations, health-care practitioner and technical occupations, and protective
service occupations all increased. The remaining occupations declined slightly. The most
severely affected occupations included production occupations, transportation and
material-moving occupations, and business and financial operations occupations. In the
long term, between 2003 and 2009, business and financial operations occupations, life,
physical and social science occupations, health-care practitioner and technical occupations,
protective service occupations, and production occupations gained proportionately, while
management occupations, construction and extraction occupations, and installation,
maintenance and repair occupations lost.
0%
10%
20%
30%
40%
50%
60%
70%
80%
90%
100%
2003 2004 2005 2006 2007 2008 2009
Resins, synthetic rubber and fibers, and filaments Pharmaceuticals and medicines
Paints, coatings, and adhesives Soaps, cleaning compounds, and cosmetics
Plastics product manufacturing
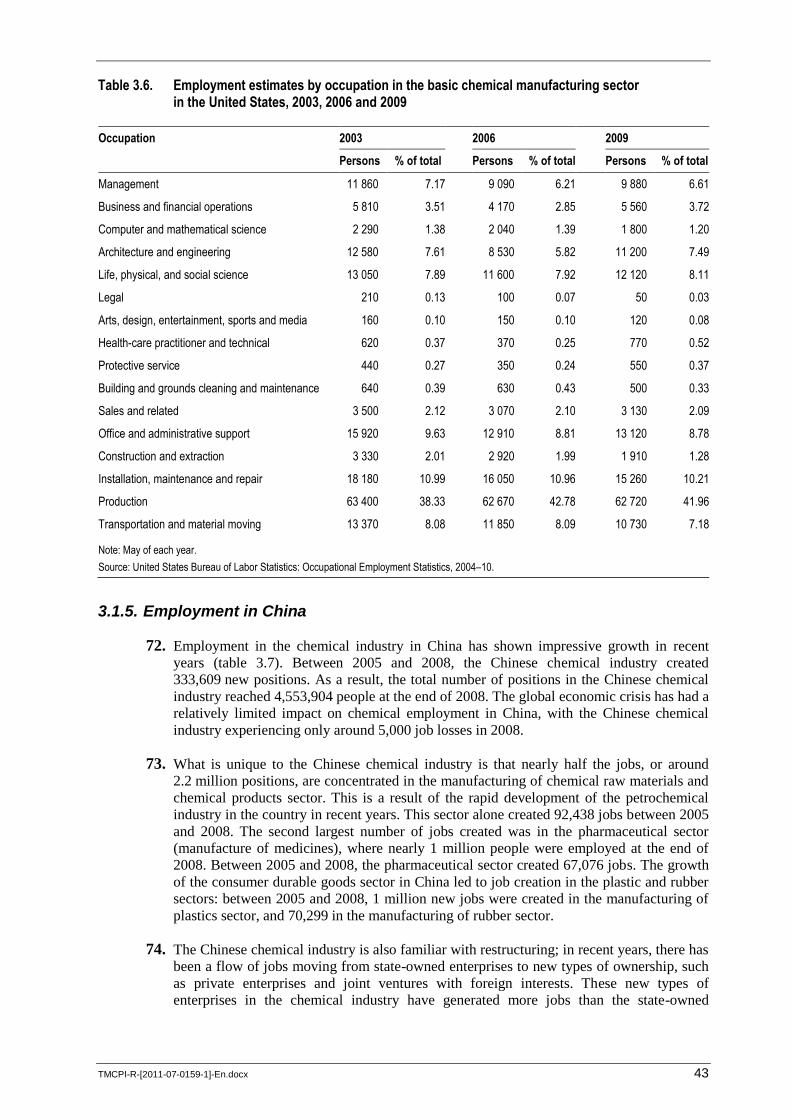
TMCPI-R-[2011-07-0159-1]-En.docx 43
Table 3.6. Employment estimates by occupation in the basic chemical manufacturing sector in the United States, 2003, 2006 and 2009
Occupation 2003 2006 2009
Persons % of total Persons % of total Persons % of total
Management 11 860 7.17 9 090 6.21 9 880 6.61
Business and financial operations 5 810 3.51 4 170 2.85 5 560 3.72
Computer and mathematical science 2 290 1.38 2 040 1.39 1 800 1.20
Architecture and engineering 12 580 7.61 8 530 5.82 11 200 7.49
Life, physical, and social science 13 050 7.89 11 600 7.92 12 120 8.11
Legal 210 0.13 100 0.07 50 0.03
Arts, design, entertainment, sports and media 160 0.10 150 0.10 120 0.08
Health-care practitioner and technical 620 0.37 370 0.25 770 0.52
Protective service 440 0.27 350 0.24 550 0.37
Building and grounds cleaning and maintenance 640 0.39 630 0.43 500 0.33
Sales and related 3 500 2.12 3 070 2.10 3 130 2.09
Office and administrative support 15 920 9.63 12 910 8.81 13 120 8.78
Construction and extraction 3 330 2.01 2 920 1.99 1 910 1.28
Installation, maintenance and repair 18 180 10.99 16 050 10.96 15 260 10.21
Production 63 400 38.33 62 670 42.78 62 720 41.96
Transportation and material moving 13 370 8.08 11 850 8.09 10 730 7.18
Note: May of each year.
Source: United States Bureau of Labor Statistics: Occupational Employment Statistics, 2004–10.
3.1.5. Employment in China
72. Employment in the chemical industry in China has shown impressive growth in recent
years (table 3.7). Between 2005 and 2008, the Chinese chemical industry created
333,609 new positions. As a result, the total number of positions in the Chinese chemical
industry reached 4,553,904 people at the end of 2008. The global economic crisis has had a
relatively limited impact on chemical employment in China, with the Chinese chemical
industry experiencing only around 5,000 job losses in 2008.
73. What is unique to the Chinese chemical industry is that nearly half the jobs, or around
2.2 million positions, are concentrated in the manufacturing of chemical raw materials and
chemical products sector. This is a result of the rapid development of the petrochemical
industry in the country in recent years. This sector alone created 92,438 jobs between 2005
and 2008. The second largest number of jobs created was in the pharmaceutical sector
(manufacture of medicines), where nearly 1 million people were employed at the end of
2008. Between 2005 and 2008, the pharmaceutical sector created 67,076 jobs. The growth
of the consumer durable goods sector in China led to job creation in the plastic and rubber
sectors: between 2005 and 2008, 1 million new jobs were created in the manufacturing of
plastics sector, and 70,299 in the manufacturing of rubber sector.
74. The Chinese chemical industry is also familiar with restructuring; in recent years, there has
been a flow of jobs moving from state-owned enterprises to new types of ownership, such
as private enterprises and joint ventures with foreign interests. These new types of
enterprises in the chemical industry have generated more jobs than the state-owned
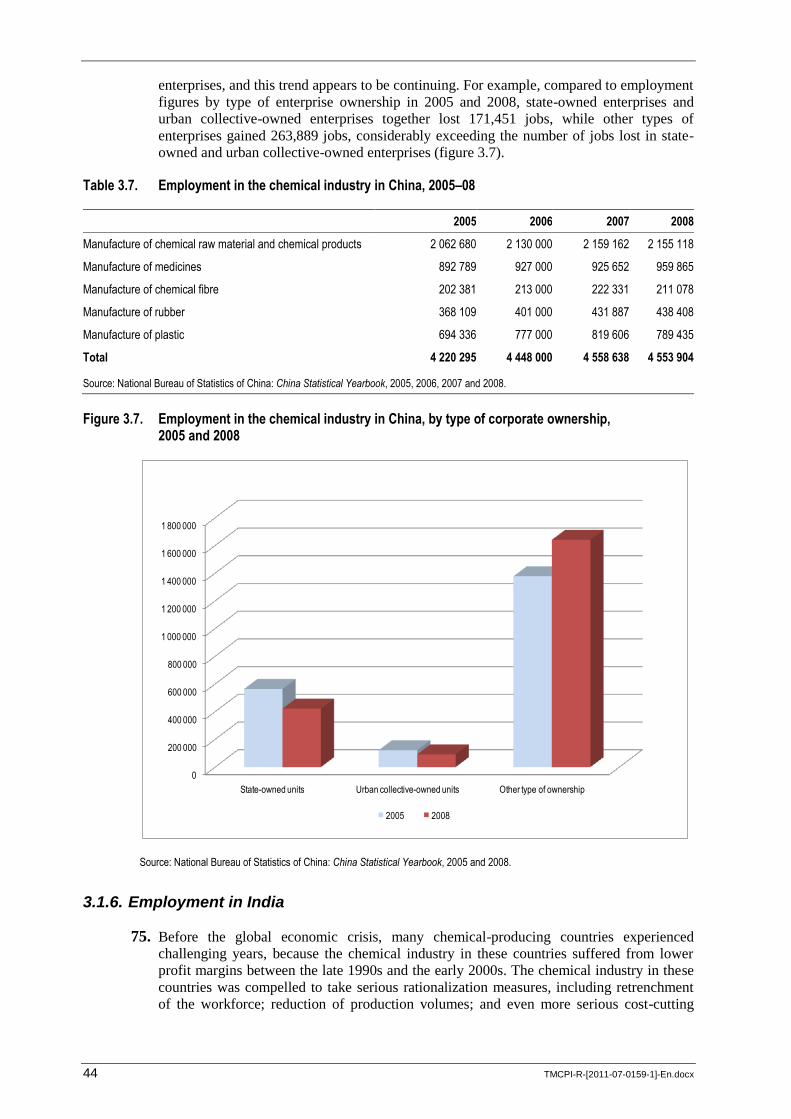
44 TMCPI-R-[2011-07-0159-1]-En.docx
enterprises, and this trend appears to be continuing. For example, compared to employment
figures by type of enterprise ownership in 2005 and 2008, state-owned enterprises and
urban collective-owned enterprises together lost 171,451 jobs, while other types of
enterprises gained 263,889 jobs, considerably exceeding the number of jobs lost in state-
owned and urban collective-owned enterprises (figure 3.7).
Table 3.7. Employment in the chemical industry in China, 2005–08
2005 2006 2007 2008
Manufacture of chemical raw material and chemical products 2 062 680 2 130 000 2 159 162 2 155 118
Manufacture of medicines 892 789 927 000 925 652 959 865
Manufacture of chemical fibre 202 381 213 000 222 331 211 078
Manufacture of rubber 368 109 401 000 431 887 438 408
Manufacture of plastic 694 336 777 000 819 606 789 435
Total 4 220 295 4 448 000 4 558 638 4 553 904
Source: National Bureau of Statistics of China: China Statistical Yearbook, 2005, 2006, 2007 and 2008.
Figure 3.7. Employment in the chemical industry in China, by type of corporate ownership, 2005 and 2008
Source: National Bureau of Statistics of China: China Statistical Yearbook, 2005 and 2008.
3.1.6. Employment in India
75. Before the global economic crisis, many chemical-producing countries experienced
challenging years, because the chemical industry in these countries suffered from lower
profit margins between the late 1990s and the early 2000s. The chemical industry in these
countries was compelled to take serious rationalization measures, including retrenchment
of the workforce; reduction of production volumes; and even more serious cost-cutting
0
200 000
400 000
600 000
800 000
1 000 000
1 200 000
1 400 000
1 600 000
1 800 000
State-owned units Urban collective-owned units Other type of ownership
2005 2008
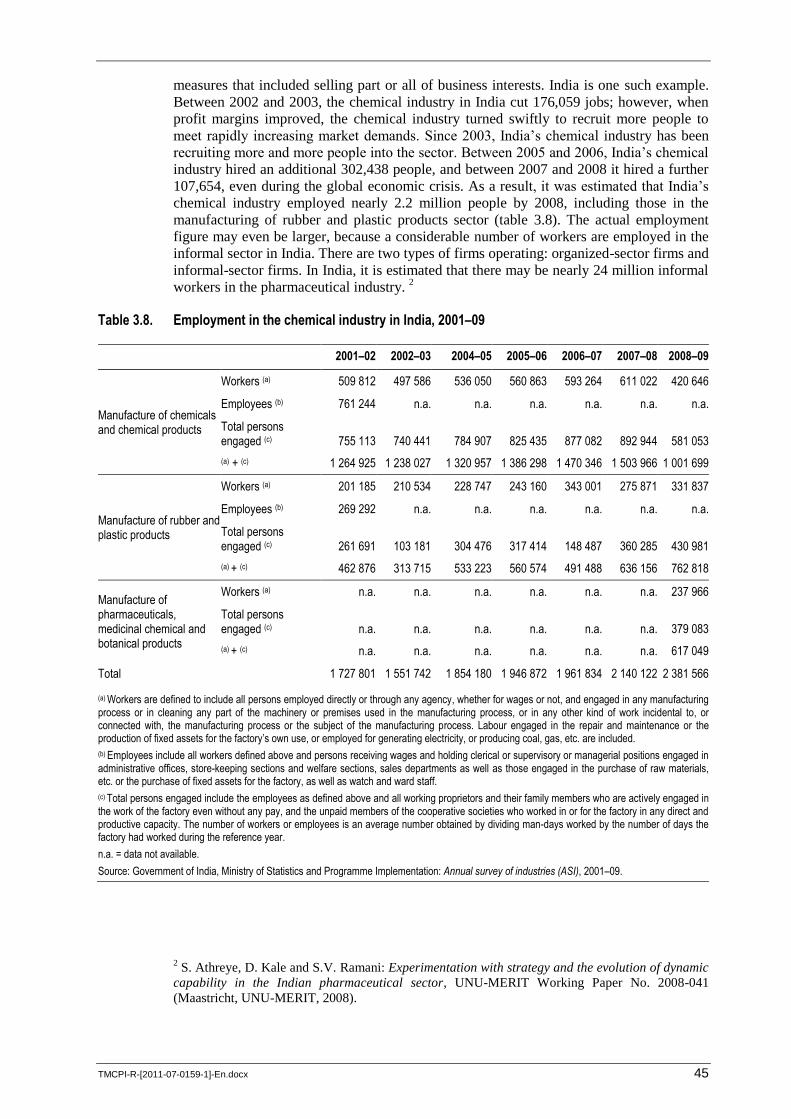
TMCPI-R-[2011-07-0159-1]-En.docx 45
measures that included selling part or all of business interests. India is one such example.
Between 2002 and 2003, the chemical industry in India cut 176,059 jobs; however, when
profit margins improved, the chemical industry turned swiftly to recruit more people to
meet rapidly increasing market demands. Since 2003, India‟s chemical industry has been
recruiting more and more people into the sector. Between 2005 and 2006, India‟s chemical
industry hired an additional 302,438 people, and between 2007 and 2008 it hired a further
107,654, even during the global economic crisis. As a result, it was estimated that India‟s
chemical industry employed nearly 2.2 million people by 2008, including those in the
manufacturing of rubber and plastic products sector (table 3.8). The actual employment
figure may even be larger, because a considerable number of workers are employed in the
informal sector in India. There are two types of firms operating: organized-sector firms and
informal-sector firms. In India, it is estimated that there may be nearly 24 million informal
workers in the pharmaceutical industry. 2
Table 3.8. Employment in the chemical industry in India, 2001–09
2001–02 2002–03 2004–05 2005–06 2006–07 2007–08 2008–09
Manufacture of chemicals and chemical products
Workers (a) 509 812 497 586 536 050 560 863 593 264 611 022 420 646
Employees (b) 761 244 n.a. n.a. n.a. n.a. n.a. n.a.
Total persons engaged (c) 755 113 740 441 784 907 825 435 877 082 892 944 581 053
(a) + (c) 1 264 925 1 238 027 1 320 957 1 386 298 1 470 346 1 503 966 1 001 699
Manufacture of rubber and plastic products
Workers (a) 201 185 210 534 228 747 243 160 343 001 275 871 331 837
Employees (b) 269 292 n.a. n.a. n.a. n.a. n.a. n.a.
Total persons engaged (c) 261 691 103 181 304 476 317 414 148 487 360 285 430 981
(a) + (c) 462 876 313 715 533 223 560 574 491 488 636 156 762 818
Manufacture of pharmaceuticals, medicinal chemical and botanical products
Workers (a) n.a. n.a. n.a. n.a. n.a. n.a. 237 966
Total persons engaged (c) n.a. n.a. n.a. n.a. n.a. n.a. 379 083
(a) + (c) n.a. n.a. n.a. n.a. n.a. n.a. 617 049
Total 1 727 801 1 551 742 1 854 180 1 946 872 1 961 834 2 140 122 2 381 566
(a) Workers are defined to include all persons employed directly or through any agency, whether for wages or not, and engaged in any manufacturing process or in cleaning any part of the machinery or premises used in the manufacturing process, or in any other kind of work incidental to, or connected with, the manufacturing process or the subject of the manufacturing process. Labour engaged in the repair and maintenance or the production of fixed assets for the factory’s own use, or employed for generating electricity, or producing coal, gas, etc. are included.
(b) Employees include all workers defined above and persons receiving wages and holding clerical or supervisory or managerial positions engaged in administrative offices, store-keeping sections and welfare sections, sales departments as well as those engaged in the purchase of raw materials, etc. or the purchase of fixed assets for the factory, as well as watch and ward staff.
(c) Total persons engaged include the employees as defined above and all working proprietors and their family members who are actively engaged in the work of the factory even without any pay, and the unpaid members of the cooperative societies who worked in or for the factory in any direct and productive capacity. The number of workers or employees is an average number obtained by dividing man-days worked by the number of days the factory had worked during the reference year.
n.a. = data not available.
Source: Government of India, Ministry of Statistics and Programme Implementation: Annual survey of industries (ASI), 2001–09.
2 S. Athreye, D. Kale and S.V. Ramani: Experimentation with strategy and the evolution of dynamic
capability in the Indian pharmaceutical sector, UNU-MERIT Working Paper No. 2008-041
(Maastricht, UNU-MERIT, 2008).
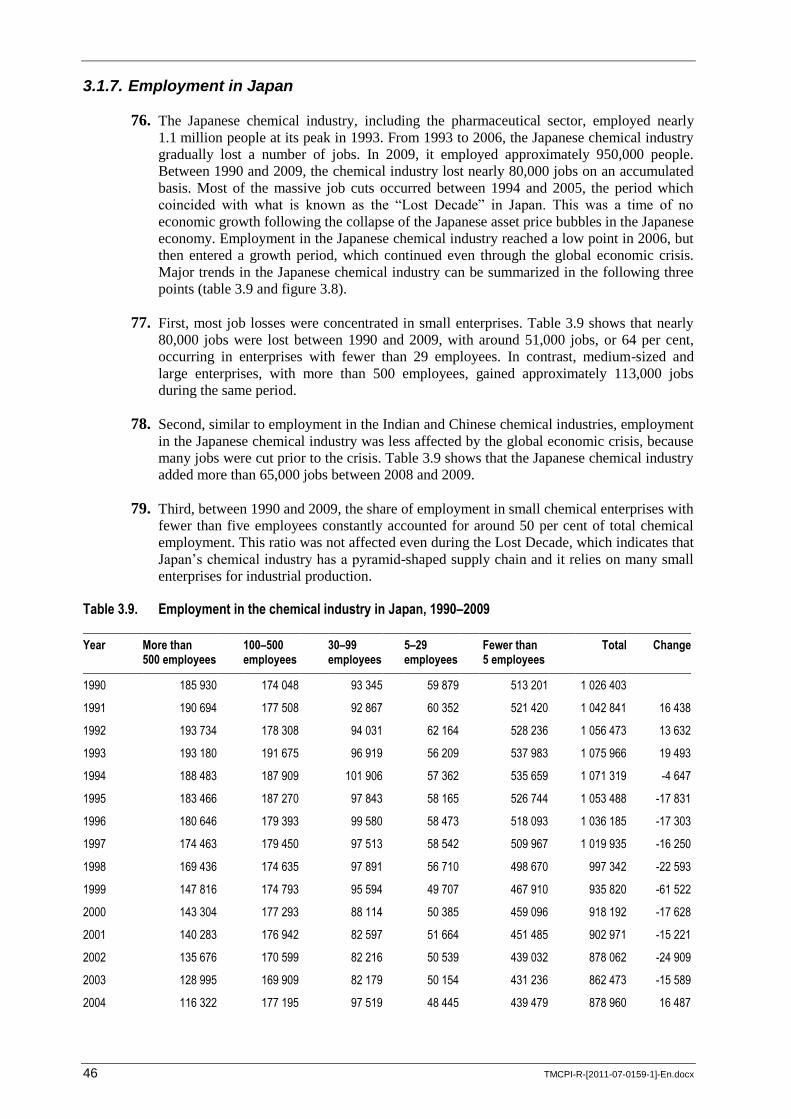
46 TMCPI-R-[2011-07-0159-1]-En.docx
3.1.7. Employment in Japan
76. The Japanese chemical industry, including the pharmaceutical sector, employed nearly
1.1 million people at its peak in 1993. From 1993 to 2006, the Japanese chemical industry
gradually lost a number of jobs. In 2009, it employed approximately 950,000 people.
Between 1990 and 2009, the chemical industry lost nearly 80,000 jobs on an accumulated
basis. Most of the massive job cuts occurred between 1994 and 2005, the period which
coincided with what is known as the “Lost Decade” in Japan. This was a time of no
economic growth following the collapse of the Japanese asset price bubbles in the Japanese
economy. Employment in the Japanese chemical industry reached a low point in 2006, but
then entered a growth period, which continued even through the global economic crisis.
Major trends in the Japanese chemical industry can be summarized in the following three
points (table 3.9 and figure 3.8).
77. First, most job losses were concentrated in small enterprises. Table 3.9 shows that nearly
80,000 jobs were lost between 1990 and 2009, with around 51,000 jobs, or 64 per cent,
occurring in enterprises with fewer than 29 employees. In contrast, medium-sized and
large enterprises, with more than 500 employees, gained approximately 113,000 jobs
during the same period.
78. Second, similar to employment in the Indian and Chinese chemical industries, employment
in the Japanese chemical industry was less affected by the global economic crisis, because
many jobs were cut prior to the crisis. Table 3.9 shows that the Japanese chemical industry
added more than 65,000 jobs between 2008 and 2009.
79. Third, between 1990 and 2009, the share of employment in small chemical enterprises with
fewer than five employees constantly accounted for around 50 per cent of total chemical
employment. This ratio was not affected even during the Lost Decade, which indicates that
Japan‟s chemical industry has a pyramid-shaped supply chain and it relies on many small
enterprises for industrial production.
Table 3.9. Employment in the chemical industry in Japan, 1990–2009
Year More than 500 employees
100–500 employees
30–99 employees
5–29 employees
Fewer than 5 employees
Total Change
1990 185 930 174 048 93 345 59 879 513 201 1 026 403
1991 190 694 177 508 92 867 60 352 521 420 1 042 841 16 438
1992 193 734 178 308 94 031 62 164 528 236 1 056 473 13 632
1993 193 180 191 675 96 919 56 209 537 983 1 075 966 19 493
1994 188 483 187 909 101 906 57 362 535 659 1 071 319 -4 647
1995 183 466 187 270 97 843 58 165 526 744 1 053 488 -17 831
1996 180 646 179 393 99 580 58 473 518 093 1 036 185 -17 303
1997 174 463 179 450 97 513 58 542 509 967 1 019 935 -16 250
1998 169 436 174 635 97 891 56 710 498 670 997 342 -22 593
1999 147 816 174 793 95 594 49 707 467 910 935 820 -61 522
2000 143 304 177 293 88 114 50 385 459 096 918 192 -17 628
2001 140 283 176 942 82 597 51 664 451 485 902 971 -15 221
2002 135 676 170 599 82 216 50 539 439 032 878 062 -24 909
2003 128 995 169 909 82 179 50 154 431 236 862 473 -15 589
2004 116 322 177 195 97 519 48 445 439 479 878 960 16 487
TMCPI-R-[2011-07-0159-1]-En.docx 47
Year More than 500 employees
100–500 employees
30–99 employees
5–29 employees
Fewer than 5 employees
Total Change
2005 114 927 171 107 98 069 49 426 433 529 867 058 -11 902
2006 113 835 168 215 99 664 49 330 431 044 862 088 -4 970
2007 113 627 169 942 100 605 49 178 433 353 866 705 4 617
2008 115 685 176 134 101 927 47 458 441 203 882 407 15 702
2009 119 904 206 702 99 871 47 582 474 060 948 119 65 712
Total employment change between 1990 and 2009 –78 284
Source: Government of Japan, Ministry of Health, Labour and Welfare: Monthly labour surveys.
Figure 3.8. Employment in the chemical industry in Japan, by company size, 2000–09
Source: Government of Japan, Ministry of Health, Labour and Welfare: Monthly labour surveys.
3.1.8. Women workers in the chemical industry
80. Table 3.10 on the female employment ratio in the chemical industry presents data gathered
from about 23 ILO member States. Although data is scarce on the number of women
workers employed globally, the limited figures available suggest that the number of
women employed in the chemical industry is low. Chemical companies have endeavoured
to increase female participation in their workforce. At BASF, there was an increase from
17.4 per cent female employees in 2005 to 19.3 per cent in 2010. 3 At Univar, about 40 per
cent of total employees in 2010 were women. 4 Atanor reported that the number of women
3 Information provided to the ILO by BASF SE.
4 D. Prangenberg: “Chemical sector becoming more appealing to women”, in ICIS Chemical
Business (Sutton, Surrey), 18 May 2010, p. 31.
0
100 000
200 000
300 000
400 000
500 000
600 000
700 000
800 000
900 000
1 000 000
2000 2001 2002 2003 2004 2005 2006 2007 2008 2009
Fewer than 5 employees 5–29 employees 30–99 employees 100–500 employees More than 500 employees
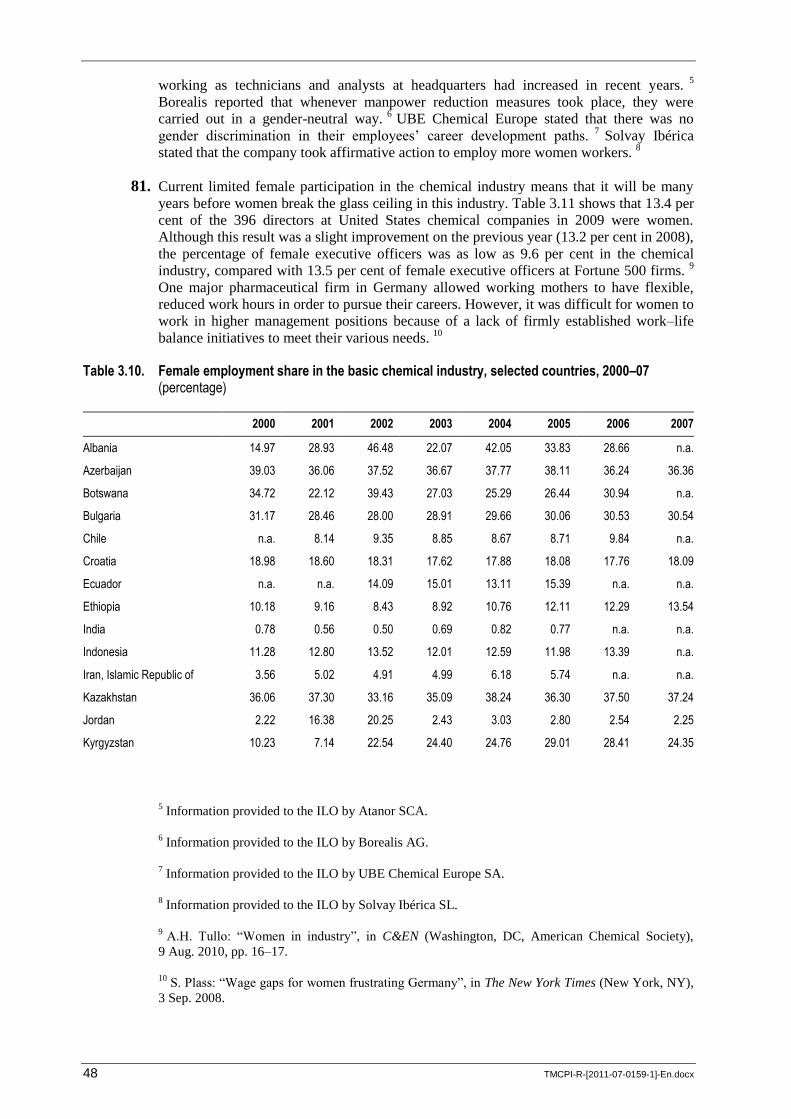
48 TMCPI-R-[2011-07-0159-1]-En.docx
working as technicians and analysts at headquarters had increased in recent years. 5
Borealis reported that whenever manpower reduction measures took place, they were
carried out in a gender-neutral way. 6 UBE Chemical Europe stated that there was no
gender discrimination in their employees‟ career development paths. 7 Solvay Ibérica
stated that the company took affirmative action to employ more women workers. 8
81. Current limited female participation in the chemical industry means that it will be many
years before women break the glass ceiling in this industry. Table 3.11 shows that 13.4 per
cent of the 396 directors at United States chemical companies in 2009 were women.
Although this result was a slight improvement on the previous year (13.2 per cent in 2008),
the percentage of female executive officers was as low as 9.6 per cent in the chemical
industry, compared with 13.5 per cent of female executive officers at Fortune 500 firms. 9
One major pharmaceutical firm in Germany allowed working mothers to have flexible,
reduced work hours in order to pursue their careers. However, it was difficult for women to
work in higher management positions because of a lack of firmly established work–life
balance initiatives to meet their various needs. 10
Table 3.10. Female employment share in the basic chemical industry, selected countries, 2000–07 (percentage)
2000 2001 2002 2003 2004 2005 2006 2007
Albania 14.97 28.93 46.48 22.07 42.05 33.83 28.66 n.a.
Azerbaijan 39.03 36.06 37.52 36.67 37.77 38.11 36.24 36.36
Botswana 34.72 22.12 39.43 27.03 25.29 26.44 30.94 n.a.
Bulgaria 31.17 28.46 28.00 28.91 29.66 30.06 30.53 30.54
Chile n.a. 8.14 9.35 8.85 8.67 8.71 9.84 n.a.
Croatia 18.98 18.60 18.31 17.62 17.88 18.08 17.76 18.09
Ecuador n.a. n.a. 14.09 15.01 13.11 15.39 n.a. n.a.
Ethiopia 10.18 9.16 8.43 8.92 10.76 12.11 12.29 13.54
India 0.78 0.56 0.50 0.69 0.82 0.77 n.a. n.a.
Indonesia 11.28 12.80 13.52 12.01 12.59 11.98 13.39 n.a.
Iran, Islamic Republic of 3.56 5.02 4.91 4.99 6.18 5.74 n.a. n.a.
Kazakhstan 36.06 37.30 33.16 35.09 38.24 36.30 37.50 37.24
Jordan 2.22 16.38 20.25 2.43 3.03 2.80 2.54 2.25
Kyrgyzstan 10.23 7.14 22.54 24.40 24.76 29.01 28.41 24.35
5 Information provided to the ILO by Atanor SCA.
6 Information provided to the ILO by Borealis AG.
7 Information provided to the ILO by UBE Chemical Europe SA.
8 Information provided to the ILO by Solvay Ibérica SL.
9 A.H. Tullo: “Women in industry”, in C&EN (Washington, DC, American Chemical Society),
9 Aug. 2010, pp. 16–17.
10 S. Plass: “Wage gaps for women frustrating Germany”, in The New York Times (New York, NY),
3 Sep. 2008.

TMCPI-R-[2011-07-0159-1]-En.docx 49
2000 2001 2002 2003 2004 2005 2006 2007
Lithuania n.a. n.a. n.a. 28.91 28.93 28.80 28.63 28.19
Madagascar n.a. 11.15 11.15 11.17 11.17 11.16 11.18 n.a.
Malaysia 19.04 19.75 17.73 18.55 18.06 18.72 17.53 n.a.
Morocco 6.32 5.17 13.33 5.23 4.46 5.42 5.46 5.56
Oman 1.13 0.66 0.79 1.11 4.53 2.40 n.a. n.a.
Qatar 1.22 0.89 1.32 0.83 2.64 2.94 3.14 n.a.
Viet Nam n.a. 44.15 41.96 41.25 39.95 39.39 39.48 38.60
Thailand 34.66 n.a. 32.05 n.a. n.a. n.a. 34.22 n.a.
Tanzania, United Republic of n.a. n.a. n.a. 42.24 22.85 23.01 22.95 23.05
n.a. = not available.
Source: UNIDO: INDSTAT4, 2010 ISIC Rev.3.
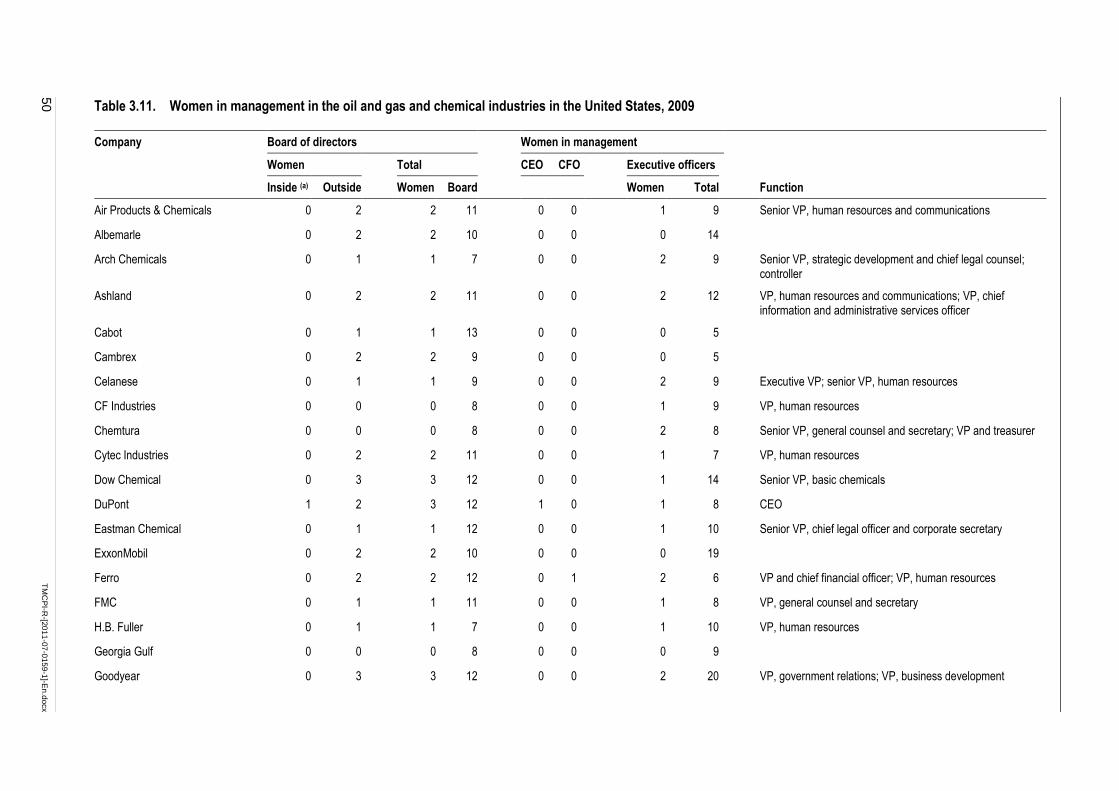
50
T
MC
PI-R
-[20
11
-07
-015
9-1
]-En
.do
cx
Table 3.11. Women in management in the oil and gas and chemical industries in the United States, 2009
Company Board of directors Women in management
Women Total CEO CFO Executive officers
Function Inside (a) Outside Women Board
Women Total
Air Products & Chemicals 0 2 2 11 0 0 1 9 Senior VP, human resources and communications
Albemarle 0 2 2 10 0 0 0 14
Arch Chemicals 0 1 1 7 0 0 2 9 Senior VP, strategic development and chief legal counsel; controller
Ashland 0 2 2 11 0 0 2 12 VP, human resources and communications; VP, chief information and administrative services officer
Cabot 0 1 1 13 0 0 0 5
Cambrex 0 2 2 9 0 0 0 5
Celanese 0 1 1 9 0 0 2 9 Executive VP; senior VP, human resources
CF Industries 0 0 0 8 0 0 1 9 VP, human resources
Chemtura 0 0 0 8 0 0 2 8 Senior VP, general counsel and secretary; VP and treasurer
Cytec Industries 0 2 2 11 0 0 1 7 VP, human resources
Dow Chemical 0 3 3 12 0 0 1 14 Senior VP, basic chemicals
DuPont 1 2 3 12 1 0 1 8 CEO
Eastman Chemical 0 1 1 12 0 0 1 10 Senior VP, chief legal officer and corporate secretary
ExxonMobil 0 2 2 10 0 0 0 19
Ferro 0 2 2 12 0 1 2 6 VP and chief financial officer; VP, human resources
FMC 0 1 1 11 0 0 1 8 VP, general counsel and secretary
H.B. Fuller 0 1 1 7 0 0 1 10 VP, human resources
Georgia Gulf 0 0 0 8 0 0 0 9
Goodyear 0 3 3 12 0 0 2 20 VP, government relations; VP, business development
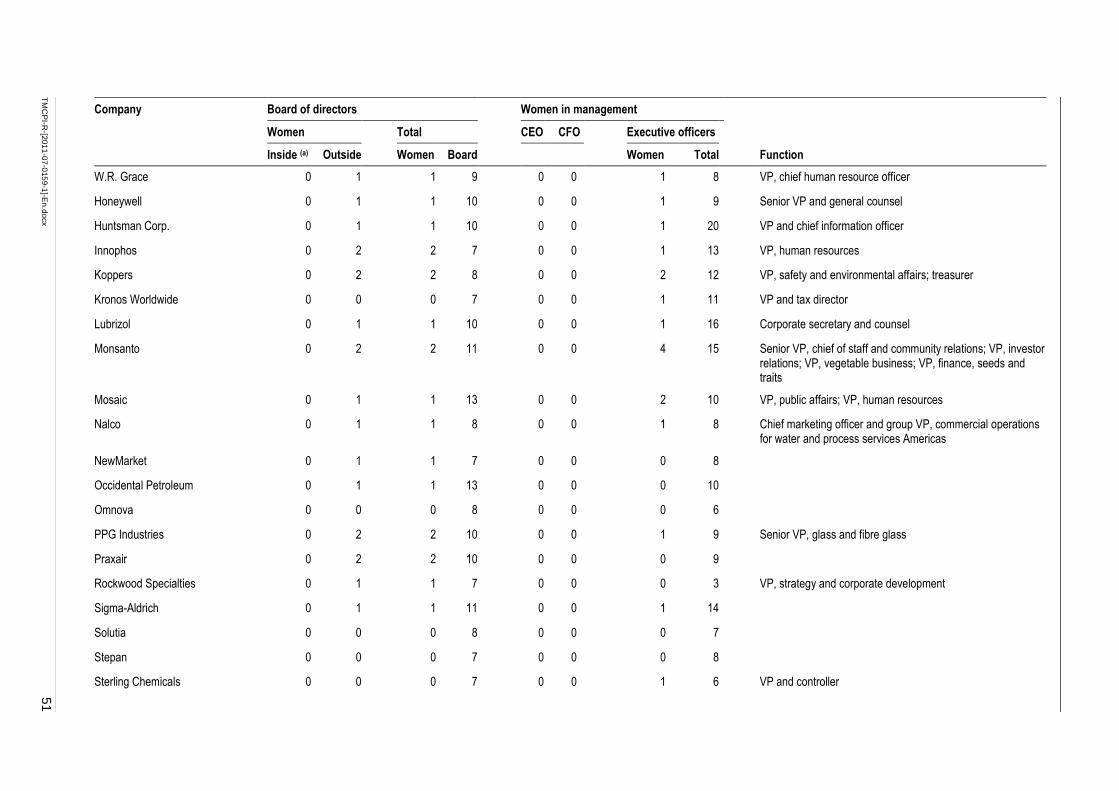
TM
CP
I-R-[2
01
1-0
7-0
15
9-1
]-En
.do
cx
51
Company Board of directors Women in management
Women Total CEO CFO Executive officers
Function Inside (a) Outside Women Board
Women Total
W.R. Grace 0 1 1 9 0 0 1 8 VP, chief human resource officer
Honeywell 0 1 1 10 0 0 1 9 Senior VP and general counsel
Huntsman Corp. 0 1 1 10 0 0 1 20 VP and chief information officer
Innophos 0 2 2 7 0 0 1 13 VP, human resources
Koppers 0 2 2 8 0 0 2 12 VP, safety and environmental affairs; treasurer
Kronos Worldwide 0 0 0 7 0 0 1 11 VP and tax director
Lubrizol 0 1 1 10 0 0 1 16 Corporate secretary and counsel
Monsanto 0 2 2 11 0 0 4 15 Senior VP, chief of staff and community relations; VP, investor relations; VP, vegetable business; VP, finance, seeds and traits
Mosaic 0 1 1 13 0 0 2 10 VP, public affairs; VP, human resources
Nalco 0 1 1 8 0 0 1 8 Chief marketing officer and group VP, commercial operations for water and process services Americas
NewMarket 0 1 1 7 0 0 0 8
Occidental Petroleum 0 1 1 13 0 0 0 10
Omnova 0 0 0 8 0 0 0 6
PPG Industries 0 2 2 10 0 0 1 9 Senior VP, glass and fibre glass
Praxair 0 2 2 10 0 0 0 9
Rockwood Specialties 0 1 1 7 0 0 0 3 VP, strategy and corporate development
Sigma-Aldrich 0 1 1 11 0 0 1 14
Solutia 0 0 0 8 0 0 0 7
Stepan 0 0 0 7 0 0 0 8
Sterling Chemicals 0 0 0 7 0 0 1 6 VP and controller
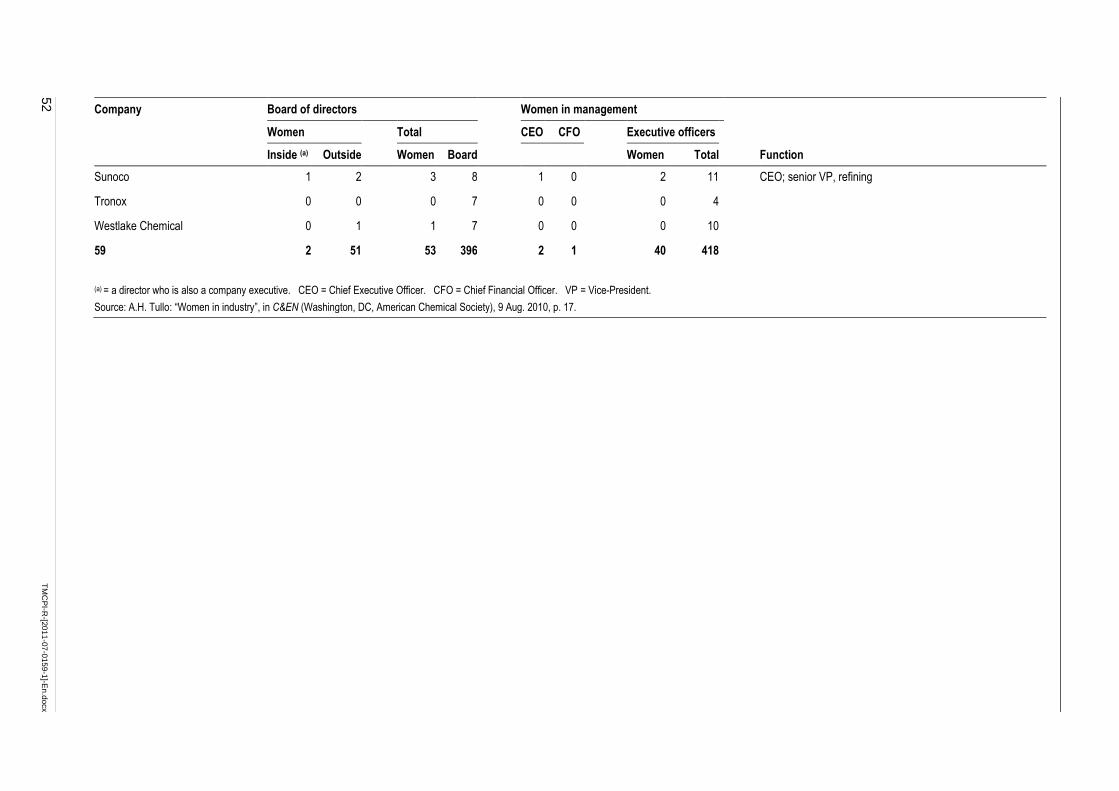
52
T
MC
PI-R
-[20
11
-07
-015
9-1
]-En
.do
cx
Company Board of directors Women in management
Women Total CEO CFO Executive officers
Function Inside (a) Outside Women Board
Women Total
Sunoco 1 2 3 8 1 0 2 11 CEO; senior VP, refining
Tronox 0 0 0 7 0 0 0 4
Westlake Chemical 0 1 1 7 0 0 0 10
59
2 51 53 396 2 1 40 418
(a) = a director who is also a company executive. CEO = Chief Executive Officer. CFO = Chief Financial Officer. VP = Vice-President.
Source: A.H. Tullo: “Women in industry”, in C&EN (Washington, DC, American Chemical Society), 9 Aug. 2010, p. 17.
TMCPI-R-[2011-07-0159-1]-En.docx 53
3.1.9. Shortages of skilled workers
82. In the world chemical industry, there are still shortages of two types of workers: scientists
and skilled craft workers. A training consultancy firm for the chemical industry reported
that chemical firms were appealing to a younger workforce by offering an attractive
recruitment package. This included: a corporate culture that emphasized social
responsibility and diversity; a way to make a difference in the world; recognition for a job
well done; the ability to learn and grow through professional development and
advancement; flexible working hours that could involve staggered work schedules or
telecommuting; and an environment in which young people could have fun with new and
innovative projects. Retaining talented workers and attracting younger workers are major
challenges. Chemical firms have been making people-oriented aspects a priority in their
corporate strategy. Competitive salary and benefits packages are important. Some chemical
firms additionally offer longer vacation times, improved mentoring programmes, greater
benefits packages and increased job training. In addition, the key to retaining top talent is
to create a work environment in which people can be productive, enjoy their jobs, and want
to continue. Many chemical firms are also retraining their managers and senior staff so that
they are better able to see the talent that exists in young people, who are much more
globally minded and broader thinking, and already have much technical expertise.
83. There has been some growth in the number of chemistry graduates in certain countries in
recent years. For example, in the United States, according to surveys by the American
Chemical Society‟s Committee on Professional Training, the number of bachelor‟s degree
and PhD holders is gradually increasing; however, the number of master‟s degrees defied
that trend. A record 2,543 new PhDs were awarded by United States universities in 2009, a
rise of 7.7 per cent from 2007–08. The number of master‟s degrees fell by 3.2 per cent to
1,986, which is essentially the same as the number of master‟s graduates reported more
than a decade ago. 1
84. The chemical industry in emerging economies is also facing a serious shortage of scientific
staff, due to the increasing demand for R&D. In India, four principle pharmaceutical firms
– Ranbaxy Laboratories Ltd, Dr Reddy‟s Laboratories, Nicholas Piramal India Ltd, and
Lupin Laboratories Ltd – have increased R&D investment since 2000 and established
laboratories dedicated to developing new medicines. Table 3.12 shows R&D intensity as a
percentage of R&D investment to turnover, from 2000 to 2006, for these companies.
Ranbaxy was the largest investor in R&D, reaching US$144.40 million in 2006, while
Dr Reddy‟s Laboratories increased R&D intensity steadily and sharply from 2000 to 2006,
reaching 17.12 per cent in 2004. The number of scientists working in these firms grew
accordingly in the past decade. These firms were heavily recruiting scientists and engineers
to create a critical mass of innovative R&D-experienced scientists. As a result, the
percentage of staff working in R&D has grown consistently (table 3.13).
1 D.J. Hanson: “Gains continue for chemistry grads: Strong growth in bachelor‟s degrees spills into
doctorates”, in C&EN (Washington, DC, American Chemical Society), 23 Aug. 2010, pp. 44–47.
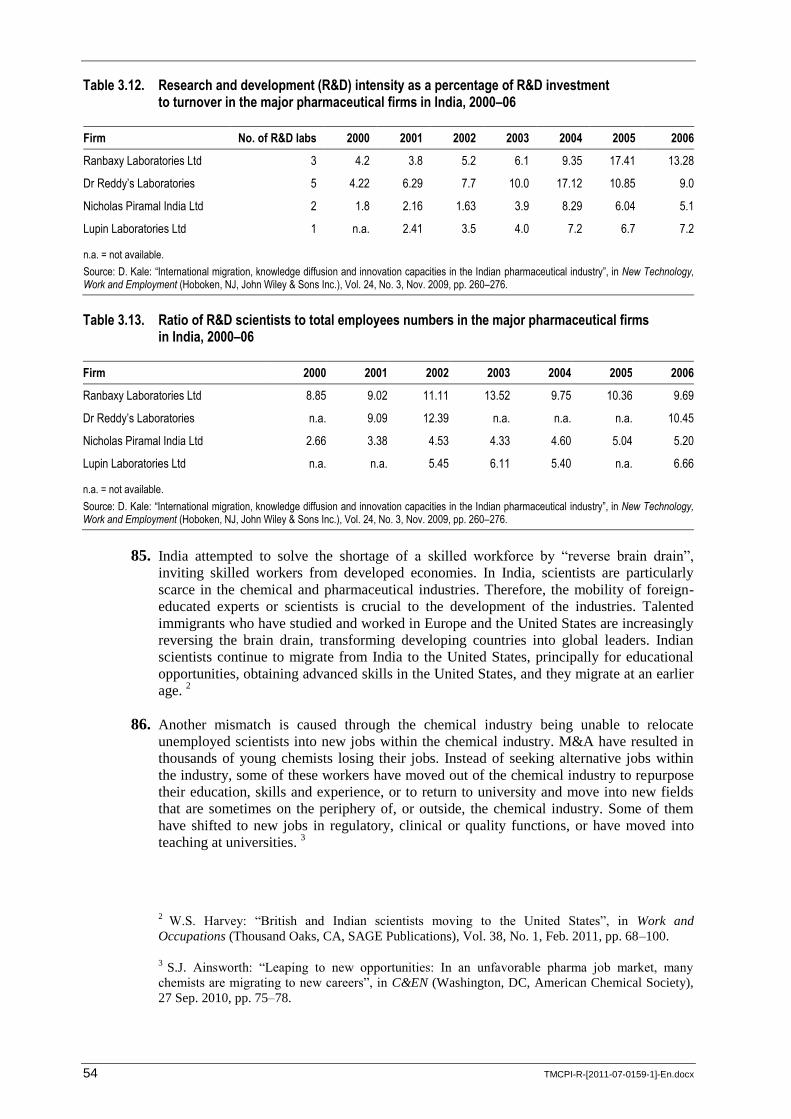
54 TMCPI-R-[2011-07-0159-1]-En.docx
Table 3.12. Research and development (R&D) intensity as a percentage of R&D investment to turnover in the major pharmaceutical firms in India, 2000–06
Firm No. of R&D labs 2000 2001 2002 2003 2004 2005 2006
Ranbaxy Laboratories Ltd 3 4.2 3.8 5.2 6.1 9.35 17.41 13.28
Dr Reddy’s Laboratories 5 4.22 6.29 7.7 10.0 17.12 10.85 9.0
Nicholas Piramal India Ltd 2 1.8 2.16 1.63 3.9 8.29 6.04 5.1
Lupin Laboratories Ltd 1 n.a. 2.41 3.5 4.0 7.2 6.7 7.2
n.a. = not available.
Source: D. Kale: “International migration, knowledge diffusion and innovation capacities in the Indian pharmaceutical industry”, in New Technology, Work and Employment (Hoboken, NJ, John Wiley & Sons Inc.), Vol. 24, No. 3, Nov. 2009, pp. 260–276.
Table 3.13. Ratio of R&D scientists to total employees numbers in the major pharmaceutical firms in India, 2000–06
Firm 2000 2001 2002 2003 2004 2005 2006
Ranbaxy Laboratories Ltd 8.85 9.02 11.11 13.52 9.75 10.36 9.69
Dr Reddy’s Laboratories n.a. 9.09 12.39 n.a. n.a. n.a. 10.45
Nicholas Piramal India Ltd 2.66 3.38 4.53 4.33 4.60 5.04 5.20
Lupin Laboratories Ltd n.a. n.a. 5.45 6.11 5.40 n.a. 6.66
n.a. = not available.
Source: D. Kale: “International migration, knowledge diffusion and innovation capacities in the Indian pharmaceutical industry”, in New Technology, Work and Employment (Hoboken, NJ, John Wiley & Sons Inc.), Vol. 24, No. 3, Nov. 2009, pp. 260–276.
85. India attempted to solve the shortage of a skilled workforce by “reverse brain drain”,
inviting skilled workers from developed economies. In India, scientists are particularly
scarce in the chemical and pharmaceutical industries. Therefore, the mobility of foreign-
educated experts or scientists is crucial to the development of the industries. Talented
immigrants who have studied and worked in Europe and the United States are increasingly
reversing the brain drain, transforming developing countries into global leaders. Indian
scientists continue to migrate from India to the United States, principally for educational
opportunities, obtaining advanced skills in the United States, and they migrate at an earlier
age. 2
86. Another mismatch is caused through the chemical industry being unable to relocate
unemployed scientists into new jobs within the chemical industry. M&A have resulted in
thousands of young chemists losing their jobs. Instead of seeking alternative jobs within
the industry, some of these workers have moved out of the chemical industry to repurpose
their education, skills and experience, or to return to university and move into new fields
that are sometimes on the periphery of, or outside, the chemical industry. Some of them
have shifted to new jobs in regulatory, clinical or quality functions, or have moved into
teaching at universities. 3
2 W.S. Harvey: “British and Indian scientists moving to the United States”, in Work and
Occupations (Thousand Oaks, CA, SAGE Publications), Vol. 38, No. 1, Feb. 2011, pp. 68–100.
3 S.J. Ainsworth: “Leaping to new opportunities: In an unfavorable pharma job market, many
chemists are migrating to new careers”, in C&EN (Washington, DC, American Chemical Society),
27 Sep. 2010, pp. 75–78.
TMCPI-R-[2011-07-0159-1]-En.docx 55
87. Chemical firms in advanced economies are also recruiting talented workers outside their
own countries. For example, German specialty group Henkel has been accepting a
significantly increasing number of scientific applicants from an international background,
resulting in a non-German recruitment level of around 50 per cent in new hiring. 4 Too
many pharmaceutical firms are chasing too few skilled workers, and the gaps have
widened in recent years. Firms have transformed R&D management practices by making
considerable tangible and non-tangible investments in the development of scientists and by
aligning individual careers with the firm‟s organizational goals. The loss of these skilled
workers could potentially worsen the shortage of scientists in the industry in the future.
88. Another immediate problem is to retain skilled craft workers such as pipefitters,
boilermakers, ironworkers, carpenters and others skilled at keeping plants running. In
addition, these craft workers are highly mobile, because many of their skills are applicable
not only to the chemical industry but also to several other industries, which means that
competition for these workers is fierce. There is a lack of craft workers worldwide, largely
due to shifts in demographics, education and training values in the general population. For
example, there has been a gradual shift in the education systems in the United States and
some European countries, as many have de-emphasized such craft skills. There is also a
lack of professional technical schools. Because public vocational training programmes
have declined in the United States, chemical companies have had to spend more resources
and time than they once did to train their workers for craft jobs.
89. Chemical firms are now taking a proactive approach to tackling the shortage of talented
workers. Like many other countries, the United States is vulnerable as it turns away from
craft and vocational training to more service-oriented professions. Talent management,
including craft worker talent, is a main concern for the National Petrochemical and
Refiners Association Maintenance Committee, which has begun to hold annual labour
outlook meetings to encourage discussion and seek solutions. Chemical firms are also
training new craft workers under their own initiatives. One of their major initiatives is the
Gulf Coast Workforce Development initiative. The shortage of carpenters, electricians,
pipefitters and other craft workers who keep plants running is a particular problem in the
United States Gulf Coast region, where reconstruction efforts are ongoing following
hurricanes Katrina and Rita in 2005. Many chemical firms signed up for the Gulf Coast
Workforce Development initiative, which aimed to recruit and train up to 20,000 new
construction workers by the end of 2009 to help in the region‟s recovery effort. The
programme offered free training courses to build skills and prepare for careers in
construction. While the programme was just the tip of the iceberg when it came to the
number of craft workers needed in the Gulf region, it is expected to help greatly in
attracting new talent. This is a collective action by all stakeholders in the chemical
industry, with member companies contributing US$5 million to the initiative by 2011.
Other contributors include construction trade groups, trade unions, academic institutions,
and government. 5
90. Past experience suggests that the chemical industry needs to prepare for the long-term
future. In addition to recruitment policies, the industry must develop industry-wide support
programmes to maintain the performance, flexibility and productivity of employees,
particularly as demographic changes in many chemical-producing countries in the near
future will affect population structure, including aging.
4 C. Shaw: “Recruiting the best”, in ICIS Chemical Business (Sutton, Surrey), 8–14 Mar. 2010,
pp. 30–31.
5 E. D‟Amico: “Talent management: What‟s not working”, in Chemical Week (London and New
York, NY), 11–18 Apr. 2007, pp. 19–23.
56 TMCPI-R-[2011-07-0159-1]-En.docx
3.1.10. Enhancing employability – The Global Jobs Pact
91. When restructuring is inevitable, companies have a number of tools available to minimize
the social impact on workers. These tools include counselling, skills assessment, training to
enhance employability, internal job search, external job search, mobility, creation of small
and medium-sized enterprises, early/partial retirement, alternative work schedules, and
severance packages. The following case illustrates how some of these tools are actually
used.
92. In 2000, the tyre market became severely depressed because of a downward trend in
demand for original equipment (i.e. sales to car and truck manufacturers for new vehicles),
the number of replacement markets (i.e. sales to dealers‟ networks), and exports. This
market trend was expected to continue, not only in the United Kingdom, but also in the
world market. Michelin therefore faced the real prospect of excess production capacity in
its global operations, starting in 2002. To adapt industrial capacity to market demand, it
decided to close two plants in the United Kingdom in 2001, affecting 1,716 employees. To
assist those employees, Michelin UK created a “Jobshop”, the main function of which was
to help employees in their job search and to acquire new vocational skills, as well as to
provide advice on options such as transfers, early retirement, self-employment and
management of personal finances. The Jobshop conducted individual interviews with all
affected employees. Individual training was provided in effective job search, for instance
in writing an appropriate curriculum vitae, filing job application documents, answering job
advertisements, and practising job-search techniques (among others, telephone calls and
interviews). The Jobshop maintained permanent contact with national employment
agencies. Two representatives of the agencies were on the factory site five days a week,
directly connected to their database. The Jobshop also contacted other companies for
possible placements. In addition to this assistance, Michelin UK provided redundancy
premiums that were five times the basic national norm, and helped in small and medium-
sized enterprise creation, with special loans at attractive rates. The results, measured in
April 2003, showed that of the 1,716 employees affected, 66 per cent had found alternative
jobs, 12 per cent had retired, 11 per cent had accepted an internal transfer, 6 per cent had
chosen self-employment, 2 per cent had taken full-time education or training, and 0.4 per
cent had claimed state assistance. Only 2 per cent were still unemployed. 6
93. Lessons learned from numerous measures taken in the chemical industry contributed to the
Global Jobs Pact, which was adopted at the International Labour Conference in June 2009.
This global policy instrument addresses the social and employment impact of the
international financial and economic crisis. It promotes a productive recovery centred on
investments, employment and social protection. The fundamental objective of the Global
Jobs Pact is to provide an internationally agreed basis for policy-making designed to
reduce the time lag between economic recovery and a recovery with decent work
opportunities. It calls for urgent worldwide action at the national, regional and global
levels. 7 In fact, the chemical industry has taken timely action to tackle the effects of the
global economic crisis, proving that the Global Jobs Pact is an appropriate tool. In the three
months prior to the adoption of the Global Jobs Pact in June 2009, the European Mine,
Chemical and Energy Workers‟ Federation (EMCEF) and the European Chemical
Employers‟ Group (ECEG) agreed a joint declaration on short-time work and layoffs,
calling for prior workforce consultation, training for the workers affected and public
support for companies.
6 N. Rogovsky et al.: Restructuring for corporate success: A socially sensitive approach (Geneva,
ILO, 2005), pp. 81–82.
7 http://www.ilo.org/jobspact/lang--en/index.htm [accessed 20 Mar. 2011].
TMCPI-R-[2011-07-0159-1]-En.docx 57
94. The declaration called for the industry to ensure that:
■ layoffs and short-time working should be introduced only after consultation with the
workforce and their representatives;
■ where layoffs and short-time working occur, every effort should be made to use “the
opportunities of this available time” for improving employees‟ skills through training
and education; and
■ training that takes place during layoffs and short-time work (and indeed all training)
should be accredited to ensure that “intrinsic skills” are maintained so that, when the
economic situation improves, the chemicals and pharmaceuticals sector does not lose
vital human resources for the future. 8
95. During the crisis, enhancing employability is at the centre of focus. In May 2009, the
European chemical industry adopted the Joint Declaration on the global economic crisis,
calling for governments to take additional measures to maintain or regain the
competitiveness of the European chemical industry and its jobs. 9 BASF stated that training
and lifelong learning were effective to increase employability under any circumstances. 10
Evonik provided internal and external training programmes to employees, focusing on the
operational needs of specific qualifications and on individual needs. 11
Solvay Ibérica
stated that training was an investment for the company to improve productivity and
competitiveness for the company and employability for employees. 12
In Japan, trade
unions in the pharmaceutical industry are urging the Government of Japan to revise the
laws causing an effect known as the “drug lag.” According to Kagakuken, a
pharmaceutical trade union in Japan, the current law causes a delay of around four years
for new drugs being introduced into the Japanese market, as compared to the European and
United States markets, and this subsequently prevents the industry from creating more
decent jobs. 13
3.2. Remuneration
3.2.1. Wage system
96. PEMEX stated that rationalization did not cause any changes in the wage system. 14
This
may be a rare case, as restructuring frequently does mean some changes to wage systems.
8 “European Union: Chemicals social partners agree on short-time work and layoffs”, in European
Employment Review (Sutton, Surrey), 9 Apr. 2009.
9 ECEG and EMCEF: Joint Declaration on the global economic crisis, 13 May 2009,
http://ec.europa.eu/employment_social/dsw/public/actRetrieveText.do?id=8769 [accessed 20 Mar.
2011].
10 Information provided to the ILO by BASF SE.
11 Information provided to the ILO by Evonik Industries AG.
12 Information provided to the ILO by Solvay Ibérica SL.
13 Presentation by President Masafumi Naramoto, Karoken (Japan) to the ICEM World Conference
for the Chemical Industries, Istanbul, Turkey, 27–28 October 2010.
14 Information provided to the ILO by Petróleos Mexicanos.
58 TMCPI-R-[2011-07-0159-1]-En.docx
In Japan, nine major chemical companies stated that following restructuring, wage systems
based on seniority or ambiguous criteria were abolished and replaced by new systems,
closely linked to workers‟ actual performances and companies‟ actual profits. In other
words, wages became closely related to measurable performance and actual
achievement. 15
97. What are the likely changes to a pay system as a result of mergers? Although it is difficult
to generalize what occurs, a case study of the merger of a global pharmaceutical company
partially answers this question. This study examines the process in four comparable plants
in the pharmaceuticals sector in the United States, the United Kingdom, Germany and
Spain. The study is a relatively short-term one, covering the two-and-a-half years
following the mergers.
98. First, the pharmaceutical company introduced a global grading system so that the corporate
headquarters could influence job classifications in the operating units, particularly for
grades above middle managers and senior professionals. Its impact varied from country to
country. In the United States, the global grading system led to financial losses for some
employees; about 30 professional and managerial workers lost entitlement to stock options.
In contrast, there was no evidence of equivalent professional grades in Germany and the
United Kingdom losing out as a consequence of regrading. The study reasoned that in
Germany and the United Kingdom, the majority of employees, including professionals and
some managers, are covered by collective agreements. However, there was no collective
representation, nor were there any collective labour agreements at the United States plant.
99. Second, performance-related pay was introduced. Wage system standardization did not
occur, because of the differences in the national wage systems in this case. In other words,
the merger did not affect the national wage systems. There was no attempt to harmonize
pay rates across national borders. Many other aspects, such as sickness pay and holiday
entitlement, were left to local management to set in line with local labour markets. 16
3.2.2. Pay levels
100. Figures 3.9–3.12 show the growth in real wage indexes in the major chemical-producing
countries in the chemical industry, by region, between 1999 and 2008. These figures
include the evolution of real wage indexes of 72 member States of the ILO, the majority of
which show an increase in wages in recent years, with the exception of six member States.
101. The average whole-European Union wage increases in the chemical industry had
previously stood at 3.8 per cent in 2003; 3.5 per cent in 2004; 3.8 per cent in 2005; 4.8 per
cent in 2006; 6.2 per cent in 2007, indicating a rising trend from 2004 and ending in 2008
at 5.5 per cent, with a steeper fall in the rate of increase in 2009 at 3.9 per cent, because of
the recession. However, average wage increases in the chemical industry in many countries
generally exceed national average increases. In 2008, the pay increase in the European
chemical industry was higher than the national average increase for all sectors in ten
countries (most notably Bulgaria and Romania), equal to the average increase in two
countries, and lower in nine (most notably Slovenia and Slovakia). In 2009, the increase in
wages in the chemical industry was higher than the national average increase for all sectors
15 Information provided to the ILO by Nippon Keidanren.
16 T. Edwards et al.: “National industrial relations systems and cross-border restructuring: Evidence
from a merger in the pharmaceuticals sector”, in European Journal of Industrial Relations
(Thousand Oaks, CA, SAGE Publications), Vol. 12, No. 1, Mar. 2006, pp. 69–87.
TMCPI-R-[2011-07-0159-1]-En.docx 59
in five countries (most notably Romania), equal to the average in four countries, and lower
in ten (most notably Slovakia, Belgium and Slovenia). 17
However, these wages do not
necessarily reflect the reality of wages in M&A.
102. A study by Conyon et al. (2004) examined 190 M&As made by 149 firms, including
United Kingdom chemical firms, during 1979–1991. It found that wages could increase
their share of the surplus post-merger, and that mergers showed no indication of adversely
affecting wages. Wages might even increase in the short-term after M&A. On average, the
impact of acquisitions was to increase average wages by 11 per cent in the acquiring firms,
two years after merger; much of the observed increase was due to the positive impact that
related acquisitions had on wages, which were boosted by 14 per cent. They also found
that the impact of a merger was greatest when the size of the acquirer was small.
Conversely, workers in large firms benefitted less from acquisition. 18
Figure 3.9. Real wage indexes for the manufacture of chemicals and chemical products in selected Western European countries, 1999–2008 (1999=100)
Source: ILO: Laborsta.
17 European Foundation for the Improvement of Living and Working Conditions: Pay developments
– 2009, Document EF/10/45/EN (2010), p. 12, http://www.eurofound.europa.eu/docs/eiro/
tn1004029s/TN1004029S.pdf [accessed 20 Mar. 2011].
18 M.J. Conyon et al.: “Do wages rise or fall following merger?”, in Oxford Bulletin of Economics
and Statistics (Oxford), Vol. 66, No. 5, Dec. 2004, pp. 847–862.
90
100
110
120
130
140
150
160
1999 2000 2001 2002 2003 2004 2005 2006 2007 2008
Austria Belgium Cyprus Denmark Finland
France Luxembourg Norway Sweden United Kingdom
60 TMCPI-R-[2011-07-0159-1]-En.docx
Figure 3.10. Real wage indexes for the manufacture of chemicals and chemical products in selected Eastern and Central European countries, 1999–2008 (1999=100)
Source: ILO: Laborsta.
Figure 3.11. Real wage indexes for the manufacture of chemicals and chemical products in selected Asian countries, 1999–2008 (1999=100)
Source: ILO: Laborsta.
0
100
200
300
400
500
600
700
1999 2000 2001 2002 2003 2004 2005 2006 2007 2008
Bulgaria Croatia Czech Republic
Georgia Hungary Latvia
Lithuania Macedonia, The former Yugoslav Rep. of Moldova, Republic of
Poland Russian Federation Serbia
Slovakia Ukraine
0
50
100
150
200
250
300
350
400
450
500
1999 2000 2001 2002 2003 2004 2005 2006 2007 2008
Australia Azerbaijan Indonesia Kazakhstan Korea, Republic of Kyrgyzstan Philippines
TMCPI-R-[2011-07-0159-1]-En.docx 61
Figure 3.12. Real wage indexes for the manufacture of chemicals and chemical products in selected countries in the Americas, 1999–2008 (1999=100)
Source: ILO: Laborsta.
103. Where decentralized collective bargaining is practised, there can be wide wage gaps in the
chemical industry. Figure 3.13 shows average wages, by region, in the chemical industry in
Brazil, where wage negotiation is decentralized. It shows that where the chemical industry
is heavily concentrated, such as in the south-west region, including São Paulo, chemical
wages are the highest in the country. Wages in the south-west are twice as high as in the
north.
70
90
110
130
150
170
190
210
230
1999 2000 2001 2002 2003 2004 2005 2006 2007 2008
Argentina Canada Ecuador Mexico Peru United States
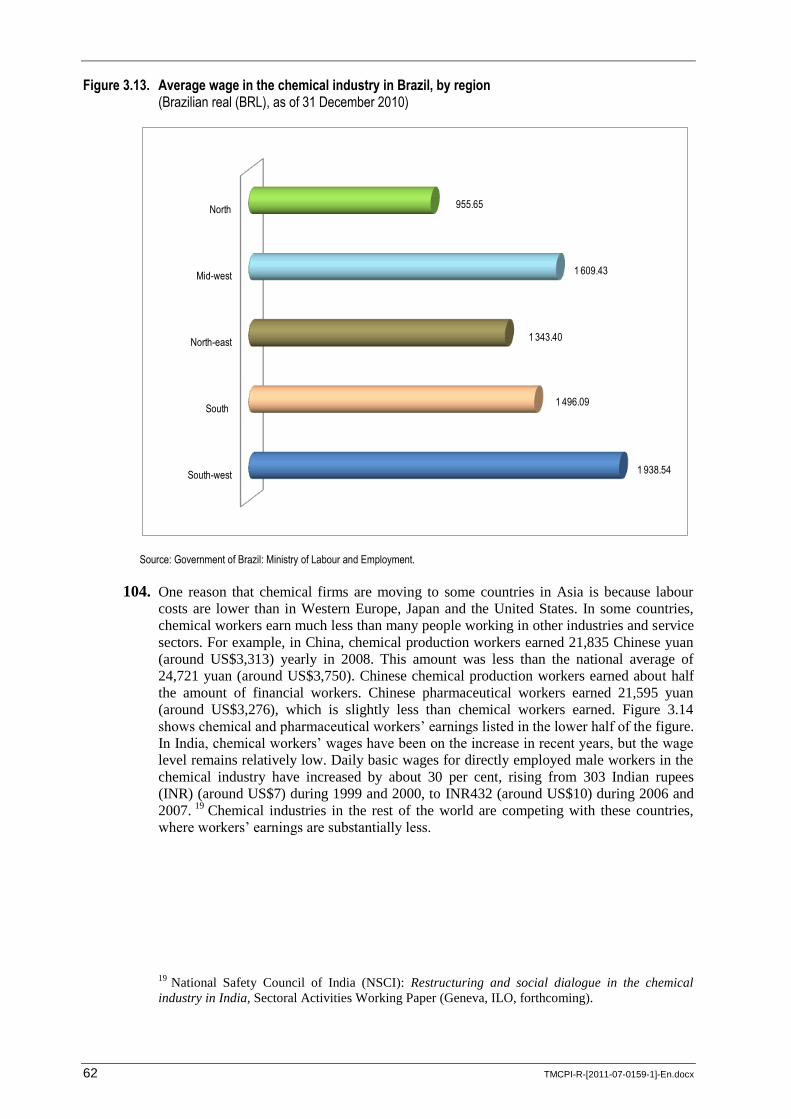
62 TMCPI-R-[2011-07-0159-1]-En.docx
Figure 3.13. Average wage in the chemical industry in Brazil, by region (Brazilian real (BRL), as of 31 December 2010)
Source: Government of Brazil: Ministry of Labour and Employment.
104. One reason that chemical firms are moving to some countries in Asia is because labour
costs are lower than in Western Europe, Japan and the United States. In some countries,
chemical workers earn much less than many people working in other industries and service
sectors. For example, in China, chemical production workers earned 21,835 Chinese yuan
(around US$3,313) yearly in 2008. This amount was less than the national average of
24,721 yuan (around US$3,750). Chinese chemical production workers earned about half
the amount of financial workers. Chinese pharmaceutical workers earned 21,595 yuan
(around US$3,276), which is slightly less than chemical workers earned. Figure 3.14
shows chemical and pharmaceutical workers‟ earnings listed in the lower half of the figure.
In India, chemical workers‟ wages have been on the increase in recent years, but the wage
level remains relatively low. Daily basic wages for directly employed male workers in the
chemical industry have increased by about 30 per cent, rising from 303 Indian rupees
(INR) (around US$7) during 1999 and 2000, to INR432 (around US$10) during 2006 and
2007. 19
Chemical industries in the rest of the world are competing with these countries,
where workers‟ earnings are substantially less.
19 National Safety Council of India (NSCI): Restructuring and social dialogue in the chemical
industry in India, Sectoral Activities Working Paper (Geneva, ILO, forthcoming).
South-west
South
North-east
Mid-west
North
1 938.54
1 496.09
1 343.40
1 609.43
955.65
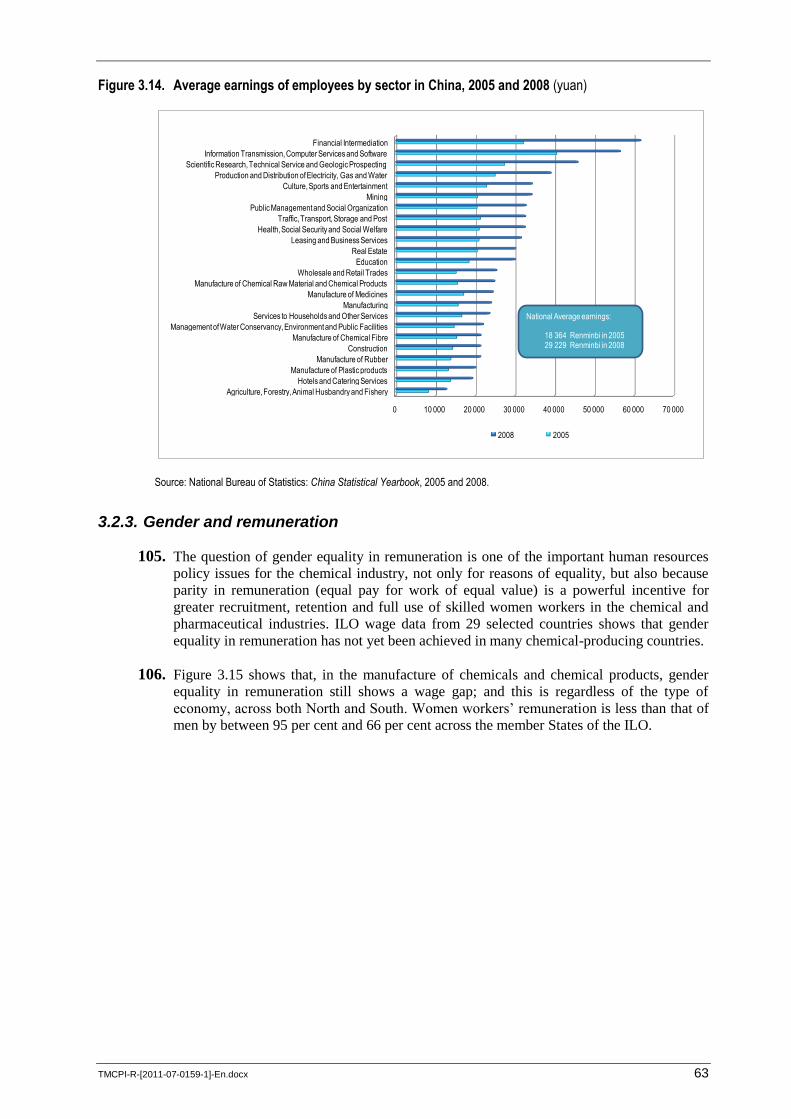
TMCPI-R-[2011-07-0159-1]-En.docx 63
Figure 3.14. Average earnings of employees by sector in China, 2005 and 2008 (yuan)
Source: National Bureau of Statistics: China Statistical Yearbook, 2005 and 2008.
3.2.3. Gender and remuneration
105. The question of gender equality in remuneration is one of the important human resources
policy issues for the chemical industry, not only for reasons of equality, but also because
parity in remuneration (equal pay for work of equal value) is a powerful incentive for
greater recruitment, retention and full use of skilled women workers in the chemical and
pharmaceutical industries. ILO wage data from 29 selected countries shows that gender
equality in remuneration has not yet been achieved in many chemical-producing countries.
106. Figure 3.15 shows that, in the manufacture of chemicals and chemical products, gender
equality in remuneration still shows a wage gap; and this is regardless of the type of
economy, across both North and South. Women workers‟ remuneration is less than that of
men by between 95 per cent and 66 per cent across the member States of the ILO.
0 10 000 20 000 30 000 40 000 50 000 60 000 70 000
Agriculture, Forestry, Animal Husbandry and Fishery
Hotels and Catering Services
Manufacture of Plastic products
Manufacture of Rubber
Construction
Manufacture of Chemical Fibre
Management of Water Conservancy, Environment and Public Facilities
Services to Households and Other Services
Manufacturing
Manufacture of Medicines
Manufacture of Chemical Raw Material and Chemical Products
Wholesale and Retail Trades
Education
Real Estate
Leasing and Business Services
Health, Social Security and Social Welfare
Traffic, Transport, Storage and Post
Public Management and Social Organization
Mining
Culture, Sports and Entertainment
Production and Distribution of Electricity, Gas and Water
Scientific Research, Technical Service and Geologic Prospecting
Information Transmission, Computer Services and Software
Financial Intermediation
2008 2005
National Average earnings:
18 364 Renminbi in 200529 229 Renminbi in 2008
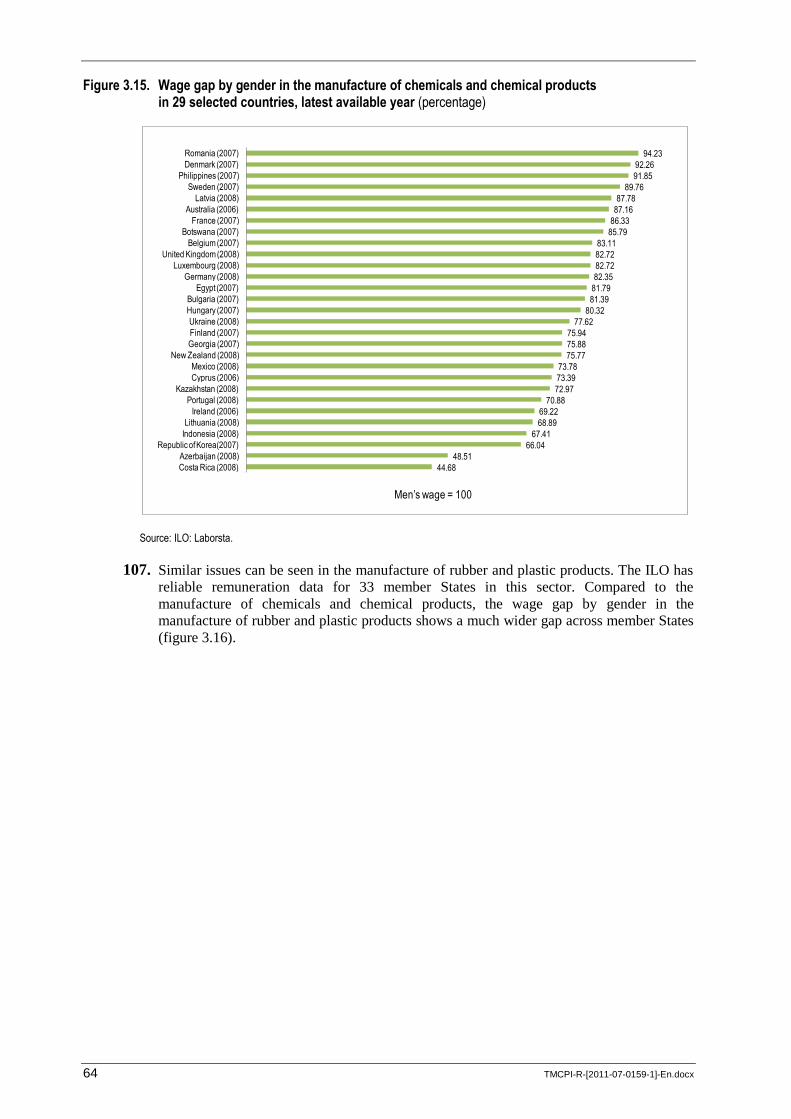
64 TMCPI-R-[2011-07-0159-1]-En.docx
Figure 3.15. Wage gap by gender in the manufacture of chemicals and chemical products in 29 selected countries, latest available year (percentage)
Source: ILO: Laborsta.
107. Similar issues can be seen in the manufacture of rubber and plastic products. The ILO has
reliable remuneration data for 33 member States in this sector. Compared to the
manufacture of chemicals and chemical products, the wage gap by gender in the
manufacture of rubber and plastic products shows a much wider gap across member States
(figure 3.16).
44.68
48.51
66.04
67.41
68.89
69.22
70.88
72.97
73.39
73.78
75.77
75.88
75.94
77.62
80.32
81.39
81.79
82.35
82.72
82.72
83.11
85.79
86.33
87.16
87.78
89.76
91.85
92.26
94.23
Costa Rica (2008)
Azerbaijan (2008)
Republic of Korea(2007)
Indonesia (2008)
Lithuania (2008)
Ireland (2006)
Portugal (2008)
Kazakhstan (2008)
Cyprus (2006)
Mexico (2008)
New Zealand (2008)
Georgia (2007)
Finland (2007)
Ukraine (2008)
Hungary (2007)
Bulgaria (2007)
Egypt (2007)
Germany (2008)
Luxembourg (2008)
United Kingdom (2008)
Belgium (2007)
Botswana (2007)
France (2007)
Australia (2006)
Latvia (2008)
Sweden (2007)
Philippines (2007)
Denmark (2007)
Romania (2007)
Men’s wage = 100
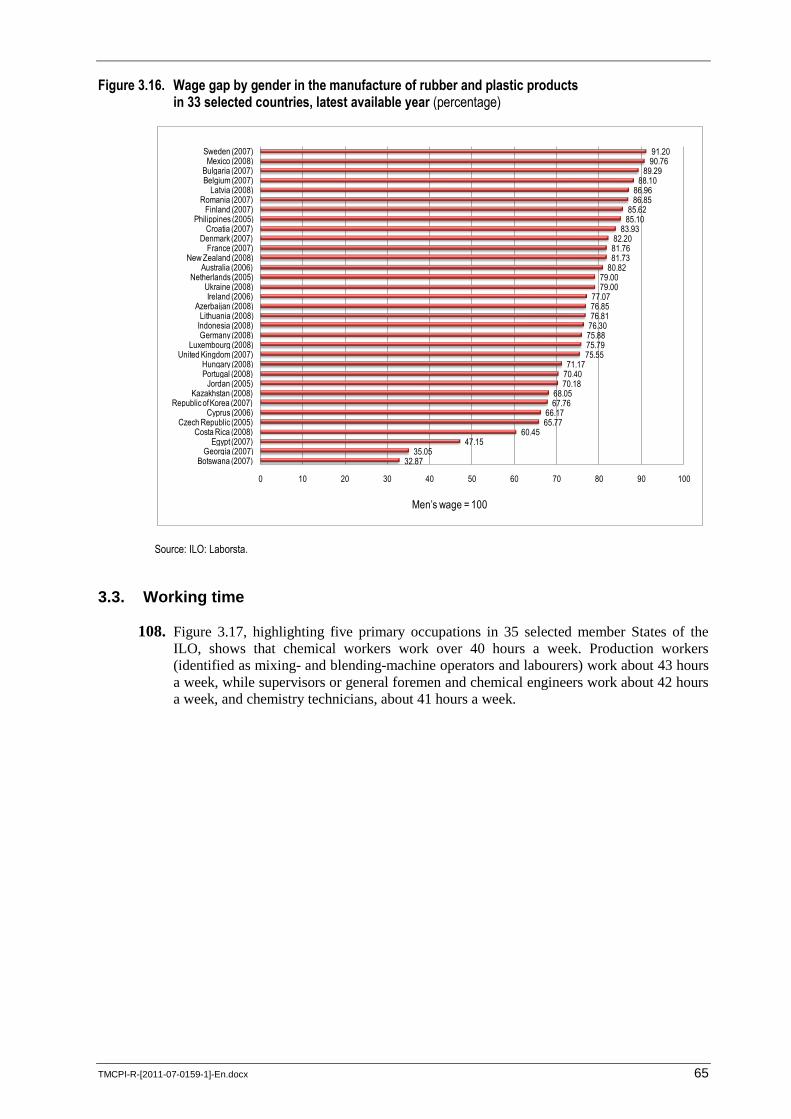
TMCPI-R-[2011-07-0159-1]-En.docx 65
Figure 3.16. Wage gap by gender in the manufacture of rubber and plastic products in 33 selected countries, latest available year (percentage)
Source: ILO: Laborsta.
3.3. Working time
108. Figure 3.17, highlighting five primary occupations in 35 selected member States of the
ILO, shows that chemical workers work over 40 hours a week. Production workers
(identified as mixing- and blending-machine operators and labourers) work about 43 hours
a week, while supervisors or general foremen and chemical engineers work about 42 hours
a week, and chemistry technicians, about 41 hours a week.
32.8735.05
47.1560.45
65.7766.17
67.7668.05
70.1870.4071.17
75.5575.7975.8876.3076.8176.8577.07
79.0079.00
80.8281.7381.7682.20
83.9385.1085.62
86.8586.96
88.1089.29
90.7691.20
0 10 20 30 40 50 60 70 80 90 100
Botswana (2007)Georgia (2007)
Egypt (2007)Costa Rica (2008)
Czech Republic (2005)Cyprus (2006)
Republic of Korea (2007)Kazakhstan (2008)
Jordan (2005)Portugal (2008)Hungary (2008)
United Kingdom (2007)Luxembourg (2008)
Germany (2008)Indonesia (2008)Lithuania (2008)
Azerbaijan (2008)Ireland (2006)
Ukraine (2008)Netherlands (2005)
Australia (2006)New Zealand (2008)
France (2007)Denmark (2007)
Croatia (2007)Philippines (2005)
Finland (2007)Romania (2007)
Latvia (2008)Belgium (2007)Bulgaria (2007)
Mexico (2008)Sweden (2007)
Men’s wage = 100
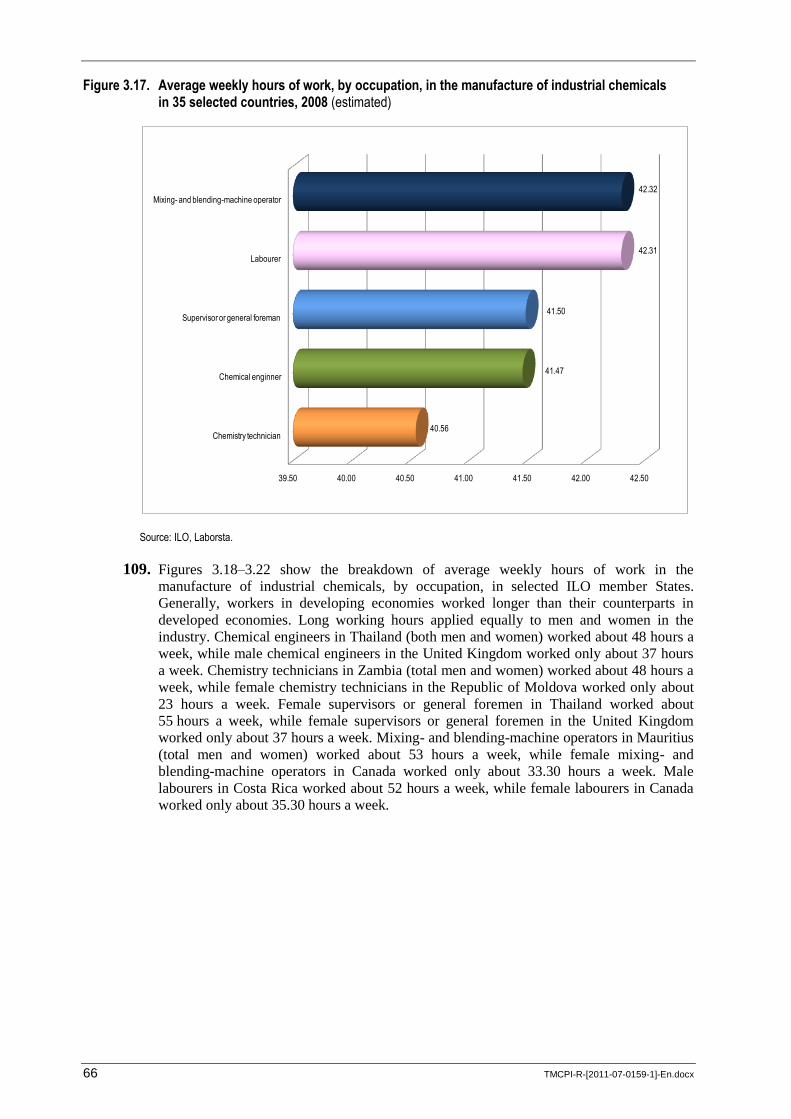
66 TMCPI-R-[2011-07-0159-1]-En.docx
Figure 3.17. Average weekly hours of work, by occupation, in the manufacture of industrial chemicals in 35 selected countries, 2008 (estimated)
Source: ILO, Laborsta.
109. Figures 3.18–3.22 show the breakdown of average weekly hours of work in the
manufacture of industrial chemicals, by occupation, in selected ILO member States.
Generally, workers in developing economies worked longer than their counterparts in
developed economies. Long working hours applied equally to men and women in the
industry. Chemical engineers in Thailand (both men and women) worked about 48 hours a
week, while male chemical engineers in the United Kingdom worked only about 37 hours
a week. Chemistry technicians in Zambia (total men and women) worked about 48 hours a
week, while female chemistry technicians in the Republic of Moldova worked only about
23 hours a week. Female supervisors or general foremen in Thailand worked about
55 hours a week, while female supervisors or general foremen in the United Kingdom
worked only about 37 hours a week. Mixing- and blending-machine operators in Mauritius
(total men and women) worked about 53 hours a week, while female mixing- and
blending-machine operators in Canada worked only about 33.30 hours a week. Male
labourers in Costa Rica worked about 52 hours a week, while female labourers in Canada
worked only about 35.30 hours a week.
39.50 40.00 40.50 41.00 41.50 42.00 42.50
Chemistry technician
Chemical enginner
Supervisor or general foreman
Labourer
Mixing- and blending-machine operator
40.56
41.47
41.50
42.31
42.32
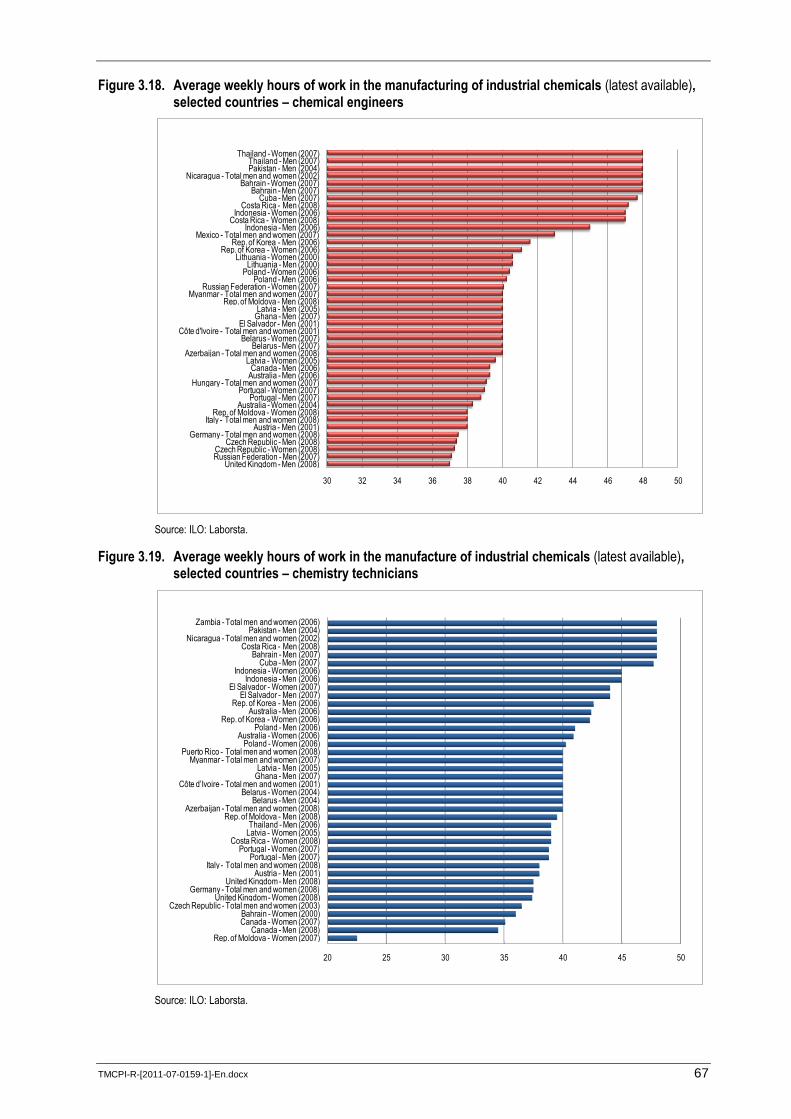
TMCPI-R-[2011-07-0159-1]-En.docx 67
Figure 3.18. Average weekly hours of work in the manufacturing of industrial chemicals (latest available), selected countries – chemical engineers
Source: ILO: Laborsta.
Figure 3.19. Average weekly hours of work in the manufacture of industrial chemicals (latest available), selected countries – chemistry technicians
Source: ILO: Laborsta.
30 32 34 36 38 40 42 44 46 48 50
United Kingdom - Men (2008)Russian Federation - Men (2007)Czech Republic - Women (2008)
Czech Republic - Men (2008)Germany - Total men and women (2008)
Austria - Men (2001)Italy - Total men and women (2008)
Rep. of Moldova - Women (2008)Australia - Women (2004)
Portugal - Men (2007)Portugal - Women (2007)
Hungary - Total men and women (2007)Australia - Men (2006)Canada - Men (2006)
Latvia - Women (2005)Azerbaijan - Total men and women (2008)
Belarus - Men (2007)Belarus - Women (2007)
Côte d'Ivoire - Total men and women (2001)El Salvador - Men (2001)
Ghana - Men (2007)Latvia - Men (2005)
Rep. of Moldova - Men (2008)Myanmar - Total men and women (2007)
Russian Federation - Women (2007)Poland - Men (2006)
Poland - Women (2006)Lithuania - Men (2000)
Lithuania - Women (2000)Rep. of Korea - Women (2006)
Rep. of Korea - Men (2006)Mexico - Total men and women (2007)
Indonesia - Men (2006)Costa Rica - Women (2008)
Indonesia - Women (2006)Costa Rica - Men (2008)
Cuba - Men (2007)Bahrain - Men (2007)
Bahrain - Women (2007)Nicaragua - Total men and women (2002)
Pakistan - Men (2004)Thailand - Men (2007)
Thailand - Women (2007)
20 25 30 35 40 45 50
Rep. of Moldova - Women (2007)Canada - Men (2008)
Canada - Women (2007)Bahrain - Women (2000)
Czech Republic - Total men and women (2003)United Kingdom - Women (2008)
Germany - Total men and women (2008)United Kingdom - Men (2008)
Austria - Men (2001)Italy - Total men and women (2008)
Portugal - Men (2007)Portugal - Women (2007)
Costa Rica - Women (2008)Latvia - Women (2005)Thailand - Men (2006)
Rep. of Moldova - Men (2008)Azerbaijan - Total men and women (2008)
Belarus - Men (2004)Belarus - Women (2004)
Côte d’Ivoire - Total men and women (2001)Ghana - Men (2007)Latvia - Men (2005)
Myanmar - Total men and women (2007)Puerto Rico - Total men and women (2008)
Poland - Women (2006)Australia - Women (2006)
Poland - Men (2006)Rep. of Korea - Women (2006)
Australia - Men (2006)Rep. of Korea - Men (2006)
El Salvador - Men (2007)El Salvador - Women (2007)
Indonesia - Men (2006)Indonesia - Women (2006)
Cuba - Men (2007)Bahrain - Men (2007)
Costa Rica - Men (2008)Nicaragua - Total men and women (2002)
Pakistan - Men (2004)Zambia - Total men and women (2006)
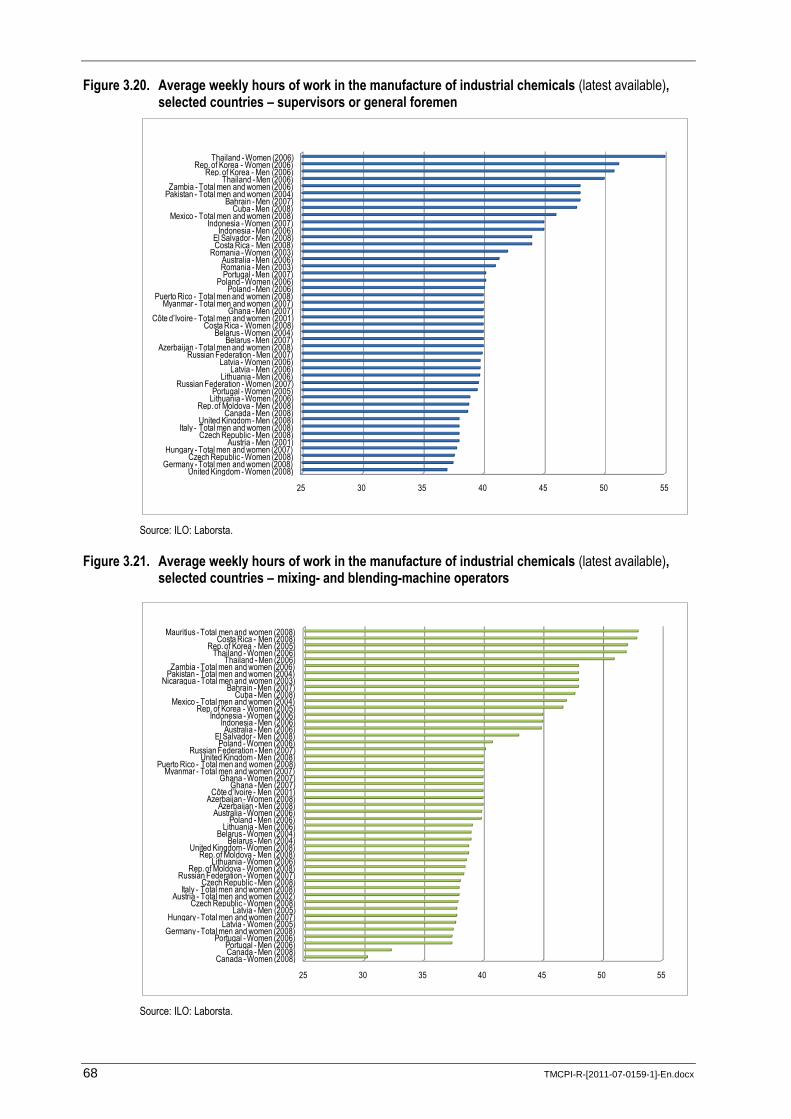
68 TMCPI-R-[2011-07-0159-1]-En.docx
Figure 3.20. Average weekly hours of work in the manufacture of industrial chemicals (latest available), selected countries – supervisors or general foremen
Source: ILO: Laborsta.
Figure 3.21. Average weekly hours of work in the manufacture of industrial chemicals (latest available), selected countries – mixing- and blending-machine operators
Source: ILO: Laborsta.
25 30 35 40 45 50 55
United Kingdom - Women (2008)Germany - Total men and women (2008)
Czech Republic - Women (2008)Hungary - Total men and women (2007)
Austria - Men (2001)Czech Republic - Men (2008)
Italy - Total men and women (2008)United Kingdom - Men (2008)
Canada - Men (2008)Rep. of Moldova - Men (2008)
Lithuania - Women (2006)Portugal - Women (2005)
Russian Federation - Women (2007)Lithuania - Men (2006)
Latvia - Men (2006)Latvia - Women (2006)
Russian Federation - Men (2007)Azerbaijan - Total men and women (2008)
Belarus - Men (2007)Belarus - Women (2004)
Costa Rica - Women (2008)Côte d’Ivoire - Total men and women (2001)
Ghana - Men (2007)Myanmar - Total men and women (2007)
Puerto Rico - Total men and women (2008)Poland - Men (2006)
Poland - Women (2006)Portugal - Men (2007)
Romania - Men (2003)Australia - Men (2006)
Romania - Women (2003)Costa Rica - Men (2008)El Salvador - Men (2008)
Indonesia - Men (2006)Indonesia - Women (2007)
Mexico - Total men and women (2008)Cuba - Men (2008)
Bahrain - Men (2007)Pakistan - Total men and women (2004)Zambia - Total men and women (2006)
Thailand - Men (2006)Rep. of Korea - Men (2006)
Rep. of Korea - Women (2006)Thailand - Women (2006)
25 30 35 40 45 50 55
Canada - Women (2008)Canada - Men (2008)Portugal - Men (2006)
Portugal - Women (2006)Germany - Total men and women (2008)
Latvia - Women (2005)Hungary - Total men and women (2007)
Latvia - Men (2005)Czech Republic - Women (2008)
Austria - Total men and women (2002)Italy - Total men and women (2008)
Czech Republic - Men (2008)Russian Federation - Women (2007)
Rep. of Moldova - Women (2008)Lithuania - Women (2006)
Rep. of Moldova - Men (2008)United Kingdom - Women (2008)
Belarus - Men (2004)Belarus - Women (2004)
Lithuania - Men (2006)Poland - Men (2006)
Australia - Women (2006)Azerbaijan - Men (2008)
Azerbaijan - Women (2008)Côte d’Ivoire - Men (2001)
Ghana - Men (2007)Ghana - Women (2007)
Myanmar - Total men and women (2007)Puerto Rico - Total men and women (2008)
United Kingdom - Men (2008)Russian Federation - Men (2007)
Poland - Women (2006)El Salvador - Men (2008)
Australia - Men (2006)Indonesia - Men (2006)
Indonesia - Women (2006)Rep. of Korea - Women (2005)
Mexico - Total men and women (2004)Cuba - Men (2008)
Bahrain - Men (2007)Nicaragua - Total men and women (2003)
Pakistan - Total men and women (2004)Zambia - Total men and women (2006)
Thailand - Men (2006)Thailand - Women (2006)
Rep. of Korea - Men (2005)Costa Rica - Men (2008)
Mauritius - Total men and women (2008)
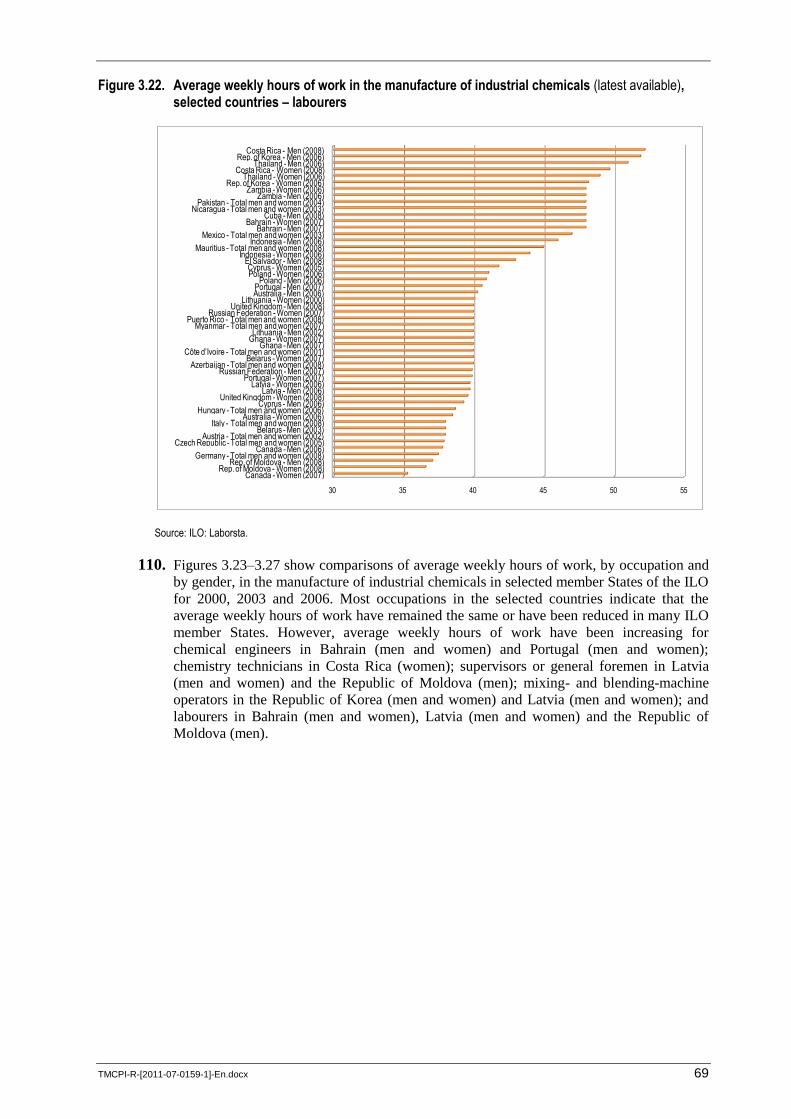
TMCPI-R-[2011-07-0159-1]-En.docx 69
Figure 3.22. Average weekly hours of work in the manufacture of industrial chemicals (latest available), selected countries – labourers
Source: ILO: Laborsta.
110. Figures 3.23–3.27 show comparisons of average weekly hours of work, by occupation and
by gender, in the manufacture of industrial chemicals in selected member States of the ILO
for 2000, 2003 and 2006. Most occupations in the selected countries indicate that the
average weekly hours of work have remained the same or have been reduced in many ILO
member States. However, average weekly hours of work have been increasing for
chemical engineers in Bahrain (men and women) and Portugal (men and women);
chemistry technicians in Costa Rica (women); supervisors or general foremen in Latvia
(men and women) and the Republic of Moldova (men); mixing- and blending-machine
operators in the Republic of Korea (men and women) and Latvia (men and women); and
labourers in Bahrain (men and women), Latvia (men and women) and the Republic of
Moldova (men).
30 35 40 45 50 55
Canada - Women (2007)Rep. of Moldova - Women (2008)
Rep. of Moldova - Men (2008)Germany - Total men and women (2008)
Canada - Men (2006)Czech Republic - Total men and women (2005)
Austria - Total men and women (2002)Belarus - Men (2003)
Italy - Total men and women (2008)Australia - Women (2006)
Hungary - Total men and women (2006)Cyprus - Men (2006)
United Kingdom - Women (2008)Latvia - Men (2006)
Latvia - Women (2006)Portugal - Women (2007)
Russian Federation - Men (2007)Azerbaijan - Total men and women (2008)
Belarus - Women (2007)Côte d’Ivoire - Total men and women (2001)
Ghana - Men (2007)Ghana - Women (2007)Lithuania - Men (2002)
Myanmar - Total men and women (2007)Puerto Rico - Total men and women (2008)
Russian Federation - Women (2007)United Kingdom - Men (2008)
Lithuania - Women (2000)Australia - Men (2006)Portugal - Men (2007)
Poland - Men (2006)Poland - Women (2006)Cyprus - Women (2005)
El Salvador - Men (2008)Indonesia - Women (2006)
Mauritius - Total men and women (2008)Indonesia - Men (2006)
Mexico - Total men and women (2003)Bahrain - Men (2007)
Bahrain - Women (2007)Cuba - Men (2008)
Nicaragua - Total men and women (2003)Pakistan - Total men and women (2004)
Zambia - Men (2006)Zambia - Women (2006)
Rep. of Korea - Women (2006)Thailand - Women (2006)
Costa Rica - Women (2008)Thailand - Men (2006)
Rep. of Korea - Men (2006)Costa Rica - Men (2008)
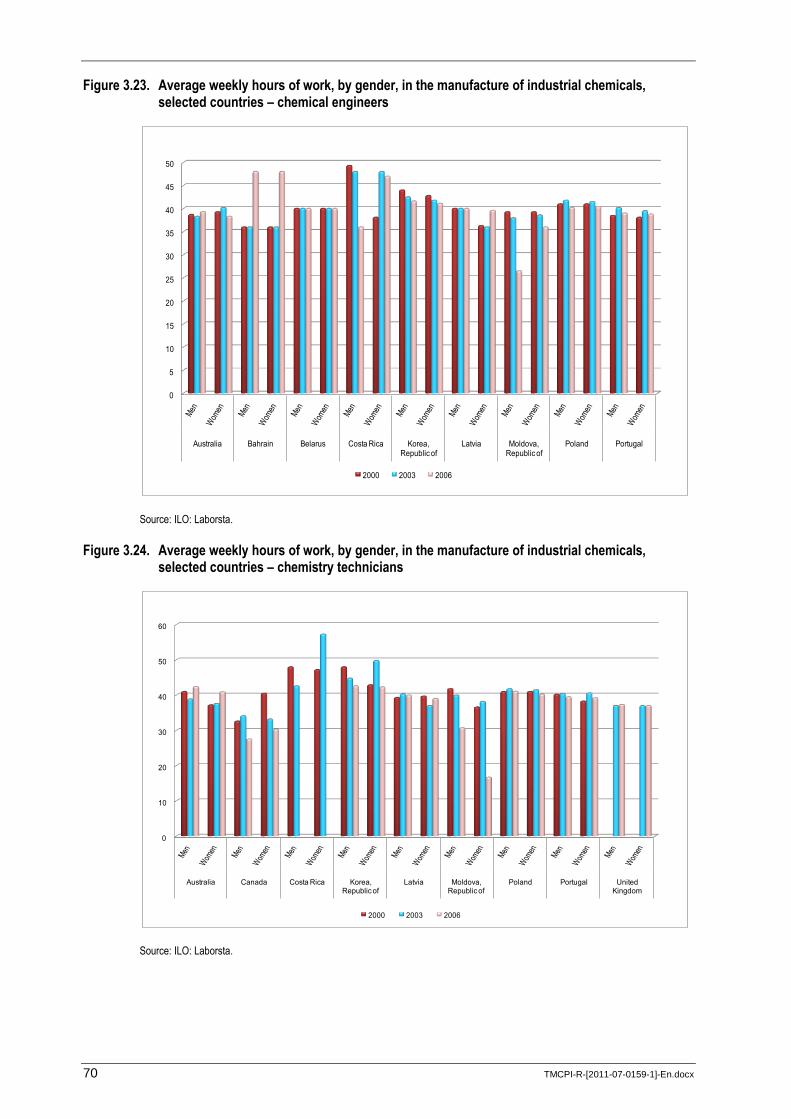
70 TMCPI-R-[2011-07-0159-1]-En.docx
Figure 3.23. Average weekly hours of work, by gender, in the manufacture of industrial chemicals, selected countries – chemical engineers
Source: ILO: Laborsta.
Figure 3.24. Average weekly hours of work, by gender, in the manufacture of industrial chemicals, selected countries – chemistry technicians
Source: ILO: Laborsta.
0
5
10
15
20
25
30
35
40
45
50
Australia Bahrain Belarus Costa Rica Korea, Republic of
Latvia Moldova, Republic of
Poland Portugal
2000 2003 2006
0
10
20
30
40
50
60
Australia Canada Costa Rica Korea, Republic of
Latvia Moldova, Republic of
Poland Portugal United Kingdom
2000 2003 2006
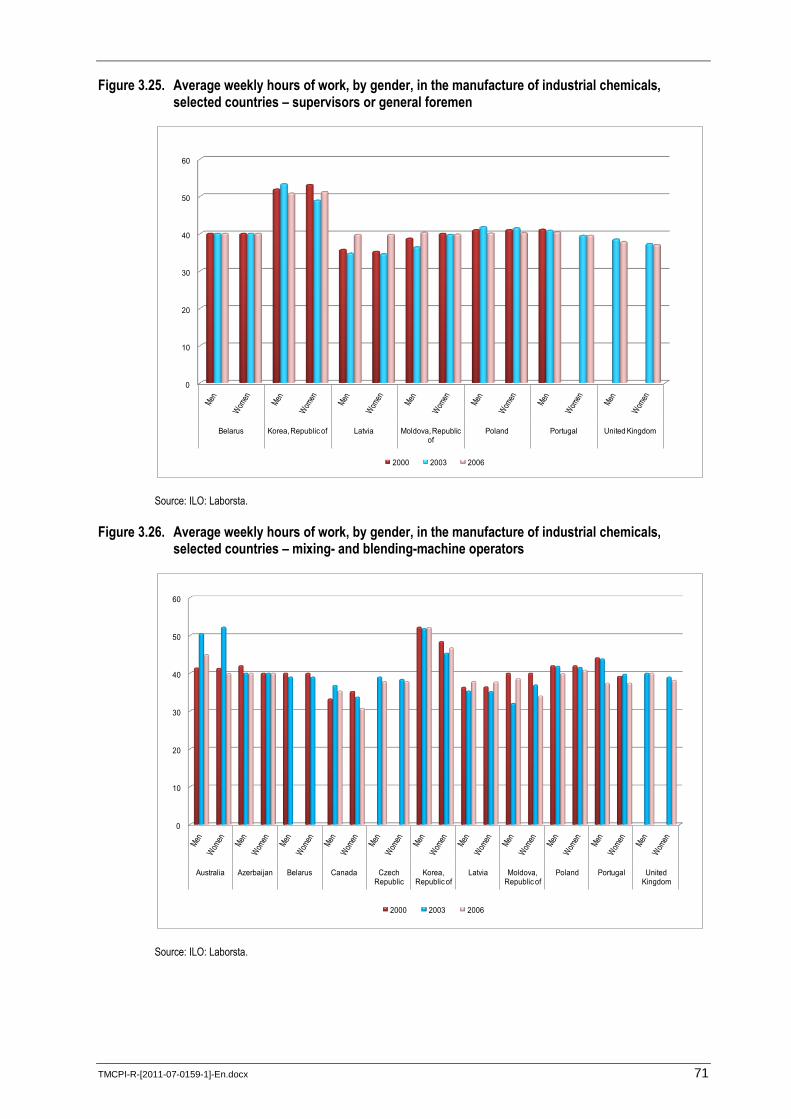
TMCPI-R-[2011-07-0159-1]-En.docx 71
Figure 3.25. Average weekly hours of work, by gender, in the manufacture of industrial chemicals, selected countries – supervisors or general foremen
Source: ILO: Laborsta.
Figure 3.26. Average weekly hours of work, by gender, in the manufacture of industrial chemicals, selected countries – mixing- and blending-machine operators
Source: ILO: Laborsta.
0
10
20
30
40
50
60
Belarus Korea, Republic of Latvia Moldova, Republic of
Poland Portugal United Kingdom
2000 2003 2006
0
10
20
30
40
50
60
Australia Azerbaijan Belarus Canada Czech Republic
Korea, Republic of
Latvia Moldova, Republic of
Poland Portugal United Kingdom
2000 2003 2006
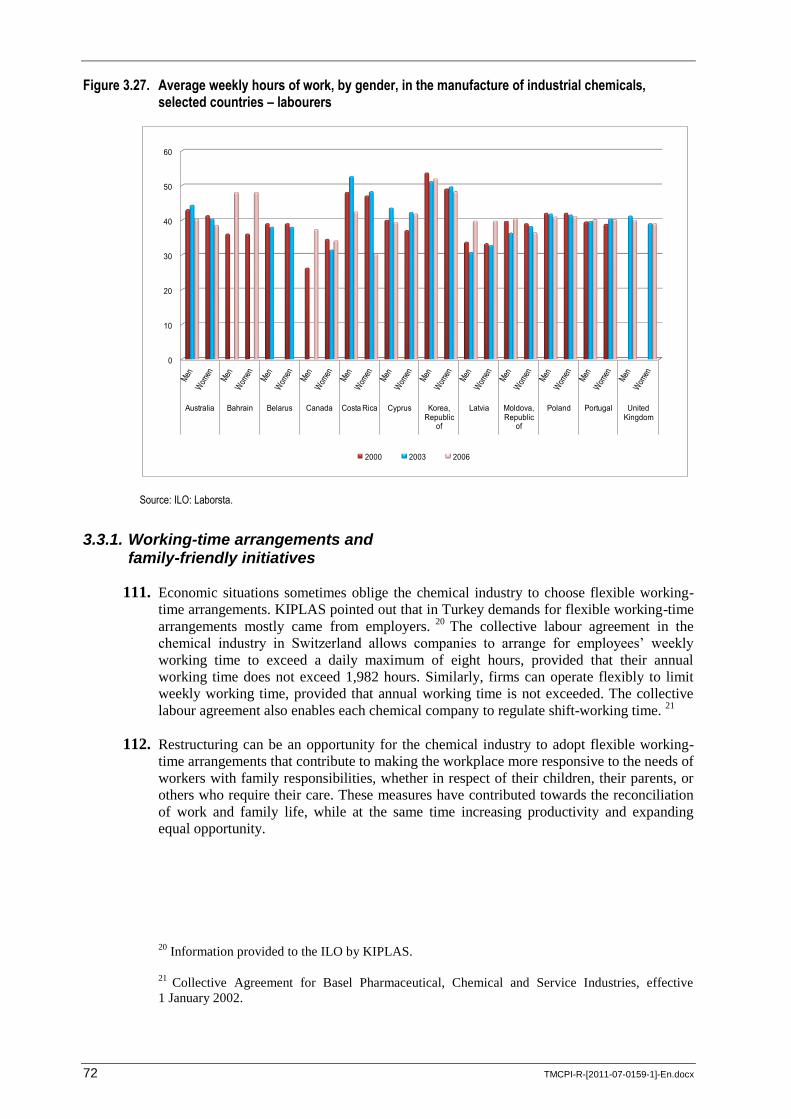
72 TMCPI-R-[2011-07-0159-1]-En.docx
Figure 3.27. Average weekly hours of work, by gender, in the manufacture of industrial chemicals, selected countries – labourers
Source: ILO: Laborsta.
3.3.1. Working-time arrangements and family-friendly initiatives
111. Economic situations sometimes oblige the chemical industry to choose flexible working-
time arrangements. KIPLAS pointed out that in Turkey demands for flexible working-time
arrangements mostly came from employers. 20
The collective labour agreement in the
chemical industry in Switzerland allows companies to arrange for employees‟ weekly
working time to exceed a daily maximum of eight hours, provided that their annual
working time does not exceed 1,982 hours. Similarly, firms can operate flexibly to limit
weekly working time, provided that annual working time is not exceeded. The collective
labour agreement also enables each chemical company to regulate shift-working time. 21
112. Restructuring can be an opportunity for the chemical industry to adopt flexible working-
time arrangements that contribute to making the workplace more responsive to the needs of
workers with family responsibilities, whether in respect of their children, their parents, or
others who require their care. These measures have contributed towards the reconciliation
of work and family life, while at the same time increasing productivity and expanding
equal opportunity.
20 Information provided to the ILO by KIPLAS.
21 Collective Agreement for Basel Pharmaceutical, Chemical and Service Industries, effective
1 January 2002.
0
10
20
30
40
50
60
Australia Bahrain Belarus Canada Costa Rica Cyprus Korea, Republic
of
Latvia Moldova, Republic
of
Poland Portugal United Kingdom
2000 2003 2006
TMCPI-R-[2011-07-0159-1]-En.docx 73
4. The implications of restructuring for industrial relations
113. The issues relating to the impact of restructuring on industrial relations deserve our
attention, because without good employer–employee relationships, restructuring is not
always successful. Celerant Consulting found that the history of M&A in the chemical
industry does not have a great track record, with over half of recent transactions held to
have destroyed value rather than creating it. It is suggested that chemical companies must
choose carefully whether to acquire or to ally, and to be clear about their objectives for
doing so, and then to implement an action plan to deliver the benefits in a timely way. 1
Poorly managed M&A can harm companies by losing talented workers from the company
when it is restructured. It should be noted that choosing M&A does not necessarily help
chemical companies to attain their goal. On the contrary, excessive downsizing of
manpower can harm a company‟s growth, because losing workers with expertise and
knowledge weakens the base for growth. Thus, industrial relations‟ issues play a vital role
in restructuring. This chapter will discuss the implications of restructuring for employer–
employee relationships in the chemical industry.
4.1. Overcoming the cultural differences
114. Poorly managed M&A could lessen workers‟ motivation. In any M&A transaction, it is
important to consider, prior to merger, how different corporate cultures will amalgamate.
The cultural differences between merging firms are a key element affecting the success of
M&A. However, employers often pay less attention to differences in cultural elements, and
do not analyse thoroughly the cultural fit of the merging entities, especially during pre-
merger stages. In many cases, employers do not have a complete culture integration
strategy or, where they do have it, it is often for either total cultural integration or total
autonomy. If employers do not have coherent and proactive strategies for optimizing the
benefits of amalgamating the two cultures or for dealing with cultural problems, any
decision made will be at best tenuous and at times reactive with regard to solving culture-
related issues. In short, cultural fit is a key factor in M&A success and should be given the
necessary attention at all stages of M&A.
115. Good pre-merger planning, with corporate culture at the heart of integration strategies and
implementation, and the creation of a positive atmosphere for change, before initiating any
actual consolidation of human and physical assets, contribute to M&A success and value
creation. Communication plays a critical role in developing trust between the companies
involved and consequently leading to successful integration. Lack of effective
communication heightens cultural differences and may create tension between employees.
In order to reduce communication issues, employers are requested not only to give
information but to actively involve all stakeholders, and especially employees, in the
merger process. The implementation of job rotation systems, whereby key players
exchange jobs and/or work together with their counterparts in the merging company, helps
to familiarize them with what goes on and how things are done in each company. Culture
integration should be an active and gradual process in which the two firms learn to work
and do things in the same way, or understand why they should do things differently.
During this stage of the process, it is important to focus on the levels of integration
between the two cultures and the creation of an atmosphere that can support cultural
1 S. Smith: “Working on growth”, in European Chemical News (Wageningen), 24–30 Jan. 2005,
pp. 20–22.
74 TMCPI-R-[2011-07-0159-1]-En.docx
change. In order to create that atmosphere, firms should be willing to work together after
the merger, something that can only be achieved with socio-cultural integration and
communication between the two organizations‟ employees. In the post-merger phase,
chemical companies must maintain that atmosphere and also introduce processes and
systems to measure and evaluate the effectiveness of the new organizational culture to the
new organization‟s performance and to employees‟ morale, and they must respond
accordingly. 2
4.2. Outsourcing and contract labour
116. Outsourcing enables chemical firms to access high-quality services in a cost-effective way.
In Japan, nine major chemical companies stated, regarding the impact of restructuring on
work methods, that they had expanded the use of outsourcing. 3
117. It should be noted that outsourcing can have adverse effects on industrial relations. The
terms of employment contracts are becoming increasingly diverse. Restructuring
companies and value chains contribute to the fragmentation of industrial relations. The
coexistence of various employment conditions driven by value-chain restructuring has
resulted in a weakening of traditional industrial relations. This becomes even more
apparent in the context of growing differences between core and peripheral, or internal and
external, workers. The traditional view was that segmenting workforces on the flexible
firm model, for example, served to buffer core workers and left peripheral workers with all
the disadvantages and risks of cost-cutting and flexibility, among other things, through
outsourcing or contracting. However, this no longer seems to apply for core workers. Core
workers are now bearing more and more of the effects of flexibility. Value-chain
restructuring rarely has the effect of cushioning core workers; instead, they are now subject
to greater pressures for flexibility and work intensification. Globalization has increased
competition, and this, in turn, has increased competition among all types of workers within
the same company. This has led to an increased fragmentation of industrial relations in the
workplace. 4
118. Particularly in recent years, outsourcing and contract labour have become one of the issues
central to industrial relations in the chemical industry. Unions have noted increasingly
diverse types of contracts in recent years. The traditional and straightforward contracting-
out of jobs onsite and/or outsourcing offsite is moving towards more specialized and
sophisticated contracting. In the petrochemical sector, the number of specialist service
providers has been increasing. A principal company can “buy” services that it does not
wish to maintain in-house. Many ICEM affiliates have stated that these specialist
contractors are not a problem, because they are established companies whose contracts
with the principal company last for many years. They often employ skilled staff on a long-
term basis, with relatively decent terms and conditions. However, unions have found a
problem with a new breed of “service suppliers”; and a wide range of services that were
2 G. Lodorfos and A. Boateng: “The role of culture in the merger and acquisition process: Evidence
from the European chemical industry”, in Management Decision (Bingley, Emerald Group
Publishing Limited), Vol. 44, No. 10, 2006, pp. 1405–1421.
3 Information provided to the ILO by Nippon Keidanren.
4 J. Flecker: “Fragmenting labour: Organisational restructuring, employment relations and the
dynamics of national regulatory frameworks”, in Work Organisation, Labour and Globalisation
(London, Analytica Publications Ltd), Vol. 4, No. 1, 2010, pp. 8–23.
TMCPI-R-[2011-07-0159-1]-En.docx 75
once an integral part of a big firm are now being contracted to service suppliers. 5 A recent
trade union survey showed an increase in the number of workers employed on precarious
contracts. A total of 66 per cent of ICEM and International Metalworkers‟ Federation
(IMF) affiliates that participated in the survey indicated that there had been an increase in
temporary or part-time work in the chemicals and metal industries in their countries in
2009. Only 22 per cent of their affiliates reported that they had seen a decrease, with a
further 12 per cent stating that there had been no change. 6
119. There has been a growing emergence of so-called “more flexible forms of work”, which
deviate from standard employment contracts. Non-standard work can be further divided
into “atypical” and “very atypical” forms of work. The latter refers to very short fixed-term
contracts of less than six months‟ duration, part-time work of fewer than ten hours per
week, non-written contracts, and zero-hours or on-call working. A study examined the
phenomenon of very atypical work, looking at the incidence and nature of this form of
work across the 27 Member States of the European Union, and Norway. The study found
that while the incidence of non-standard forms of work was thought to be increasing, a
high degree of variety was evident across Europe in the use of each type of very atypical
contract. The types of workers engaged in very atypical forms of work tended to be
extremely varied, ranging from very low-skilled workers on seasonal contracts to highly-
skilled professionals on short, task-focused contracts; clearly, the work situation of these
two categories differs radically. One of the effects of the global economic crisis is a
growing population of unemployed, highly skilled professional contractors. As a result,
pharmaceutical firms make more use of contractors in all discovery-based disciplines than
they previously did, so that firms can gain flexibility to fill a short-term need. 7
120. With regard to quality of work, non-standard and very atypical workers face particular
challenges. For example, these workers feel they have less job security, lack a fixed career
plan, receive fewer training and career development opportunities, and experience greater
difficulties in reconciling working and non-working life as a result of the characteristics of
atypical work. Non-standard forms of employment tend to be associated with lower rates
of pay, as many workers in this category work in relatively low-skilled jobs. Such forms of
work may also have negative repercussions on the receipt of bonuses or on workers‟ social
security coverage and entitlements. With regard to occupational safety and health, workers
on very atypical contracts tend to work in more hazardous jobs or have more hazardous
working conditions than their counterparts on more standard contracts. In some countries
in Europe, the risk of work-related accidents and injuries appears to be higher for particular
types of non-standard workers, such as those on fixed-term contracts. Moreover, the study
found that the specific features of very atypical contractual arrangements could have an
adverse impact on workers‟ health. 8
121. Chemical trade unions have appealed for industrial action to secure workers‟ rights at work
for these vulnerable workers. Some recent actions by chemical workers regarding contract
5 C. Mather: Contract/Agency labour: A threat to our social standards (Geneva, ICEM, 2004).
6 A. Gardner: “ICEM/IMF survey shows precarious work still growing”, International
Metalworkers‟ Federation press release, 10 Feb. 2010 (Geneva).
7 S. Ainsworth: “Cautiously optimistic”, in C&EN (Washington, DC, American Chemical Society),
1 Nov. 2010, pp. 38–42.
8 Foundation for the Improvement of Living and Working Conditions (Eurofound): Flexible forms
of work: “Very atypical” contractual arrangements: Executive summary (Dublin, European
Working Conditions Observatory (EWCO), 2010).
76 TMCPI-R-[2011-07-0159-1]-En.docx
and agency labour issues included the following: in November 2005, about 1,000 Thai
chemical workers protested against amendments to the Labour Protection Act of 1998,
which created a mass of contract workers who had no rights and no direct
employer–employee relationship with the actual companies for which they worked; 9 some
2,500 workers at DSM in the Netherlands marched to protest the company‟s decision to cut
1,000 core workers at industrial chemical worksites in Geleen and replace them with
500 contractors; 10
and in the Republic of Korea, chemical workers took part in a general
strike to protest their Government‟s labour law reform granting more flexibility to
employers to use temporary workers and contract labour. 11
Earlier, in April 2005, workers
at Kemalex Plastics in Australia went on strike over the rights of contract labour. 12
More
recently, in January 2011 in Bangladesh, a worker at Advanced Chemical Industries Ltd
(ACI) lost his life and many were hospitalized as a result of demonstrations against the fact
that some of their members had been on temporary employment contracts for as long as
12 years. 13
122. Examples in the chemical industry show that collective bargaining can be a useful tool to
address issues on outsourcing and contract labour, although collective bargaining is
generally still limited in its reach and scope. The social partners in the German chemical
industry chose to allow the use of an employment service agency, to an extent protecting
existing jobs in the industry. Economic stagnation in Germany motivated the German
Federation of Chemical Employers‟ Associations (BAVC) and IG BCE to agree on a
framework for allowing wider use of private agency workers. The agreement allows the
use of agency workers through the creation of personnel service agencies (PSAs) in line
with the modern services on the labour market. 14
PSAs are less costly, as employers do not
have to pay the usual social costs and benefits. Although they have to take account of the
collective labour agreements that govern the German chemical sector, PSAs have the
flexibility to negotiate on a company-by-company basis. This means that they do not have
to follow the collective agreements slavishly. PSAs are able to offer short-term, temporary
contracts without the usual employment conditions granted to German workers in
permanent work. 15
In Brazil, an agreement has been reached between BASF and chemical
workers at the Guaratinguetá plant – one of the largest BASF plants operating in Latin
America. About 50 per cent of workers at the plant are non-regular workers. The
agreement aims to regulate the use of contract and agency labour and requires the company
to pay the same wages and benefits to agency workers as it pays to regular employees.
Failure to implement the agreement will result in a fine of BRL500 (US$100) per worker
9 ICEM: “Thai workers protest to Government on contract and agency labour”, ICEM InBrief,
28 Nov. 2005 (Geneva).
10 ICEM: “DSM Dutch workers protest outsourcing”, ICEM News release No. 15/2004,
15 Mar. 2004 (Geneva).
11 ICEM: “Fate of South Korea‟s irregular Workers‟ Bill coming due”, ICEM InBrief, 28 Nov. 2005
(Geneva).
12 ICEM: “Kemalex Plastics strike in Australia ends”, ICEM InBrief, 11 July 2005 (Geneva).
13 ICEM: “ICEM condemns ACI conduct in deadly Bangladesh chemical plant riot”, ICEM News
release, 26 Jan. 2011 (Geneva).
14 “New law passed on temporary agency work” (Dublin, European Foundation for the
Improvement of Living and Working Conditions, 2002).
15 “Unions u-turn on agency staff use”, in ICIS Chemical Business (Sutton, Surrey), 31 Mar. 2003,
p. 9.
TMCPI-R-[2011-07-0159-1]-En.docx 77
per day. 16
These facts suggest that consultation is also important in order to secure regular
employment for a group of vulnerable workers. Collective labour agreements to establish
workers‟ rights to decide jointly with management whether to subcontract and to whom,
and union participation and support, through involvement in consultation and the decision-
making process, are necessary to ensure the protection of workers, including those in
precarious employment.
4.3. Collective bargaining in times of restructuring
123. As will be discussed in Chapter 5, the exchange of information is the most basic process of
social dialogue. Social dialogue can sometimes imply no real discussion or action on the
issues concerned, but it is an essential starting point towards better industrial relations.
Consultation is a means by which the social partners not only share information but also
engage in more in-depth dialogue on the issues raised. Because consultation itself does not
carry with it any decision-making power, collective bargaining becomes important for
initiating dialogue between the parties concerned in the case of contingencies, including
restructuring, takeovers and M&A.
124. Collective labour agreements, ultimately, are promises between employers and workers,
and as such should be fully respected. Some collective labour agreements in the chemical
industry incorporate a provision stating that in case of a contingency problem affecting the
workers and company financial matters, the company is to inform trade unions of such
plans and implications for employees‟ conditions of work. A collective labour agreement
in the chemical industry in Switzerland, signed in January 2002, incorporates the unions‟
right to be given information. Article 26 of the collective labour agreement gives trade
unions the right to organize workers‟ meetings to discuss emergency matters among trade
union members, without employers‟ intervention. 17
125. In Latin America, the role of collective bargaining has become more significant in recent
years than in the past. For example, in Argentina and Brazil, bargaining has instituted
workers‟ rights at work other than those provided by the industrial relations legal
framework, and in Brazil and Mexico many aspects concerning workers‟ issues are now
bargained. PEMEX underwent a modernization programme during the period 1990–94. It
initiated negotiations with trade unions in accordance with a provision of the collective
agreement. The parties negotiated general and specific conditions for the workers affected
by the issues listed in the collective labour agreement. 18
In Brazil, collective bargaining
has traditionally focused on wage bargaining; most non-wage issues involved either
extensions to, or replications of, provisions decided by the Consolidation of Labour Laws.
At enterprise level, firms and trade unions negotiated a share of profits and results
agreement to set out the minimum wage increase irrespective of productivity. During the
recession, local government, companies and trade unions negotiated to reduce taxes and
support the creation of a local productive agreement in the plastics sector of the
16 ICEM: “Brazilian social partners agree on CAL regulation at BASF”, ICEM Background
document, 15 Sep. 2010 (Geneva).
17 Collective agreement for Basel Pharmaceutical, Chemical and Service Industries, effective
1 January 2002.
18 Information provided to the ILO by Petróleos Mexicanos.
78 TMCPI-R-[2011-07-0159-1]-En.docx
petrochemical industry in São Paolo‟s ABC region. 19
Trade unions in the oil and chemical
industries managed to create additional individual and collective rights, leading other
sectors to include new rights in the collective labour agreements. As a result, recent
collective labour agreements have included provisions for maintaining jobs or increasing
numbers of jobs, such as: a guarantee of employment levels during a particular period; the
reduction of working hours to secure jobs temporarily; the elimination of overtime; and job
security during restructuring as a result of new technologies. 20
126. Flexibility in sectoral collective bargaining can be observed in the chemical industry in
some European countries, such as Austria, Italy and Germany. The German chemical
industry has developed flexibility in sectoral collective agreements. The BAVC and IG
BCE stated that bargaining parties in chemicals were a good example in that respect,
demonstrating that it was possible to maintain the system of firmly established sectoral
collective labour agreements while at the same time meeting the demands of companies for
increased flexibility. In the German chemical industry, three major “opening clauses” were
introduced into chemical industry agreements. In 1994, there was the introduction of a
working-time corridor, which allowed companies either to extend or shorten the
collectively agreed working time of 37.5 hours per week by up to 2.5 hours. As a result,
there was a working-time corridor of between 35 and 40 hours per week. In 1995, the
BAVC and IG BCE agreed on the introduction of an opening clause for the agreed annual
bonuses. And, in 1997, a wage corridor was introduced which, under certain
circumstances, allowed companies to reduce collectively agreed pay by up to 10 per cent
for a limited period of time (box 4.1). In March 2011, the German chemical industry
concluded a new agreement that includes, inter alia, a clause to allow company-level
agreements to either bring forward pay increases by one month, or to postpone them for up
to two months, depending on the economic situation of the country. 21
127. While greater flexibility in sectoral agreements can respond to the greater diversity of
individual company circumstances in the chemical industry, it must be noted that opening
clauses have changed the basic structure of sectoral collective bargaining. The widespread
introduction of these clauses has triggered a process of decentralization that has shifted an
increasingly large part of bargaining responsibilities to the company level. This has
resulted in a significant loss of regulatory power on the part of both employer associations
and trade unions. Collectively agreed standards, once seen as formal inviolable norms,
have now become objects of renegotiation at company level, with varying degrees of
involvement by the signatories to the sectoral agreements. As a result, trade unions have to
engage much more directly with the needs and requirements of companies, and works
councils have less scope to take refuge in the mandatory character of sectoral regulations
when confronted by management calls for local concessions. This requires more
19 ILO: Restructuring and social dialogue in the chemical industry in Brazil, Sectoral Activities
Working Paper (Geneva, forthcoming).
20 A. Cardoso and J. Gindin: Industrial relations and collective bargaining: Argentina, Brazil and
Mexico compared, Industrial and Employment Relations Department, Working Paper No. 5
(Geneva, ILO, 2009).
21 Information provided to the ILO by the BAVC.
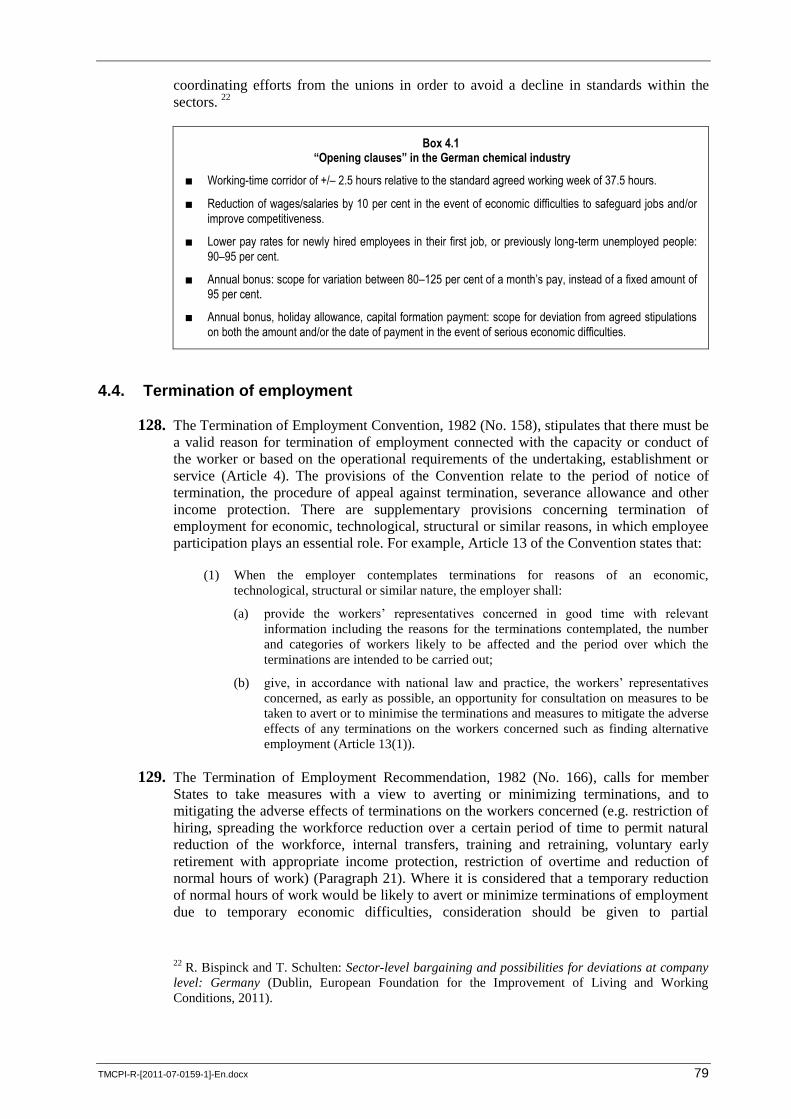
TMCPI-R-[2011-07-0159-1]-En.docx 79
coordinating efforts from the unions in order to avoid a decline in standards within the
sectors. 22
Box 4.1
“Opening clauses” in the German chemical industry
■ Working-time corridor of +/– 2.5 hours relative to the standard agreed working week of 37.5 hours.
■ Reduction of wages/salaries by 10 per cent in the event of economic difficulties to safeguard jobs and/or
improve competitiveness.
■ Lower pay rates for newly hired employees in their first job, or previously long-term unemployed people:
90–95 per cent.
■ Annual bonus: scope for variation between 80–125 per cent of a month’s pay, instead of a fixed amount of
95 per cent.
■ Annual bonus, holiday allowance, capital formation payment: scope for deviation from agreed stipulations
on both the amount and/or the date of payment in the event of serious economic difficulties.
4.4. Termination of employment
128. The Termination of Employment Convention, 1982 (No. 158), stipulates that there must be
a valid reason for termination of employment connected with the capacity or conduct of
the worker or based on the operational requirements of the undertaking, establishment or
service (Article 4). The provisions of the Convention relate to the period of notice of
termination, the procedure of appeal against termination, severance allowance and other
income protection. There are supplementary provisions concerning termination of
employment for economic, technological, structural or similar reasons, in which employee
participation plays an essential role. For example, Article 13 of the Convention states that:
(1) When the employer contemplates terminations for reasons of an economic,
technological, structural or similar nature, the employer shall:
(a) provide the workers‟ representatives concerned in good time with relevant
information including the reasons for the terminations contemplated, the number
and categories of workers likely to be affected and the period over which the
terminations are intended to be carried out;
(b) give, in accordance with national law and practice, the workers‟ representatives
concerned, as early as possible, an opportunity for consultation on measures to be
taken to avert or to minimise the terminations and measures to mitigate the adverse
effects of any terminations on the workers concerned such as finding alternative
employment (Article 13(1)).
129. The Termination of Employment Recommendation, 1982 (No. 166), calls for member
States to take measures with a view to averting or minimizing terminations, and to
mitigating the adverse effects of terminations on the workers concerned (e.g. restriction of
hiring, spreading the workforce reduction over a certain period of time to permit natural
reduction of the workforce, internal transfers, training and retraining, voluntary early
retirement with appropriate income protection, restriction of overtime and reduction of
normal hours of work) (Paragraph 21). Where it is considered that a temporary reduction
of normal hours of work would be likely to avert or minimize terminations of employment
due to temporary economic difficulties, consideration should be given to partial
22 R. Bispinck and T. Schulten: Sector-level bargaining and possibilities for deviations at company
level: Germany (Dublin, European Foundation for the Improvement of Living and Working
Conditions, 2011).
80 TMCPI-R-[2011-07-0159-1]-En.docx
compensation for loss of wages for the normal hours not worked, financed by methods
appropriate under national law and practice (Paragraph 22).
130. It should be noted that the employer is required by Convention No. 158 to notify the
competent public authorities when it contemplates the termination of workers‟
employment for reasons of an economic, technological, structural or similar nature. The
public authorities should receive all other relevant information, including a written
statement of the reasons for the terminations, the number and categories of workers likely
to be affected and the period over which the terminations are intended to be carried out.
Moreover, the employer should notify the competent public authority of the terminations
before carrying them out, and the period of notice should be specified in national laws or
regulations.
131. In China, the Government plays a crucial role in the restructuring of the chemical industry,
because of the importance of the industry to the national economy. The Government
actively promotes restructuring in order to stimulate the industry. For example, in 2005,
Yunnan Province conducted the restructuring of Yuntianhua Group Co. Ltd, Yunnan
Petroleum and Chemical Group, Yunnan Dongyuan Coal Industry Group Co. Ltd, Yunnan
Tin Group Co. Ltd, Kunming Institute of Precious Metals, and two other companies,
finally forming Yunnan Coal Chemical Industry Group Co. Ltd, to achieve optimal
allocation of resources. The Government respected the principle of “no layoffs, no pay
cuts” in the restructuring processes. 23
132. In Brazil, labour law neither determines nor stipulates prior communication and
negotiation on the impact of restructuring. The employer is responsible only for
communication, with 30 days‟ prior notice, of termination of the employment relationship
without determined cause. This period shall be paid and the employee may or may not – at
the discretion of the employer – work the period. If the period is worked, the employee can
have a two-hour reduction in hours of work per day to look for a new job. Most of the
time, the employee is exempt from working out this period of notice, receiving, inter alia,
as well as 30 days‟ salary, indemnification corresponding to the balance of wages,
vacation, past dues or a percentage thereof; 40 per cent of the total balance of the
employee‟s severance guarantee fund as a penalty to the employer; a percentage of the
13th salary (Christmas allowance); pending overtime, prizes and bonuses. Some labour
court decisions have hindered unfair collective dismissal, when arising from corporate
restructuring, on the grounds of ILO Convention No. 158. 24
133. In Japan, nine major chemical companies set out a basic rule not to lay off employees.
When alternative jobs within the company could not be found, employees were offered
alternative employment opportunities in its subsidiaries. If they could not accept the
alternative employment offered by the company, they had to leave. This raised the question
of how the company ensured fairness throughout the process. One company said that it
respected the decisions of the individual employees on taking early retirement or accepting
the transfer to related companies. Other companies said that fairness could be retained
through sincerity and good faith, and that they dedicated sufficient time and the utmost
effort to consultation with trade unions and the employees affected. In this context,
companies also provided the workers affected with comprehensive individual
consultations. When the employees affected chose to leave, the company expressed its
23 ILO: Restructuring and social dialogue in the chemical industry in China, Sectoral Activities
Working Paper (Geneva, forthcoming).
24 ILO: Restructuring and social dialogue in the chemical industry in Brazil, Sectoral Activities
Working Paper (Geneva, forthcoming).
TMCPI-R-[2011-07-0159-1]-En.docx 81
sincerity by maximizing their monetary compensation. One company added 36 months‟
pay to the retirement allowance. Companies also used outside job placement services. 25
134. Transparency and fairness with regard to termination of employment must be applied.
According to BASF, German labour law, under certain circumstances, requires
negotiations to compensate, or at least reduce, negative impacts on employees as a result of
restructuring. The usual results of such negotiations are certain conditions on severance
payments, in order to compensate for job losses. At BASF, the company and trade unions
have concluded a new site agreement that prevents dismissal as a result of company
operational activities. This agreement will enable the parties to better deal with the
relocation of surplus workers within the company. 26
25 Information provided to the ILO by Nippon Keidanren.
26 Information provided to the ILO by BASF SE.
82 TMCPI-R-[2011-07-0159-1]-En.docx
5. Social dialogue in times of restructuring
5.1. The role of social dialogue
135. The ILO has a broad working definition of social dialogue, reflecting the wide range of
processes and practices found in different countries. Social dialogue is defined by the ILO
to include all types of negotiation, consultation or simply exchange of information
between, or among, representatives of governments, employers and workers, on issues of
common interest relating to economic and social policy. It can exist as a tripartite process,
with the government as an official party to the dialogue or it may consist of bipartite
relations only between labour and management (or trade unions and employers‟
organizations), with or without indirect government involvement. Social dialogue
processes can be informal or institutionalized, and are often a combination of the two.
Social dialogue can take place at the national, regional or enterprise levels. It can be inter-
professional, sectoral or a combination of these. The main goal of social dialogue itself is
to promote consensus building and democratic involvement among the main stakeholders
in the world of work. Successful social dialogue structures and processes have the potential
to resolve important economic and social issues, encourage good governance, advance
social and industrial peace and stability, and boost economic progress. 1 The chemical
industry knows that social dialogue can increase profits by leading to greater productivity
and enhanced worker satisfaction. 2
136. The chemical industry has expanded the functions of social dialogue. ICEM has shown
that social dialogue was useful in establishing social justice and stability in Colombia, for
example. ICEM and its affiliates obtained the commitment of several multinational
chemical and energy companies and the Government of Colombia to engage in social
dialogue and make improvements in three major areas: HIV/AIDS, contract labour and the
massive security problems faced by trade unions in Colombia. 3
137. Social dialogue plays a pivotal role in promoting fundamental rights at work. In the
chemical industry in Brazil, social dialogue is considered a process in which social,
economic or political actors seek convergence of goals or negotiate matters of common
interest. Social dialogue can result in shared agreements and projects and can strengthen
the democratic governance and sustainability of the institutions involved. It can contribute
to fostering democracy in the workplace, especially the rights of workers and their
representative organizations. Social dialogue is an ongoing process. 4
138. Informal dialogue can lead to a formal dialogue mechanism. In 2001, in South Africa, the
National Bargaining Council for the Chemical Industry (NBCCI) was approved as an
official bargaining unit under the country‟s Labour Relations Act of 1995. NBCCI‟s
history began in 1995, in a dispute between the Chemical Workers‟ Industrial Union and
1 http://www.ilo.org/public/english/dialogue/ifpdial/areas/social.htm [accessed 20 Mar. 2011].
2 National Safety Council of India (NSCI): Vocational education and training in the chemical
industry in India, Sectoral Activities Working Paper No. 244 (Geneva, ILO, 2006), p. 29.
3 ICEM: “Union/Management social dialogue in Colombia on track”, ICEM News release
No. 16/2005, 6 July 2005 (Geneva).
4 ILO: Restructuring and social dialogue in the chemical industry in Brazil, Sectoral Activities
Working Paper (Geneva, forthcoming).
TMCPI-R-[2011-07-0159-1]-En.docx 83
chemical firms. The dispute was resolved through conciliation, which led to the
development of social dialogue between employers and employees; the parties
subsequently agreed to engage in sectoral bargaining and establish appropriate bargaining
forums in various economic sectors of the chemical industry. A social dialogue mechanism
was created in the form of a representative national working group, with interim
arrangements to facilitate informal sectoral dialogue until the statutory bargaining council
was established. NBCCI covers oil, chemicals, consumer goods, glass, industrial chemicals
and pharmaceutical sectors. Its primary aim is to provide a vehicle for dialogue between
employers and workers in South Africa‟s chemical and petroleum industries, with a view
to improving industrial relations, and to provide the social partners with new approaches to
industrial relations. Employers and workers can now obtain a better overall picture in order
to contribute to sustainable economic growth. NBCCI also contributes to minimizing
tensions between the parties concerned. 5
139. In the European Union, social dialogue encompasses discussions, joint action and
sometimes negotiations between the European social partners, and discussions between the
social partners and the institutions of the European Union. Article 138 of the European
Union Treaty (as amended by the Single European Act) requires the European
Commission to develop social dialogue within the European Union. 6
In 1998, the
European Commission decided to revitalize social dialogue by establishing sectoral social
dialogue committees. In doing so, the Commission aimed to specify more clearly the
double function of such committees: to act as consultative bodies able to influence
European public policies, and to work to develop bilateral relations and reach agreement.
Currently, there are 36 sectoral social dialogue committees, including one for the chemical
industry. 7 In 2004, the social partners in the European chemical industry agreed the Joint
Position Paper on education, vocational training and lifelong learning in the European
chemical industry, called the Helsinki Joint Position Paper. This drew attention to the high
proportion of knowledge-based workplaces, the need for highly trained staff, particularly
in the chemical industry, the lack of skills, and future demands for qualifications of
workers in the chemical industry. It affirmed that “one of the key tasks for the public
institutions in the individual member countries” was “to secure a high level of general
education for all citizens as well as an open and fair approach of this education towards
natural sciences, technology in general, a basic understanding of economic developments
and good standards in communication skills”, and that vocational training, regular and
“appropriate further training and lifelong learning over the entire working life is essential
not only for companies” to be “successful, productive and efficient, but also for each
employee in order to maintain his or her employability”. 8
140. Social dialogue has been tested during the global economic crisis. Tensions between the
social partners in the chemical industry have been visible in some countries, whereas
smoother cooperation and joint agreements have been put into practice in others. During
the crisis, two developments in social dialogue were highlighted. First, there is a growing
risk that economic hardship increases tensions between the social partners, because they
5 S. Miller and T. van Meelis: Industrial relations in the oil industry in South Africa, Sectoral
Activities Working Paper No. 238 (Geneva, ILO, 2006), pp. 39–40.
6 http://eur-lex.europa.eu/en/treaties/dat/12002E/pdf/12002E_EN.pdf [accessed 20 Mar. 2011].
7 European Foundation for the Improvement of Living and Working Conditions: Dynamics of
European sectoral social dialogue (Dublin, 2009), pp. 15–16.
8 EMCEF and ECEG: Skills for chemical businesses: Understanding society needs, Report based on
a survey of the social partners of the European chemical industry (2006).
84 TMCPI-R-[2011-07-0159-1]-En.docx
have to cope with redundancies and downsizing in enterprises. Second, employers are keen
to see measures aimed at a more flexible labour market that enables them to adjust to the
economic context in a timely fashion. The crisis also underscores the importance of
tripartism, because during the crisis, the social partners worked together to encourage
governments to take measures to mitigate the crisis. 9
5.2. Why consultation is important
141. Research suggests that employers do not provide workers and their representative
organizations with adequate information during restructuring. Employees perform better
when they know what is expected of them and feel they have opportunities to voice their
opinions. Research confirms that organizations with communication infrastructures that
allow for constant listening and feedback reap the rewards of that approach. A study 10
makes clear links between robust communication processes and increased profits. The
research shows that companies with the most effective employee communication
programmes provided a 26 per cent total return to shareholders, compared to a
minus 15 per cent return from organizations at the other end of the scale. 11
142. In the European Union, forms of employee representation at the workplace have been
legally established and institutionalized in most Member States. Directive 2002/14/EC
establishing a general framework for informing and consulting employees in the European
Community has been considered a landmark development in establishing common
guidelines for employee representation and social dialogue in the workplace (box 5.1).
Box 5.1
Key features of Directive 2002/14/EC establishing a general framework for informing and consulting employees in the European Community
The purpose of the Directive is to establish a general framework setting out minimum requirements for the right of employees to be informed and consulted. The Directive is drafted in broad terms and allows Member States considerable flexibility in implementing its terms. However, the following points are defined as being crucial to the framework regulation:
(1) Member States have to choose whether to apply the Directive to undertakings with at least 50 employees or establishments employing at least 20 employees.
(2) Information and consultation are defined as taking place between the employer and employee representatives. The Directive requires:
(a) information on the recent and probable development of the undertaking’s or the establishment’s activities and economic situation;
(b) information and consultation on the situation, structure and probable development of employment, and on any anticipatory measures envisaged, in particular where there is a threat to employment;
(c) information and consultation, with a view to reaching an agreement, on decisions likely to lead to substantial changes in work organization or in contractual relations.
(3) Information and consultation arrangements defined by agreements between management and labour,
9 European Foundation for the Improvement of Living and Working Conditions: Social dialogue
and the recession (Dublin, 2009).
10 J. Waddington: “Contesting the development of European Works Councils in the chemicals
sector”, in European Journal of Industrial Relations (Thousand Oaks, CA, SAGE Publications),
Vol. 12, No. 3, 2006, pp. 329–352.
11 D. Ferrabee: “Developing an employee consultation process”, Strategic Communication
Management; Dec. 2004–Jan. 2005; 9, 1; ABI/INFORM Global, p. 31.
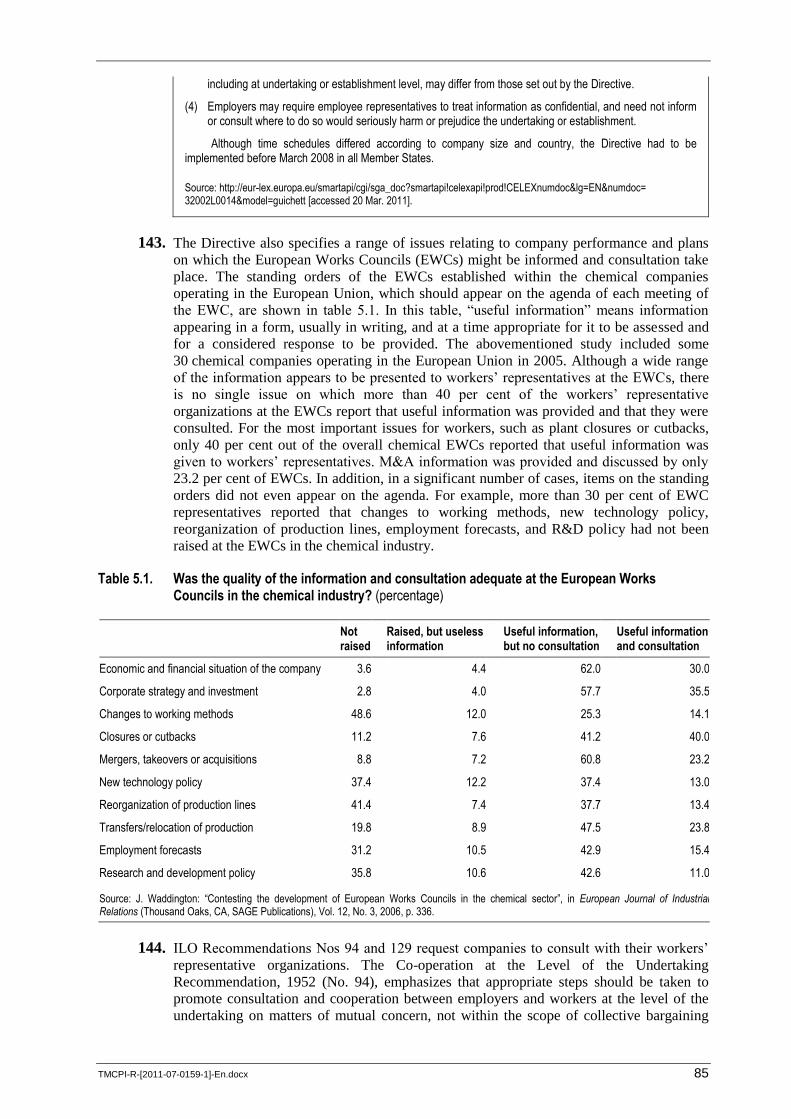
TMCPI-R-[2011-07-0159-1]-En.docx 85
including at undertaking or establishment level, may differ from those set out by the Directive.
(4) Employers may require employee representatives to treat information as confidential, and need not inform or consult where to do so would seriously harm or prejudice the undertaking or establishment.
Although time schedules differed according to company size and country, the Directive had to be implemented before March 2008 in all Member States.
Source: http://eur-lex.europa.eu/smartapi/cgi/sga_doc?smartapi!celexapi!prod!CELEXnumdoc&lg=EN&numdoc= 32002L0014&model=guichett [accessed 20 Mar. 2011].
143. The Directive also specifies a range of issues relating to company performance and plans
on which the European Works Councils (EWCs) might be informed and consultation take
place. The standing orders of the EWCs established within the chemical companies
operating in the European Union, which should appear on the agenda of each meeting of
the EWC, are shown in table 5.1. In this table, “useful information” means information
appearing in a form, usually in writing, and at a time appropriate for it to be assessed and
for a considered response to be provided. The abovementioned study included some
30 chemical companies operating in the European Union in 2005. Although a wide range
of the information appears to be presented to workers‟ representatives at the EWCs, there
is no single issue on which more than 40 per cent of the workers‟ representative
organizations at the EWCs report that useful information was provided and that they were
consulted. For the most important issues for workers, such as plant closures or cutbacks,
only 40 per cent out of the overall chemical EWCs reported that useful information was
given to workers‟ representatives. M&A information was provided and discussed by only
23.2 per cent of EWCs. In addition, in a significant number of cases, items on the standing
orders did not even appear on the agenda. For example, more than 30 per cent of EWC
representatives reported that changes to working methods, new technology policy,
reorganization of production lines, employment forecasts, and R&D policy had not been
raised at the EWCs in the chemical industry.
Table 5.1. Was the quality of the information and consultation adequate at the European Works Councils in the chemical industry? (percentage)
Not raised
Raised, but useless information
Useful information, but no consultation
Useful information and consultation
Economic and financial situation of the company 3.6 4.4 62.0 30.0
Corporate strategy and investment 2.8 4.0 57.7 35.5
Changes to working methods 48.6 12.0 25.3 14.1
Closures or cutbacks 11.2 7.6 41.2 40.0
Mergers, takeovers or acquisitions 8.8 7.2 60.8 23.2
New technology policy 37.4 12.2 37.4 13.0
Reorganization of production lines 41.4 7.4 37.7 13.4
Transfers/relocation of production 19.8 8.9 47.5 23.8
Employment forecasts 31.2 10.5 42.9 15.4
Research and development policy 35.8 10.6 42.6 11.0
Source: J. Waddington: “Contesting the development of European Works Councils in the chemical sector”, in European Journal of Industrial Relations (Thousand Oaks, CA, SAGE Publications), Vol. 12, No. 3, 2006, p. 336.
144. ILO Recommendations Nos 94 and 129 request companies to consult with their workers‟
representative organizations. The Co-operation at the Level of the Undertaking
Recommendation, 1952 (No. 94), emphasizes that appropriate steps should be taken to
promote consultation and cooperation between employers and workers at the level of the
undertaking on matters of mutual concern, not within the scope of collective bargaining
86 TMCPI-R-[2011-07-0159-1]-En.docx
machinery, or not normally dealt with by other machinery concerned with the
determination of terms and conditions of employment (Paragraph 1). Recommendation
No. 94 makes a clear distinction between the role of collective bargaining and that of
consultation, emphasizing that consultation and cooperation should be facilitated within
the enterprise by encouraging voluntary agreements between the parties, or by promoting
laws and regulations regarding the establishment of consultation and cooperation bodies.
These laws or regulations should also determine the scope, functions, structure and
methods of operation for such bodies, as appropriate to national conditions. The
Communications within the Undertaking Recommendation, 1967 (No. 129), reiterates that
the method of communication between management and employees should in no way
diminish the principle of freedom of association. In other words, communications policies
should not cause prejudice to freely chosen workers‟ representatives or their organizations,
or curtail the functions of the workers‟ representative bodies. This is important because, in
practice, it is often difficult for workers‟ representatives to enforce their right to receive
information, especially for collective bargaining purposes. Faced with this reality,
Recommendation No. 129 introduces a set of principles that should guide both employers‟
and workers‟ representative organizations in establishing, implementing and maintaining
effective communication policies.
145. In Mexico, the law requires its state-owned oil and chemical company to consult with trade
unions over any corporate structural change. PEMEX has a petrochemical business as a
subsidiary – PEMEX Petroquímica (PPQ). Federal Labour Law (article 41) guarantees that
industrial relations, in particular collective labour agreements, shall not be affected in the
event of one employer being replaced by another. Article 9 of the Organic Law of PEMEX
and its subsidiaries states that, in the event of any change in PEMEX‟s work organization
and corporate structure, the employment and conditions of workers must be preserved as
stipulated in the collective labour agreement. The Law mandates PEMEX to ensure that
the trade union participates fully in the restructuring processes. It is understood that the
Law implies that the existing collective agreement must be retained. The decree at the
origin of PEMEX‟s present corporate structure states that one of the objectives of
restructuring is to strictly enforce federal labour law and PEMEX‟s existing collective
labour agreement to stabilize labour relations in the oil and chemical industries. 12
5.3. When and how to consult
146. The disclosure of information, and when and how to consult, are gaining importance. At
the enterprise level, employers should, as far as possible, provide information on all
matters of interest to workers in relation to the operation and future prospects of the
enterprise, and to the present and future situation of the workers themselves. Such
information should be addressed either to workers or to their representatives – taking into
account the nature of the information, in so far as its disclosure, as stated in
Recommendation No. 129, “will not cause damage to the parties” (Paragraph 15(1)).
Recommendation No. 129 examines in more detail the kind of information that
management should be able to communicate to workers and their representatives, for
example: information on general conditions of employment, including engagement,
transfer and termination; job descriptions and the placement of particular jobs within the
structure of the undertaking; possibilities of training and prospects for advancement within
the undertaking; general working conditions; occupational safety and health regulations
and instructions for the prevention of accidents and occupational diseases; procedures for
the examination of grievances as well as the rules and practices governing their operation
12 C. Reynoso Castillo: Industrial relations in the oil industry in Mexico, Sectoral Activities
Working Paper No. 239 (Geneva, ILO, 2005), p. 31.
TMCPI-R-[2011-07-0159-1]-En.docx 87
and the conditions for having recourse to them; personnel welfare services, including
medical care, health, canteens, housing, leisure, savings and banking facilities, etc.; social
security or social assistance schemes in the enterprise; the regulations of national social
security schemes to which the workers are subject by virtue of their employment in the
enterprise; the general situation of the undertaking and prospects or plans for its future
development; the explanation of decisions that are likely to affect directly or indirectly the
situation of workers in the undertaking; and methods of consultation and discussion and of
cooperation between management and its representatives on the one hand and the workers
and their representatives on the other (Paragraph 15). Information provided to employees
should make express reference to any issues that are the subject of a collective labour
agreement concluded at a level beyond that of the enterprise.
147. Generally, all information about the company and planned rationalization is immediately
given to workers‟ representative organizations in the chemical industry. UBE Chemical
Europe stated that a wide range of the information given to workers was beyond the legal
requirements, and included company financial results, investments or any change in the
corporate structure. Sharing valuable information with workers would have positive
results, such as improved motivation. 13
KIPLAS stated that Turkish chemical firms
provided their workers with information on companies‟ competitiveness, general costs,
benchmarking with other competitors, their market positions, the workforce cost,
government trade policy and other factors affecting chemical businesses. Employees were
also given information on companies‟ recent and future developments. 14
BASF stated that
the subject matter for consultation depended on specific cases and legal requirements.
Generally, the subject matter included the situation, structure and probable development of
employment, work organization, contractual relations, conditions of work, training and
terms of potential severance packages. 15
Boehringer Ingelheim Austria reported that the
company held consultations with its employees on a variety of issues, because it believed
that if they were well informed, employees and their representative organizations would
show greater motivation for change. 16
Atanor stated that it was flexible in selecting the
subject matter and that in its experience the type of information it needed to provide
workers with varied from time to time and from site to site. 17
In Japan, disclosing a full
range of information to trade unions, including to some degree insider and confidential
information, made it easier for companies to move the entire processes of restructuring
forward, because they were able to win the trust and confidence of trade unions and
workers. Disclosing as much information as possible to trade unions allowed them and the
employees to assess the possible impact of restructuring on employment and conditions of
work. Full disclosure not only deepened workers‟ and trade unions‟ understanding of the
development of the business and possible impact on the employees, but also contributed to
strengthening the trust between the company and workers and trade unions in the long
term. It also enabled the parties to make realistic judgments. 18
Evonik Industries stated
that ample and quality information allowed workers‟ representative organizations to
13 Information provided to the ILO by UBE Chemical Europe SA.
14 Information provided to the ILO by KIPLAS.
15 Information provided to the ILO by BASF SE.
16 Information provided to the ILO by Boehringer Ingelheim Austria.
17 Information provided to the ILO by Atanor SAC.
18 Information provided to the ILO by Nippon Keidanren.
88 TMCPI-R-[2011-07-0159-1]-En.docx
formulate independent counter-proposals for the company. 19
Solvay Ibérica stated that
information on restructuring would also be given to contract and subcontract workers. 20
148. When are chemical workers first informed? The timing of initial consultation varied from
one company to another. At BASF, the timing of initial consultation and the frequency of
consultation depended upon the quality and the level of the impact on employees.
Generally, consultation with employees‟ representative organizations started before any
announcement of corporate structural change to employees and the general public. 21
Evonik Industries stated that the company organized initial consultations with workers‟
representative organizations before the company made a final business decision. 22
Solvay
Ibérica stated that the company would inform workers and their representative
organizations of reorganization plans at the same time, and then consultations would
normally take place with workers‟ representative organizations at the workplace. 23
Atanor
said that consultations with workers and their representative organizations were conducted
during and after the restructuring processes. 24
149. How does consultation take place and who is involved? Borealis stated that it consulted
with workers‟ representative organizations beyond the legal requirements. 25
KIPLAS
stated that in Turkey, top managers or executive boards of chemical companies wishing to
discuss restructuring would call workers‟ unions or their representatives at work at an
appropriate time. Consultation was usually organized on a voluntary basis, but it took place
whenever a national economic crisis or any sectoral problems arose. In the Turkish
chemical industry, all levels of employers and employees concerned were involved in
consultation. 26
Atanor stated that when it knew who would be affected, those workers also
participated in the consultation processes through their representative organizations. 27
BASF and Evonik Industries did not directly conduct individual consultations with
employees who might potentially be affected. 28
Solvay Ibérica said that direct consultation
with the workers affected was rare. 29
In Japan, many large chemical companies stated that
they made use of the existing framework of in-company labour–management consultation
structures. Consultation forums were conducted regularly, once a month, between the
company and trade unions in order to promote business information sharing. However,
during restructuring, companies took a more flexible approach and organized as many
consultations as was deemed necessary. One company stated that it did not limit their
19 Information provided to the ILO by Evonik Industries AG.
20 Information provided to the ILO by Solvay Ibérica SL.
21 Information provided to the ILO by BASF SE.
22 Information provided to the ILO by Evonik Industries AG.
23 Information provided to the ILO by Solvay Ibérica SL.
24 Information provided to the ILO by Atanor SAC.
25 Information provided to the ILO by Borealis AG.
26 Information provided to the ILO by KIPLAS.
27 Information provided to the ILO by Atanor SAC.
28 Information provided to the ILO by BASF SE and Evonik Industries AG.
29 Information provided to the ILO by Solvay Ibérica SL.
TMCPI-R-[2011-07-0159-1]-En.docx 89
number, but held consultation sessions whenever necessary. Some problems were
thoroughly discussed with trade unions until they were fully convinced of the need for the
planned change. One company stated that one particular topic took more than six months
to resolve and required over ten rounds of consultation. 30
150. Prior and thorough consultation in times of restructuring is common practice in the
chemical industry. The industry ensures the involvement of employees and their
representative organizations in consultation, sharing ample information on corporate
business and structural change, including sensitive information. By doing so, the industry
does more than abide by legal requirements and local procedures, because there is a long
tradition of partnership with open dialogue between employees and employers in the
chemical industry in many countries, and it is considered one of the factors of business
success. It should be noted, however, that prior consultation seldom takes place at small
chemical enterprises. Small trade unions are less likely to receive prior and thorough
consultation than large trade unions. They often do not know what restructuring will take
place in the chemical industry, because they do not participate in institutionalized social
dialogue forums at the central and state levels. In Brazil, major trade unions received prior
communication from firms concerning possible structural changes, technical changes and
other important issues. According to employers, this was to prevent any misunderstanding
with trade unions, which could call for industrial action and thereby cause losses to the
companies. 31
5.4. How to promote social dialogue
151. How can social dialogue be promoted at the workplace in times of restructuring? Three
major factors are crucial for well-functioning workers‟ representative organizations to have
sound social dialogue at the workplace.
152. First, information is imperative for a well-functioning workers‟ representative
organization. With respect to restructuring, workers‟ representative organizations must
receive information on the economic and financial situation of the establishment and on the
employment situation. This information should be provided in a timely and sufficiently
detailed manner. As previously discussed, about a quarter of workers‟ representative
organizations in the chemical industry in the European Union have not received useful
information concerning structural changes in their companies. This is also the case in all
industries and services. According to the European Company Survey 2009, which included
27,000 private and public establishments, including chemical and pharmaceutical
companies, about 85 per cent of employee representatives in Europe received information
at least annually on the economic, financial and employment situations of the
establishment, while 11 per cent never received such information (table 5.2). Some 66 per
cent received information at least several times a year. Meanwhile, one out of three
employee representatives received information on the employment situation on a monthly
basis. Table 5.3 shows that only 17 per cent of employee representatives are frequently
provided with confidential information.
30 Information provided to the ILO by Nippon Keidanren.
31 ILO: Restructuring and social dialogue in the chemical industry in Brazil, Sectoral Activities
Working Paper (Geneva, forthcoming).
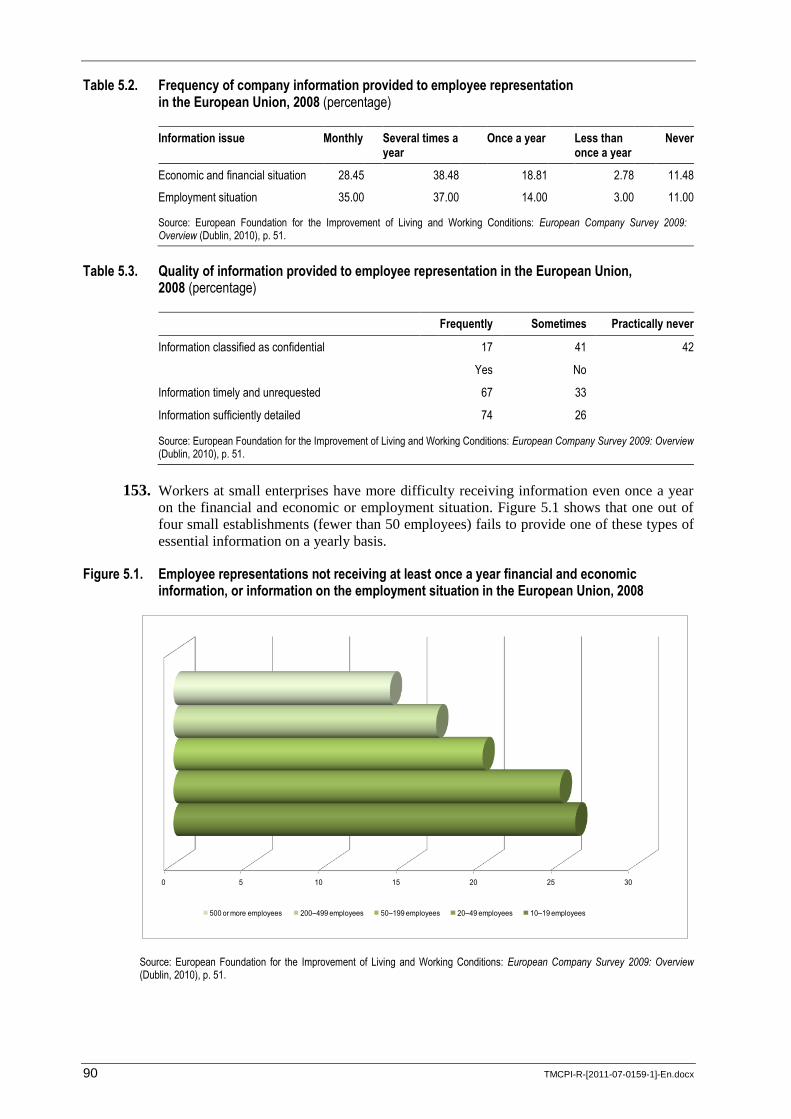
90 TMCPI-R-[2011-07-0159-1]-En.docx
Table 5.2. Frequency of company information provided to employee representation in the European Union, 2008 (percentage)
Information issue Monthly Several times a year
Once a year Less than once a year
Never
Economic and financial situation 28.45 38.48 18.81 2.78 11.48
Employment situation 35.00 37.00 14.00 3.00 11.00
Source: European Foundation for the Improvement of Living and Working Conditions: European Company Survey 2009: Overview (Dublin, 2010), p. 51.
Table 5.3. Quality of information provided to employee representation in the European Union, 2008 (percentage)
Frequently Sometimes Practically never
Information classified as confidential 17 41 42
Yes No
Information timely and unrequested 67 33
Information sufficiently detailed 74 26
Source: European Foundation for the Improvement of Living and Working Conditions: European Company Survey 2009: Overview (Dublin, 2010), p. 51.
153. Workers at small enterprises have more difficulty receiving information even once a year
on the financial and economic or employment situation. Figure 5.1 shows that one out of
four small establishments (fewer than 50 employees) fails to provide one of these types of
essential information on a yearly basis.
Figure 5.1. Employee representations not receiving at least once a year financial and economic information, or information on the employment situation in the European Union, 2008
Source: European Foundation for the Improvement of Living and Working Conditions: European Company Survey 2009: Overview (Dublin, 2010), p. 51.
0 5 10 15 20 25 30
500 or more employees 200–499 employees 50–199 employees 20–49 employees 10–19 employees
TMCPI-R-[2011-07-0159-1]-En.docx 91
154. Second, training and time resources need to be given to employee representatives.
Employees and their representatives need training to make sense of the business
information disclosed to them, and to understand the business decisions to which they are
required to contribute. Training for trade union leaders is also an important issue to direct
the future of their country and the industry. In Brazil, the social partners in the chemical
industry are involved in national development planning through social dialogue. In 2003,
the Economic and Social Development Council (CDES) was established in Brazil to advise
the President on the formulation of specific policies and guidelines, public policy
proposals, structural reforms, and economic and social development in the country. The
CDES expanded the role of tripartite social dialogue to include participation in decision-
making on matters of strategic national importance. The CDES comprises 17 ministers and
90 advisors, including employers, trade union leaders and civil society organization
leaders. Dialogue encourages information exchange and the exchange of ideas, and it helps
to outline differences and find trajectories to confront problems and barriers. Through
dialogue, the CDES seeks to build consensus among the different interest groups on the
issues and challenges facing the country. At the state and municipal levels, there are
seminars and social dialogue forums, in which industry, trade unions and academia
participate. Training for trade union leaders is important so that they can effectively
represent their interests at the national and state social dialogue forums. In 2009, for
example, ABC‟s Chemical Workers‟ Union, representing about 40,000 chemical workers
employed in about 900 companies in Brazil, decided to include in its training programmes
a training module on trade union action and participation in the public administration
advisory body in order to improve members‟ competence. 32
155. Third, social dialogue provides the social partners with space and flexibility in the rapidly
changing environment of the chemical industry. BASF stated that transparency, fairness,
mutual respect, confidentiality, creativity and anticipation were essential in social dialogue,
and creative solutions to issues between the social partners were always welcomed. 33
UBE
Chemical Europe echoed BASF‟s viewpoints that dialogue could maintain and improve
good relationships with workers and workers‟ representative organizations. The role of
dialogue was most important at difficult times. 34
Borealis stated that keeping workers‟
representative organizations informed could create confidence between the parties
concerned. 35
In addition to confidence, Solvay Ibérica pointed out that it was important to
respect people and that consultation should be identified with clear objectives. That would
ensure flexibility in finding amicable solutions that met the demands of both parties. 36
Evonik Industries emphasized the importance of involving the workers‟ representatives as
early as possible, in order to provide them with information and as a sign of respect. It was
important that the company heard their fears and criticism and provided answers. 37
156. In summary, in order to institutionalize constructive social dialogue at the workplace,
employee representatives and managers need to be positive about the climate for, and the
32 ILO: Restructuring and social dialogue in the chemical industry in Brazil, Sectoral Activities
Working Paper (Geneva, forthcoming).
33 Information provided to the ILO by BASF SE.
34 Information provided to the ILO by UBE Chemical Europe SA.
35 Information provided to the ILO by Borealis AG.
36 Information provided to the ILO by Solvay Ibérica SL.
37 Information provided to the ILO by Evonik Industries AG.
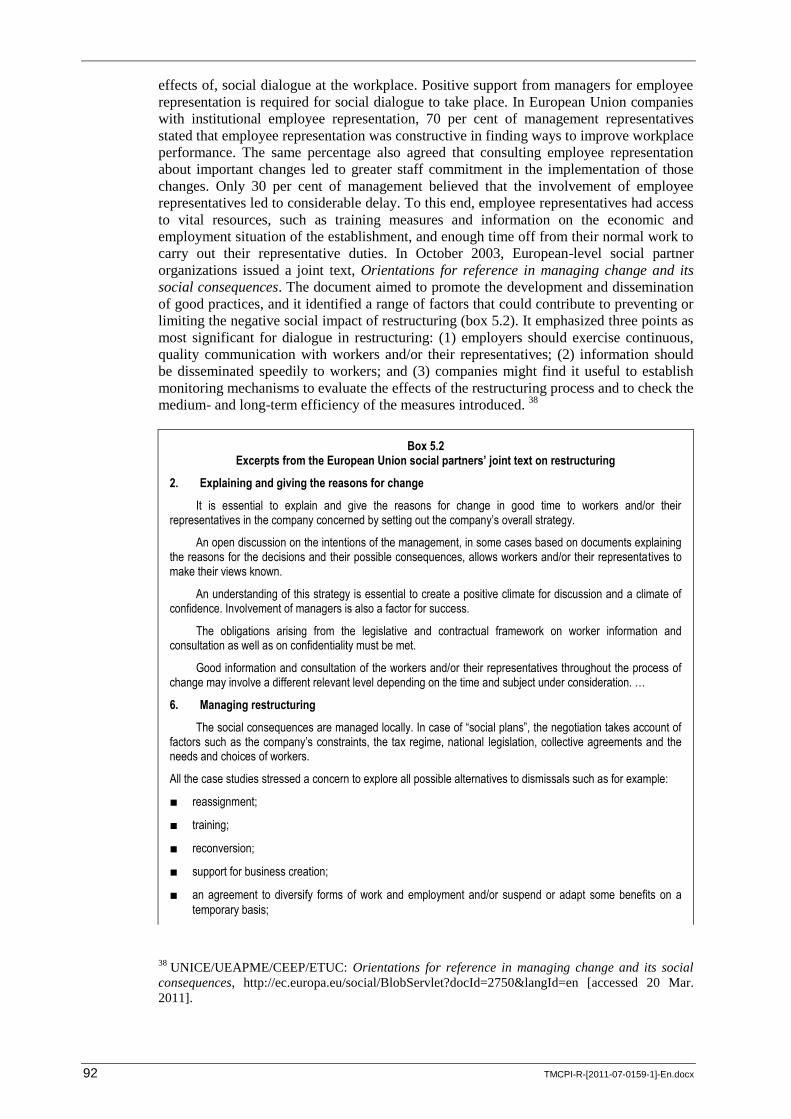
92 TMCPI-R-[2011-07-0159-1]-En.docx
effects of, social dialogue at the workplace. Positive support from managers for employee
representation is required for social dialogue to take place. In European Union companies
with institutional employee representation, 70 per cent of management representatives
stated that employee representation was constructive in finding ways to improve workplace
performance. The same percentage also agreed that consulting employee representation
about important changes led to greater staff commitment in the implementation of those
changes. Only 30 per cent of management believed that the involvement of employee
representatives led to considerable delay. To this end, employee representatives had access
to vital resources, such as training measures and information on the economic and
employment situation of the establishment, and enough time off from their normal work to
carry out their representative duties. In October 2003, European-level social partner
organizations issued a joint text, Orientations for reference in managing change and its
social consequences. The document aimed to promote the development and dissemination
of good practices, and it identified a range of factors that could contribute to preventing or
limiting the negative social impact of restructuring (box 5.2). It emphasized three points as
most significant for dialogue in restructuring: (1) employers should exercise continuous,
quality communication with workers and/or their representatives; (2) information should
be disseminated speedily to workers; and (3) companies might find it useful to establish
monitoring mechanisms to evaluate the effects of the restructuring process and to check the
medium- and long-term efficiency of the measures introduced. 38
Box 5.2
Excerpts from the European Union social partners’ joint text on restructuring
2. Explaining and giving the reasons for change
It is essential to explain and give the reasons for change in good time to workers and/or their representatives in the company concerned by setting out the company’s overall strategy.
An open discussion on the intentions of the management, in some cases based on documents explaining the reasons for the decisions and their possible consequences, allows workers and/or their representatives to make their views known.
An understanding of this strategy is essential to create a positive climate for discussion and a climate of confidence. Involvement of managers is also a factor for success.
The obligations arising from the legislative and contractual framework on worker information and consultation as well as on confidentiality must be met.
Good information and consultation of the workers and/or their representatives throughout the process of change may involve a different relevant level depending on the time and subject under consideration. …
6. Managing restructuring
The social consequences are managed locally. In case of “social plans”, the negotiation takes account of factors such as the company’s constraints, the tax regime, national legislation, collective agreements and the needs and choices of workers.
All the case studies stressed a concern to explore all possible alternatives to dismissals such as for example:
■ reassignment;
■ training;
■ reconversion;
■ support for business creation;
■ an agreement to diversify forms of work and employment and/or suspend or adapt some benefits on a
temporary basis;
38 UNICE/UEAPME/CEEP/ETUC: Orientations for reference in managing change and its social
consequences, http://ec.europa.eu/social/BlobServlet?docId=2750&langId=en [accessed 20 Mar.
2011].
TMCPI-R-[2011-07-0159-1]-En.docx 93
■ personalized worker support;
■ natural departures, notably through retirement or, as a last resort, early retirement.
Management of the social consequences of a restructuring operation is a complex process. Several levels of information, consultation or negotiation and several types of workers’ representation may co-exist in the companies and countries concerned.
For a good management of restructuring, time is an important factor, for management and workers alike. The difficulty is organizing quality information and consultation without creating undue delays and uncertainties. A positive attitude to change together with the existence of a climate of confidence between management and workers and/or their representatives are key factors. Beyond formal procedures, informal relations play an important complementary role in the search for solutions which meet the needs of the enterprise and workers.
Given that ongoing change is a characteristic of the lives of companies and workers, some of the case studies revealed that the policies implemented during a restructuring operation were based on lessons learnt from an earlier experience. In this context, it has proved useful to put in place monitoring mechanisms to evaluate the effects and check the efficiency of the solutions identified in the medium and long term.
Source: UNICE/UEAPME/CEEP/ETUC: Orientations for reference in managing change and its social consequences, http://ec.europa.eu/social/BlobServlet?docId=2750&langId=en [accessed 20 Mar. 2011].
5.5. Responses to globalization
157. As the chemical industry is a globalized business, social dialogue forums have expanded to
the regional and global levels. Under Council Directive 2001/86/EC, concerning worker
involvement in a European company (Societas Europaea (SE)), any arrangement for
transnational involvement, i.e. information and consultation, plus, in some circumstances,
board-level employee participation, must be negotiated for each SE between the company
or companies involved and a special negotiating body of employee representatives
(statutory fall-back provisions apply if no agreement is reached). Only once the employee
involvement agreements are resolved can the SE be registered. In 2007, BASF signed an
agreement with employee representatives from across Europe on employee involvement in
BASF SE, which came into effect in 2008. With regard to board-level employee
participation, the agreement provides that six of the 12 members of the BASF SE
supervisory board, which oversees the management board in a two-tier board structure, are
employee representatives. Five of the six employee representatives are works council
members and union officials from Germany, one of whom also represents the EMCEF,
while one is a works council member from Belgium. Transnational information and
consultation for employees will be through a new BASF EWC, made up of workforce
representatives from across Europe. Initially, there were 23 members from 12 countries in
Europe. The forum meets three times a year for information and consultation on company
plans and developments, with an EMCEF representative entitled to attend. It has, notably,
strong rights with regard to company decisions with consequences for employment, with
the agreement stating that such decisions will remain open until they have been subject to
in-depth and conclusive discussions with the employee representatives. The agreement also
allows the BASF EWC to hold meetings in individual countries to keep employees
informed at the national level. 39
158. Similar agreements were concluded at Aventis in 2001 and at Total in 2004. In the Aventis
agreement, the size of the Aventis supervisory board was increased from ten to 14 full
members, with the four new members nominated by French and German trade unions and
voted to the board by the company‟s shareholder assembly. These employee
representatives have the same rights and responsibilities as the other ten board members
39 “BASF agrees SE employment involvement arrangements”, in European Employment Review
(London, Industrial Relations Services), 12 Nov. 2007.
94 TMCPI-R-[2011-07-0159-1]-En.docx
representing shareholders. In addition, the French Works Council is entitled by national
law to nominate two representatives to attend supervisory board meetings. It was agreed
that the French Works Council would allow the EMCEF to have one of these two places as
a “guest”. In return for giving up a place, it would then have the right to representation on
Aventis‟s EWC, or on the European Dialogue Committee, which was set up in 2000 by
agreement between management, trade unions and employee representatives on the former
EWCs for the various divisions of Rhône-Poulenc and Hoechst. 40
159. At Total, an agreement on a “platform for employee relations” (plate-forme sociale) was
signed between Total and four European-level trade union organizations. The new
platform added to the provisions of the existing EWC agreement a statement that, in the
event of exceptional circumstances bringing about significant change in the group‟s
progress or structure, a meeting of the EWC liaison committee (an employee body) was to
be held in the eight days following the relevant meeting of the company‟s board.
Management would provide all information useful for examining the situation to the
committee. After the liaison committee had considered the matter, an extraordinary
meeting of the full EWC could be called, either by the committee or by a majority of EWC
members. This would not occur before the start of national-level consultations on the
restructuring in question; neither would it interfere with such consultation, provided that
the EWC was brought to the attention of workers‟ representatives involved in national-
level consultations. Group management would take into account the impact of
restructuring or closures on companies‟ “industrial environment” and provide technical
support in examining or implementing specific actions to assist in creating jobs in the
surrounding areas, such as help in setting up companies. The agreement stipulates that
workers‟ representatives are not obliged to accept all restructuring exercises,
reorganizations and closures, and that these remain the responsibility of group
management. The implementation of the agreement in group businesses would be
discussed twice a year at meetings of the EWC‟s liaison committee. Actions taken in all
the areas covered by the agreement would be assessed and debated, and the assessment
provided in a brief annual report, which would also be sent to the various group businesses.
If the parties identified difficulties in implementing the agreement in any group business,
they could request a specific meeting on the issue, to be organized by agreement with
group management. 41
160. In the emergence of globalization, union involvement in cross-border alliance is crucial.
The nature and intensity of participation in cross-border trade union alliances are shaped
by the union dynamic at the local, national and international levels. A combination of
greater workplace union resources and a strong supportive approach by the national union
can contribute to proactive solidarity strategies within international trade union
networks. 42
161. In recent years there has been an upsurge in efforts by trade unions to set up worldwide
councils and networks within multinationals, or to organize campaigns that involve the
40 “ECS-style European board-level participation agreed at Aventis”, in European Works Councils
Bulletin (London, Eclipse Publications Ltd), Issue 33, May–June 2001, p. 2.
41 “European „employee relations platform‟ agreed at Total”, in European Works Councils Bulletin
(London, Eclipse Publications Ltd), Issue 55, Jan.–Feb. 2005, pp. 4–5.
42 C. Lévesque and G. Murray: “Trade union cross-border alliances within MNCs: Disentangling
union dynamics at the local, national and international levels”, in Industrial Relations Journal
(Coventry, Warwick University Industrial Relations Research Unit), Vol. 41, No. 4, July 2010,
pp. 312–332.
TMCPI-R-[2011-07-0159-1]-En.docx 95
creation of ongoing links among national chemical unions in various countries. These are
unilateral initiatives by trade unions to promote dialogue between employers and
employees to resolve disputes arising between the parties concerned. ICEM‟s international
networks of chemical trade unions covering multinational enterprises are effective tools for
implementing cross-border social dialogue. They also help to build trade union
engagement with other unions internationally, which is vital to delivering international
solidarity action.
162. Five key factors are required to develop strong international networks of trade unions: how
networks are formed; company attitudes and influence; resources; the potential for
participation; and the spatial basis of membership.
163. In terms of how networks are formed, time and resources are needed for the educational
processes required. Company attitudes and influence are closely linked to the resources
issue; the network‟s degree of independence needs to be as great as possible, and therefore
more independent funding is needed. 43
One example of such a network can be seen at
BASF; in this network, there is no central dialogue, but rather a set of regional networks
established over a period of around ten years. This is a highly devolved structure, sustained
by a combination of external project funding from the Friedrich-Ebert-Stiftung (FES) and
company financing, and built on a regional basis with the involvement of ICEM. Regional
dialogue with management has been secured in Latin America and Asia. Coordinated
bargaining with each region has been achieved, albeit to varying extents. The right to
organize has also been won in practice, most notably in some Latin American workplaces.
Definite gains have been made. This example shows the importance of the degree of
commitment to the network‟s structures and power relations.
164. ICEM has developed numerous global, regional and corporate workers‟ networks. At the
global level, there is the World Conference for the Chemical Industries. At the regional
level, there are nine networks operating in the chemical and pharmaceutical industries,
including the Middle East and North African Chemical Unions‟ Network; the Asia-Pacific
Pharma Workers‟ Network; BASF‟s networks in Latin America and the Asia and Pacific
region; the Akzo Noble Latin American Network; the Solvay Latin American Network; the
Bayer Latin American Network; and two global company union networks operating among
the workers of Akzo Noble and Unilever. According to ICEM, the principal duties are the
exchange of information and experiences on collective labour agreements, wages, working
hours, shift work, bonus and lump-sum allowances, paid holidays, retirement schemes,
organizing strategies, occupational safety and health, and on a particular company‟s or
sector‟s information. Networks build cross-border union solidarity through joint action and
international solidarity campaigns. Implementing effective communication strategies is one
of the major functions. 44
The ICEM World Conference for the Chemical Industries, held
in Istanbul, Turkey, on 27–28 October 2010, decided the major points of a future action
plan, which include the creation of the Global Pharmaceutical Unions‟ Network in the
coming years. 45
43 R. Croucher and E. Cotton: Global unions, global business: Global Union federations and
international business (London, Middlesex University Press, 2009), pp. 69–79.
44 ICEM: ICEM World Conference for the Chemical Industries, Istanbul, Turkey, 27–28 October
2010, Conference report (Geneva, 2010), pp. 61–66.
45 ICEM: Major points of future action plan, ICEM World Conference for the Chemical Industries,
Istanbul, Turkey, 27–28 Oct. 2010, p. 2, http://www.icem.org/en/4-Chemicals-Pharmaceuticals
[accessed 20 Mar. 2011].
96 TMCPI-R-[2011-07-0159-1]-En.docx
5.6. Global framework agreements
165. Global framework agreements (GFAs) or international framework agreements (IFAs) that
are currently in effect and are reviewed regularly with company officials and trade unions
globally within the ICEM, include: Rhodia, EDF, Lukoil, SCA, RAG, Eni, AngloGold,
Norske Skog, Endesa, Freudenberg, Statoil, Lafarge, and Umicore. 46
It should be noted
that during global economic downturns, sectoral global social dialogue is a relevant and
useful instrument that can help bring solutions to the challenges faced by sectoral parties
operating within a global framework. In 2009, due to a dramatic dip in global demand and
a decline in production of about 30 per cent, Rhodia engaged in a process of restructuring
its global supply chain. ICEM used the GFA with Rhodia as a basis for raising the question
of compensation for workers made redundant when the Rhodia production plant in China
was threatened with permanent closure. Subsequently, local management agreed to use
measures of temporary layoffs and temporary closures instead of compulsory redundancies
and permanent closures, and to support workers with severance pay. 47
In line with the
GFA at Umicore, bipartite social dialogue has led to a resolution of conflicts between the
parties in South Africa concerning the structure of employment, recruitment processes, the
integration of plants in South Africa, and training and education. 48
166. In response to globalization, transnational company agreements (TCAs) have been
emerging as innovative dialogue initiatives. TCAs are labour-management agreements
signed by multinational companies, on the one hand (e.g. GFAs or IFAs), and European
and/or international federations of workers representing national unions by sector of
activity and/or multinational EWCs, on the other. The purpose of TCAs is to stimulate
global social dialogue on employment-related issues between the multinationals and the
representatives of workers. Most TCAs aim to promote compliance with ILO standards,
notably in the areas of freedom of association and collective bargaining. TCAs can
contribute to mitigating the impact of restructuring plans on employment, notably by:
avoiding compulsory redundancies; establishing accompanying measures, such as training
or outplacement assistance; designing management plans of change with a focus on
professional development and social dialogue; and establishing transnational intra-firm
mobility mechanisms to apply in the event of seasonal or more permanent unemployment.
Studies show that three factors seem to have facilitated the signing of innovative cross-
border restructuring agreements: (1) forward-looking human resources strategies that see
TCAs as tools for managing risk during the process of business expansion and
internationalization of the company‟s activities, and that give a central role to transnational
processes for labour-management relations (such as EWCs); (2) trade union coordination
resulting in specific mandates being given to global and European industry unions (or the
EWCs) to negotiate and sign cross-border-level agreements directly on behalf of the
enterprise‟s workers and their affiliated unions in countries where the multinationals
operate; and (3) joint communication to ensure stability and minimize the risk of conflict
during the crisis, especially in major operating sites located in countries with a tradition of
mobilization. The studies also suggest four key drivers for the successful implementation
of TCAs: (1) communication before, during and after the agreement, so as to ensure
workers‟ buy-in or ownership of the agreement; (2) effective, joint monitoring and follow-
up procedures (ideally linking the headquarters/global and local operations levels); (3) a
46 http://www.icem.org/en/69-Global-Framework-Agreements [accessed 20 Mar. 2011].
47 K. Papadakis: “Restructuring enterprises through social dialogue: Socially responsible practices in
times of crisis”, Working Paper No. 19 (Geneva, ILO, Dec. 2010), p. 13.
48 ICEM: “ICEM, IMF complete Umicore GFA mission to South African plants”, in ICEM InBrief,
31 Jan. 2011 (Geneva).
TMCPI-R-[2011-07-0159-1]-En.docx 97
forward-looking strategy of the company, which is often summed up in a management
belief in the capacity of its existing labour force to continue to be employable after the
crisis; a commitment to insourcing (rather than outsourcing) and investment in job-saving
measures (e.g. training, paid leave); and (4) access to income-support measures from
public funds available in locations where the company operates. 49
5.7. Corporate social responsibility
167. Corporate social responsibility (CSR) is becoming a central part of national labour policies
in national development. For example, in 2010, the Government of Germany adopted the
National Strategy for CSR – Action Plan for CSR. Its primary objective is to increase the
number of firms that recognize and use CSR to shape their business strategies in
accordance with the principle of sustainable development, because the Government
believes that socially and environmentally proactive business practices can provide
advantages to enterprises in the national and international arenas. The Action Plan consists
of five main areas of action: (1) to anchor CSR more firmly in enterprises and public
establishments; (2) to encourage even more small and medium-sized enterprises to practise
CSR; (3) to increase the visibility and credibility of CSR; (4) to optimize the political
framework for CSR; and (5) to make a contribution towards shaping the social and
environmental dimensions of globalization. 50
168. Workers who are affected by restructuring need to be consulted before the restructuring
programme takes place. In a number of recent high-profile cases, workforces learned about
their employers‟ restructuring plans only after they were broadcast in the media. The most
famous of these was the decision by the French car manufacturer Renault to close its
Belgian plant at Vilvoorde in February 1997, with significant job losses. The company did
not inform or consult employee representatives beforehand, even though it was obliged to
do so under Belgian and French law. What came to be known as the Renault Affair was
single-handedly responsible for a subsequent overhaul of Belgian law concerning
workforce rights in a collective redundancy situation, and also gave impetus to the debate
in Europe on issues of socially responsible enterprise restructuring and CSR. 51
Another
example showing the benefits of this law occurred at BASF in Feluy, Belgium. In June
2005, BASF announced the shutdown of its main production lines at its Feluy site. The
restructuring was expected to result in the loss of 203 of a total of 306 jobs and to slash
production capacity at the site by 75–80 per cent. The Renault Act required BASF
management in Feluy to engage in consultation with trade unions in order to discuss social
plans within the framework of restructuring. 52
In 2001, the European Commission
published a statement highlighting a package of measures that it was pursuing with a view
to reducing the social impact of large-scale job cuts. In it, the Commission set out good
company practice reflecting corporate social responsibility in respect of restructuring
(box 5.3).
49 ICEM: “ICEM, IMF complete Umicore GFA mission to South African plants”, in ICEM InBrief,
31 Jan. 2011 (Geneva).
50 Government of Germany, Ministry of Labour and Social Affairs: Draft National Strategy for
Corporate Social Responsibility: Action Plan for CSR, as at 22 Sep. 2010.
51 “Socially responsible enterprise restructuring in Europe: Part one”, in European Industrial
Relations Review (London, Eclipse Publications Ltd), Feb. 2004, pp. 13–26.
52 European Industrial Relations Observatory on-line (Eironline): BASF in Feluy to undergo
restructuring (Dublin), 11 Aug. 2005.
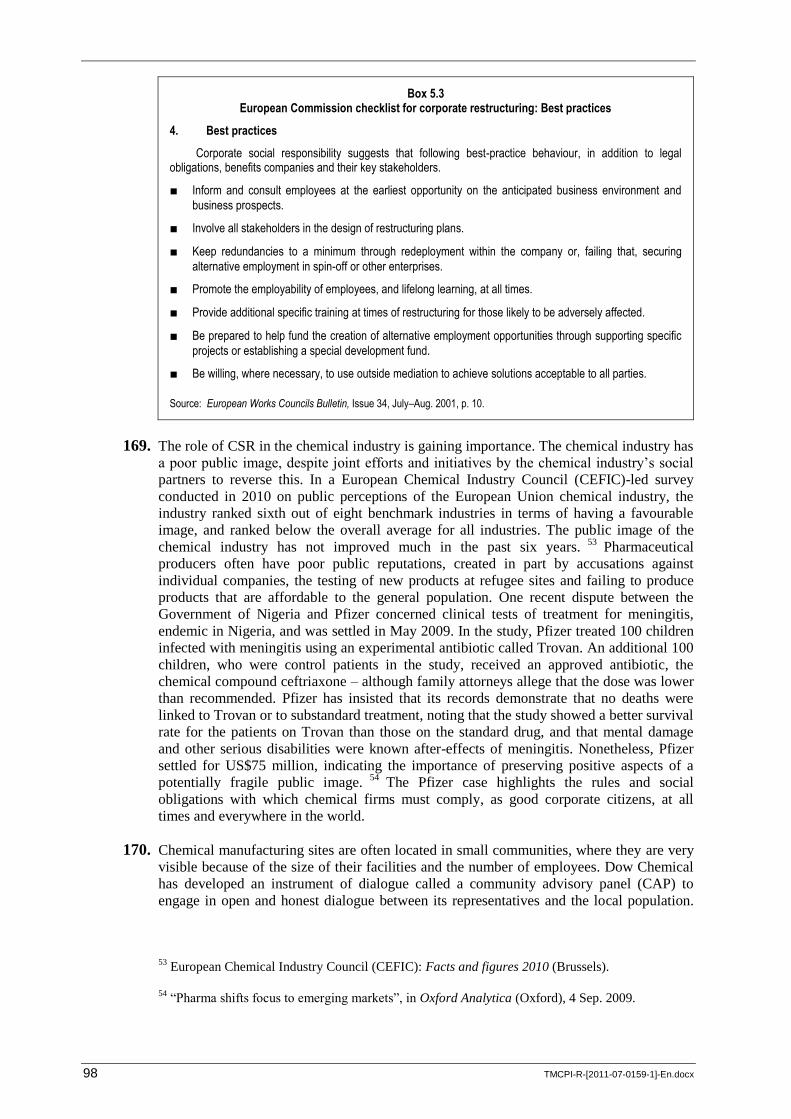
98 TMCPI-R-[2011-07-0159-1]-En.docx
Box 5.3
European Commission checklist for corporate restructuring: Best practices
4. Best practices
Corporate social responsibility suggests that following best-practice behaviour, in addition to legal obligations, benefits companies and their key stakeholders.
■ Inform and consult employees at the earliest opportunity on the anticipated business environment and
business prospects.
■ Involve all stakeholders in the design of restructuring plans.
■ Keep redundancies to a minimum through redeployment within the company or, failing that, securing
alternative employment in spin-off or other enterprises.
■ Promote the employability of employees, and lifelong learning, at all times.
■ Provide additional specific training at times of restructuring for those likely to be adversely affected.
■ Be prepared to help fund the creation of alternative employment opportunities through supporting specific
projects or establishing a special development fund.
■ Be willing, where necessary, to use outside mediation to achieve solutions acceptable to all parties.
Source: European Works Councils Bulletin, Issue 34, July–Aug. 2001, p. 10.
169. The role of CSR in the chemical industry is gaining importance. The chemical industry has
a poor public image, despite joint efforts and initiatives by the chemical industry‟s social
partners to reverse this. In a European Chemical Industry Council (CEFIC)-led survey
conducted in 2010 on public perceptions of the European Union chemical industry, the
industry ranked sixth out of eight benchmark industries in terms of having a favourable
image, and ranked below the overall average for all industries. The public image of the
chemical industry has not improved much in the past six years. 53
Pharmaceutical
producers often have poor public reputations, created in part by accusations against
individual companies, the testing of new products at refugee sites and failing to produce
products that are affordable to the general population. One recent dispute between the
Government of Nigeria and Pfizer concerned clinical tests of treatment for meningitis,
endemic in Nigeria, and was settled in May 2009. In the study, Pfizer treated 100 children
infected with meningitis using an experimental antibiotic called Trovan. An additional 100
children, who were control patients in the study, received an approved antibiotic, the
chemical compound ceftriaxone – although family attorneys allege that the dose was lower
than recommended. Pfizer has insisted that its records demonstrate that no deaths were
linked to Trovan or to substandard treatment, noting that the study showed a better survival
rate for the patients on Trovan than those on the standard drug, and that mental damage
and other serious disabilities were known after-effects of meningitis. Nonetheless, Pfizer
settled for US$75 million, indicating the importance of preserving positive aspects of a
potentially fragile public image. 54
The Pfizer case highlights the rules and social
obligations with which chemical firms must comply, as good corporate citizens, at all
times and everywhere in the world.
170. Chemical manufacturing sites are often located in small communities, where they are very
visible because of the size of their facilities and the number of employees. Dow Chemical
has developed an instrument of dialogue called a community advisory panel (CAP) to
engage in open and honest dialogue between its representatives and the local population.
53 European Chemical Industry Council (CEFIC): Facts and figures 2010 (Brussels).
54 “Pharma shifts focus to emerging markets”, in Oxford Analytica (Oxford), 4 Sep. 2009.
TMCPI-R-[2011-07-0159-1]-En.docx 99
CAPs are set up at Dow sites on account of the strategic importance of the firm‟s business
in the surrounding communities. Since 2004, Dow has set up 36 CAPs throughout the
world. CAPs normally consist of 15–20 people. They include three Dow representatives –
the site leader (the person with overall authority at the site), the public affairs leader, and
the environmental, health and safety leader. When choosing community members, Dow
identifies the stakeholder groups that are essential to its operations. Community members
may include teachers, students, clergy, business owners, environmentalists, government
employees, directors of charities, trade union leaders and retirees. Community members
are not paid by the company. Dow has established a number of ways of integrating panel
feedback into its thinking. Typically, after a panel meeting, the three Dow representatives
will meet informally and discuss what they have heard at the CAP. With wide latitude at
the local level, they are in a good position to pursue the ideas that were discussed. For
example, if Dow is to make an impending announcement about job reductions or
expansion, it will have already completed quite a bit of communications work – a news
release, a press kit and so on. The CAPs would be able to review the material in advance
and let the company know whether the message had come across as intended. The
company feels a very strong obligation to inform CAP members of what happens, because
the CAP represents a wide range of stakeholders in the community in which Dow
Chemical operates. 55
55 J. Ring: “Connecting with communities at Dow Chemical”, in Corporate Responsibility
Management (Chicago, IL, Melcrum Publishing), Vol. 1, Issue 2, Oct.–Nov. 2004, pp. 26–29.
100 TMCPI-R-[2011-07-0159-1]-En.docx
6. Summary and suggested points for discussion
6.1. Summary
171. Chemical firms restructure in order to increase their competitive advantage. Between 1987
and the third quarter of 2009, a total of 2,203 M&A, worth more than US$1.6 trillion, have
taken place in the chemical and pharmaceutical industries. In the past, M&A took place
mainly in Europe; in recent years, however, the number of M&A in North America and the
rest of the world has risen significantly. Cross-border M&A are now seen everywhere,
from Europe to North and Latin America and Asia.
172. The consequences of M&A are most noticeable in employment.
173. First, there are job losses throughout the global chemical industry. According to UNIDO,
global employment in the chemical industry (including the pharmaceutical sector and the
rubber and plastic products sector) exceeded 13 million in 2000, but this gradually
declined to around 11.5 million in 2006 – a loss of more than 1.5 million jobs. The real
global employment figure may be much greater than this. Because UNIDO statistics are
fragmented, the ILO estimates that up to 20 million people work in the global chemical,
pharmaceutical, and rubber and tyre industries today.
174. Second, global employment is concentrated in fewer countries, with fewer chemical-
producing countries containing the majority of the chemical workforce. These countries
include the 27 Member States of the European Union, Brazil, China, India, Japan, Mexico,
Republic of Korea, Russian Federation and United States. These countries account for
nearly 60 per cent of total employment in the chemical industry.
175. Employment in the chemical industry in Asian countries shows rapid growth, particularly
in China and India. At the end of 2008, total employment in China‟s chemical industry
exceeded 4.5 million people. Around half of the chemical workforce is employed in the
manufacturing of chemical raw materials and chemical products sector, and nearly
1 million people are employed in the next largest sector, the pharmaceutical sector. India‟s
chemical industry suffered a recession in the early 2000s. Between 2002 and 2003, nearly
180,000 jobs were lost; however, between 2005 and 2008, at least 293,000 jobs were
created. At the end of 2008, employment in India‟s chemical industry had reached nearly
2.2 million.
176. Third, jobs in small chemical enterprises are more likely to be vulnerable to restructuring
than those in medium-sized and large enterprises. For example, between 1993 and 2009,
the Japanese chemical industry lost nearly 80,000 jobs. Most of these job losses hit small
firms. Around 51,000 jobs were lost at enterprises with fewer than 29 employees. By
contrast, medium-sized enterprises with between 30 and 500 employees gained around
113,000 jobs. In the European countries, between 2007 and 2008, small and medium-sized
chemical firms with fewer than 250 employees lost over 8,000 jobs.
177. Long working hours appear to be the norm in the chemical industry. Weekly actual
working hours by occupation in the industrial chemical sector show that in 2008 chemical
workers worked more than 40 hours a week. On average, chemical technicians worked
40.56 hours a week; chemical engineers, 41.47 hours a week; supervisors or general
foremen, 41.50 hours a week; labourers, 42.31 hours a week. Production workers worked
the longest in the industry at 42.32 hours. In some countries, chemical production workers
exceeded 50 hours a week, with men being more likely to work longer hours than women.
TMCPI-R-[2011-07-0159-1]-En.docx 101
Weekly working time has been reduced in many countries over the past decade; however,
in some countries long weekly working time is still a practice.
178. Longer working hours in the chemical industry may be linked to high pay. In many ILO
member States, pay levels in the chemical industry have been increasing in the past ten
years, at a time when most restructuring has occurred. In advanced economies, annual
wage increases seem to be greater than the national average wage increases. While
acquisitions spontaneously push up pay levels, these then gradually decline a few years
after completion of the acquisition. Furthermore, there are considerable wage gaps. First,
there is a wide wage gap according to gender; on average, women earn between about
95 per cent and 66 per cent less than men earn. Second, chemical workers in emerging
economies earn much less than many other workers employed in other industries and
service sectors. Their wages are sometimes less than the national average wage. Third,
where negotiation is decentralized, the wage gap by area/region is likely to be greater in
the chemical industry in a given country.
179. The global economic crisis had a negative impact on employment in the chemical industry;
however, this impact was not uniform among ILO member States. Significant job losses
occurred in Western Europe and the United States in particular. Employment in the
chemical industry in the 27 Member States of the European Union showed a slight increase
from around 3 million in 2005 to around 3.1 million in 2007. The crisis resulted in a
decrease in employment to 2.8 million in 2008. However, in 2009, employment recovered,
reaching 3 million, and by the first quarter of 2010 was once again at around 3.1 million.
By contrast, employment in the chemical industry in the United States shows a constant
decline in recent decades. The crisis resulted in further deterioration in employment in the
United States chemical sector; between 2008 and 2009, nearly 70,000 jobs were lost,
accounting for around 5.1 per cent of the total workforce in the United States chemical
industry. The most severely affected sectors were the plastic products manufacturing sector
and the rubber products sector, and the most affected occupations were production-related
rather than administration, including those in construction and extraction; installation,
management and repair; production; and transportation and material moving. It should be
noted that during the crisis some countries saw an increase in employment in the chemical
industry. Between 2007 and 2008, more than 22,000 jobs were created in Central and
Eastern European countries. Japan created more than 65,000 jobs during the crisis.
180. The shortage of skilled workers has been a challenge for the chemical industry in recent
years. Skilled craft workers are scarce because there are significantly fewer of them today
than in the past, and because the chemical industry is competing with other industries for
their services. Firms offer more than just good wages to young talented workers, they also
offer attractive recruitment packages, and they try to change managerial perceptions and
attitudes towards the needs of young skilled workers. Chemical firms are also taking
positive action to train workers, using their own resources. One of the measures to attract
young skilled workers is to implement people-centred workplace policies or work–life
balance policies.
181. The shortage of scientists has become acute, owing to increasing demands from expanding
R&D activities on a global scale, and competition to employ these workers has intensified.
This has prompted scientists to migrate among countries in developed economies, as well
as to migrate between developed and developing economies.
182. Firms are also taking positive action to increase the number of women working in the
industry. However, the percentage of women in the industry remains low and therefore the
number of women executives in chemical firms is still limited. Chemical firms have far
fewer women executives than the average in the Fortune 500 manufacturing sector firms.
On the one hand, talented women workers are struggling to pursue careers in the chemical
102 TMCPI-R-[2011-07-0159-1]-En.docx
industry, and, on the other, there is a significant shortage of skilled workers in the technical
and production segments in the industry.
183. The global economic crisis motivated the chemical industry to take a proactive approach to
creating opportunities for the future. The social partners in the chemical industry have been
promoting training, retraining and lifelong learning, in order to increase employability in
line with the Global Jobs Pact. The chemical industry responded swiftly to the crisis by
promoting future-oriented policies; where layoffs and short-time work become necessary,
every effort should be made to improve workers‟ skills through training and education, and
this training should be accredited to ensure that intrinsic skills are maintained and the
industry can retain competent people.
184. Not all restructuring bears fruit. According to one study, around half of recent M&A are
held to have destroyed rather than created value. Excessive downsizing of labour in the
course of restructuring can harm a company‟s growth. Poorly organized restructuring runs
the risk of decreasing workers‟ loyalty and motivation, which might encourage talented
workers to move to other jobs. Successful restructuring requires that the different corporate
cultures are appropriately merged prior to the acquisition taking place. Social dialogue
plays a critical role in developing trust between the companies involved, leading to
successful integration.
185. Social dialogue is defined by the ILO to include all types of negotiation, consultation or
simply exchange of information between, or among, representatives of governments,
employers and workers, on issues of common interest relating to economic and social
policy. It can exist as a tripartite process, with the government as an official party to the
dialogue, or it may consist of bipartite relations only between labour and management (or
trade unions and employers‟ organizations), with or without indirect government
involvement. Social dialogue processes can be informal or institutionalized, and are often a
combination of the two. Social dialogue can take place at the national, regional or
enterprise levels. It can be inter-professional, sectoral or a combination of these. The main
goal of social dialogue itself is to promote consensus building and democratic involvement
among the main stakeholders in the world of work. Successful social dialogue structures
and processes have the potential to resolve important economic and social issues,
encourage good governance, advance social and industrial peace and stability, and boost
economic progress.
186. Restructuring not only affects employment and conditions of work in the chemical
industry, it also increases the role of social dialogue. Social dialogue can generate a higher
return to shareholders. Those companies that have the most effective social dialogue with
their employees provide a higher return to shareholders than those with poorly managed
employee communication. The chemical industry has expanded the role of social dialogue,
redefining it as a practical instrument contributing to social justice, and many chemical
firms have institutionalized formal dialogue processes to provide feedback. Social dialogue
can also benefit the industry by identifying future directions and needs for the industry to
grow sustainably. The global economic crisis has tested social dialogue and, as a result,
additional important roles for social dialogue as an instrument for finding solutions in
difficult times have been formulated.
187. As a last resort, chemical firms sometimes have to make the difficult decision to lay off
employees, for valid economic reasons. Chemical firms need to ensure that this process is
carried out fairly, and social dialogue can be the means to do so. It provides the parties
concerned with a programmatic solution so that the individual workers‟ needs and their
particular circumstances are taken into account.
188. During restructuring, and any other contingency that might impact on workers, prior and
continuous consultation between the parties concerned is the norm in the chemical
TMCPI-R-[2011-07-0159-1]-En.docx 103
industry, which subscribes to the principle that open and transparent dialogue is a factor in
business success. A wide range of useful information concerning corporate financing and
business information, including confidential and privileged information, is normally shared
with workers and their representative organizations, and this allows them to make
independent decisions and present proposals to employers, thereby contributing to the
increased implementation of mutual agreements. When management operates transparently
and fairly, the results can be productive. Corporate social responsibility also requires
chemical firms to behave as responsible corporate citizens and to respect best-practice
performance and activities through a wide range of measures in order not to affect
adversely their workers and society at large.
189. Among the various approaches to social dialogue, collective labour agreements are
important in restructuring in that they help to initiate negotiation between the parties.
Collective bargaining helps the parties to reach an equitable agreement. When a
contingency problem affecting the workers and company financial matters arises,
collective labour agreements can mandate the company to inform the trade union of any
related plans and their implications for conditions of work. However, collective bargaining
does more than just trigger dialogue; sectoral bargaining in the European chemical industry
has demonstrated the possibility of adapting collective labour agreements to a changing
environment and meeting company demands for flexibility while accommodating workers‟
needs in a practical fashion. However, it may be true that widespread flexibility in sectoral
collective bargaining has led to an increase in the decentralization of collective bargaining,
shifting a large part of bargaining responsibilities to the company level.
190. Outsourcing and contract labour are often at the centre of controversy in the chemical
industry. Excessive outsourcing is placing more pressure on core workers (regular
employees) to be more flexible, and what was once considered stable employment with
better working conditions is becoming less so. According to a study at the European
Union, in recent years in particular, many new forms of work flexibility are emerging in
connection with outsourcing and contract labour. New forms of work, called “very
atypical” forms of work, with much more unstable and shorter terms of employment, are
replacing atypical forms of work. The type of workers engaged in very atypical forms of
work tend to be extremely varied, ranging from very low-skilled workers on seasonal
contracts to highly skilled professionals on short, task-focused contracts. These workers
often face challenges: they have less job security, lack a fixed career plan, have fewer
training and career development opportunities, and find it harder to reconcile working and
work–life balance. Collective bargaining can also offer a solution to outsourcing. Cases
show that collective labour agreements can regulate the use of contract workers. They can
also request employers to implement consultation prior to the introduction of outsourcing
in order to ensure that important human assets to firms will be protected in such a way that
fundamental workers‟ rights are ensured.
191. Because globalization of the chemical industry is advanced, global social dialogue forums
can better fit the chemical industry than other industry and service sectors. GFAs or IFAs
enable workers and workers‟ representative organizations to discuss not only corporate
structural change but also a range of business and employment issues at the transnational
level of the chemical firm concerned. GFAs can promote a system of information,
consultation and dialogue at the various sites and plants operating in different countries
within a multinational chemical firm. To meet the trade unions‟ own needs in light of
growing cross-border M&A and transnational restructuring, ICEM has established a
number of global and regional chemical company networks in order to exchange
information on companies‟ undesirable behaviours and to help companies in the spirit of
international solidarity. Some reseachers observe that TCAs are emerging. TCAs are
labour-management agreements signed by multinational companies and European and/or
international federations of workers representing national unions by sector of activity
104 TMCPI-R-[2011-07-0159-1]-En.docx
and/or the EWCs of the multinationals. These TCAs can encourage the multinationals to
comply with ILO standards. TCAs can also mitigate the adverse impacts of restructuring.
192. There are four important factors for promoting social dialogue in restructuring. First,
employers should exercise continuous, quality communication with workers and their
representative organizations. Second, comprehensive information must be disseminated
quickly to workers and their representative organizations in an open and transparent
manner, followed by consultation in good faith. Third, it can be useful for companies and
workers, as well as for their representative organizations, to establish monitoring
mechanisms to evaluate the effects of the restructuring process and to check the medium-
and long-term efficiency of the measures introduced. Fourth, successful social dialogue
depends on the social partners‟ capacities, particularly those of workers‟ representative
organizations. Therefore, promoting social dialogue in the chemical industry provides
workers and their representative organizations with adequate training and time resources,
enabling them to upgrade their capacity to function as an equal partner with employers.
Special attention must be given to workers and their representative organizations at small
firms.
TMCPI-R-[2011-07-0159-1]-En.docx 105
Suggested points for discussion
(1) Which changes to employment, in both qualitative and quantitative terms, have
occurred as a result of restructuring in the chemical and pharmaceutical industries?
(2) How is the Global Jobs Pact being implemented in the chemical and pharmaceutical
industries?
(3) Which skills and qualifications, and which vocational training and education
programmes, are conducive to sustainable development in the chemical and
pharmaceutical industries?
(4) How could the chemical and pharmaceutical industries be made more attractive to
young workers and to women, and how could they provide better opportunities for
long-term career development?
(5) Which challenges are posed and which opportunities are afforded by contract and
agency labour in the chemical and pharmaceutical industries?
(6) Which are the best social dialogue practices to promote an atmosphere conducive to
better industrial relations during restructuring in the chemical and pharmaceutical
industries?
(7) How can social dialogue improve the sustainability of small and medium-sized
enterprises, helping to promote decent work in the chemical and pharmaceutical
industries?
(8) Which activities should the ILO take to promote social dialogue and good employer–
employee relations in the chemical and pharmaceutical industries?