Restructuring DMS Performance Measures Changing … · Restructuring DMS Performance Measures....
25
Restructuring DMS Performance Measures Changing the Definition of Performance August 14, 2017 L EAD ∙ T RANSFORM ∙ D ELIVER
Transcript of Restructuring DMS Performance Measures Changing … · Restructuring DMS Performance Measures....
Restructuring DMS Performance Measures
Changing the Definition of Performance
August 14, 2017L E A D ∙ TR A N S F O R M ∙ D E L I V E R

L E A D ∙ T R A N S F O R M ∙ D E L I V E RPage 2
Performance Measures and the PMA
Introduction:
• As Debt Management Services (DMS) moves forward as an organization it is imperative that it shares a common understanding of how it can most effectively use Performance Measures.
• Currently, DMS utilizes the Performance Measures Application (PMA) as its only source for reporting and tracking its performance measures.
• The purpose of the PMA is to be the Bureau of Fiscal Service’s internal reporting system.
• The PMA is utilized by all Assistant Commissioner areas.
• The PMA organizes performance measures according to Tier level.
• DMS has to adhere to a set structure for the PMA. However, by developing “In-House” performance measures to be reported in the DMS Tactical Plan and future performance measure dashboards, there is an opportunity to enhance the way we understand our business.

L E A D ∙ T R A N S F O R M ∙ D E L I V E RPage 3
Existing DMS Performance Reports
• Many different kinds of performance reports exist. Some metrics mentioned during interview include:– Timeliness of Phone Calls,– Collections Made by Each Tool,– Agency Compliance with the 120 Day Referral Rate– Total Collections
• Multiple metrics are provided in individual reports. Most performance reports are highly focused on a single business line and address operational concerns.
L E A D ∙ T R A N S F O R M ∙ D E L I V E RPage 4
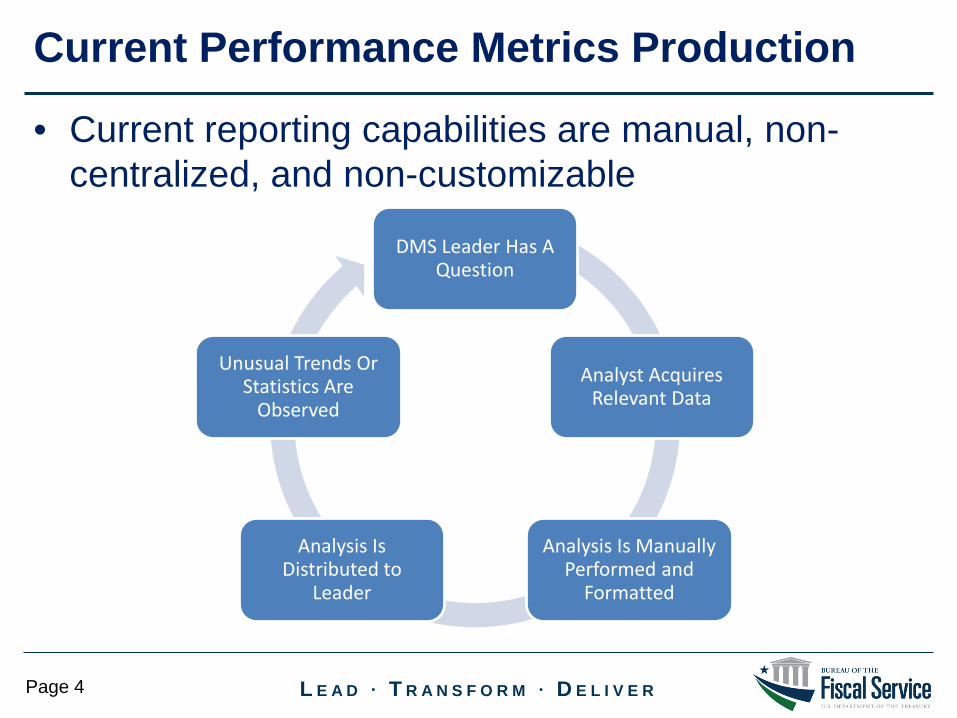
Current Performance Metrics Production
• Current reporting capabilities are manual, non-centralized, and non-customizable
DMS Leader Has A Question
Analyst Acquires Relevant Data
Analysis Is Manually Performed and
Formatted
Analysis Is Distributed to
Leader
Unusual Trends Or Statistics Are
Observed
L E A D ∙ T R A N S F O R M ∙ D E L I V E RPage 5
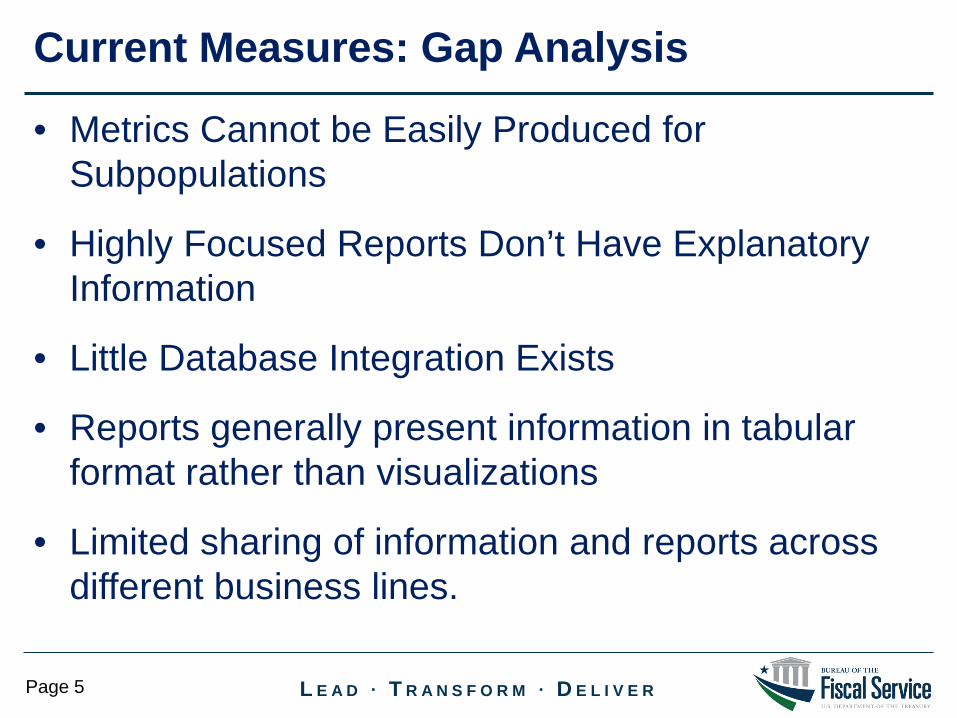
Current Measures: Gap Analysis
• Metrics Cannot be Easily Produced for Subpopulations
• Highly Focused Reports Don’t Have Explanatory Information
• Little Database Integration Exists
• Reports generally present information in tabular format rather than visualizations
• Limited sharing of information and reports across different business lines.

L E A D ∙ T R A N S F O R M ∙ D E L I V E RPage 6
New Measurement: Benefits
• Increased transparency– When tracked on a periodic basis, measures can alert DMS to shifts in performance
before they become serious problems
• Make measures actionable– Tying measures to activities allows DMS to adjust the ‘levers’ to increase performance
when measures dip
• Employee engagement and growth– Demonstrating to employees how their efforts contribute organizational success, on a
regular basis, will increase job satisfaction
• Increased accountability– Better measures mean better goals and progress tracking

L E A D ∙ T R A N S F O R M ∙ D E L I V E RPage 7
New Measurement: Categories
Category What it measures How to use it ExamplesPerformance Measure
Effectiveness and Efficiency
Immediately respond to shifts by adjusting operation being measured
Cross Servicing Collection Rate
Key Performance Indicator
Results and Outputs Track progress over time and research root causes
TOP Collections
Critical Success Factor
Qualitative Accomplishments and Goals
Tracking progress towards larger, long term organizational goals
Overall Employee Satisfaction Rate

L E A D ∙ T R A N S F O R M ∙ D E L I V E RPage 8
Changing the Definition of PerformanceExample: Goal 4 - Increase Collection and/or Resolution of Delinquent Debt
• Current Measure: Percent increase in dollars collected from last fiscal year– Highly dependent upon referral volume, which is largely out of our control– Possibility for collections to decrease due to no fault of DMS
• New Measure: Cross Servicing Recovery and Resolution Rate– Of debt that has been referred to us, how much were we able to collect and
resolve?– Dependent on DMS activities, not referral volume– Still impacted by macro-economic factors, but to a lesser degree
L E A D ∙ T R A N S F O R M ∙ D E L I V E RPage 9
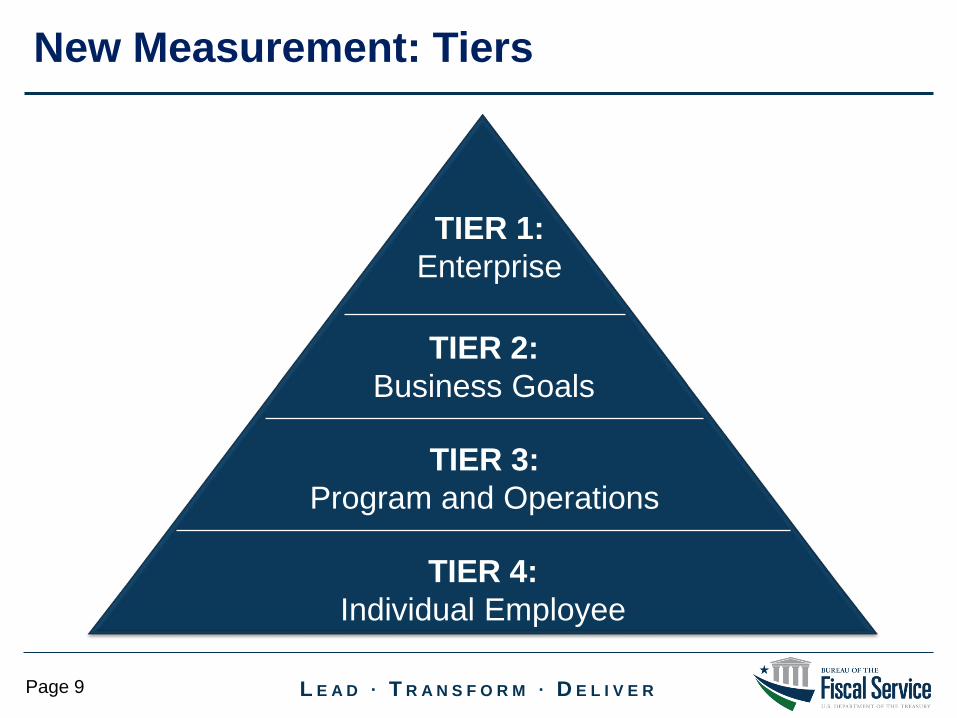
New Measurement: Tiers
TIER 1:Enterprise
TIER 2:Business Goals
TIER 3:Program and Operations
TIER 4:Individual Employee

L E A D ∙ T R A N S F O R M ∙ D E L I V E RPage 10
New Measurement: Tiers, cont.
Tier 1: Measures are enterprise level and typically support the strategic goals, strategic objectives, and annual budget.
Tier 2: Measures are high-priority measures for Fiscal Service and business areas that typically align to tactical priorities and tactical activities, specifically the DMS Business Goals.
Tier 3: Measures are at the program level and can be utilized for tracking operational performance. While individual Tier 3 measures do not get reported up to Treasury they are of great value.
Tier 4: Measures are at the employee level and can be used by individuals to track their personal performance in relation to their performance plans and how their work contributes to DMS’s goals.

L E A D ∙ T R A N S F O R M ∙ D E L I V E RPage 11
Tier 1: New Proposed MeasureDebt Recovery Rate
Description and PurposePerformance Measure: Total debt collected and administratively resolved via TOP and Cross Servicing out of the total amount of debt referred in a given time period.
Purpose: Focus on recovering the debts referred.
Owner and FrequencyWho Will Report: Analytics
Reporting Frequency: Annually
Methodology and ExampleMethodology: Sum of Cross Servicing and TOP Collections divided by the sum of Cross Servicing and TOP referrals from specific time frames.
Example: FY 2015 CS Referrals: $20 millionFY 2015 – FY 2017 Corresponding
CS Collections: $3.5 million
CS Debt Recovery Rate: 17.5 percent

L E A D ∙ T R A N S F O R M ∙ D E L I V E RPage 12
Tier 1: Existing MeasureAmount of Delinquent Debt Collected through all Tools
Description and PurposeKPI: Total debt collected via TOP and Cross Servicing.
Purpose: Encouraging business activities that increase collections.
Owner and FrequencyWho Will Report: Analytics
Reporting Frequency: Annually
Methodology and ExampleMethodology: Sum of Cross Servicing and TOP CollectionsExample: FY 2016: $7.4 billion

L E A D ∙ T R A N S F O R M ∙ D E L I V E RPage 13
Tier 2, Goal: Cultivating the WorkforcePercent of Required Skillsets Filled
Description and PurposePerformance Measure: Of the total required skillsets DMSrequires to accomplish its objectives, what percent are filled.
Purpose: Assist managers in identifying specific skill areas that are lacking and diverse ways to fill them, be it training, scheduling, or staff realignment .
Owner and FrequencyWho Will Report: Each Division
Reporting Frequency: Annually
Methodology and ExampleMethodology: Standardized survey, created by analytics and informed by management input, would be sent to all managing parties. The survey would ask questions related to technical, administrative, and soft skills, with the results presented in theTactical Plan.
Example Survey Questions: • Which skillsets are required to successfully achieve the mission of your branch/division?
• Which skillsets are currently filled/missing?
• Are these skillsets needed for standard work or a temporary project?
• Can the missing skillsets be filled by training existing staff?

L E A D ∙ T R A N S F O R M ∙ D E L I V E RPage 14
Tier 2, Goal: Cultivating the Workforce
Overall Employee Satisfaction Rate
Description and PurposeCritical Success Factor: Percent of employees responding to the Employee Viewpoint Survey stating they are satisfied with their job.
Purpose: Provides valuable feedback on the employee experience at DMS
Owner and FrequencyWho Will Report: Business Planning(?)
Reporting Frequency: Annually
Methodology and ExampleMethodology: Average response score of DMS employees for particular subset of questions on the survey that measure satisfaction
Example Survey Questions: FY 2016: 64 percent

L E A D ∙ T R A N S F O R M ∙ D E L I V E RPage 15
Tier 2, Goal: Increase Collections
TOP Debt Recovery and Resolution Rate
Description and PurposeKPI: Total Debt collected and administratively resolved via TOP out of the total amount of debt referred in a given time period. Exclude Agency 33.
Purpose: Drives proper functionality and availability of the TOP system as well as the addition of matching improvements and new offset streams
Owner and FrequencyWho Will Report: Analytics
Reporting Frequency: Quarterly
Methodology and ExampleMethodology: Total TOP collections divided by total debt balance referred to TOP. Timeframe TBD. Exclude Agency 33, as it should be included in Cross Servicing.
Example: Q3 FYTD 2017: 10 percent
L E A D ∙ T R A N S F O R M ∙ D E L I V E RPage 16
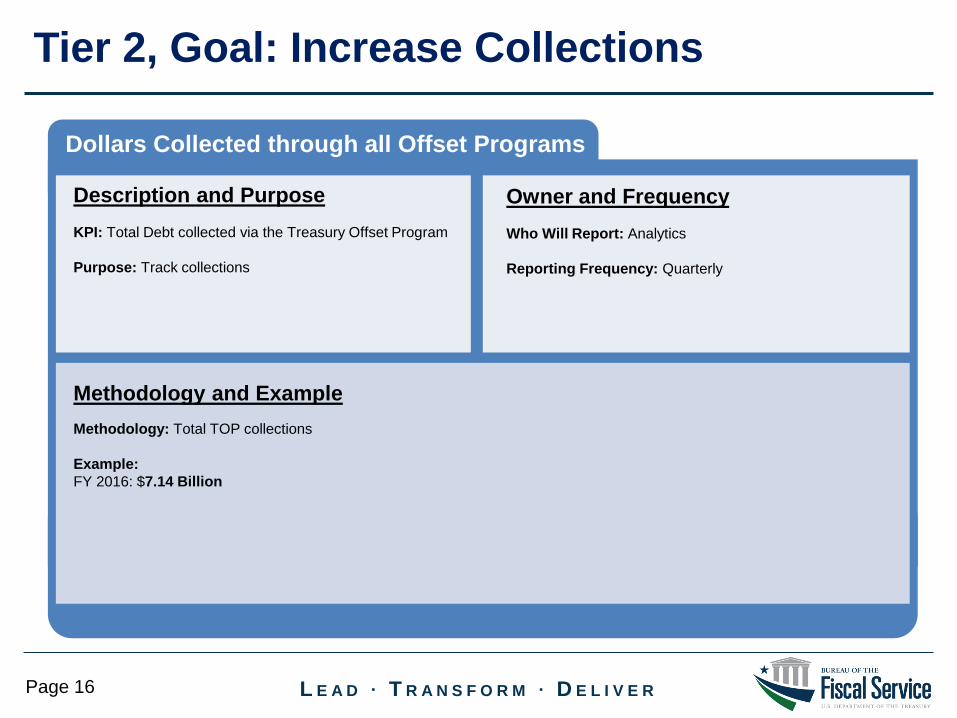
Tier 2, Goal: Increase Collections
Dollars Collected through all Offset Programs
Description and PurposeKPI: Total Debt collected via the Treasury Offset Program
Purpose: Track collections
Owner and FrequencyWho Will Report: Analytics
Reporting Frequency: Quarterly
Methodology and ExampleMethodology: Total TOP collections
Example: FY 2016: $7.14 Billion
L E A D ∙ T R A N S F O R M ∙ D E L I V E RPage 17
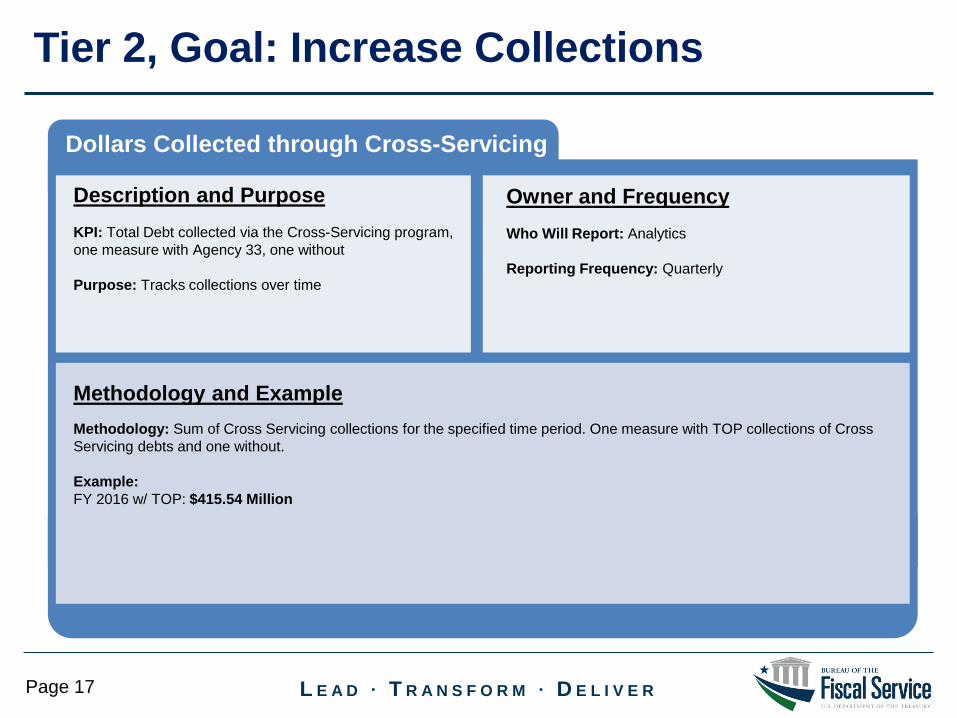
Tier 2, Goal: Increase Collections
Dollars Collected through Cross-Servicing
Description and PurposeKPI: Total Debt collected via the Cross-Servicing program, one measure with Agency 33, one without
Purpose: Tracks collections over time
Owner and FrequencyWho Will Report: Analytics
Reporting Frequency: Quarterly
Methodology and ExampleMethodology: Sum of Cross Servicing collections for the specified time period. One measure with TOP collections of Cross Servicing debts and one without.
Example: FY 2016 w/ TOP: $415.54 Million
L E A D ∙ T R A N S F O R M ∙ D E L I V E RPage 18
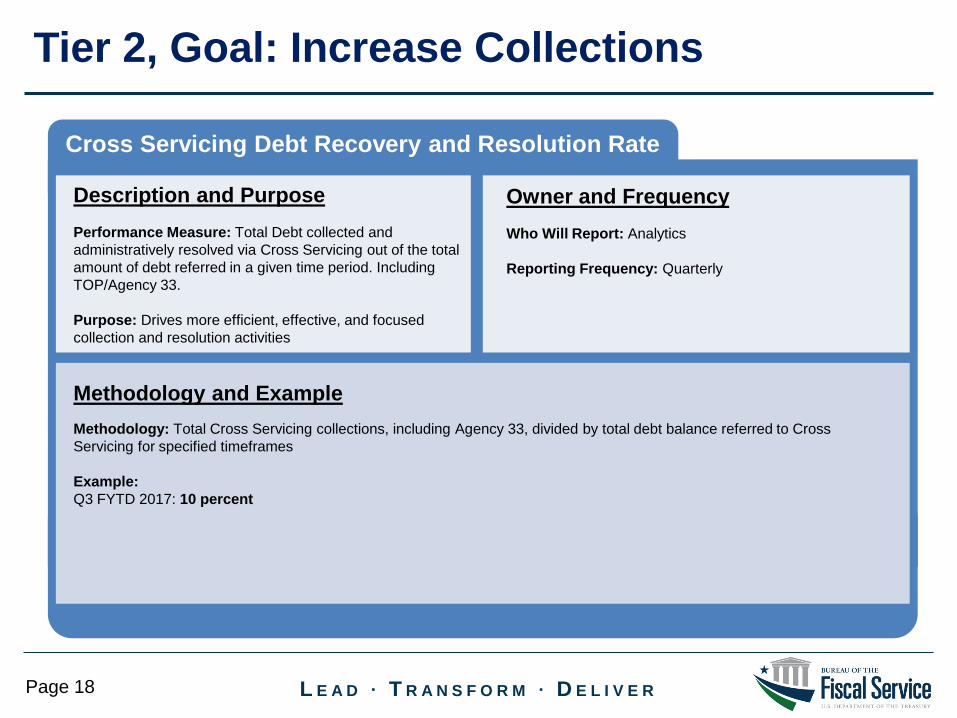
Tier 2, Goal: Increase Collections
Cross Servicing Debt Recovery and Resolution Rate
Description and PurposePerformance Measure: Total Debt collected and administratively resolved via Cross Servicing out of the total amount of debt referred in a given time period. Including TOP/Agency 33.
Purpose: Drives more efficient, effective, and focused collection and resolution activities
Owner and FrequencyWho Will Report: Analytics
Reporting Frequency: Quarterly
Methodology and ExampleMethodology: Total Cross Servicing collections, including Agency 33, divided by total debt balance referred to Cross Servicing for specified timeframes
Example: Q3 FYTD 2017: 10 percent

L E A D ∙ T R A N S F O R M ∙ D E L I V E RPage 19
Tier 2, Goal: Increase Collections
Percent Difference in Collections from Previous Year
Description and PurposeKPI: Percent change in TOP and Cross Servicing collections combined vs the previous year
Purpose: Drives increases in collections
Owner and FrequencyWho Will Report: Analytics
Reporting Frequency: Annually
Methodology and ExampleMethodology: Amount collected this year minus the amount collected last year divided by the amount collected last year.
Example: FY 2016: 1.8 percent

L E A D ∙ T R A N S F O R M ∙ D E L I V E RPage 20
Tier 2, Goal: Increase Debt Referrals
Percent of Eligible Debt Referred to DMS
Description and PurposeKPI: Portion of eligible debt that was referred to DMS for collection that year. Separate Department of Education from all other debt sources.
Purpose: Drives DMS to focus on creditor agency compliance to referral standards
Owner and FrequencyWho Will Report: TROR
Reporting Frequency: Annually
Methodology and ExampleMethodology: Number of TOP and CS Debt referrals required and eligible divided by the number of TOP and CS debts referred. One measure for Department of Education, and one measure for all other creditor agencies combined.
Example: FY 2017: 89 percent

L E A D ∙ T R A N S F O R M ∙ D E L I V E RPage 21
Tier 2, Goal: Increase Debt Referrals
Number of Additional Debt/Payment Sources Added
Description and PurposeKPI: Number of new programs referring debts or submitting payments available for offset.
Purpose: Drives DMS to focus on adding collection sources to their portfolio, which in turn increases collections
Owner and FrequencyWho Will Report: Debt Collection Directorate
Reporting Frequency: Annually
Methodology and ExampleMethodology: TBD/Count of unique new debt programs in either TOP or Cross Servicing and count of unique new payment agency IDs in TOP
Example: FY 2017: Six

L E A D ∙ T R A N S F O R M ∙ D E L I V E RPage 22
Tier 2, Goal: Optimize Data Transparency
Percent of Appropriate DMS Data Publicly Shared
Description and PurposePerformance Measure: Of all internal operational data sources, the percent that is stored and available for internal analysis in an appropriate information repository system.
Purpose: Drives DMS to build its data infrastructure in order to better understand its operations and make data driven decisions.
Owner and FrequencyWho Will Report: Business Architecture
Reporting Frequency: Annually
Methodology and ExampleMethodology: Sum of the number of DMS operational data sources stored and available for analysis via appropriate software, divided by the total number of data sources where analysis is appropriate.
Example: Q3 FYTD 2017: 35 percent

L E A D ∙ T R A N S F O R M ∙ D E L I V E RPage 23
Tier 2, Goal: Optimize Data Transparency
Percent of Appropriate DMS Data Publicly Shared
Description and PurposePerformance Measure: Percent of appropriate data available to the public or to external stakeholders via the Financial Information Repository for consumption.
Purpose: Drives DMS to increase the transparency and availability of important public information.
Owner and FrequencyWho Will Report: Business Architecture
Reporting Frequency: Annually
Methodology and ExampleMethodology: Sum of the number of sources where DMS data is shared to the public or to external stakeholders, divided by the total number of data sources where sharing data is appropriate. This would include actual figures, tables, graphs, and published reports.
Example: Q3 FYTD 2017: 35 percent

L E A D ∙ T R A N S F O R M ∙ D E L I V E RPage 24
• Redevelop Reports to Identify the Big Picture
• Implement Automated Reporting through the Financial Information Repository (FIR)
• Build Customizable Reporting through FIR
• Formalize Definitions of Measures
• Integrate More Information to the Debt Information Repository (DIR) and FIR
Next Steps
L E A D ∙ T R A N S F O R M ∙ D E L I V E RPage 25
Jonathan Deyo, AnalystData Management, Reporting & Analysis [email protected]
Contact Information