RESTRICTED - osti.gov
22
Transcript of RESTRICTED - osti.gov

RESTRICTED
All property right and copyright are reserved. Any communication or reproduction of this document,and any communication or use of its content without explicit authorization is prohibited. Anyinfringement to this rule is illegal and entitles to claim damages from the infringer, without prejudiceto any other right in case of granting a patent of registration in the field or intellectual property.StudieCentrum voor Kernenergie, SCK»CEN, B-2400 Mol.Centre d'etude de l'Energie Nucleaire, CEN-SCK, B-2400 Mol.
Distribution List
SCK'CEN:
Mr. P. Govaerts(l)Director General
Mr. G. Collard(l)Head Research Division Waste,Decommissioning and Radiochemistry
Prof. E.F. Vansant(l)UIA, Laboratory of Inorganic Chemistry
Mr. B.Neerdael(l)Head Research Unit Waste and Disposal
Mr. M. Buyens(l)Project Leader Exploitation URF
Mr. J. Marivoet (1)Project Leader Performances
Mr. M. Snykers(l)Scientific Co-ordinator
Mr. M. Put(l)Project Leader R&D Disposal
Mr. P. Vanlseghem(l)Project Leader Waste Characterization andCompatibility
Mr. J. Verstricht (1)Project Leader PRACLAY
Mr. M. Aertsens (1)
Mr. M. Bruggeman (1)
Mr. P. De Canniere (I)
Mrs. D. Delleuze (1)
Mrs. A. Dierckx(l)
Mr.F.X. Holvoet(l)
Mr. Ph. Lolivier (1)
Mr. L. Meynendonckx (1)
Mr. H. Moors (1)
Mr. E. Valckc(l)
Mrs. V. Pirlet(l)
Mr. M. Van Gompel (1)
Mr. L. Van Ravestyn (I)
Mr. G. Volckaert (1)
Mr. L.Wang (1)
SCK»CEN central documentation/library (1)SCK»CEN Quality Assurance (1)Documentation Waste and Disposal Program (5)DAC - ROR (6)
97/X073000/NM/mvo/P-24
Determination of the
diffusion coefficient of
ionic species in Boom
Clay by electromigration.
First Evaluation
Norbert MaesH. MoorsP. De CanniereM. AertsensM. Put
BLG-736
Waste and Disposal UnitSCK>CEN, Belgian Nuclear Research Centre,Mol, Belgium
March, 1997
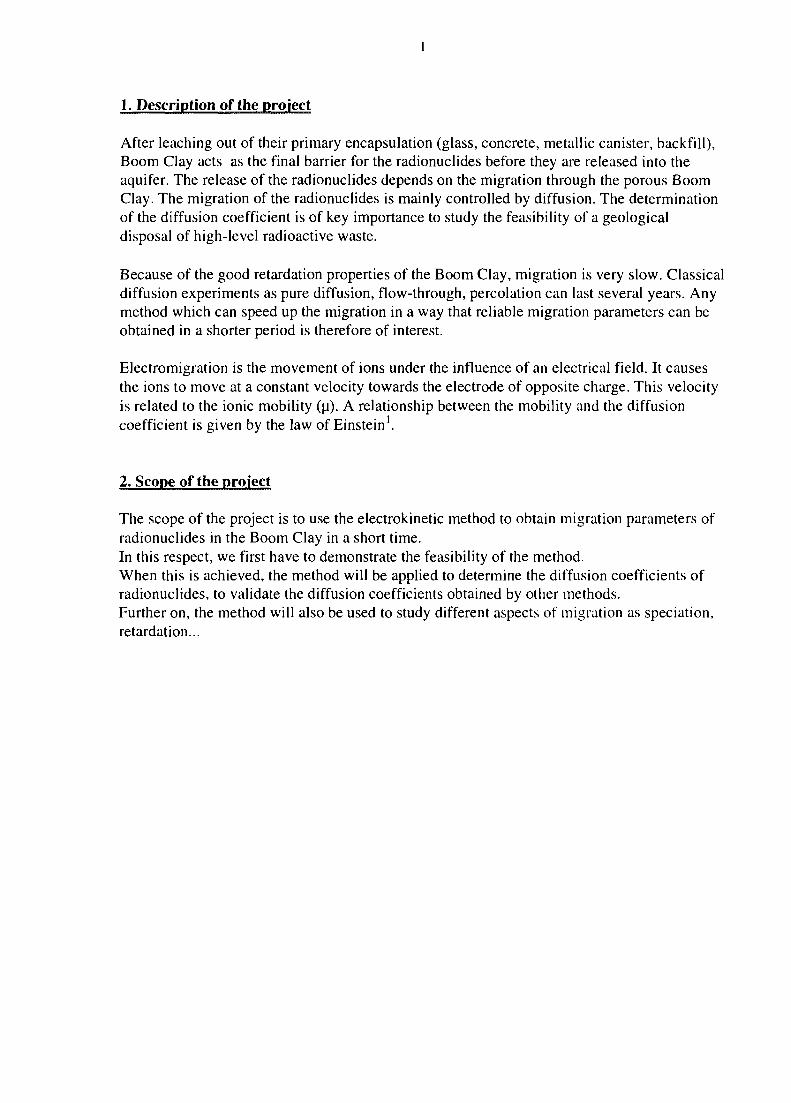
1. Description of the project
After leaching out of their primary encapsulation (glass, concrete, metallic canister, backfill),Boom Clay acts as the final barrier for the radionuclides before they are released into theaquifer. The release of the radionuclides depends on the migration through the porous BoomClay. The migration of the radionuclides is mainly controlled by diffusion. The determinationof the diffusion coefficient is of key importance to study the feasibility of a geologicaldisposal of high-level radioactive waste.
Because of the good retardation properties of the Boom Clay, migration is very slow. Classicaldiffusion experiments as pure diffusion, flow-through, percolation can last several years. Anymethod which can speed up the migration in a way that reliable migration parameters can beobtained in a shorter period is therefore of interest.
Electromigration is the movement of ions under the influence of an electrical field. It causesthe ions to move at a constant velocity towards the electrode of opposite charge. This velocityis related to the ionic mobility (u). A relationship between the mobility and the diffusioncoefficient is given by the law of Einstein1.
2. Scope of the project
The scope of the project is to use the electrokinetic method to obtain migration parameters ofradionuclides in the Boom Clay in a short time.In this respect, we first have to demonstrate the feasibility of the method.When this is achieved, the method will be applied to determine the diffusion coefficients ofradionuclides, to validate the diffusion coefficients obtained by other methods.Further on, the method will also be used to study different aspects of migration as speciation,retardation...

3. Electrokinetic phenomena
Applying a potential gradient over a water saturated porous medium invokes threephenomena23 which are of interest in our application:
=> Electromigration: movement of ionic species=> Electrophoresis: movement of colloidal particles=> Electro-osmosis: movement of water
3.1 Electromigration
Electromigration is the movement of an ion in an electric field towards the electrode ofopposite charge. Under influence of the potential gradient, the ion will attain a constantvelocity called the drift speed (v) which is given by
eq. 1
v= drift speed [m/s]u= ionic mobility [m2/Vs]E= electric field [V/m]
The law of Einstein relates the ionic mobility with the diffusion coefficient:
D =Ze
eq. 2
D= diffusion coefficient [m2/s]u= ionic mobility [m2/Vs]K= Boltzmann constant, 1.38 10'23 [J/K]T= Temperature [K]Z= valence [-]e= electron charge, 1.6 10 l9 [C]
3.2 Electro-osmosis
Electro-osmosis can be explained by the presence of an electric double layer at the chargedsurface of the porous medium. The negative charged clay surface is compensated by cations inthe pore water. Under the influence of an electric field, the cations in the double layers willmove to the cathode. Due to viscous drag, pore water will move together with the cationsresulting in a bulk flow of water towards the cathode.
The Helmholtz-Smoluchowski model describes the electro-osmosis. Despite seriousdrawbacks, it is still the most widely used model because of its simplicity:
v , . = •
eq. 3
veo= electro-osmotic velocity [m/s]e= dielectric permittivity of water, 7.12 10"'° [C2/Nm2]£= zeta potential [V]E= electric field [V/m]T|= viscosity, 1 10'3[Ns/m2]
3.3 State-of-the-Art
Migration of species under influence of an electric field finds many applications. Tiseliusestablished the technique of electrophoresis for the separation of proteins and was rewardedthe Nobel Prize.Further developments lead to new advanced techniques for the separation of ions by HPCE(High Performance Capillary Electrophoresis) or CIA (Capillary Ion Analysis) where the ionsare separated on their difference in mobility4.
Electrokinetic soil processing is an emerging technology3'5 in waste remediation, soildecontamination, soil stabilisation, sludge treatment...The combined effect of electromigrationand electro-osmotic flow is very efficient for the removal of hazardous waste6 '7 '8 '910"12
(heavy metals, aromatics, radioactive contaminants) from soils. Soil stabilisation, dewateringand consolidation, is based on electro-osmosis.
Electrokinetics are also applied in the study of diffusion. The diffusion of chloride in concretewas studied by applying an electric gradient across a concrete core13.Electrodiffusion profiles were used to evaluate the Na self-diffusion and specific conductivityin Na2O.2SiC>2 glass14. With the aid of electrodiffusion profiles it was also possible to studythe charge of the Cu-impurities in a-As2Sei.Cu semiconductors15.
These latter cases are not representative for the saturated porous media where we have to takeinto account sorption, ion-exchange, tortuosity, electro-osmotic flow...

3.4 Transport Equation
The transport equation derived in following paragraph is based on models describingdecontamination of polluted soils by means of an electric fieldi6-'7-'8-'y-20.21,22,23
The flux of species through an elementary volume during an electrokinetic experiment is dueto a concentration gradient and an electrical gradient:
I = I + Je
eq. 4
Jt= total flux [mol/m2s]Jc= chemical flux [mol/m2s]Je= electrical flux [mol/m2s]
The chemical flux is given by Fick's first law:
' '•-"§eq. 5
D= diffusion coefficient [nr/s]
The electrical flux has two components: electromigration (Jem) and electro-osmosis (Jeo).
eq. 6
<\>= electric potential [V]u= ionic mobility [m2/Vs] = DZe/KTkg= electro-osmotic mobility [m7Vs]n= porosity [-]vem= electromigration velocity [m/s]veo= electro-osmotic velocity [m/s]
Introducing these formulas in equation 4 for the total flux:
eq. 7
The sign of the electro-osmotic velocity depends on the direction of the flow, positive whenthe electro-osmotic flow is in the same direction as the species and negative in the oppositecase.The diffusion equation is given by the second law of Fick:
dCdt "
dc
dJ,dx
d2C
= Dvdt dx2 ' dx
eq. 8
Vc= convection velocity [m/s]
The basic diffusion equation must be adapted for a porous medium, taking into accounttortuosity and retardation (sorption) effects.Since x is the real distance of the diffusion path, while the experimentally measured path isthe end to end distance z. The ratio between both is the tortuosity: x=x/z and is always higherthan 1. In the diffusion equation we substitute dx by xdz.Assuming a linear sorption isotherm: C*=Kd-C (Kj: distribution coefficient, C*: concentrationadsorbed on the solid, C: concentration in the liquid).The diffusion equation can now be written as follows:
dCdt
p 1
dcdt
Pd
n
p
D
Rx
dc*dt
tlKd
d2c2 dz2
D dl
x2 dz
KRx2
C2
dcdz.
Kx2
dCdz.
eq. 9
R= retardation coefficient [-]x= tortuosity [-]D/Rt2= apparent dispersion coefficient= Da [m2/s]Vc/Rx2= apparent convection velocity= Vc
a [m/s]pCi= grain density [g/cm3]IQ= distribution coefficient [ml/g]r|= diffusion accessible porosity [-]
Equation 9 has the form of the classical dispersion-convection equation:
dC _ d C _ dC
A " A 2 ' " Aeq. 10
Due to convection, the pore water will not all travel at the same velocity and mixing occursalong the flowpath. This mixing is called mechanical dispersion and results in a dilution of thesolute. This process can be described by Fick's law of diffusion where the diffusion coefficientis replaced by the dispersion coefficient. The general relationship between the dispersioncoefficient and the diffusion coefficient can be described as follows:
eq. 11
Da= apparent dispersion coefficient [m2/s]a= dispersion length [m]Dm
a= apparent molecular diffusion coefficient [m2/s]Vc'= total apparent convection velocity [m/s]
= I v e ma | + | v e o
a |For cationic species, Vc' is equal to the Vc
a.
The apparent molecular diffusion coefficient, Dma, is the diffusion coefficient of the species in
the porous medium and is the coefficient of interest.
Now we rewrite our dispersion-convection equation in terms of the diffusion coefficient asfollows:
z2 { KT D" + * T 2 J dz,eq. 12
There are two approaches to calculate the diffusion coefficient from an electromigrationexperiment:
1. Application of the Einstein relation.After the electromigration experiment, the concentration of the species in the clay is
measured and a distribution profile is found. From the displacement of the distribution profilethe convection velocity is calculated. If the contribution of the electro-osmosis is negligible,the convection velocity equals the electromigration velocity. This velocity can be converted tothe apparent diffusion coefficient by the Einstein relation.
2. Fitting of the distribution profile.The distribution profile can be fitted against the measured profile, resulting in the
dispersion coefficient and the convection velocity.For the fitting we need an analytical solution of the diffusion equation.
Considering the simple dispersion-convection equation:
dC ^a d C
dt dx2 c dx
eq. 13
and the appropriate boundary conditions for this system:- at x=°o the concentration is zero, C(x=°°)=0,- the initial conditions are: C(0<x<°o, t=0)=0 and C(x=0,t=0)=0
Then we obtain the following analytical solution:
4. Experimental
C(x,t) =
2 \
4D"t
eq. 14
Qo= the initial quantity of the species distributed in a thin layerover the cross section of the clay slabS= cross section of the clay slab
4.1 Experimental set-up
Cathode Anode
reduction oxidation
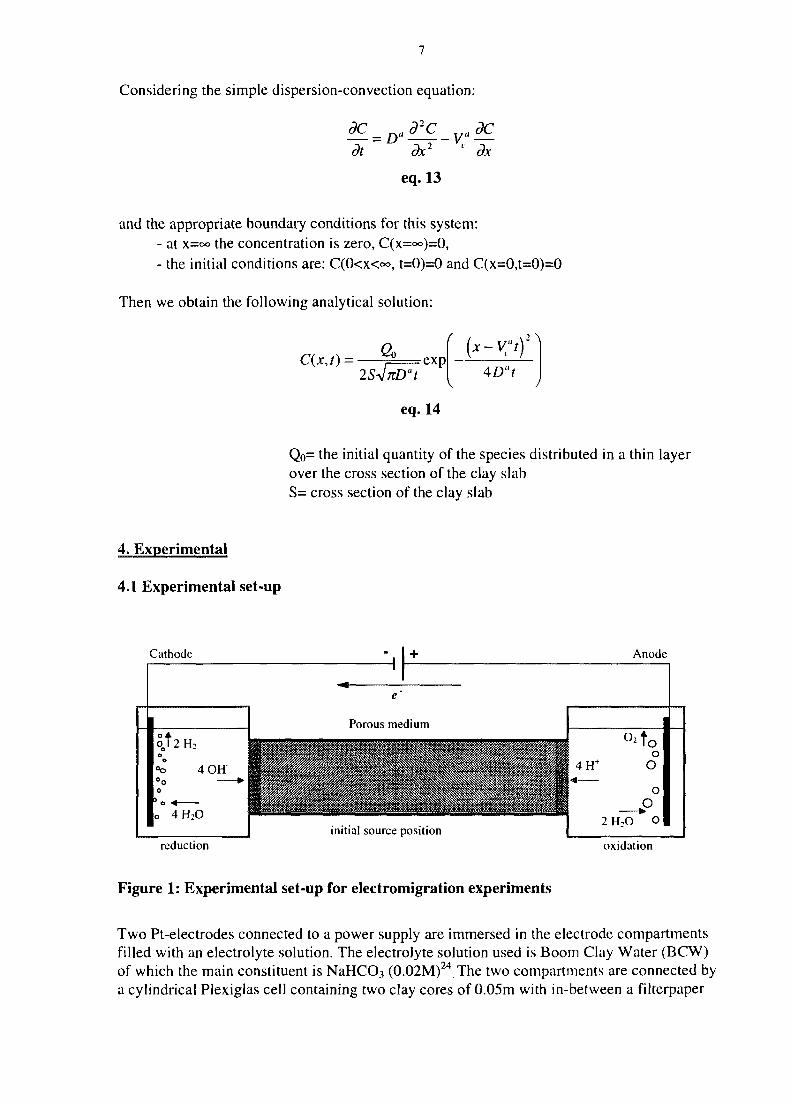
Figure 1: Experimental set-up for electromigration experiments
Two Pt-electrodes connected to a power supply are immersed in the electrode compartmentsfilled with an electrolyte solution. The electrolyte solution used is Boom Clay Water (BCW)of which the main constituent is NaHCO^ (0.02M)24 The two compartments are connected bya cylindrical Plexiglas cell containing two clay cores of 0.05m with in-between a filterpaper
doped with a solution of the radionuclide of interest. The clay cores are confined between twoporous glass filters.At equal distances in the Plexiglas cell, small holes are drilled where needles can be insertedto measure the potential difference or a thermocouple to measure the core temperature.
4.2. Measurement of the distribution profile.
After the test, the clay core is cut in slices of about 1mm thick. These slices are brought invials to measure the activity.In case of a gamma emitting radionuclide, the vials are directly measured for gamma activityusing a NaI(Tl)-gamma detector.When we deal with a beta emitting radionuclide, the clay slices are put in vials containingI Oml of water and well mixed to obtain homogeneous clay pastes. These clay pastes arecentrifuged for 30 minutes at l5000rpm. From the supernatant, 1ml is pipetted into ascintillation vial filled with a scintillation cocktail and measured with a liquid scintillationcounter.
5. Results and Discussion
5.1. Controlling the chemical changes of the clay core during electromigration
5.1.1 pH gradient
When a potential difference is applied on the electromigration cell, electrolysis of water willoccur (Figure 1) with the production of protons at the anode (oxidation) and hydroxyls at thecathode (reduction). Under influence of the electric field these ions will migrate to theopposite side thereby changing the pH of the clay. The initial pH of the Boom claychanges from 9.4 to 2 and 13 respectively at the anode and cathode. Physico-chemical
perturbations of this kind seriously influence the migration and must be avoided at all times.
5.1.2 Chemical buffering
To neutralise the protons and hydroxyls we can use a chemical buffer of the same compositionas the BCW. A buffer solution of 1M NaHCC>3 and 0.1M Na2CO3 is necessary to achieve aconstant pH of approximately 9.4.Electromigration experiments with Sr-85 and 1-131 showed that the buffer could maintain aconstant pH during the experiment (voltage: 400V, time: 2hr).Because of the high concentration of the buffer solution, it is possible that the ionic strength ofthe clay will be disturbed. Changes in the ionic strength result in a change in the double layerthickness. This will affect the interaction of the ionic species with the clay layer influencingthe migration.
The double layer thickness can be calculated as follows 17.
s =eRT
2Z2FC
eq. 15
8= double layer thickness [m]e= dielectric permittivity of water, 7.12 10"'° [C2/Nm2]R= gas constant, 8.314 [J/Kmol]T= temperature [K]F= Faraday constant, 96487 [C/mol]C= concentration [M]Z= valence [-]
The double layer thickness for the electrolyte solutions of 1M and 0.02M NaHCO} isrespectively 0.32nm and 2.16nm.
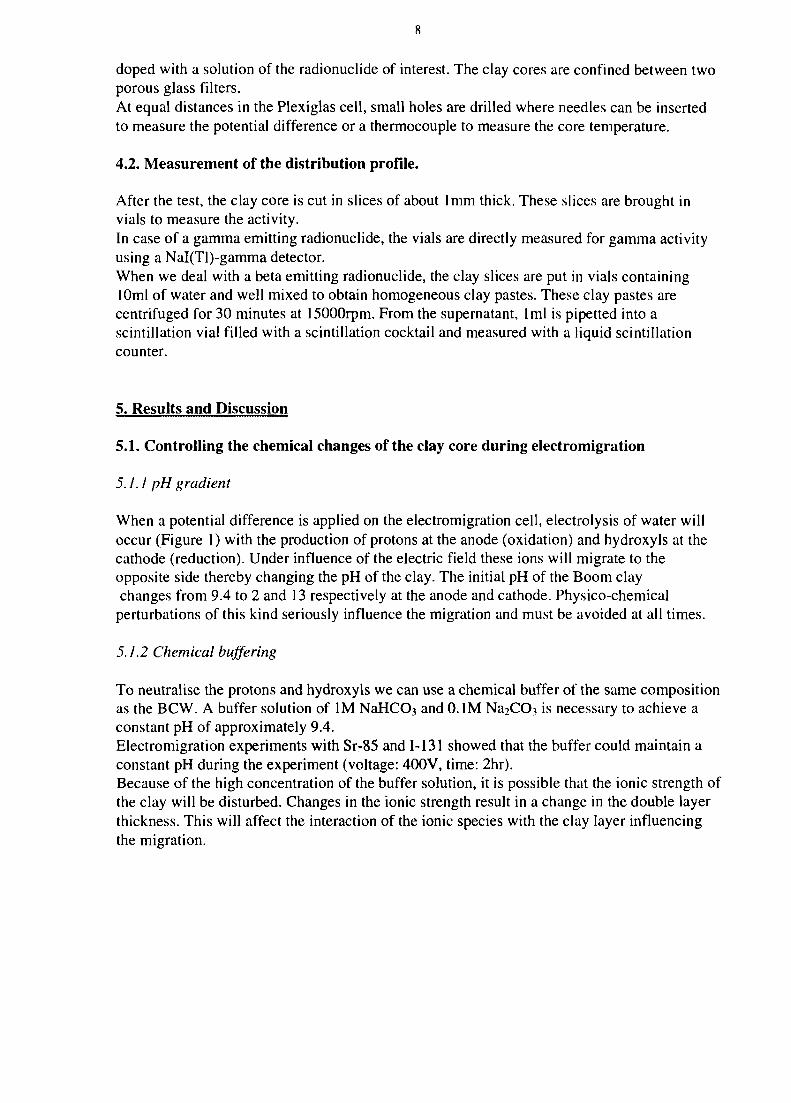
Two tests were done to evaluate the disturbance of the ionic strength. C-14 labelled NaHCO}and Na-22 were respectively spiked into the cathode and anode compartment. The depth ofpenetration is studied by measuring the activity of the clay slabs. The depth of penetration isan indication for the perturbation of the ionic strength. Results are given in figure 2 and 3.
6000
10 20 30 40 50 60 70
Distance from cathode (mm)90 100
Figure 2: Penetration of HCO3" into the clay core
10
1 200
1.000
0.800 -
mi 0.600
0.400 •
0.200
0.000
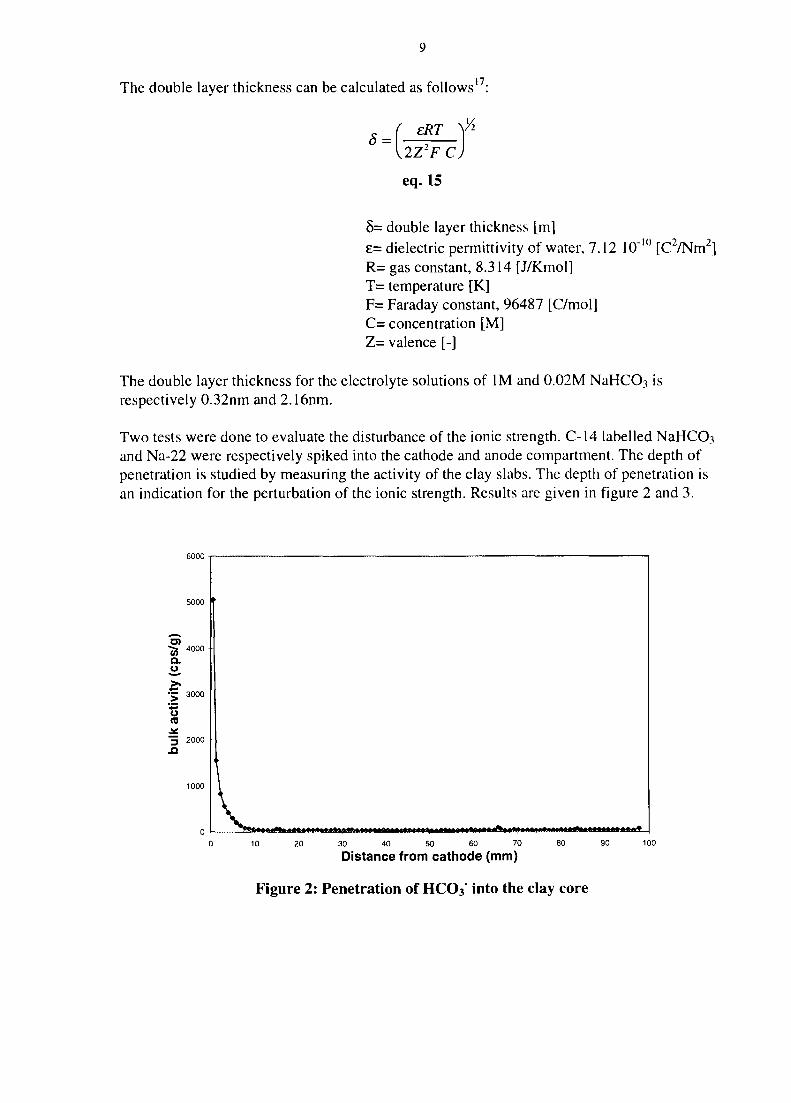
- • - [Na] after experiment[Na] initial (0.02M)
10 20 30 40 50 60 70
Distance from anode [mm]
90 100
Figure 3: Penetration of Na+ in the clay core.
As can be seen from figure 3, the perturbation of the ionic strength due to the high bufferconcentration is significant.Migration experiments performed with buffer solutions of this concentration will thereforelead to migration parameters which are not relevant for the initial situation.
5.1.2 Automatic neutralisation by circulating the electrolyte solution
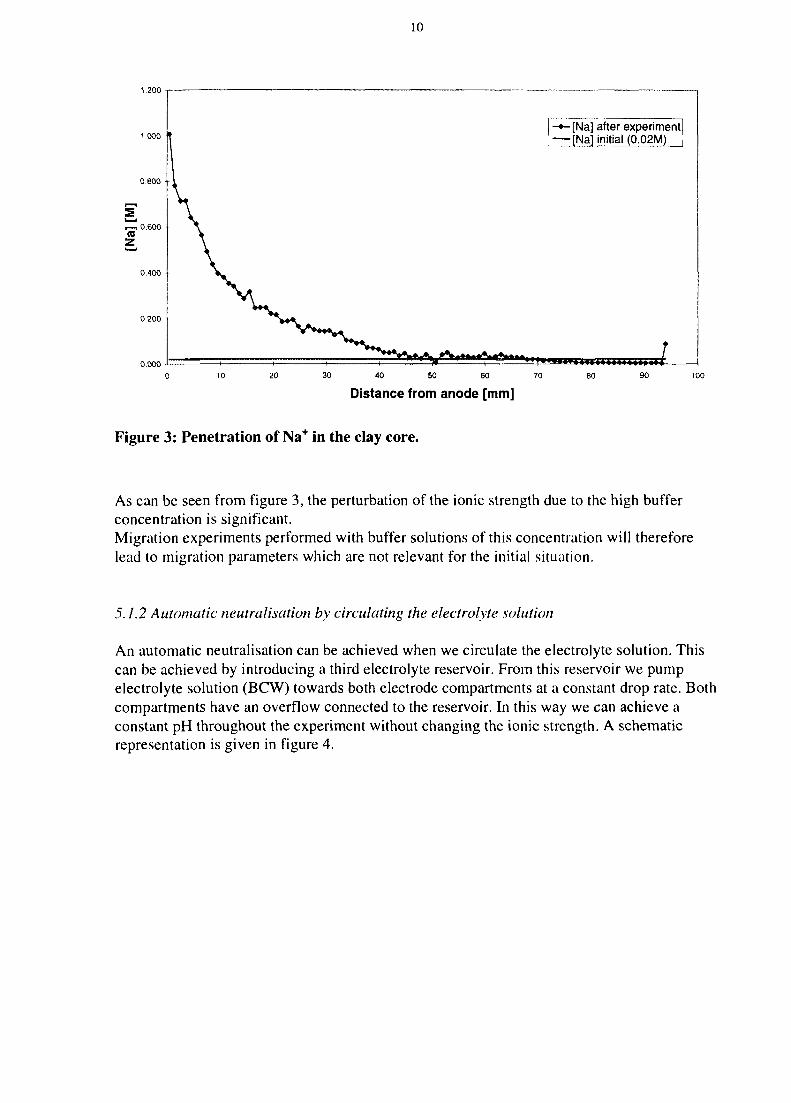
An automatic neutralisation can be achieved when we circulate the electrolyte solution. Thiscan be achieved by introducing a third electrolyte reservoir. From this reservoir we pumpelectrolyte solution (BCW) towards both electrode compartments at a constant drop rate. Bothcompartments have an overflow connected to the reservoir. In this way we can achieve aconstant pH throughout the experiment without changing the ionic strength. A schematicrepresentation is given in figure 4.
11
Pump
! overflow to reservoir
overflow to reservoir
reservoir
Figure 4: Experimental set-up for automatic neutralisation.
5.2 Determination of the diffusion coefficient bv electromigration
5.2.1 Experiments at high voltage: 400Vfor 2 hrs
The first series of experiments with Sr-85,1-131 and HTO, were performed with the chemicalbuffering method. But as stated in previous part, this caused disturbances in the clay leadingto non-reliable results.
The second series was performed using the automatic neutralisation method.The results are given in table 1 and a typical distribution profile is given in figure 5
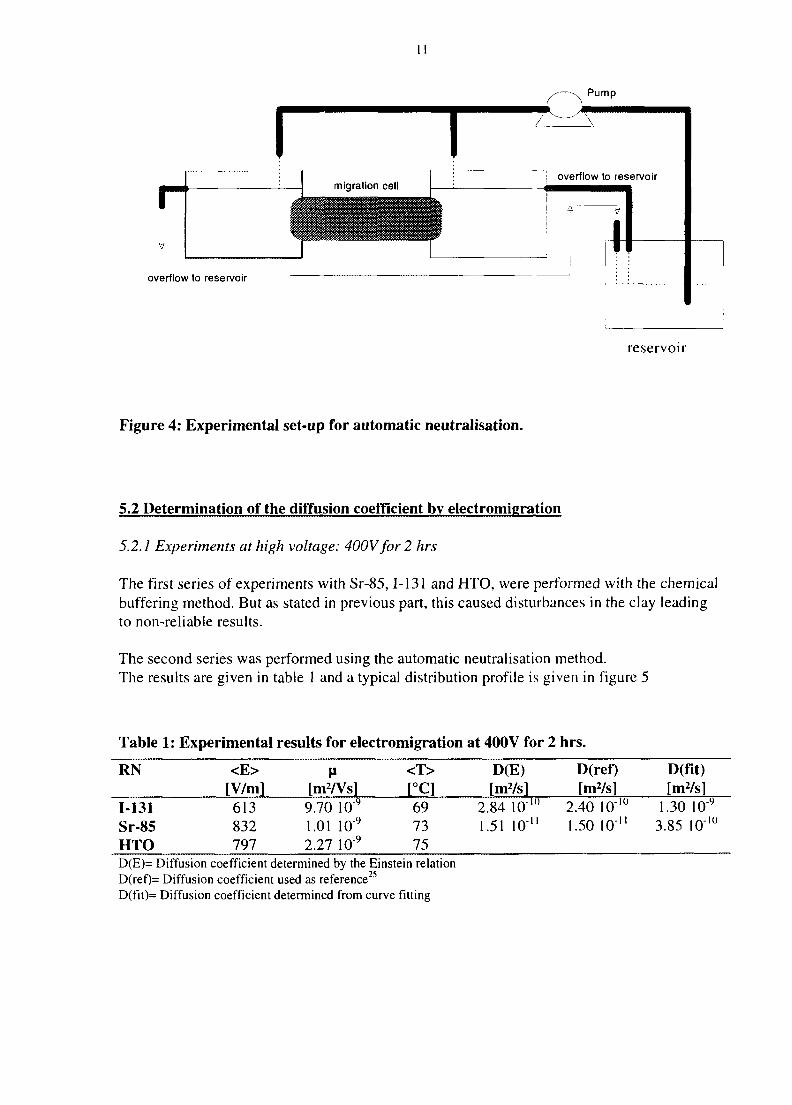
Table 1:
RN
1-131Sr-85HTO
Experimental
[V/m]613832797
results for electromigration
M[mWs]
9.70 10"9
1.01 10"9
2.27 10"9
TO697375
at 400V for 2
D(E)[mVs]
2.84 10"'°1.51 10"
hrs.
D(ref)[m2/s]
2.40 10 l0
1.50 10""
D(fit)[mVs]
1.30 10"9
3.85 10"'°
D(E)= Diffusion coefficient determined by the Einstein relationD(ref)= Diffusion coefficient used as reference25
D(fit)= Diffusion coefficient determined from curve fitting
12
1
Act
iv
, , , _ _ _ _—| .2EtO4- iA 1
Anode
1 0E+O4 •
8.0E+O3 •
6.0E+O3 -
4.0E+O3 -
2.0E+O3 •
————— —• experimental
D-fit
" K• ( 1
\
Cathode
-0.04 -0.0.1 -0.02 -0.01 0 0.01 0.02
Distance from source [m]0.0.1 0.04 0.05
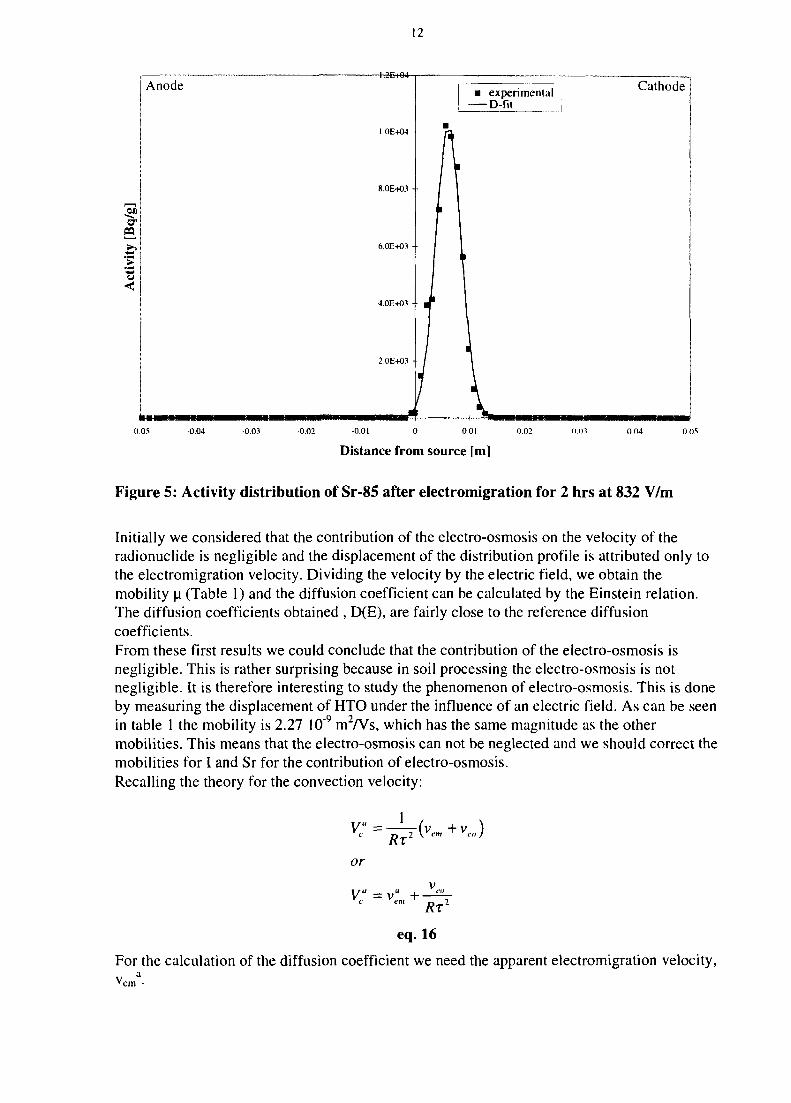
Figure 5: Activity distribution of Sr-85 after electromigration for 2 hrs at 832 V/m
Initially we considered that the contribution of the electro-osmosis on the velocity of theradionuclide is negligible and the displacement of the distribution profile is attributed only tothe electromigration velocity. Dividing the velocity by the electric field, we obtain themobility u (Table 1) and the diffusion coefficient can be calculated by the Einstein relation.The diffusion coefficients obtained , D(E), are fairly close to the reference diffusioncoefficients.From these first results we could conclude that the contribution of the electro-osmosis isnegligible. This is rather surprising because in soil processing the electro-osmosis is notnegligible. It is therefore interesting to study the phenomenon of electro-osmosis. This is doneby measuring the displacement of HTO under the influence of an electric field. As can be seenin table 1 the mobility is 2.27 10"9 m2/Vs, which has the same magnitude as the othermobilities. This means that the electro-osmosis can not be neglected and we should correct themobilities for I and Sr for the contribution of electro-osmosis.Recalling the theory for the convection velocity:
V = —!—(v +v )rc n 2 Vein ^ vco )
or
m RT2
eq. 16
For the calculation of the diffusion coefficient we need the apparent electromigration velocity,
13
To obtain this value we need the veo which is measured in the HTO experiment. From thisexperiment we obtain the velocity of HTO in a porous medium or veo/T
2 is found. Now therelation becomes:
V = v «R
eq. 17
To correct the convection velocity for the electro-osmosis contribution, the retardation factoris needed. When the mobility of the HTO has the same magnitude as the total mobility, wecan say that for retardation factors > 10, the electro-osmotic contribution decreases one orderof magnitude and can be neglected. Thus, in case of Sr (weakly retarded25, R~ 10), theassumption of neglecting the electro-osmosis can be justified.For non-sorbed species like iodine, there is no retardation effect and we have to correct for thecontribution of electro-osmosis. The corrected diffusion coefficient calculated from theEinstein relation becomes 3.56 10"'° m2/s as compared to 2.84 10"'° nr/s (non-corrected) andis still in good agreement with the reference value of 2.4 10"'° nr/s.
Using curve fitting, the dispersion coefficient is found which differs an order of magnitudewith the diffusion coefficient. To obtain the diffusion coefficient we have to consider the totalapparent convection velocity.Under influence of the electric field the transport is accelerated and the convection velocity ismuch higher than under hydraulic gradients. Further discussion on the determination of thediffusion coefficient form curve fitting is given in paragraph 5.2.2.
During these series of experiments we noticed a serious increase in the core temperature dueto Joule heating. The temperature increased from 25 to 90°C over a period of 2 hrs.Temperature fluctuations of this kind will influence the migration.Temperature increases can be avoided by cooling or suppression of the Joule effect byapplying lower voltages.
5.2.2 Experiments at low voltage: 50Vfor 20 hrs
With a voltage of 50V and cooling with a fan, the temperature increase is negligible and anaverage temperature of 29°C over a period of 20 hrs was maintained. Under these conditionsmore reliable migration parameters can be obtained. The results are presented in table 2 andfigures 6-8.
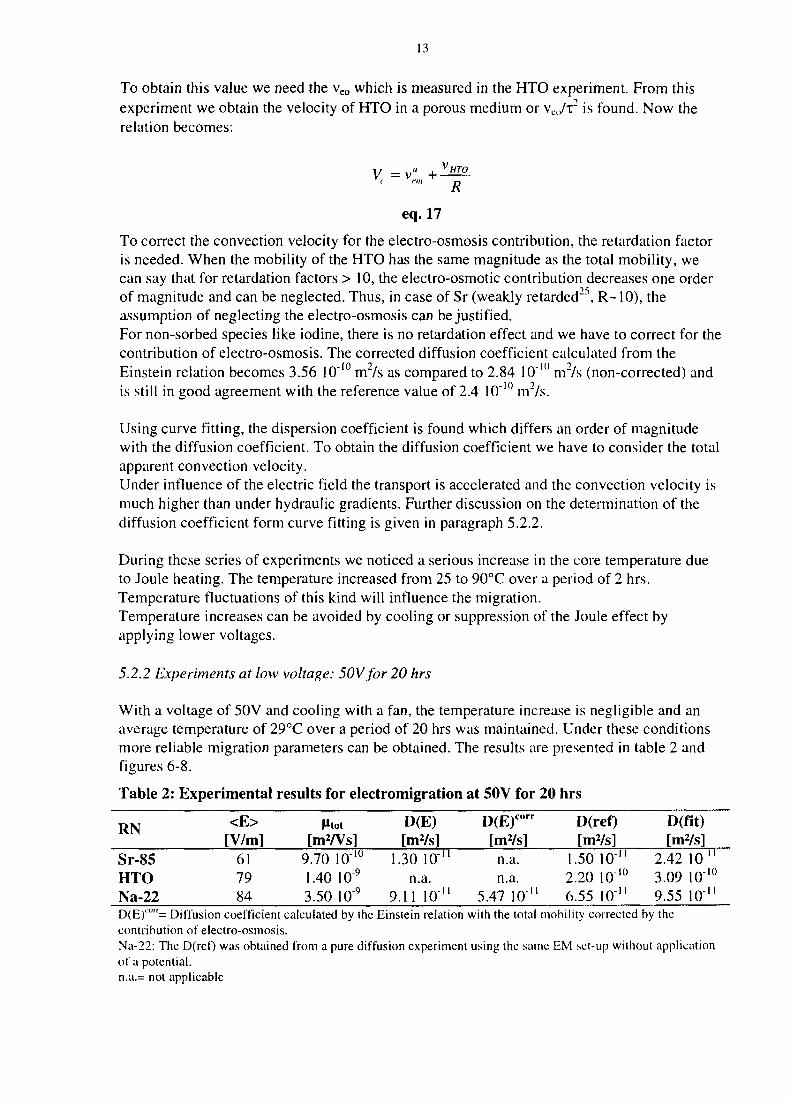
Table 2:
RN
Sr-85HTONa-22
Experimental
<E>[V/m]
617984
results for electromigration
Mtot
[mWs]9.70 10"10
1.40 10"9
3.50 10"9
D(E)[m2/s]
1.30 10"n.a.
9.11 10""
at 50V for 20
D(E)corr
[m2/s]n.a.n.a.
5.47 10""
hrs
D(ref)[mVs]
1.50 10""2.20 10"'°6.55 10"
D(fit)[m2/s]
2.42 10"3.09 10"'°9.55 10""
D(E)CO"_ rjjffusion coefficient calculated by the Einstein relation with the total mobility corrected by thecontribution of electro-osmosis.Na-22: The D(ref) was obtained from a pure diffusion experiment using the same EM set-up without applicationof a potential.n.a.= not applicable

14
-8*su
_>>
' >
••5
anode
1200 -
1000
800 -
600/
f 200 -
r* T
7\7
\
cathode
• Experimental
D-fit
•fl.OS -0.04 -0.03 -0.02 -0.01 0 0.01 0.02 0,0.' 0.04 0.05 0.0ft
Distance from source [m]
Figure 6: Distribution profile of HTO after electromigration for 20 hrs at 79 V/m
I
Activity
anode• Experimental
Fit
7000
6000 -
5000
4000
3000
2000
1000
^ cathodeN
-
-60 -50 -40 -30 -20 -10 0 10 20 M) 40 50 60
Distance from source [mm]
Figure 7: Distribution profile of Sr-85 after electromigration for 20 hrs at 61 V/m
15
CJD
<
anode
250 •
200 •
150 -
100-
50 -
„ cathode
A• Experimental
Fil
f
• 1
-50 -30 -20 -10 0 10 20
Distance from source [mm]40 50
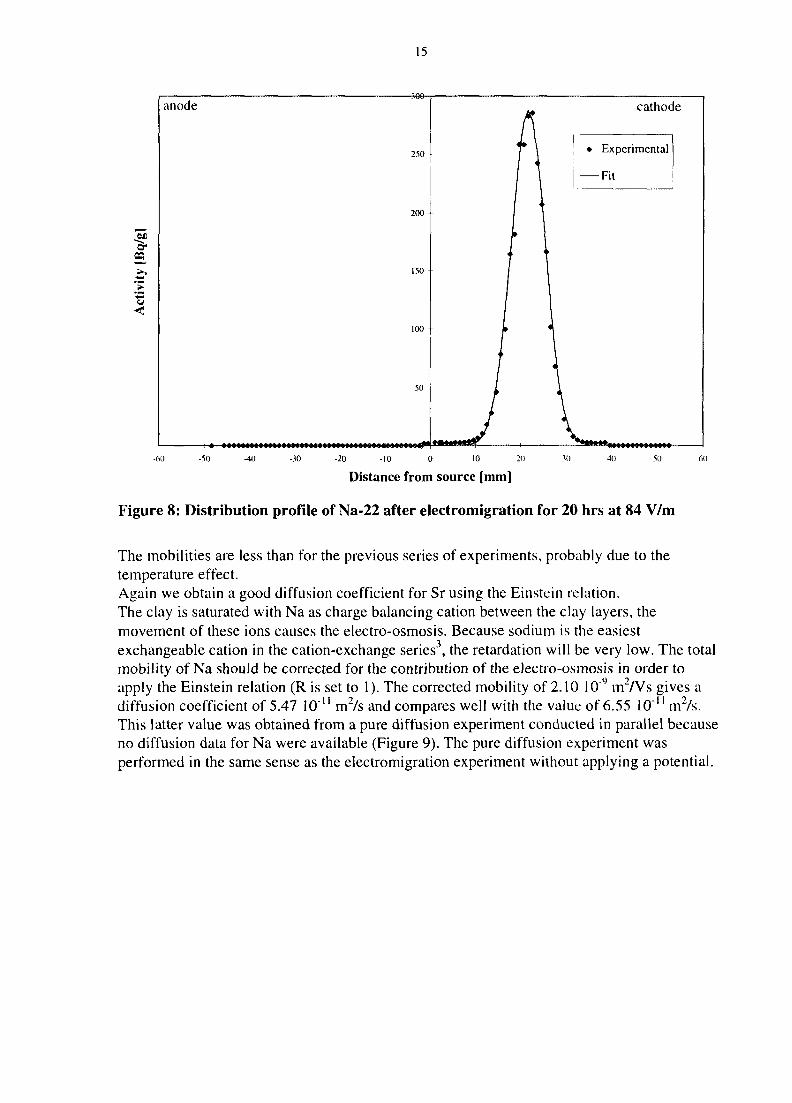
Figure 8: Distribution profile of Na-22 after electromigration for 20 hrs at 84 V/m
The mobilities are less than for the previous series of experiments, probably due to thetemperature effect.Again we obtain a good diffusion coefficient for Sr using the Einstein relation.The clay is saturated with Na as charge balancing cation between the clay layers, themovement of these ions causes the electro-osmosis. Because sodium is the easiestexchangeable cation in the cation-exchange series3, the retardation will be very low. The totalmobility of Na should be corrected for the contribution of the electro-osmosis in order toapply the Einstein relation (R is set to 1). The corrected mobility of 2.10 10 y
ITT/VS gives adiffusion coefficient of 5.47 10"" m2/s and compares well with the value of 6.55 10"" m2/s.This latter value was obtained from a pure diffusion experiment conducted in parallel becauseno diffusion data for Na were available (Figure 9). The pure diffusion experiment wasperformed in the same sense as the electromigration experiment without applying a potential.
16
"a"
Act
i>
• ExperimentalFit
tm—
fJtH) -
/ 1IHI
J
#
V111II
\v-20 2(1 50
Distance from source [mm]
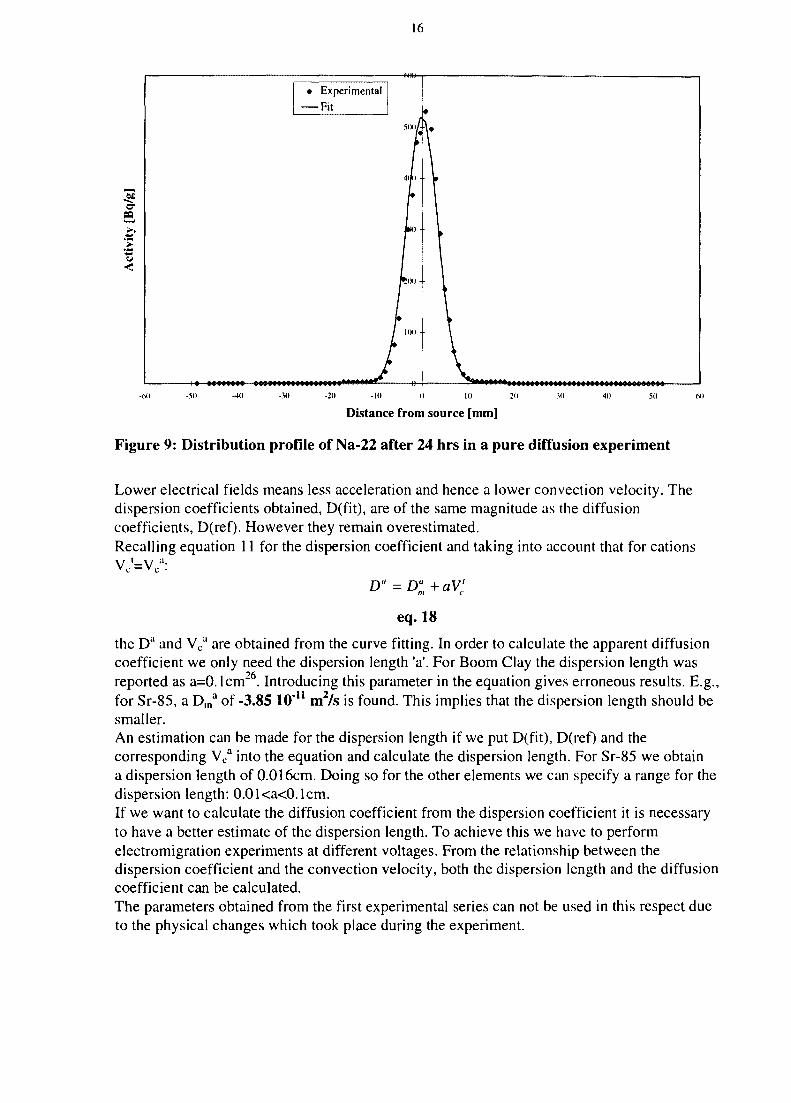
Figure 9: Distribution profile of Na-22 after 24 hrs in a pure diffusion experiment
Lower electrical fields means less acceleration and hence a lower convection velocity. Thedispersion coefficients obtained, D(fit), are of the same magnitude as the diffusioncoefficients, D(ref). However they remain overestimated.Recalling equation 11 for the dispersion coefficient and taking into account that for cationsVc'=Vc
a:
eq. 18
the Da and Vca are obtained from the curve fitting. In order to calculate the apparent diffusion
coefficient we only need the dispersion length 'a'. For Boom Clay the dispersion length wasreported as a=0. lcm26. Introducing this parameter in the equation gives erroneous results. E.g.,for Sr-85, a Dm
a of -3.85 10"11 m2/s is found. This implies that the dispersion length should besmaller.An estimation can be made for the dispersion length if we put D(fit), D(ref) and thecorresponding Vc
a into the equation and calculate the dispersion length. For Sr-85 we obtaina dispersion length of 0.016cm. Doing so for the other elements we can specify a range for thedispersion length: 0.01<a<0.1cm.If we want to calculate the diffusion coefficient from the dispersion coefficient it is necessaryto have a better estimate of the dispersion length. To achieve this we have to performelectromigration experiments at different voltages. From the relationship between thedispersion coefficient and the convection velocity, both the dispersion length and the diffusioncoefficient can be calculated.The parameters obtained from the first experimental series can not be used in this respect dueto the physical changes which took place during the experiment.
17
6. Conclusions
During a diffusion experiment one has to avoid perturbations of the clay core to have arepresentative experiment. During electromigration some extra perturbations as pH gradients,changes in the ionic strength, dewatering, Joule heating, can occur.The current experimental set-up with the automatic neutralisation at low voltages reducesthese perturbations to a minimum.
The feasibility of the electrokinetic method to determine the diffusion coefficient of ionicspecies is demonstrated. There are two ways to extract the diffusion coefficient from anelectromigration experiment.
A first way is based on the Einstein relation. From the displacement of the distributionprofile the velocity is obtained. The velocity is composed of two components,electromigration and electro-osmosis. Only the electromigration velocity is necessary tocalculate the diffusion coefficient. The electro-osmotic velocity is experimentally determinedby the displacement of HTO. To determine the contribution of the electro-osmotic velocity tothe total velocity of the species, the retardation has to be taken into account. For non-sorbedelements (anions) there is no retardation and the correction is made straightforward. Forretarded species (cations) the retardation factor is necessary. But for retardation factors >10,the electro-osmotic velocity can be neglected. Only for weak retarded species the retardationfactor is necessary to correct for the electro-osmosis.
From curve fitting the dispersion coefficient and the convection velocity are obtained.Due to the high convection velocity, the dispersion coefficient deviates significantly from thediffusion coefficient and can not be set equal as can be done in percolation and flow-throughexperiments. To obtain a correct diffusion coefficient the dispersion length is necessary. Adispersion length of 0.1 cm, as reported for Boom Clay, is too large and should be re-evaluated.
7. Experiments in progress
=> Electromigration of 1-131 to complete the experimental series in paragraph 5.2.2.
=> Migration of C-14 labelled organic matter.The different species present in organic matter will have different behaviour in an
electric field and can be studied separately.
=> Migration of Si-32.Electromigration is used to study the speciation of the Si-species.
=> Pure diffusion experiments for HTO, I\ Na+, Ca2+, CO32"...
Pure diffusion tests are performed to obtain diffusion coefficients needed to validate theelectromigration results.
18
8. Future work
0 Evaluation of the dispersion length=> Electromigration experiments at different voltages.
0 More thorough evaluation of the electro-osmotic velocity=> HTO migration experiments at different voltages.
0 Optimisation of the set-up=3> design of a new cell allowing cooling,=» automation (automatic data-acquisition),=> automatic measurement of the activity.
0 Blank test for a thorough physico-chemical analysis of the clay core.
19
9. References
1 P.W. Atkins, Physical Chemistry, Oxford University Press, Oxford (1984), pp. 889.2 A.T. Yeung, in Advances in Porous Media 2, Ed. M.Yavuz Corapcioglu, Elsevier ScienceBV(1994), pp. 309.3 J.K. Mitchell, Fundamentals of Soil Behaviour, John Wiley & Sons Inc. (1993), pp. 228.4 D.N. Heiger, High Performance Capillary Electrophoresis - An Introduction, HewlettPackard Company (1992).5 Y.B. Acar, J. Hamed, Transportation Research Board, Record 1312, Washington DC (1991),153.
6 Y.B. Acar, A.N. Alshawabkeh, Env. Sci. Technol. 27(2), 2638 (1993).7 L.I. Khan, M.S. Alam, J. Env. Eng. 120(6), 1524 (1994).8 R.P. Shapiro, R.F. Probstein, Env. Sci. Technol. 27(2), 283 (1993).9 D. Gabrera-Guzman, J.T. Swartzbaugh, A.W. Weisman, J. Air Waste Manage. Assoc. 40,1670(1990).10 B.A. Segall, C.J. Bruell, J. Env. Eng. 118(1), 84 (1992).1' I.A. Sobolev, L.B. Prozorov, V.V. Martyanov, Radioactive Waste Management andEnvironmental Remediation - ASME (1995), pp. 1489.12 M.F. Buehler, J.E. Surma, J.W. Virden, in Metals and Materials Waste Reduction,Recovery and Remediation, Eds. K.C. Liddell, R.G. Bautista and R.J. Orth, The Minerals,Metals and Materials Society (1994), pp. 111.13 P.F. Grath, R.D. Hooton, Cement and Concrete Research 26(8), 1239 (1996).14 I. Heinemann, G.H. Frischat, Physics and Chemistry of Glasses 34(6), 225 (1993).15 E. Mebauer, P. Siipitz, I. Willert, Phys. Stat. Sol. (A) 43, 451 (1977).16 A.P. Shapiro, P.C. Renaud, R.F. Probstein, Physicochemical Hydrodynamics 11(5-6), 785(1989).17 Y.B. Acar, R.J. Galo, G.A. Purnam, J. Hamed, R.L. Wong, J. Env. Sci. Health A25(6), 687(1990).IK Y.B. Acar, A.N. Alshawabkeh, R.J. Gale, Waste Management 13, 141(1993).19 Y.B. Acar, L. Haider, J. Geotechnical Engineering 113(7), 1031 (1990).20 R.A. Jacobs , M.Z . Sengun, R.E. Hicks , R.F. Probstein, J. Env. Sci. Health A29(9) , 1933(1994) .21 M . Aertsens , Private Communica t ions .22 C.W. Fetter, Contaminant Hydrogeology, Macmillan Publishing Company, New York(1993), pp. 43.2 S.T. Horseman, J.J.W., Higgo, J. Alexander, J.F. Harrington, Water, Gas and SoluteMovement through Argilliceous Media, OECD Nuclear Energy Agency, Report CC-96/1(1996).24 P.N. Henr ion , M . Monsecour , A. Fonteyne , M . Put, P. De Regge , Radioact ive Was teM a n a g e m e n t and the Nuclear Fuel Cycle 6(3-4) , 313 (1985).25 P. D e Canniere , H. Moor s , P . Lolivier, P. D e Preter, M. Put, Labora tory and in situmigrat ion exper iments in the B o o m Clay, European Commiss ion , Nuclear Science andTechnology , Final report, E U R 1 6 9 2 7 E N (1996) .26 M.J. Put, M . Monsecour , A. Fonteyne , H. Yoshida, Mat . Res . Soc. S y m p . Proc . 212 , 823(1991) .