Responsible resource management in hotels - DiVA Portal
265
Responsible resource management in hotels – attitudes, indicators, tools and strategies Paulina Bohdanowicz Doctoral Thesis School of Industrial Engineering and Management Department of Energy Technology Royal Institute of Technology Stockholm 2006
Transcript of Responsible resource management in hotels - DiVA Portal

Responsible resource management in hotels – attitudes, indicators, tools and strategies
Paulina Bohdanowicz
Doctoral Thesis
School of Industrial Engineering and Management
Department of Energy Technology
Royal Institute of Technology
Stockholm 2006

ii
Akademisk avhandling som med tillstånd av Kungliga Tekniska Högskolan i Stockholm framlägges till offentlig granskning för avläggande av teknologie doktorstexamen Måndagen den 30 Oktober 2006, kl. 10.00, sal FR4, Alba Nova, Roslagstullsbacken 2, Kungl Tekniska Högskolan, Stockholm. Huvudhandledare är Professor Björn Palm. Biträdande handledare är Teknologie Doktor Ivo Martinac. Fakultetsopponent är Professor Walter Jamieson, University of Hawai’i, USA.
Projektet är finansierat av Energimyndigheten Trita REFR Report No. 06/54 ISSN 1102-0245 ISRN KTH/REFR/R-06/54-SE ISBN 91-7178-451-9 © Paulina Bohdanowicz, www.greenthehotels.com, October 2006 This report was printed on the ISO 14001 certified Xerox machines and paper. And the printing office US-AB is quality certificated with ISO 9001:2000.

iii
“If green is the new black – it is safe to say that it is not a flashy trend but the fashion of the future.”
Jeff Slye, Business Evolution Consulting

v
Abstract Hotels constitute one of the main, and still expanding, pillars of the tourism sector and are highly unique among other commercial buildings. Resource intensive and frequently inefficient systems and operational routines applied in the sector, result in considerable environmental impact and indicate an urgent need for more environmentally sound practices and products in the hotel industry. A certain level of activity in the area of reducing resource use has been observed for quite some time but the motivation for this was related to cost-benefit issues rather than the environment. Furthermore, most of the initiatives are still considered to be best practice case studies and not daily routines. The constantly increasing prices of basic commodities, such as energy resources and water, encourage the implementation of energy and water efficiency and conservation measures in hotel facilities. To this end, numerous guidelines and initiatives have been produced by hotel-related organisations. The study of attitudes among 610 European hoteliers indicated that, at the moment, the level of environmental awareness among hotel managers is not high enough to introduce significant changes, although attitudes differ depending on the country of origin and the corporate policy. The prospects of significant cost savings, as well as customer demand were identified as the most likely parameters to enhance environmental responsibility among hoteliers. The popularity of CSR reporting and sustainability indices, especially among the larger companies, leads the author to believe that the industry is preparing to change. Many of the companies running hotels are also reporting their environmental management goals and indicators of environmental performance, while benchmarking and all types of comparison league tables are gaining popularity. There is, however, no system or methodology of data collection and monitoring that is universally accepted or applicable throughout the hotel sector. Furthermore, the accuracy and validity of the published performance indicators and benchmarks is widely debated due to large variations in the figures reported. The analyses performed on data from over 180 upscale and mid-market European chain hotels (Hilton International and Scandic) indicated that even among relatively uniform (service-wise) hotels the amenities offered did influence consumption, further complicating the concept and applicability of uniform benchmarking and resource consumption modelling. It was thus concluded that, creating a uniform model for all hotels is almost impossible, or would require a significant amount of very detailed input data, and that the results could still be highly inaccurate. Instead, it was suggested that it might actually be more accurate to develop models for individual hotels. Such an approach would allow for the modelling of the behaviour of all types of hotels with no size, type of services or standard limitations. Multi-variate step-wise regression analyses performed on individual Scandic hotels in Sweden indicated that energy consumption was dependent on the outdoor air temperature/actual heating degree days, while water consumption was mainly influenced by the number of guest-nights sold. Experience gained by the author during the process of the Hilton Environmental Reporting system upgrade allowed for the formulation of a set of rules of thumb that ought to be followed in the design of similar schemes. The experience of various regions and numerous companies also suggests that well designed and implemented environmental and resource management programs bring significant benefits at an individual as well as a corporate level. This study provides an indication of the strategies that can be used by various stakeholders in the process of development and implementation of such programs. This research further suggests that future developments in environmental performance indicators and benchmarking may best be served by disaggregating hotels into modules (such as guest-rooms, catering outlets, conference centres) and developing consumption models and best practice indicators for these particular components. The individual efficiencies/performance indicators should then be combined and weighted to provide a just overall evaluation of a facility that could then be compared to a benchmark (developed in the same manner). In a similar manner, sustainability assessment schemes and indicators for destinations and communities could be developed. However, more accurate and differentiated knowledge of the individual performance of sub-systems is necessary to proceed with such an alternative. In addition, the methodologies for data collection and reporting procedures, at all levels of the company and sector, need to be standardized and detailed. Keywords: hotels, energy and water management, energy and water conservation, environmental awareness, environmental reporting, performance indicators, consumption modelling, benchmarking

vii
Acknowledgements I wish to express my sincerest gratitude to my supervisor, Dr. Ivo Martinac, for providing me with the opportunity of joining his research team and sharing his profound knowledge with me. His constant support, encouragement and positive criticism have been very helpful to me in completing this work. Our valuable scientific and non-scientific discussions were also highly appreciated and will always be remembered. I would like to express my deep thanks and sincere appreciation to my huvudhandledare, Professor Björn Palm from KTH, and to Professor David M. Stipanuk from Cornell University for their support and valuable comments on this work. I would like to thank my colleagues, Vlasta Zanki-Alujević, Aumnad Phdungsilp and Branko Simanic for providing a friendly atmosphere, unlimited help and many discussions. I am very obliged to the entire group at the Department of Energy Technology, KTH, especially Inga Du Rietz, Hans Jonsson and Marianne Salomon, who have shared their friendship with me and helped out in various aspects during my studies here. I would like to thank Jan Peter Bergkvist from Hilton International and Scandic for giving me the opportunity to join the Hilton family, gain experience in real business life and be a part of the Hilton Environmental Reporting development team. I would also like to acknowledge the assistance of all Hilton and Scandic team members and Addsystems team in verifying the information in the Hilton Environmental Reporting database and helping to upgrade the system and make it more user-friendly. I would like to thank Martin Blaszk for the proof-reading of my thesis and Katarzyna Rylska for her help in collecting hotel addresses for the hotel surveys. I am grateful to Birger Söderström and Tony Chapman for their technical support and for frequently rescuing my computers. I would like to acknowledge financial support from the Swedish Energy Administration. I would like to thank my friends in Poland, especially Anna & Marcin Skarbek, as well as Katarzyna Rylska, for their unlimited friendship, support and encouragement. Most importantly, I would like to thank my Parents for their never-ending support, love and belief in me. Last but not least, I am deeply grateful to Salam for his great emotional and scientific support, patience and understanding.
Stockholm/Gdańsk, September 2006

ix
List of publications The thesis is based on the following papers:
I. Bohdanowicz P., Martinac I. (2003), Attitudes towards sustainability in chain hotels – Results of a European survey. In: Proceedings of the CIB International Conference on Smart and Sustainable Built Environment, 19-21 November 2003, Brisbane, Australia.
II. Bohdanowicz P., Zanki-Alujevic V., Martinac I. (2004), Attitudes towards environmental responsibility among Swedish, Polish and Croatian hoteliers. In: Proceedings of the BEST Sustainable Tourism Think Tank IV: "Sustainability and Mass Destinations: Challenges and Possibilities", 1-4 July 2004, Esbjerg, Denmark.
III. Bohdanowicz P. (2005), European hoteliers’ environmental attitudes: Greening the business. The Cornell Hotel and Restaurant Administration Quarterly 46, 188-204.
IV. Bohdanowicz P. (in press), Environmental awareness and initiatives in the Polish and Swedish hotel industries – survey results. International Journal of Hospitality Management.
V. Bohdanowicz P., Simanic B., Martinac I. (2004), Environmental education at Scandic hotels – approach and results. In: Proceedings of the Regional Central and Eastern European Conference on Sustainable Building (SB04), 27-29 October 2004, Warszawa, Poland.
VI. Bohdanowicz P., Simanic B., Martinac I. (2005), Environmental training and measures at Scandic hotels, Sweden. Tourism Review International 9(1), 7-19.
VII. Bohdanowicz P., Simanic B., Martinac I. (2005), Sustainable hotels - environmental reporting according to Green Globe 21, Green Globes Canada / GEM UK, IHEI benchmarkhotel and Hilton Environmental Reporting. In: Proceedings of Sustainable Building (SB05) Conference, 27-29 September 2005, Tokyo, Japan, 1642-1649.
VIII. Bohdanowicz P., Martinac I. (in press), Determinants and benchmarking of resource consumption in hotels – case study of Hilton International and Scandic in Europe. Energy and Buildings.
IX. Bohdanowicz P., Martinac I., A study of resource consumption and modelling in mid-market chain hotels in Stockholm. Submitted to Building and Environment.
X. Bohdanowicz P. (2006), A case study of Hilton Environmental Reporting as a tool of Corporate Social Responsibility. Accepted for publication in Tourism Review International.
Other publications related to the topic not included in the thesis. Conference papers (peer reviewed):
1. Bohdanowicz P., Curie-Kallhaunge A., Martinac I. (2001), Energy-efficiency and conservation in hotels – towards sustainable tourism. In: Proceedings of the 4th International Symposium on Asia Pacific Architecture, University of Hawai’i at Manoa, 5-7 April 2001, Honolulu, USA.
2. Bohdanowicz P., Curie-Kallhaunge A., Martinac I., Rezachek D. (2001), Renewable energy for sustainable tourism. In: Proceedings of the International Conference for Renewable Energy and Energy Education – CIER 2001, 11-14 September 2001, Havana, Cuba.
3. Rezachek D., Martinac I., Bohdanowicz P. (2001), Energy efficiency and renewable energy use in the hotel industry – two case studies (Hawaii and Sweden). In: Proceedings of the Solar World Congress – ISES 2001, November 2001, Sydney, Australia.

x
4. Bohdanowicz P., Martinac I. (2002), Thermal comfort and energy saving in the hotel industry. In: Proceedings of the 15th Conference on Biometeorology and Aerobiology Joint with the 16th International Congress on Biometeorology, 27 October – 1 November 2002, Kansas City, USA.
5. Bohdanowicz P., Simanic B., Martinac I. (2004), Environmental training and measures at Scandic Hotels, Sweden. In: Proceedings of the BEST Sustainable Tourism Think Tank IV: "Sustainability and Mass Destinations: Challenges and Possibilities", 1-4 July 2004, Esbjerg, Denmark - Received an Outstanding Paper Award from the BEST Education Network.
6. Bohdanowicz P., Simanic B., Martinac I. (2004), Sustainable hotels – eco-certification according to EU Flower, Nordic Swan and the Polish Hotel Association. In: Proceedings of the Regional Central and Eastern European Conference on Sustainable Building (SB04), 27-29 October 2004, Warszawa, Poland.
7. Bohdanowicz J., Bohdanowicz P. (2004), Stymulatory ekonomiczne i prawne polityki ekorozwoju dla turystyki (Economic and political stimulators for a sustainable development policy in tourism – in Polish). In: Proceedings of Główne problemy badawcze i metodologiczne współczesnej politologii w Polsce (Main research and methodological problems of modern political science in Poland), 8-10 November 2004, Władysławowo, Poland.
8. Bohdanowicz P. (2006), Hilton Environmental Reporting as a tool of Corporate Social Responsibility. In: Proceedings of the BEST Sustainable Tourism Think Tank VI: "Corporate Social Responsibility for Sustainable Tourism", 13-16 July 2006, Girona, Spain - nominated for an Outstanding Paper Award by the BEST Education Network.
Articles in academic journals (peer reviewed): • Bohdanowicz P. (2005), Zasady ekopolityki w turystyce (Rules of eco-politics in tourism).
Cywilizacja i Polityka 3, 304-315. Articles in branch journals (peer reviewed):
1. Bohdanowicz P. (2003), Zielone hotele przynosza zyski (Green hotels bring profits – in Polish). Świat Hoteli 7(24), 26-27.
2. Bohdanowicz P. (2004), Zielone certyfikaty – Kwiat EUropejski (Green certificates – EU Flower – in Polish). Doradca Hotelarza 3, 18-21.
3. Bohdanowicz P. (2004), Zielone certyfikaty – Kwiat EUropejski – Kryteria obowiązkowe (Green certificates – EU Flower – Mandatory criteria – in Polish). Doradca Hotelarza 4, 8-9.
4. Bohdanowicz P. (2004), Zielone certyfikaty – Kwiat EUropejski – Kryteria obieralne (Green certificates – EU Flower – Optional criteria – in Polish). Doradca Hotelarza 5, 1-3.
5. Bohdanowicz P. (2004), Hotele a środowisko – przykład Szwecji, Polski i Chorwacji (Hotels and the environment – case study of Sweden, Poland and Croatia – in Polish). Doradca Hotelarza 8, 4-5.
6. Bohdanowicz P. (2004), 10 lat polityki proekologicznej w sieci Scandic (10 years of environmental policy at Scandic – in Polish). Doradca Hotelarza 12, 2-4.
7. Bohdanowicz P., Simanic B., Martinac I. (2005), Environmental action in Scandic hotels. Sustainable Building, an Independent Journal on Building and the Environment 1, 10-13.

xi
Other publications. Licenciate thesis: • Bohdanowicz P. (2003), A study of environmental impacts, environmental awareness and pro-ecological
initiatives in the hotel industry. Stockholm: Royal Institute of Technology. Book: • Bohdanowicz P. (2005), Turystyka a świadomość ekologiczna. Toruń: Wydawnictwo Adam
Marszałek. Reports: • Hilton International & Scandic, Addsystems (2006), Hilton Environmental Reporting Manual
for Standard Users. Stockholm. • Hilton International & Scandic, Addsystems (2006), Hilton Environmental Reporting Manual
for Super Users. Stockholm.

xiii
Definitions Attitudes - cognitive structures for organising one's experience of the world, comprised of knowledge of or beliefs about an object or topic; a positive or negative evaluation of that object or topic; and a direction or imperative on how to behave when the object or topic is encountered (Jafari, 2000). Benchmarking - a process whereby a business enterprise identifies industry leaders, compares products, services and practices, then implements procedures to upgrade its performance to match or surpass its competitors, within this technique standards are set in key metrics defined by the organisation. Benchmarking has a ready application in tourism where examples include the accommodation guides published by motoring organisations from which the ratings may provide a stimulus towards improved facilities and performance for participants (Jafari, 2000). Best practice environmental management – a means of achieving sustainable growth in a competitive world. Requires radically different organisational structures and attitudes designed to bring about continuous improvement in a firm's environmental performance. Environmental excellence is fostered by enlightened management practices which incorporate new, cleaner technologies, and an emphasis on resource conservation, recycling, reuse and recovery, in progress towards sustainability (Jafari, 2000). Chain hotels – an organisation that has more than one unit of similar concept or theme. Each of the properties is contracted on a continuing basis to be responsible for putting in place at least one management function in the whole system. The affiliation between a hotel and a chain can be of several types, and these exhibit different degrees of control of the chain over its hotels. Chain hotels are predicted to be the predominant type of hotel unit worldwide (Jafari, 2000). Conservation - a philosophy governing the manner and timing of resource use, and may be defined as managing the resources of the environment - air, water, soil, mineral resources and living species, including humans - so as to achieve the highest sustainable quality of life (Jafari, 2000). Corporate Social Responsibility – business actions that appear to further some social good, beyond the interests of the firm and that which is required by law (McWilliams & Seigal, 2001) Degree day – difference in temperature between the outdoor mean temperature over a 24-hour period, and the given base temperature of a building space. Cooling and heating degree days can be distinguished. Cooling degree-days – sum of the degree days for cooling, using a common base of 18oC in Europe (23oC in the US and 25oC in Canada), that is used with other factors to evaluate the energy requirements of a cooling season. Heating degree days - sum of the degree days for heating, using a common base of 18oC that is used with other factors to evaluate the energy requirements of a heating season (ASHRAE, 2005). Energy consumption – comprises energy directly consumed in running the hotel building; other uses, such as business vehicles, are excluded. Energy use is defined as consumer (secondary) energy in this context and therefore any losses for transformation, transmission or distribution of primary energy are excluded (Becken & Cavanagh, 2003). Environmental education – process concerned with developing people who are knowledgeable about the physical, social and economic environment of which they are a part, so that they become concerned about environmental problems and motivated to act responsibly in enhancing the quality of their environment as well as their lives. Applies to businesses as well as tourists and employs traditional and modern (interactive) instruments of education (Jafari, 2000).

xiv
Environmental management system (EMS) - a framework for organisations to manage the environmental impacts of their operations. It involves the application of contemporary concepts to the management of business aspects associated with such significant impacts. An EMS adopts contemporary business management concepts by using a framework to manage environmental concerns which involves policy commitments, defining objectives, targets and programs, monitoring performance and conducting reviews (Jafari, 2000). Facilities management - the management of building, plant and equipment to ensure they are maintained in good condition, or the contracting out of this function to a contractor, who will manage the facilities on behalf of the owner/operator. In relation to tourism and its sectors, the two main elements of facilities management are routine cleaning, usually carried out on a daily or weekly basis, and routine maintenance, based either on usage or cycle time (Jafari, 2000). Hospitality - the provision of overnight accommodation for people staying away from home (lodging), and the provision of sustenance for people eating away from home (food service). Lodging is made up of two main sectors: commercial lodgings are predominantly hotels, while institutional lodgings are comprised of hospitals, universities, prisons and so on (Jafari, 2000). Hotel - a tourism business unit which, as its main endeavour, rents room accommodation to the general public for a minimum duration of one night. Frequently this activity is supported by the provision of food and drink and other related services. Hotels vary in the number of rooms available, the level of service provision, target markets, tariff charged and type of ownership and operation (Jafari, 2000). Integrated environmental management - a holistic approach to managing environmental impacts which considers the range of business activities and how they interact to contribute to various environmental impacts. The process involves management of a range of environmental impacts arising from an organisation's activities. It is aimed at managing biophysical as well as socio-cultural impacts. It aims to mitigate or minimise a range of cumulative environmental impacts (Jafari, 2000). Model - an attempt to identify key variables in a situation and the relationship that exists among them. Model building in the hospitality sector seeks to understand a complex relationship and to aid the management of a place or process (Jafari, 2000). Performance indicators - comparative measures which provide a systematic means of assessing the progress of an enterprise, organisation, project or program, towards meeting stated goals and objectives and relative to established and accepted levels of achievement. They are commonly used to monitor and evaluate, in quantitative terms, the success or otherwise of an undertaking (Jafari, 2000). Indicators can be based on qualitative or quantitative information, but they need to have scientific credibility, be measurable, easily understood, cost-effective, clear and also serve as a robust, sensitive indicator of environmental change and potential problems (WTO, 2004). Resource management – (in organizational studies) the efficient and effective deployment of an organization's resources when they are needed. Such resources may include financial resources, inventory, human skills, production resources, or information technology. In conservation - a set of practices pertaining to maintaining natural systems integrity. Examples of this form of management are air resource management, soil conservation, forestry, wildlife management and water resource management. The broad term for this type of resource management is natural resource management – NRM (Wikipedia contributors, 2006). Room-night, guest-night - the stay of one hotel guest for one night (Jafari, 2000).

xv
Abbreviations and acronyms AH&LA – American Hotel and Lodging Association APAT – Italian National Agency for the Protection of the Environment and for
Technical Services BEST-en – Best Enterprises for Sustainable Tourism - Education Network DEHOGA – German Hotel and Restaurant Association EC – European Commission EMS – Environmental Management System EU – European Union GHA – Green Hotel Association of Canada GRI – Global Reporting Initiative HCIMA – Hotel and Catering International Management Association HER – Hilton Environmental Reporting HORESTA – Danish Hotel and Restaurant Association HOTREC – Hotels, Restaurants and Cafés in Europe HVAC – Heating, Ventilation and Air Conditioning IBLF – the Prince of Wales International Business Leaders’ Forum IEA – International Energy Agency IH&RA – International Hotel & Restaurant Association IHEI – International Hotel Environmental Initiative SHR – Swedish Hotel and Restaurant Association SMHI – Swedish Meteorological and Hydrological Institute UN – United Nations UNEP – United Nations Environmental Program UNESCO – United Nations Educational, Scientific and Cultural Organization and the
Commission of European Communities UNWTO – (United Nations) World Tourism Organisation US DOE – United States Department of Energy US EIA – United States Energy Information Administration US EPA – United States Environmental Protection Agency WAVE – Water Alliance for Voluntary Efficiency WTTC – World Travel and Tourism Council WWF – World Wildlife Fund

xvi
Symbols
Δt – absolute value of temperature difference between the design indoor temperature (tdi) and average monthly outdoor temperature (tmo): modi ttt −=Δ , tdi=18oC (according to Boverket, 2002) [oC]
A – hotel floor area [m2] E – total annual or monthly energy consumption [MWh] F – F statistic, the regression mean square divided by the residual mean square fc – number of food covers sold gn – number of guest-nights sold hc – variable assuming the value of 1 for hotels with an on-site health club and 0 for
those without l – amount of laundry washed on-site [kg] lg – total area of landscaped grounds [m2] Se – standard error of the estimate sp – variable assuming the value of 1 for hotels with spa and pool facilities and 0 for
those without w – quantity of water consumed monthly – empirical data [m3] W – total annual or monthly water consumption [m3]

xvii
Table of Contents
ABSTRACT ........................................................................................................................V
ACKNOWLEDGEMENTS............................................................................................VII
LIST OF PUBLICATIONS............................................................................................. IX
DEFINITIONS ............................................................................................................XIII
ABBREVIATIONS AND ACRONYMS ........................................................................XV
SYMBOLS ..................................................................................................................... XVI
TABLE OF CONTENTS............................................................................................XVII
1. INTRODUCTION..........................................................................................................1
1.1. HOTELS AND THE ENVIRONMENT............................................................................................... 1 1.2. RESPONSIBLE HOSPITALITY DEVELOPMENT .............................................................................. 2 1.3. RESPONSIBLE RESOURCE MANAGEMENT IN HOTELS ................................................................ 5 1.4. ENVIRONMENTAL PERFORMANCE INDICATORS, MEASUREMENTS AND BENCHMARKING .. 7
2. AIM AND SCOPE OF THE THESIS .......................................................................... 9
3. BACKGROUND TO THE STUDY ............................................................................. 11
4. METHODOLOGY .......................................................................................................13
4.1. LITERATURE SURVEY ...................................................................................................................13 4.2. SURVEY AMONG EUROPEAN HOTELIERS AND ENVIRONMENTAL MANAGERS AT HOTEL CORPORATIONS ....................................................................................................................................13 4.3. STATISTICAL ANALYSIS OF DATA CONTAINED IN THE HILTON ENVIRONMENTAL REPORTING DATABASE.......................................................................................................................15 4.4. COMMUNICATION WITH HER USERS DURING THE UPGRADE PROCESS OF HER...............17
5. ENVIRONMENTAL ATTITUDES AMONG EUROPEAN HOTELIERS (PAPERS I-IV) .................................................................................................................. 19
5.1. THE SUSTAINABLE DEVELOPMENT AND OPERATION OF THE HOSPITALITY SECTOR.........19 5.2. ENVIRONMENTAL POLICY INSTRUMENTS APPLICABLE TO HOTELS ......................................19 5.3. ENVIRONMENTAL AWARENESS OF EUROPEAN HOTEL MANAGERS......................................20 5.4. DRIVING FORCES FOR CHANGE..................................................................................................25 5.5. FINDINGS.......................................................................................................................................29
6. ENERGY AND WATER CONSUMPTION INDICATORS AND MODELLING (PAPERS V-IX).................................................................................................................31
6.1. RESOURCE CONSUMPTION OF HOTELS AND ENVIRONMENTAL PERFORMANCE INDICATORS..........................................................................................................................................31 6.2. COMMONLY APPLIED MODELS OF RESOURCE CONSUMPTION ...............................................35 6.3. COMPARISON OF PERFORMANCE AMONG DIFFERENT CHAINS, AND WITHIN CHAIN IN ONE LOCATION .............................................................................................................................................37 6.4. MODELLING OF ENERGY AND WATER CONSUMPTION AT INDIVIDUAL FACILITIES ...........42

xviii
6.5. FINDINGS.......................................................................................................................................46
7. ENVIRONMENTAL REPORTING AND PERFORMANCE BENCHMARKING TOOLS AND STRATEGIES (PAPER X) .......................................................................49
7.1. EXISTING TOOLS FOR ENVIRONMENTAL BENCHMARKING IN THE HOSPITALITY SECTOR 49 7.2. TRANSPARENCY, USER-FRIENDLINESS AND SIMPLICITY OF THE SYSTEM .............................57 7.3. USEFUL FEEDBACK AND SUPPORT IN THE OUTPUT PHASE.....................................................60 7.4. STRATEGIES FOR THE IMPLEMENTATION OF MORE RESPONSIBLE BUSINESS PRACTICES...65 7.5. FINDINGS.......................................................................................................................................67
8. CONCLUSIONS AND FUTURE WORK ...................................................................69
8.1. CONCLUSIONS...............................................................................................................................69 8.2. FUTURE WORK ..............................................................................................................................71
9. REFERENCES .............................................................................................................73

1
1. Introduction
1.1. Hotels and the environment Commercial lodgings have existed since the dawn of human civilisation. Today hotels, amounting to over 300 000 facilities worldwide, represent one of the most important sectors of the travel and tourism industry, the world’s single largest employer (Olsen et al., 2000). Compared to most other categories of commercial buildings, lodging facilities are unique, with regard to operational schemes, the types of amenities and services offered, as well as the resulting patterns of natural resource use. As a consequence, hotels interact with the environment at every stage of their life cycle, and this influence is often negative as summarized in Hunter & Green (1995) and Bohdanowicz (2003 and 2005). Hotel facilities rank among the top five in terms of energy consumption in the commercial/service building sector (minor only to food services and sales, health care and certain types of offices) (US EIA, 1998). Although no collective data is available on global energy consumption in the hotel sector, Gössling (2002) estimated that 97.5 TWh (351.1 PJ) of energy was used in hotel facilities worldwide in 2001. Furthermore, European hotels were estimated to use a total of 39 TWh in 2000 (CHOSE, 2001). Considering that almost 80% of primary energy in the world is derived from fossil sources (IEA, 2005), the sector’s contribution to global environmental problems, including global warming and climate change is not negligible. Bohdanowicz (2005 - Paper III) estimates that European hotels emit more than 10 Mt of carbon dioxide annually, while global hotel-based CO2 emissions were assumed to be at the level of 55.7 Mt in 2001 (Gössling, 2002). At the same time, hotel businesses and tourism in general, are a potential victim of climate change, with its changing weather and precipitation patterns as well as rising ocean levels (as discussed during the Tourism and Climate Change conference in Djerba in 2003: WTO Djerba, 2003; Viner & Becken, 2003; Gosline, 2005; Hall & Higham, 2005). While the research conducted did not provide any collective data on water consumption in the global hotel industry, the figures are assumed to be three times those for the American lodging industry1, i.e. in the range of 450-700 million m3 of water per annum (estimates based on figures in Davies & Cahill, 2000). Most of the water consumed is released in the form of sewage, unfortunately often without adequate treatment. Waste generation is another (often highly visible) impact the hotel industry has on the environment. According to an International Hotel Environmental Initiative (2002) estimate, a typical guest produces in excess of 1 kg of waste per day (figures released by hotels being somewhat higher), amounting to millions of tons of waste generated each year in hotels worldwide. These figures indicate an urgent need for more environmentally sound practices and products in the hotel industry, an industry which, for many years, has neglected a number of aspects of environmental compatibility in design, as well as responsible resource management and business practices. Hotels have been, and continue to be built as landmarks, with the design requiring a substantial amount of energy and other resources used by the various mechanical systems to make them habitable (Genot et al., 2001). In addition, the services offered and the operational routines in place rarely incorporate resource efficiency or conservation, leading to a significant amount of energy and water used in this sector being wasted, and leaving ample room for improvements.
1 These assumptions are based on one third of all hotel rooms being located in North America (Olsen et al., 2000), and all world regions having relatively similar industry profiles, eventual inequalities between regions levelling out on a global scale.

2
1.2. Responsible hospitality development In recent decades, the industry has been slowly increasing its efforts to embark on a more sustainable path. By the late 1970s the World Tourism Organisation (UNWTO) had established the Environmental Committee, while the 1992 Earth Summit in Rio identified tourism as one of the priority areas for sustainable development. Over the years, a number of documents aimed at incorporating environmental and socio-cultural responsibility into tourism and hotel business practice have been developed (summarized in Hawkins & Holtz, 2001; Green Hotelier 36, 2005; Bohdanowicz, 2005). Among the most significant ones are the 1995 Lanzarote Charter for Sustainable Tourism (issued jointly by the UNWTO, the United Nations Environmental Program - UNEP, the United Nations Educational, Scientific and Cultural Organization - UNESCO and the Commission of European Communities), and Agenda 21 for the Travel and Tourism Industry: Towards Environmentally Friendly Sustainable Development (launched in 1996 as a result of co-operation between the World Travel and Tourism Council - WTTC, UNWTO, and the Earth Council), as well as the Millennium Development Goals (adopted by the United Nations in September 2000 following the Millennium Declaration, and to be met by 2015), and 2003 Djerba Declaration on Tourism and Climate Change. The Commission on Sustainable Development as well as the European Commission produced a significant number of documents on the need to pursue more sustainable tourism development (European Parliament, 1990; CSD, 1999a-d; Pils, 2000; European Commission, 2003). As well as this, environmental NGOs, major tourism and hotel organizations and associations are launching initiatives aimed at making the hotel business more environmentally responsible. The main actors promoting sustainable hotel development and operation include: the International Hotel and Restaurant Association – IH&RA, the International Hotel Environmental Initiative – IHEI, UNEP, WTTC, UNWTO, the European Commission, and the World Wildlife Fund – WWF, to name but a few. International and national tourism associations (i.e. the Hotels, Restaurants and Cafés in Europe – HOTREC, the American Hotel and Lodging Association – AH&LA, the Green Hotel Association of Canada – GHA, the Danish Hotel and Restaurant Association – HORESTA, the German Hotel and Restaurant Association – DEHOGA, the Swedish Hotel and Restaurant Association – SHR, and others) are becoming increasingly active in environmental issues. There is however a universal agreement that, as for now, global policy structures and international environmental solidarity, although growing in strength, are still too weak to enact a significant change. In addition, in many countries, environmental issues are not a top priority (Conner, 2000; Cunningham, 2005; Trung & Kumar, 2005; Mensah, 2006). It is also stressed that there is a need for co-operation between the private and public sectors in the development of sustainable hospitality and tourism industries. A certain level of activity in reducing resources use has been observed for quite some time now. The motivation for these actions however has been related to cost-benefit issues rather than the environment (IHEI, 1993; Stipanuk, 1996; Stipanuk & Ninemeier, 1996; Kirk, 1998; Forbes, 2001; Loehr, 2002; Bowe, 2005, and most published best practice case studies). Evidence collected by Kasim (2004) documented that the incorporation of environmental and social measures as part of company policy was more common among large hotel corporations. It was predominantly in the 1990s that the major hotel chains started taking on environmental responsibilities and developing their own sustainability programs (Kay, 1997), i.e. Environmental Policy (1989) and Environmental Standard (1997) at Radisson SAS, The Fairmont Green Partnership and Green Teams at Fairmont Hotels and Resorts (1990, former Canadian Pacific Hotels), Environmental Program and Resource Hunt Program at Scandic (1992, respectively 1996), Environmental Strategy and Principles at Restel Finland (1995), Hoteliers’ Environmental Charter at Accor International (1998), Environmentally Conscious Hospitality Operations (ECHO) at Marriott International (1998), as well as the initiatives at the Marco Polo (Green Means You), Taj Hotel Group (EcoTaj, Turn Green, Train the Trainer), and Whitbread, to name but a few, with some initiatives still emerging over the past six years, i.e. Conserving for Tomorrow at InterContinental Hotels Group (2000, former

3
SixContinents Hotels), Responsible Business at Radisson SAS Hotels & Resorts (2001), and we care! at Hilton International (2006). Similar time-frames can be established for the social responsibility actions, with some chains active as early as the 1990s, i.e. Regenerating Communities (1994) at Whitbread, Spirit to Serve Our Communities at Marriott International (1999), with others initiating their involvement post-2000, i.e. Scandic in Society at Scandic (2001), and the Street Children project at NH Hotels (2003). Many of these companies provide extensive information about their sustainability commitment, initiatives and achievements, on their corporate websites and in annual reports (Accor International, Banyan Tree, Club Méditerranean, Fairmont Hotels & Resorts, Forever Resorts, Jarvis Hotels Ltd., Radisson SAS, Hilton Hotels Corporation including Hilton International, Sol Mélia, Welcom Group Hotels), while others state the environment and its protection as one of the company’s core values and goals (D’Or Hotels, Iberostar, Pan-Pacific Hotels, Pansea-Orient Express), or list charity initiatives and organisations supported by them (Choice Hotels International, Delta Hotels, InterContinental Hotels Group). Nevertheless, most of the leading and state-of-the-art environmental practices are still only seen among individual hotels (i.e. Sånga Säby Course and Conference Centre in Sweden, Couran Cove Island Resort in Australia, The Orchid in India, and many other hotels), and do not represent the reality of mass-hotel operations (Meade & del Monaco, 2001; Meade & Pringle, 2001; Chen et al., 2005). Even among the independent establishments, larger hotels have been found to be at the forefront of environmental management (Wahab & Pigram, 1997; Álvarez-Gil et al., 2001), but the actions taken are often uncoordinated and disproportionate across the departments. This brings the dilemma of whether to “green Goliaths” (large corporations) or rather “multiply Davids” (individual facilities) (Wűstenhagen 1998 as cited in Becken et al., 2001). On the global scale only ca. 20% of hotels are brand affiliated, but the situation is highly differentiated among regions with the share of corporate hotels constituting less than 30% in Europe, but as high as 70% in the United States (Johnson & Iunius, 1999; APAT, 2002; WTTC et al., 2002). These types of businesses need to be approached in a different manner as discussed by Mandtke (1999), and represent varying potential in making a difference on a larger scale. Empirical studies in the area of environmental awareness, performance, management and protection are becoming more common as compared to a decade ago (Forte, 1994; Brown, 1996; Stipanuk, 1996; Stipanuk & Ninemeier, 1996; Ton et al., 1996; Kirk, 1997; Stabler & Goodall, 1997; Kirk, 1998; Kulesza, 1999; Álvarez-Gil et al., 2001; Forbes, 2001; Revilla et al., 2001; Céspedes-Lorente et al., 2003; Tzchenke et al., 2004; Brady, 2005; Chen et al., 2005; Trung & Kumar, 2005; Chan & Wong, 2006; Mensah, 2006). Most of this research is however limited to single locations, countries or brands. The most comprehensive investigations available on the topic are focused on Europe and include the Pricewaterhouse Coopers (2001) survey European hotel’s implementation of environmental policies (Clark & Siddall, 2001), and Greener Flag for greener hotels by Despretz (2001), as well as a series of studies performed in the framework of preparation for the European Union eco-label for tourism-related lodgings: Feasibility and market study for a European eco-label for tourist accommodations (FEMATOUR) by CREM & CH2M-HILL (2000), and reports prepared by ANPA (2001) and APAT (2002). The only study with a more global reach is the 1999 Worldwide Hotel Industry Study, prepared and published by Horwath International and Smith Travel Research (2000). Studies performed globally identified the different motivating factors that influence various organizations on their quest to become more environmentally responsible (Roarty, 1997; Polonsky et al., 1998; Foster et al., 2000; de Burgos-Jiménez et al., 2002). The drivers most frequently mentioned include:
• Costs rationalization, due to the increasing costs of utilities and maintenance related to physical plants (empirical evidence collected by Forte, 1994; Brown, 1996; Stipanuk, 1996; Stipanuk & Ninemeier, 1996; Ton et al., 1996; Kirk, 1997; Stabler & Goodall, 1997;

4
Forbes, 2001; Loehr, 2002; Tzchenke et al., 2004; Warnken et al., 2005; Paper III; Paper IV);
• Increasingly stringent environmental regulation, including the need for environmental and social performance reporting and transparency (Kirk, 1998; Revilla et al., 2001; Céspedes-Lorente et al., 2003; Green Hotelier 36, 2005; Chan & Wong, 2006);
• Corporate governance, managerial concern with ethics and competitive advantage – product and service differentiation based on the approach to the environment (Iwanowski & Rushmore, 1992; Álvarez-Gil et al., 2001; Paper I; Brady, 2005; Chen et al., 2005; Paper III; Chan & Wong, 2006; Mensah, 2006);
• Pressure from stakeholders, including consumers, environmental groups and “green” investors, such as banks and insurance companies (Kirk, 1998; Álvarez-Gil et al., 2001, Céspedes-Lorente et al., 2003).
Many studies have documented the definite concern of consumers with environmental issues, although corresponding consumer purchase behaviour regarding environmentally friendly products has not been found to be significant (Smith & Haugtvedt, 1997; Roarty, 1997; Kalafatis et al., 1999). According to Slye (2005), the ecological lifestyles market (LOHAS – Lifestyles of Health and Sustainability) in the United States alone was estimated at over 80 billion USD, with over 60 million consumers willing to use services and products of environmentally responsible companies. Within the tourism and hotel industry there is relatively little empirical research that proves the existence of a “green tourist” which can also explain their behaviour (Gustin & Weaber, 1996; Wight, 1997; Swarbroke & Hornan, 1999; Bohdanowicz, 2003; Kasim, 2004; Anavo & STI, 2005; Sustainable Travel Report, 2005; discussion related to the topic on [email protected] list in April 2005). It could thus be concluded that there is not enough societal pressure exerted on the hotel sector to induce the necessary change. However, it is noted that if major corporations communicated their preference for an environmental hotel product these could significantly motivate change in the industry (Conner, 2002). There is also a gap between good intent and practice in the hospitality sector as identified in some studies (case of Edinburgh reported by Kirk, 1998, and London reported by Knowles et al., 1999). The issue of environmental attitudes and initiatives in the European hotel sector will be discussed in more detail in Chapter 5. On the other hand, the concept of Corporate Social Responsibility (CSR) is one of a number of initiatives gaining increased interest among all businesses. CSR is broadly defined as “actions that appear to further some social good, beyond the interests of the firm and that which is required by law” (McWilliams & Seigal, 2001), or as “the continuing commitment by business to behave ethically and to contribute to economic development while improving the quality of life of the workforce, their families, the local community and society at large” (Green Hotelier 16, 1999). While discussing Social Corporate Responsibility a reference is frequently made to a triple bottom line concept which covers economic, as well as social and environmental benefits (Zadek, 2002). CSR is believed to be a way to reduce energy consumption and waste generation, as well as to save costs related to high labour turnover (Knox & Maklan, 2004). Businesses, especially some multinational corporations, use CSR as a means of building trust in their organisation and its products (Lafferty & Goldsmith, 2005), as well as an additional brand quality insurance (Werther & Chandler, 2005). In addition, CSR is increasingly used by businesses in differentiation and marketing strategies where it is believed to help secure a competitive advantage and enhance corporate reputation (Menguc & Ozanne, 2005). The majority of leading European companies publish reports on the social and environmental aspects of their operations, in addition to financial statements (BBC, 2004; Kolk, 2004). This also applies to the hotel industry, where interest in CSR and sustainability indices, such as Global Reporting Initiative (GRI), Dow Jones Sustainability and FTSE4Good indexes, is growing rapidly (WTTC, 2002).

5
As a result, the efficient and environmentally responsible operation of lodging facilities is slowly appearing on the business agenda of the hospitality industry.
1.3. Responsible resource management in hotels Considering the implementation of responsible and efficient resource use in the hospitality sector, two separate approaches can be identified (Figure 1.1). The first one considers the responsible design of buildings aiming to avoid the excessive use of resources by proper design. The second deals with operation and maintenance of existing facilities. Although hotel capacity increased by 25% between 1987-1997 and is expanding weekly (Kay, 1997), still the majority of operating hotels are existing, and frequently relatively old, buildings (Balaras et al., 2004; Dascalaki & Balaras, 2004). It has been further estimated that 75% of all environmental impacts created by the hotel industry can be attributed to the operational phase and the excessive consumption of local and imported non-durable goods, energy and water, followed by emissions released into the air, water and soil (APAT, 2002). In addition, the external costs of environmental pollution caused by hotels are increasingly being considered and investigated (Chan & Lam, 2001a-c & 2002). This calls for significant attention to be given to responsible resource management in the existing hotel stock, along with proper renovation and refurbishment practices.
Resource use and management(energy, water, consumables,
chemicals)
Design aspects(bioclimatic/passive design,refurbishment according to
sustainability standards)
Resource demand management(reduction of quantity of
resources required)
Resource supply management(incorporation of renewableenergy sources, rainwater
collection, water reuse,environment friendly materials
and consumables)
legislation, pressurefrom stakeholders and
environmentalorganizations,
awareness of the projectdevelopers
Operation & Maintenance(human influence on resource
use)
Housekeeping and maintenance(efficient use of available
resources to provide high qualityservice/product)
Preventive maintenance(behavioural changes, constant
upkeep of the installations,efficiency improvements,
monitoring and benchmarking)
legislation,pressure from stakeholders
and environmentalorganizations, awarenessof the management and
personnel
NEW HOTEL CONSTRUCTION EXISTING HOTEL FACILITY
Figure 1.1. Schematic approach to resource management in a hotel.

6
In response to the growing demand, many guides on how to responsibly manage facilities and conserve resources have been published worldwide. In line with the predominant need to improve current business practices, most of the guidelines focus on the operational and refurbishment stages (Fairmont Hotels & Resorts/Canadian Pacific Hotels, 1990; IHEI, 1993; EEO/BRE, 1994; IH&RA, IHEI, UNEP, 1995; CADDET, 1997; AH&LA, 2001; Scandic Hotels, 2001; Stipanuk, 2002; Accor, 2003; EII, 2003; ESCWA, 2003; Jamieson et al., 2003; Perera et al., 2003; Sweeting & Rosenfeld-Sweeting, 2003), with only a few considering the entire life-cycle of the hotel facility (Genot et al., 2001; Bohdanowicz, 2003; CI & IBLF, 2005). Apart from traditionally written guide-books and workshops organised by hotel associations, environmental NGO’s and academia, hotel managers and staff can now use modern media technology. Environmental training courses and materials are currently available as videos, or even interactive computer programs/presentations (i.e. US EPA Lodging Industry Virtual Hotel Tour available at http://pasture.ecn.purdue.edu/~epados/hotel/src/intro_f2.htm, Wu, 1997; or Hilton Eco-learning program available at www.hiltonecolearning.com). In addition, many hotel oriented initiatives have been established by various organisations. The most well known include the International Hotel Environmental Initiative launched by the Prince of Wales International Business Leaders’ Forum (IBLF), Energy Star for Hospitality by the United States Environmental Protection Agency (US EPA), as well as Green Globe 21 launched by the WTTC and IH&RA. Within the field of energy conservation and utilisation of renewable energy sources two European projects deserve attention. The HOTRES project aims at increasing the awareness of hotel managers of the need to switch to renewable energy resources (Karagiorgas et al., 2006). The XENIOS multi-media software, developed within the EU Altener project, was specifically designed to assist hotel managers in evaluating the condition of their building and the most cost-effective energy efficient renovation practices and also focuses on the incorporation of renewable energies (Dascalaki et al., 2003; Balaras et al., 2004; Dascalaki & Balaras, 2004). There are also a wide variety of eco-labels and eco-certificates available for the tourism and hotel sectors (the area of eco-labels in tourism and hospitality has been well researched and documented by groups surrounding Xavier Font and Martha Honey: Bass et al., 2001; Buckley, 2002; Font, 2002 and 2003; Bendell & Font, 2004; Font & Harris, 2004; Honey & Rome, 2001; Honey, 2001 and 2002; Honey & Steward, 2002; as well as the Ecotrans organisation 2001 & 2003; and Bohdanowicz et al., 2004; Bohdanowicz, 2004 a-c). However, the issue of the limited global impact of certification schemes has been frequently raised. A Synergy and WWF (2000) study of eco-labels concluded that “certification schemes for environmentally and socially responsible tourism can mislead consumers and often fail to guarantee high standards of environmental practice”. Xavier Font (2003), an expert on the topic, shared this point of view: “from a global governance point of view, the fact that at present, tourism [and hospitality] certification is resource-based and incentive-led, and not market-led, means that it has had little impact; [in addition] the confused message given to tourists (are we promoting a clean, unspoilt destination or a sustainable place?) has limited its power”. Nevertheless, labels and certificates are believed to be among the tools with the potential to positively change the market. Furthermore, most of the general resource saving initiatives and campaigns are available to the hotel sector, including US EPA Green Lights Program, US EPA Water Alliances for Voluntary Efficiency (WAVE), and Energy Innovators Initiative Canada, to name but a few. Widely recognized sustainability schemes, such as The Natural Step (Robèrt, 2002), Environmental Management Systems (ISO 14000 series), Life Cycle Analysis, or Six Sigma, are applied by the hospitality companies. Environmental issues relevant to the hotel industry are increasingly discussed at special seminars, workshops, think-tanks and conferences (Sustainable Hotels for Sustainable Destinations Conference, 2000, annual Think Tanks organised by Business Enterprises for Sustainable Tourism – Education Network – BEST-en). Additionally, an increasing number of articles presenting the relationship between hotels and the environment are being published

7
in branch and academic journals (Annals of Tourism Research, E! - The Environmental Magazine, Energy and Buildings, Green Hotelier, Hospitality Management, Hotel and Motel Management, Hotel Business Review that includes an entire section on Sustainable ‘Green’ Hotels, Hotelarz, International Journal of Contemporary Hospitality Management, International Journal of Hospitality Management, International Journal of Sustainable Tourism, Lodging Magazine, Świat Hoteli, The Cornell Hotel and Restaurant Administration Quarterly, Tourism Management, Tourism Review International). Many of the large companies are also reporting their environmental management goals and indicators of environmental performance. However, an important point, raised by de Burgos-Jiménez et al. (2002), needs to be mentioned here, namely the difference between environmental management and environmental performance and methods of measuring them. Environmental management refers to the type and means of implementing actions that aim at the reduction/control of the environmental impacts exerted by the company. Environmental performance quantifies the benefits and damage to the environment caused by business activity (i.e. specific energy and water use, waste generation, emission of greenhouse gases). According to de Burgos-Jiménez et al. (2002) “measuring environmental management would serve to detect the level to which measures related to protecting the environment are applied, while environmental performance would express the degree to which objectives related to the environment have been achieved”. In reality, a company could show its concern about the state of the environment by incorporating certain environmental management activities, but this would not imply that better environmental performance is immediately achieved (if at all). It is thus important to distinguish between these two concepts and collect appropriate information in each case, which has still not happened in this sector.
1.4. Environmental performance indicators, measurements and benchmarking The constantly increasing prices of basic commodities, such as energy resources and water, encourage the implementation of energy and water efficiency and conservation measures in hotel facilities (Stipanuk, 2001). For these programs to be successful, detailed and reliable information is required on the energy and water consumption in hotel buildings as a whole, as well as being relevant to the various end-users. In addition to this, consumption patterns and parameters crucial to resource use, need to be identified. Despite a relatively extensive literature on performance indicators in the international hotel industry (reviewed in Bohdanowicz, 2003), only a few studies investigated the influence of operational drivers on energy and water consumption, or developed models describing the use of resources in hotels (Feilberg & Livik, 1993; APEC, 1999; Noren, 1999; Deng & Burnett, 2000; Becken et al., 2001; Despretz, 2001; Deng & Burnett, 2002 a&b; Becken & Cavanagh, 2003; Chan et al., 2003; Deng, 2003). The accuracy and validity of the published performance indicators and benchmarks is however widely debatable due to large variations in the figures reported (de Burgos-Jiménez et al., 2002; Becken & Cavanagh, 2003; Warnken et al., 2005). Among the reasons for such a situation, the most commonly mentioned are the differences in methodology used to collect the data as well as characteristics of the establishments used as a reference (weather conditions, facilities, type of customers served, level of occupancy, building size). Although some of the models and benchmarks suggest the corrective factors to be used to account for the type and size of facilities, the overall reliability of these tools is questionable. In addition, Warnken et al. (2005), argued that for global benchmarks to be reliable too many hotel sub-categories would be required, or extensive databases would need to be created. Most of the reported indicators (for example in environmental reports, and academic studies), do not provide a perspective on indicators as related to the total use of resources (input), the company’s activity (output), or goals and objectives of the management (what should be the level of consumption according to the management plan). While, initially the focus was on indicators for business units, recently

8
benchmarking of destinations is increasingly debated (Leslie, 2001). Many guidelines are being published on how to collect the information and construct indicators (GRI, 2002; Kozak, 2004; WTO, 2004). The main issue that still remains unresolved and continuously debated in relation to sustainable development indicators is the need of good and reliable metrics and comparison schemes in pursuing sustainability. This will be discussed more extensively in Chapter 6. Furthermore, the above-mentioned requirements of the transparency of company performance (environmental reporting and CSR reporting) also demand the collection of a large quantity of data at the individual hotel level, pertaining to resource use, emissions and waste, as well as sustainability-oriented initiatives. There is, however, no system or methodology of data collection and monitoring that would be universally accepted or applicable throughout the hotel sector. Instead, a number of reporting/benchmarking tools have been developed by various bodies (some of them are presented in Paper VII). Some of these tools rely on conventional methods of data collection and result communication (Green Globe 21, Hong Kong Hotel Building Assessment Scheme, Nordic Swan), while others are web-based interactive tools, such as IHEI benchmarkhotel (www.benchmarkhotel.com), Hospitable Climates Hospitality Energy Analysis Tool – HEAT Online (www.hospitableclimates.org.uk), FHRAI Energy and Environment E2 Benchmark for Hotels (www.fhrai.com/BenchMark/), US EPA/DOE Energy Star Portfolio Manager (www.energystar.gov/index.cfm?c=evaluate_performance.bus_portfoliomanager). Although differing in scope, range and applicability, all these systems aim to assist the hotel manager in evaluating the environmental performance of the facility and frequently offer an indication of possible improvements. Some programs have been developed specifically for the purpose of pre-refurbishment auditing (i.e. XENIOS, http://env.meteo.noa.gr/xenios), or planning of energy investments and management strategies (Mavrotas et al., 2003). Most of these tools are for-profit instruments or internal applications and, as a result, there is limited available information on the system development process, its limitations, and the data collection methods. The Energy Star Portfolio Manager is the exception, with transparent methodology and free- of-charge access. This hinders the reliability of such instruments and does not provide guidance on how to design and successfully incorporate similar systems elsewhere, as discussed in chapter 7. And, while it may be relatively easy to state the commitment to report environmental performance, the compliance with the promise is frequently limited by a number of factors. The issue may be especially difficult in the case of large, multi-national corporations, operating facilities in countries differing in political, economic and socio-cultural conditions. The problems currently faced by hotel managers and corporate managements can be summarised as a lack of solid strategies and user-friendly tools to benchmark current and forecast future resource consumption, as well as to implement resource efficiency and conservation measures. Although, some monitoring tools are commercially available and successful case studies can be found in the sector, their market penetration is limited. Moreover, the reliability, accuracy and universal applicability of monitoring and benchmarking instruments is still under question. In addition, despite the wide range of available guidelines and training tools on how to perform hotel operations in a more responsible manner, most of the managers do not really have the time to search the libraries or the Internet for these materials. It is thus of utmost importance to provide them with clear and well-proven means and tools on how to successfully incorporate resource conservation and efficiency measures in their facilities.

9
2. Aim and scope of the thesis Relating to the information provided above, the following hypothesis has been stated, and the aim of this work is to verify its validity:
Well-designed and properly implemented resource consumption models, performance reporting and benchmarking tools, combined with results communication, corporate support and improvement actions, as well as legal requirements and demand from the customers, are valuable methods for the incorporation of more responsible hotel operational practices.
In order to verify the hypothesis stated, this work aims to: • evaluate the level of environmental awareness in the European hotel industry, • indicate the level of penetration of various environmental initiatives among individual hotels, • identify the drivers capable of changing attitudes of the hospitality businesses towards the
environment, • identify existing environmental educational and reporting programs within the hotel
corporations, • identify factors affecting resource consumption at hotels, • analyse the magnitude of the influence of various factors on resource consumption, • create and validate a resource consumption model for a group of hotels, as well as individual
facilities, • develop a procedure, indicators and feedback reports for a resource consumption monitoring
and benchmarking program for a hotel corporation, • identify criteria and develop the procedure for a successful resource conservation program
in a hotel company. The following working questions were posed:
1. Is the level of environmental awareness in the European hotel industry high enough to introduce major changes?
2. To what extent does the corporate policy, management/operational scheme, and geopolitical situation in the region/country affect the environmental activeness of hotel companies?
3. What is the influence of customer’s opinions and actions on hoteliers’ attitudes and pro-activeness towards the environment?
4. Are the commonly reported environmental performance indicators relevant to hotel operations, and are the indicators transparent enough?
5. What is the influence of different hotel physical and operational factors on the energy and water consumption in hotels?
6. Is there a need for additional indicators and improved/extended auditing and measurements to improve the reporting/benchmarking systems?
7. Are the commercially available environmental reporting and benchmarking tools truly applicable to the hotel industry?
8. What features and procedures should be implemented in the reporting/benchmarking systems to make them attractive and useful for the potential user in the hotel sector?

10
9. What methods of communicating environmental performance to individual hoteliers and corporate managers should be applied?
10. What strategies for creating and implementing successful environmental and resource management programs should be implemented in the hotel industry to ensure their success?
These working questions were addressed by the following actions: • Evaluation of environmental impacts of hotels through review of the available literature. • Identification of the existing environmental programs and initiatives through literature study,
Internet search and contacts with relevant organisations. • Identification of environmental attitudes, level of penetration of various environmental
initiatives in the European hotel industry, as well as pressures and factors capable of making hoteliers alter their practice through a questionnaire study.
• Identification of the level of CSR engagement, presence of environmental education and performance reporting programs in major hotel corporations through a questionnaire survey.
• Identification of the most successful strategies in implementing responsible resource management – based on experience from Hilton International and Scandic and study of the available literature.
• Development of models describing/evaluating resource consumption at hotels and factors which need to be considered (based on information contained in the Hilton Environmental Reporting database).
• Identification of the existing reporting/benchmarking tools through study of the available literature, Internet search and contacts with relevant organisations.
• Identification of the reporting schemes used in major hotel corporations through a questionnaire survey.
• Development and upgrading of the Hilton Environmental Reporting (HER) system with input and comments from the users at all levels of the company structure.
• Suggestion of procedures to successfully incorporate environmental reporting and other initiatives in the industry based on study of the available literature and own experience from HER.
The novelty provided by this work includes: • A comprehensive study of environmental attitudes and initiatives in the hotel industry
in Europe. • A resource consumption model for a chain of upscale and mid-market hotels, as well
as group of brand hotels and individual facilities (based on HER). • The development of a large scale reporting and benchmarking tool for a hotel corporation
(upgrade of the system used at Hilton International and Scandic).

11
3. Background to the study The study approach undertaken in this research was highly influenced by external constraints. The goal of this work was to develop models explaining resource consumption in hotels, however, initially no empirical data on the subject was available. A comprehensive literature study was performed and despite the wide range of publications addressing issues of the environment and sustainability in the hospitality industry, as well as strategies to implement more responsible operation practices (summarised in Bohdanowicz, 2003; Bohdanowicz & Bohdanowicz, 2004; and Bohdanowicz, 2005), limited information was found pertinent to performance indicators and resource use modelling in this sector. Furthermore, even though numerous best practice case studies were reported in the literature, few studies dealt with attitudes towards the environment among hoteliers on a regional scale. It was thus decided to first investigate environmental awareness among managers of the hospitality sector in Europe and the market penetration of various pro-ecological initiatives (the results of this investigation are reported in Papers I-IV, as well as Bohdanowicz, 2003; Bohdanowicz, 2004d; and in Chapter 5). This initial study resulted in the establishment of contact with the corporate management of Scandic, one of the major hotel chains in Scandinavia. Scandic, as part of its extensive environmental program, had already by 1996 developed a resource consumption database (Scandic Utility System – SUS). All Nordic Scandics were reporting their performance to SUS on a monthly basis. The company management granted the author access to this database and so analysis of the information collected could commence. Initial research focused on establishing performance indicators for the Swedish section of the chain, and an investigation into how resource consumption practice has changed over the time the extensive environmental program has been incorporated into the chain (reported in Papers V-VI, and Bohdanowicz, 2004e; Bohdanowicz et al., 2005). In the meantime, following the acquisition of Scandic by Hilton International in 2001, a more comprehensive version of SUS was developed – Hilton Environmental Reporting (HER). The amount of information reported increased substantially compared to SUS, the interface was changed to a more user-friendly one, and more feedback options were provided (the system is described in Papers V-VII). The first version of HER was launched in 2004, expanding the sample of reporting hotels to all Scandic and Hilton International facilities located in Europe and Africa (a total of ca. 300 hotels). The management of Hilton International and Scandic again granted the author access to their database. Following the verification of the figures reported in the system, necessary for further work, a number of analyses were performed. Performance indicators were compared, significant drivers of resource consumption identified and models explaining resource consumption developed. First, analysis on the two brands was performed (reported in Paper VIII), and then a group of hotels from one location was investigated (reported in Paper IX). In addition, analysis of selected hotels from a national chain was performed (reported in Chapter 6). In the final stage of this research the author was appointed a member of the HER Development Team, responsible for the data verification and information content of the upgraded reporting and benchmarking system. The verification and upgrade process was initiated in March 2005 and completed in January 2006. This task allowed the author to, first, become well-acquainted with the existing system, second, closely co-operate and share the experience with the users of the system, and third, suggest improvements to the existing system in the areas of content, user-friendliness of the interface and reporting process, as well as the feedback reports created for various levels of users. The verification process, problems identified from the users’ perspective as well as solutions suggested are reported in Paper X and in Chapter 7. The upgraded HER system was launched in February 2006 and is now fully operational. When

12
more data becomes available it will be further developed to provide more accurate benchmarks and feedback to individual and corporate users. The experience gained through co-operation with the management and team members at Hilton International and Scandic has strongly influenced the final outcome of this project. Instead of developing a reporting/forecasting tool from an academic perspective (the initial aim of the project), it was decided to create a system that is easily applicable within the industry given all the existing and identified constraints. The motivation for such a change of the initial goal was dictated by a desire to provide a tool that would be considered useful and actually used by representatives of the industry (without the need of contracting a highly specialised expert to perform the task of resource consumption forecasting and benchmarking). It is believed that such an approach will be more appreciated by representatives of the hospitality sector as well as academia, since it provides solutions to problems existing in real life situations.

13
4. Methodology
4.1. Literature survey A comprehensive literature review was performed throughout the entire study period. The main publications of interest included scientific journals and books, but also various guidelines and collections of best practice case studies published by the hospitality industry and NGO’s. In addition, a number of branch magazines were carefully followed (Doradca Hotelarza, Green Hotelier, Hotels, Hotel and Motel Management, Świat Hoteli). Websites of selected hotels, hotel corporations and hotel-related organisations were looked at periodically for updates on environmental initiatives, while environmental/CSR reports from major corporations were collected and carefully analysed. Furthermore, subscription to a number of e-mail discussion lists relevant to the topic was made and posts followed (green-travel, green-tourism, CAST, sustainable-tourism, and green-hotels, all available at yahoo.com).
4.2. Survey among European hoteliers and environmental managers at hotel corporations In the first phase of the research a wide ranging survey of environmental attitudes among hoteliers was performed. This is described in detail in Papers I-IV, as well as Bohdanowicz (2003) and Bohdanowicz (2004d). The hotel study was conducted by sending an e-mail-based questionnaire to a total of 4084 European hotels, representing 83.4% of the existing facilities within the population. The questionnaire was based on a comprehensive literature review and comprised 22 (23 for Sweden) multiple-choice questions, occasionally supplemented by open-ended follow-up comment sections to allow for greater clarification. Two of the questions required the respondents to rank their answers using a 6- or 7-point Likert scale. No pilot study was performed, and e-mail correspondence was used due to time and financial constraints. The choice of individual establishments was thus influenced by the availability (on the Internet and in hotel directories) of relevant e-mail addresses. The survey was performed in two stages: during the months of October to December 2002, and in March to May 2003. A follow-up reminder was sent to each non-respondent approximately every 2-3 weeks. Six hundred forty (640) correctly and completely filled-in returns were collected before August 1, 2003, accounting for an effective response rate of 16.6%. While being low, the effective response rates obtained in this research were fairly typical for e-mail surveys (Medina-Munoz & Garcia-Falcon, 2000; Jeong et al., 2003). The low response rate was assumed to be caused by the use of e-mail for correspondence (lacking personal contact and thus, most likely, less binding), the complexity of the questions and the length of the questionnaire. It might further be assumed that hoteliers who are actively involved in environmental initiatives may be more likely to respond than those who are not. This limitation most likely resulted in a somewhat biased sample and reporting rate. Thus, while the comparative data presented might be reliable, it was difficult to establish to what extent the data collected was representative of the overall situation in European hotels. Nevertheless, the study provided valuable insights into environmental attitudes in the hotel sector in Europe. The second stage of the study comprised of a detailed analysis of corporate websites from the perspective of environmental and corporate social responsibility (CSR) engagement and communication. Information pertinent to corporate commitment to the environment, social responsibility, possession of environmental policy and actions, as well as environmental communication of any kind was searched for. To this end, a website produced by the Cornell

14
University listing international, regional and national hotel groups was used (www.ehotelier.com/browse/chains.php). All URL addresses provided on the list were accessed and all non-relevant pages were removed (those of reservation services, single hotels, sub-brands belonging to one corporation, companies managing a few hotels from various brands, as well as addresses that did not work), leaving a sample of ca. 400 websites. Forty organizations were found to have some type of environmental/CSR information on their web-sites, ranging from a simple mention of the environment in their policy goals to extensive sections on the environment and social responsibility and a CSR section in the annual reports. Contact e-mail addresses to relevant key personnel were collected. If these were not available, any corporate e-mail addresses were collected. In some cases on-line feedback forms were also used to distribute the questionnaire. A survey questionnaire was then mailed to 370 companies (even if a company operates more than one brand – it was counted as one, with some companies not providing e-mail address or a feedback form allowing for messages longer than 500 characters). The survey was conducted in March and April 2006. A survey questionnaire was comprised of 28 multiple-choice questions, occasionally supplemented by open-ended follow-up comments for clarification. It was pilot-tested on two corporate environmental managers from Stockholm, and questions were adjusted based on their comments. The questionnaire was divided into three sections. The first category investigated the company portfolio and target markets. The second part dealt with the company stated commitment to the environment and CSR and areas of actions targeted. The last section examined the existence of various types of CSR-related educational programs and environmental reporting systems. Based on previous experience it was expected that the overall response rate would be low, especially that no follow-up remainders were sent. Indeed, only thirteen correctly and completely filled-in returns were collected before May 1, 2006, resulting in a very low response rate. It was thus decided to limit both the scope as well as the sample of the study. The scope was narrowed from the evaluation of overall environmental awareness among corporate managers to focus on the presence and types of existing environmental education programs as well as environmental performance reporting schemes. The sample was limited to the ten largest global hotel groups, that manage the top 20 hotel brands (ranking as of January 2006, MKG Consulting, 2006): InterContinental Hotels Group (Holiday Inn, Express by Holiday Inn, Crowne Plaza), Cendant (Days Inn of America, Super 8 Motels, Ramada Worldwide), Marriott International (Marriott Hotels, Courtyard), Accor International (Motel 6, Mercure, Ibis, Novotel), Hilton Hotels Corporation (Hilton Hotels, Hampton Inn), Choice Hotels International (Comfort Inns & Suites, Quality Inn Hotels), Best Western, Starwood Hotels & Resorts Worldwide (Sheraton Hotels), Carlson Hospitality (Radisson), Global Hyatt (Hyatt Hotels). In addition, the survey was mailed to Sol Meliá, Société du Louvre/Envergue, NH Hotels, Whitbread and Scandic. These brands were targeted due to their high market penetration in Europe (Astbury et al., 2003). Follow-up remainders were then sent out to all non-responding corporate managers 4 weeks from the initial mailing. Of the 15 companies targeted in the final stage, four could not be reached (e-mails bounced back or no contact via e-mail was available: Accor, Sol Meliá, Choice, NH), eight replied that they were not interested in participating in the study due to corporate policy (they did not participate in student surveys of any sort), because of lack of time and human resources to deal with all student inquiries (InterContinental, Marriott, Starwood, Whitbread, Cendant, Hyatt), or the lack of a relevant person responsible for environmental issues, or lack of any activity in that area (Best Western, Sociéte du Louvre/Envergue). Some companies directed the author to their corporate websites for relevant information (which was not always available, InterContinental, Marriott, Starwood, Whitbread), leaving a sample of 3 companies. In addition, 10 hotel corporations from outside the top 10 hotel companies list, completed the survey.

15
The sample achieved was highly biased, as only corporations actually active in CSR and/or environmental issues replied to the survey. Nevertheless, it gave some important insights into areas of involvement, as well as methods employed for environmental training and reporting. It could not be treated as representative of the entire corporate hotel sector, however, some of the responses obtained were in line with information reported by other researchers for some of the non-responding chains (i.e. Accor’s system described in WTO, 2004). It could thus be assumed that the survey results combined and compared with the information collected through the literature study, presented a relatively comprehensive picture on environmental and CSR attitudes and initiatives within the corporate hotel sector. Versions 12.0 and 13.0 of the Statistical Package for Social Science (SPSS) computer program were used for the statistical evaluation of the data (SPSS Inc., 2004).
4.3. Statistical analysis of data contained in the Hilton Environmental Reporting database In the second phase of the study the focus was on the analysis of the resource consumption and benchmarking schemes existing within the hotel industry. One of the leading global hotel corporations, Hilton International and Scandic, granted the author access to their internal environmental reporting database – Hilton Environmental Reporting (HER). HER is a web-based system where individual hotels report their monthly (operational, environmental and resource) performance figures. The system is described in detail in Papers V, VI, VII and X, as well as Bohdanowicz (2004e) and Bohdanowicz et al. (2005). The information typically contained in such systems is very sensitive due to fierce competition in the hotel market, making the lodging companies protective and unwilling to share. It is virtually impossible to get access to more than one such system, especially if an individual is known to work with a competing enterprise. As a result, no detailed comparison with other company-owned systems was possible. Accessing commercial schemes also poses certain problems related to their for-profit character and enterprise-only access, thus limiting the possibility of comprehensive comparative studies. An attempt was nevertheless made to qualitatively compare commercially available reporting and benchmarking schemes (as reported in Paper VII, X and in Chapter 7). For the purpose of this study, the data contained in HER was first reviewed and all hotels reporting their figures in the system were contacted and asked to double-check and verify the information contained in the database2. This allowed for the correction of single abnormal numbers resulting from typing errors, and magnitude differences caused by unit misunderstandings (i.e. kWh as opposed to MWh). In addition, figures for previously missing single or multiple monthly reports were collected from individual hotels and introduced into the database. Hotels reporting identical values every month, which made it very difficult to correlate the data collected with weather oscillations or variations in occupancy rates, were asked to provide more detailed numbers and in most cases the data was received. All these actions allowed the database to become more reliable and accurate in the analyses performed and feedback provided.
2 During the months of March to August 2005 all the data contained in the HER database for ca. 260 Hilton and Scandic hotels from Europe and Africa was carefully reviewed in a search for possibly incorrect figures (Hilton International hotels from other regions were not included in the system at that time). All reporting hotels were then e-mailed the Excel file with their reported data and asked to verify the information. If the data for the years before 2004 was populated centrally by Hilton (meaning that the total annual figure was divided by 12 months and the same number was reported for each month for a given attribute) the team members at the hotel were asked to verify the correctness of the annual figure and, if possible, provide monthly numbers.

16
Despite these efforts, the data contained in the database still has certain limitations, especially relevant when approached from the academic perspective. Communication with the system users brought up an important issue. The sources and methods of data collection were found to differ between hotels and sometimes even within one hotel (in time). Typically, invoices and/or meter readings are used to provide the consumption figures for the HER system. The problem with invoices is that utility companies frequently estimate the monthly consumption for the purpose of invoicing, and only make balance invoicing based on real meter readings once a year. Another case is when invoices are issued bi-monthly or even quarterly and the hotel reports identical consumption figures for two or more consecutive months. The result is that monthly utility consumption taken from invoices may differ from real-use figures for a given month. This issue may not be a problem when data is analysed on an annual basis, but would have an impact on models created on a monthly basis. Furthermore, as indicated by the current study and also highlighted by other corporate managers (Figueroa, 2001) quantities of resources listed on invoices are frequently in disagreement with figures obtained by detailed metering (invoices typically tend to over-estimate consumption). For cases where HER reports are based on monthly meter readings, one of the problems identified was that meter readings are frequently collected on different days every month, affecting the comparability of monthly data. Meters may employ different measuring units exerting an additional pressure on the user to correctly convert the consumption into a unit acceptable by the HER system (kWh, m3, litres). Minor mistakes made during the conversion process cannot always be detected at the system level, thus leading to certain generic errors. In addition, the accuracy of meters may differ even within a single building, depending on the age of the structure, type of system and calibration procedure applied. At times, buildings may house more than just a Hilton or Scandic hotel, yet there may exist only a single central meter for the entire building, with individual costs distributed based on a formula relevant to assumed usage (usually based on the floor area occupied), and respective resource use values reported to HER. This may lead to over- as well as under-estimation of what is actually consumed at the facility. The conversion units (for energy) used by the utility companies in different regions/countries may differ, further affecting the accuracy of comparative studies. Fuel consumption reported in volumetric terms in the system, is converted to energy units (and related carbon dioxide emissions) using factors provided by the UK Department of the Environment, Transport and the Regions and the UK Carbon Trust organisation (DETR, no date), which may also introduce certain errors for individual facilities, as the Carbon Trust data shows average values from UK sources. In addition, it was decided that there are not enough human resources at individual hotels to collect detailed information on building thermal characteristics. At some of the hotels such information is not easily available, especially if the building is old, has frequently changed owners, was damaged by war, fire or other natural disasters, or underwent many stages of renovation. In such cases, the original year of construction may not be treated as a reliable guide to the heat transfer characteristics of the building envelope. This issue significantly limited the possibility of applying the energy consumption modelling methodology based on heat transfer principles. Most of the above-mentioned issues, although important in terms of the accuracy of the models, could not be fully controlled or influenced by the author. This may explain some of the discrepancies reflected in the models created. On the other hand, it needs to be remembered that the goal of the study was to create a system that could be used by individual hoteliers, not requiring a team of outsourced experts, and still provide realistic forecasts on resource consumption. It called for the development of reliable consumption models requiring minimum information input, and the input of data easily available at the hotel.

17
Constrained by the above limitations and goals, the variables available in the system were extracted and analysed. Total energy consumption was normalised for a square meter of the hotel floor area and guest-nights sold. For the purpose of some of the analyses it was corrected with the use of heating degree days (actual and standardized degree days for all Swedish locations were provided by the Swedish Meteorological and Hydrological Institute - SMHI and available in the HER system). Water consumption and laundry was normalised for guest-nights. Average monthly temperatures for a number of European hotel locations were obtained from the Meteonorm software – only 30-year averages (Meteotest, 2003), while for Stockholm the data from SMHI was used – monthly average temperatures based on measurements. For all stages of the analyses only properly reporting hotels (differentiated utility figures for every month, and a completed hotel profile) from the region were used. In the study of individual hotels from Sweden, an attempt was made to cover different climatic zones in Sweden by selecting 10 cities. Next, if up to two hotels were operating in this location both were selected for the study. If there were more than 2 hotels, the selection was made to include a variety of heating energy sources (district heating, own oil or gas boiler). The selection was further limited by the quality of reported data. Multi-variate step-wise regression analysis was applied in this study. The statistical analysis of the data was performed using the Statistical Package for Social Science (SPSS) computer software (Version 12.0 and 13.0) (SPSS Inc., 2004).
4.4. Communication with HER users during the upgrade process of HER The author has used the SUS and HER systems since 2003 and gained significant experience with these schemes. Later, the author was appointed to perform the verification process of the data contained in the HER database (March-August 2005), and was part of the development team working on the upgrade of the system. During the process of data verification and system upgrade the author communicated with the system developers (Addsystems) and users from many operational levels of the Hilton International and Scandic companies and numerous geographical locations, as well as external auditors from Acona Ltd and Environ UK. The author continues to communicate with all of the HER users and developers in an attempt to further improve the user-friendliness of the system and accuracy and reliability of the reports. The information and experience obtained throughout these exercises is very valuable but can only be assessed qualitatively.

19
5. Environmental attitudes among European hoteliers (Papers I-IV)
5.1. The sustainable development and operation of the hospitality sector The hotel industry, due to its very specific function, operating characteristics and the services provided, consumes substantial quantities of energy, water and non-durable products. The resulting environmental impacts of hotel facilities have been well-documented by case-studies from all over the world. It is generally concluded that the negative influences of hotels are characteristically greater than those caused by other types of buildings of similar size (Rada, 1996). On the other hand, a large proportion of hotels, especially among resort facilities rely on the availability of a clean natural environment, as a core value for their business. It is therefore crucial to induce a more environmentally sound development, operation and performance in this sector. The urgent need for change among the hospitality businesses was acknowledged by global policy makers and branch associations almost three decades ago (as discussed in Bohdanowicz, 2003; Bohdanowicz & Bohdanowicz, 2004; Bohdanowicz, 2005). Many documents and charters were produced internationally and nationally urging a more sustainable development in tourism. Even though most of these documents refer to tourism in general, these are also applicable to the hotel sector. Increasingly strict environment-related regulations adopted and enforced in many parts of the world, combined with policy-makers frequently penalising environmentally unsound practices, and tourists abandoning destinations in poor environmental condition, are among the factors driving changes in the industry. Initiatives more specific to the hotel industry have emerged from actions within the sector itself, and have been initiated by international and national tourism and hotel associations. Additionally, research centres and the academic community are showing a growing interest in the promotion and development of environmentally friendly hotel operations. Bohdanowicz & Bohdanowicz (2004) thus argue that the economic and political/legislative framework for a responsible management of the hospitality sector, and tourism in general, has been established. It however needs to be noted that the degree of detail in the legislation and the strength of the legislative and executive apparatus relevant to the hotel sector differ among countries and regions.
5.2. Environmental policy instruments applicable to hotels The primary instruments of action for the hotel industry include the legislation of obligatory legal regulations (health and safety requirements, planning and building regulations, regulations on water, waste and emissions), environmental taxes (on the use of energy and water), as well as voluntary standards (Bohdanowicz, 2003; Bohdanowicz & Bohdanowicz, 2004; Bohdanowicz, 2005). The latter, including ISO 14000, typically provide not only guidelines, but also indicate specific levels of environment-related performance that need to be achieved. Industry benchmarking is also gaining attention and continuing to develop (Pyo, 2001; Wöber, 2001; Kozak, 2004; WTO, 2004). Regular environmental reports, available to the public, are increasingly anticipated from most businesses, including hotels. The industry itself has also developed a number of environmental management tools, such as association agreements. These include environment-related principles, charters and codes of conduct, which typically set guidelines for environmentally sound operations and procedures (UNEP IE, 1995; WTTC et al., 1996; WTO, 1999). Certification and labelling schemes offered internationally, nationally or locally by industrial organisations, governmental and non-governmental institutions are increasingly popular (Green Globe 21, Green Leaf, Ecotel, EU Flower, Nordic Swan, and others

20
comprehensively presented in RAMBØLL, 2000; Synergy & WWF, 2000; Oregon ECDD, 2002; Bohdanowicz, 2003; Commission of European Communities, 2003; Bohdanowicz, 2004a-c; Bohdanowicz et al., 2004). In order to help hoteliers incorporate more environmentally sound practices into daily operations, branch associations, various NGOs, academic communities and hotel companies themselves continue to develop guidelines and manuals (publications by UNEP, IHEI, IH&RA, Conservation International & IBLF; guidelines issued by AH&LA, GHA of Canada, SHR, Energy Innovators Initiative, and others; operations manuals developed by Accor International, Fairmont Hotels & Resorts, and Scandic to name but a few). As mentioned before, most governmental resource conservation and efficiency initiatives are extended to include the hotel industry (US EPA Energy Star, Green Lights and WAVE Programs, EU Flower). Best practice case studies are acknowledged by granting various environmental awards (IH&RA Green Hotelier Award, British Airways Tourism for Tomorrow Award, CHA/AMEX Green Hotel of the Year Award in the Caribbean), publishing articles in branch magazines (Green Hotelier Magazine, CADDET series, tourism web pages), as well as in specially published case study compilations (UNEP & IH&RA, 1997; most of the guidelines present successful case studies). Environmental issues relevant to the hotel industry are discussed at special seminars, workshops, think-tanks and conferences organised both by/and for academia, as well as the industry. Additionally, an increasing number of articles presenting the relationship between hotels and the environment are being published in specific branch and academic journals. It can be concluded that the bulk of the knowledge and technical know-how on more responsible business practices for hotels has been established, the challenge now is to encourage the industry to use and apply it in their daily operations.
5.3. Environmental awareness of European hotel managers It is believed that the general level of environmental knowledge and awareness in society and the environmental focus of governments and authorities, as well as the personal values of individual managers or the policy and level of corporate management control, are significant factors in shaping attitudes in the industry. In this respect, it is hypothesised in this research project that environmental attitudes of hoteliers in different geo-political locations are expected to vary. In regions where the preservation of high environmental quality has long received considerable political and financial support, such as the Scandinavian countries, the general public and industry representatives are expected to be involved in environmental practices. By contrast, in the countries of the former Eastern Block (Central and Eastern Europe), which faced many economic and socio-political problems after the system changed, environmental issues have only just recently come to the attention of the authorities. Generally, hoteliers from this region are thus likely to be less concerned about the protection of nature per se, except for economic or legal reasons. In situations where countries have recently passed through difficult and politically unstable times (such as the former Yugoslavia) the industry is believed to be even more focused on quick economic gains. On the other hand, it may also be expected that a long history of being a prime holiday destination on the Mediterranean coast, with a high dependence on foreign tourists (especially of German and Scandinavian origin, known to have pro-ecological inclinations), may induce more pro-environmental attitudes among hotel managers in that area. In respect of independent hotels, it is believed that environmental concerns and a willingness to act are strongly dependent on the hotel manager’s attitude and knowledge. In contrast, chain-affiliated hotels often incorporate environmental issues in their company policies, which are usually imposed on individual establishments. Furthermore, large companies are under increased pressure from their various stakeholders to conduct their businesses

21
in a transparent and ethical manner. They also possess more financial resources and are aware of the need to keep a good brand image. On a large scale, this is likely to result in chain-affiliated hotels’ being generally more active in environmental issues than individually owned and managed facilities (however, individual establishments are still believed to incorporate more “extra-ordinary best practice” solutions). A study performed among European hoteliers in 2002 and 2003 aimed to verify the above hypotheses. To this end, the hotels in the sample were categorised based on different criteria. First, the sample was divided into individually operated hotels and the corporate (chain) facilities, with a follow up study of four chains (Accor, Best Western, Radisson SAS, and Scandic Hotels AB) having different types of management contract (owned and managed, managed, franchised). The results of these analyses are reported in Papers I & III. Second line of study required the division of the group into national samples for the following countries: Croatia, Poland and Sweden. The results of these studies are reported in Papers II & IV, as well as in Bohdanowicz (2004d). The hoteliers participating in the study recognize that their facilities influence the natural surroundings, although the magnitude of the impacts is often underestimated. They are also aware that the hotel industry would benefit from environmental pro-activeness among its operators. Approximately eight out of ten respondents believe that issues relevant to environmental protection are important for the performance and development of tourism. One might attribute the prevalence of such a positive attitude to intensive pro-environmental campaigns carried out across Europe and, thus, to increased environmental awareness among industry representatives. However, there is a certain risk in such an interpretation. Pressures to appear socially responsible may lead individuals to overstate their environmental commitment and pro-ecological behaviour in the context of surveys. This actually seemed to be the case in the current research. While hoteliers said that environmental issues are important for the industry, some respondents also indicated that they believed environmental issues to be more relevant to nature-based tourism and resort destinations. Some respondents doubted the need for hotels to be eco-friendly, and also expressed concerns about the costs of such initiatives (predominantly among the independent managers, and representatives from Poland and Croatia). Despite the above comments, when asked whether their establishment was concerned about environmental issues, a clear majority of hoteliers from all groups answered affirmatively. It was expected that because of the higher governmental involvement in ecological education in Sweden, hoteliers from this region would possess more knowledge of the activities initiating more ‘‘green’’ hotels. Indeed, the evidence collected indicated a difference between the three countries. Swedes presented 66.2% positive answers, including 60.4% actually listing concrete pro-ecological activities, Croatian hotel representatives ranked second (63.3% and 60%, respectively), followed by Poland (56.5% and 43.5%). Furthermore, the general trend of chain and affiliated establishments demonstrating a higher environmental knowledge was clear. This can be attributed to the efforts made by most chain head offices towards developing and enforcing environmental policies and programs, as well as providing their personnel with environmental training. The latter issue was supported by responses of corporate managers questioned in March 2006. Ten out of 13 respondents declared having obligatory environmental/sustainability education for their personnel. In most cases the training was in the form of classroom education and workshops, although three chains developed e-learning programs available either on the intranet or on Internet. Most of these initiatives were commenced after 2000, but one corporation claimed to have environmental training going back to 1976, and another since 1993. Typically, this type of training was included in the orientation package received by the staff member upon hire, and in half of the surveyed chains it was a one-time event. The remaining corporations provided training on an annual basis, especially if local conditions required it.

22
In addition, individual properties may also provide training on property specific environmental initiatives. The findings of the European hotelier study further indicated that countries and corporations with a stronger institutional focus on the environment tended to have more organised structures for environmental protection among individual businesses (i.e. the environmental co-ordinators most common in Sweden, and among managed chains). On the other hand, the study indicated a key difference between the groups investigated. Hoteliers were asked whether they were aware of any institutions (national or international) that deal with environmental issues in the hotel industry, by producing guidelines, offering advice, and awarding certificates. More than half (51.4%) of the respondents from chain-affiliated establishments declared knowing such institutions, compared to only 24.2% among the independent facilities. Furthermore, over 60% of the Swedish respondents declared being familiar with such institutions which can be attributed to the prominent presence of these organizations in various media. General awareness among Croatian and Polish hoteliers was poor (30 and 10.5%, respectively) with single mentions given to ISO, Green Globe 21, Greenpeace, local hotel marketing programs and local environmental NGOs. This is a clear illustration of the situation in a market where no such organization actually exists. Generally, representatives of larger and affiliated hotels were more aware of the existence of such bodies. This particular finding indicated that environmental institutions and governments that want to promote environmentally friendly and sustainable policies need to focus more on and intensify their efforts in informing and reaching unaffiliated hotels, as well as businesses in countries where environmental protection has not been a key governmental focus in the past. They should also continue to disseminate information among the brand associated establishments. Especially relevant is the low awareness of eco-labels in the hotel industry identified by this study, and which indicates a lack of promotion. This has been recognized on the European level and a new project under the auspices of the EU Leonardo program was initiated in December 2005, “Train to Eco-label”. This action aims at increasing environmental awareness and the development of a training system for hotel managers and employees that will enable them to implement the EU Flower eco-label for tourist accommodation (www.traintoecolabel.com). Despite existing limitations, a majority of hoteliers declared they were involved in some type of environment-oriented activity. Energy-, water- and waste-related issues are the areas targeted by the majority of pro-ecological solutions. Fields of activities undertaken by hoteliers participating in the study varied, often significantly, depending more on the region than on the size of the facility (Figures 5.1-5.3). It was likely that some of the differences have been the direct result of laws and regulations, as well as local conditions. The types of measures undertaken were additionally influenced by corporate policy, the level of environmental awareness at management level, and the financial state of the establishment. In addition, in many cases, the division of hotel ownership, operation, and management among different stakeholders was an additional barrier to implementing environmentally responsible business practices. In the case of the hotel operator-manager who sublets the building on a fixed monthly rent, regardless of water and energy quantities consumed, neither the building’s owner nor the operator may have enough incentive to invest in energy- or water-saving measures. On the other hand, possessing a time-limited contract may discourage a hotel operator from making any unnecessary investments.

23
77,5 73,1 74,78280,881,5
0102030405060708090
100
Energy conservation Water conservation Responsible wastemanagement
% of respondents
Chain and Affiliated, N=428 Independent, N=182
Figure 5.1. Fields of activities undertaken by affiliated and independent hoteliers, % of respondents.
The slightly higher interest and involvement in all types of activities displayed by the representatives of the chain hotels could be attributed to the existence of a corporate environmental policy and action plans among chain establishments, as well as the availability of more extensive financial resources.
96,8 95,2 96,893,5 93,5 93,576,7 76,7 82,5
72,3 72,362,8
0102030405060708090
100
Energy conservation Water conservation Responsible wastemanagement
% of respondents
Chain 1, N=62 Chain 2, N=31 Chain 3, N=103 Chain 4, N=94
Figure 5.2. Fields of activities undertaken by hoteliers from selected chains, % of respondents. As regards the corporate hotel companies, it is believed that the level of responsible behaviour at individual facilities induced by corporate commitment depends on the strength of the link between the mother-company and individual facilities. This can be observed in the example of franchised facilities versus hotels with management or ownership contracts (Figure 5.2). Franchised hotels (Chain 4 and partially Chain 3) typically had the lowest involvement in all areas of environmental protection as compared to hotels fully owned and managed by the corporation (Chain 1 and 2).

24
87,6 85,3 89,983,9 79 77,4
26,7 26,736,7
0102030405060708090
100
Energy conservation Water conservation Responsible wastemanagement
% of respondents
Sweden, N=225 Poland, N=124 Croatia, N=30
Figure 5.3. Fields of activities undertaken by hoteliers from selected countries, % of respondents. More than 77% of the respondents from Poland and Sweden, and only 26% from Croatia declared their involvement in energy and water saving measures, and some form of waste management (sorting, recycling). Swedish hoteliers generally displayed the highest engagement in environmental activities, while in Croatia pro-ecological initiatives were not found to be very common. This could be attributed to the overall differences among the level of general awareness as well as financial means possessed by hoteliers from these three regions. There is one more issue of concern, which may not be evident from the empirical data collected in this study, but often can be deducted based on additional comments provided by hoteliers. This has also been reported by studies made by others (Despretz, 2001). Some hoteliers believe that compliance with laws and local standards (e.g., separation of waste) is enough to make their facilities environmentally responsible. The same study (Despretz, 2001) also illustrated that for some hoteliers the concept of efficient equipment was equivalent to ‘‘new’’ equipment, while eco-certified products and appliances were those which contained the words ‘‘eco-’’ or ‘‘bio-’’ in their names, as supplied by manufacturers, without necessarily being formally certified. These attitudes may strongly limit the penetration of responsible and environment-friendly practices among hoteliers if proper education and awareness raising campaigns are not initiated at regional and national levels. A study of European hoteliers concluded that the geo-political, economic and socio-cultural context of a country has an influence on the environmental attitudes of hotel operators. The ‘‘green’’ image of Scandinavian countries, where considerable emphasis is placed on preserving high environmental quality, was reflected in the attitudes and actions of Swedish hoteliers. They were generally found to have higher environmental awareness, comprehensive knowledge relevant to environmental protection and well-established pro-ecological programs and initiatives. On the other hand, Polish hoteliers were found to be at the stage of recognizing the importance of environmental concern and initiating various activities. However, due to the relatively low level of environmental knowledge and the lack of relevant policies for sustainable tourism development, most actions undertaken by Polish hoteliers were aimed at achieving immediate economic benefits, or were those required by law. It can be concluded that initiatives in Poland were primarily economically motivated, while any environmental benefits achieved were seen as a bonus. Croatian hoteliers generally seemed to have a high level of environmental knowledge and concern for environmental issues. However, among the three countries investigated, concrete pro-ecological initiatives were found to be least likely implemented in Croatia. This may in part be due to the very recent revival of the Croatian tourism industry,

25
following regional political and economic difficulties in the 1990s. It is reasonable to expect the situation in Croatia to improve as the industry continues to regain momentum. The study has further shown that corporate policy on the environment and level of managerial control over individual facilities do influence the overall environmental performance of the chain. Managers in chain-affiliated hotels were generally found more likely to pay attention to environmental issues than independent operators, many of whom run small properties.
5.4. Driving forces for change The successful implementation of more sustainable practices in the hotel industry is highly dependent on the active support and co-operation of all stakeholders involved. The willingness and ability of hotel management to advocate and implement state-of-the-art environmentally responsible behaviour and practices is therefore imperative. As mentioned previously, there is a general agreement that the pressure for improved environmental performance within hotels can be seen as driven by the opportunity to reduce operating costs, the enforcement of environmental regulations by authorities and the need for company transparency, corporate managements increasingly concerned with keeping a positive brand image, as well as pressure from stakeholders, such as investment and insurance companies. The altruistic need to preserve the local environment, and a demand for environmentally friendly hotels from the customers although powerful in principle, are still not common enough to induce real change. The results of this study of European hoteliers supported the statements made by other researchers, and also identified some important differences in perceptions and attitudes among the groups analysed. The current study confirmed that hoteliers, regardless of their brand association or country of origin, did not generally consider environmental commitment to be a major marketing factor (Figures 5.4-5.6). Certain differences among individual groups were however observed, i.e. a large proportion of respondents from Chain 1 declaring that they advertise the concern their corporation and individual hotels have for the protection of the environment.
0102030405060708090
100
Location Quality ofservices
Price Tradition ofthe hotel
Concern forthe
environment
Other
% of respondents
0123456
6-point Likert scale
Chain and Affiliated, N=428; % of respondents Independent, N=182; % of respondents Chain and Affiliated, N=428; Likert scale Independent, N=182; Likert scale
Figure 5.4. Features advertised and their perceived importance in customer decision making
according to independent and chain hotels, % of respondents and average of 6-point Likert type scale.

26
0102030405060708090
100
Location Quality ofservices
Price Tradition of thehotel
Concern forthe
environment
Other
% of respondents
0123456
6-point Likert scale
Chain 1, N=62; % of respondents Chain 2, N=31; % of respondents Chain 3, N=103; % of respondents Chain 4, N=94; % of respondents Chain 1, N=62, Likert scale Chain 2, N=31; Likert scaleChain 3, N=103, Likert scale Chain 4, N=94, Likert scale
Figure 5.5. Features advertised and their perceived importance in customer decision making according to selected chains, % of respondents and average of 6-point Likert type scale.
0102030405060708090
100
Location Quality ofservices
Price Tradition of thehotel
Concern forthe
environment
Other
% of respondents
0123456
6-point Likert scale
Sweden, N=225; % of respondents Poland, N=124; % of respondents Croatia, N=30; % of respondentsSweden, N=225; Likert scale Poland, N=124; Likert scale Croatia, N=30; Likert scale
Figure 5.6. Features advertised and their perceived importance in customer decision making
according to hoteliers from selected countries, % of respondents and average of 6-point Likert type scale.
Little effort generally assigned by hoteliers to marketing their eco-friendliness can be attributed to the still limited level of activities in these areas, as well as the low customer demand. The former reason should not have a significant influence as most of the hotels participating in the study were actually involved in various pro-ecological initiatives, as discussed in Papers I-IV. On the other hand, low mass-customer demand for green lodging alternatives is mentioned by researchers (Gustin & Weaber, 1996; Wight, 1997; Swarbroke & Hornan, 1999; Bohdanowicz, 2003; Anavo & STI, 2005; Sustainable Travel Report, 2005; discussion related to the topic on [email protected] list in April 2005). Low customer demand obviously decreases the marketing value of corporate environmental responsibility. However, low demand does not necessarily indicate a low environmental consciousness among travellers, rather a lack of awareness of the ways and the extent to which hotel facilities may affect the environment negatively, as well as a lack of clear incentives and methods to communicate these needs to the lodging industry. Also, unless specifically trained, the average traveller cannot be expected to be aware of, or to know how to use the complex environmental metrics needed for evaluating the environmental performance of hotel facilities. This leads to the conclusion that the eco-labels for tourist accommodation should be promoted and marketed more, by using programs such as, for example, HCIMA & Hospitable Climates Interactive Map of environmentally friendly

27
accommodation in Great Britain (www.hospitableclimates.co.uk). The scarcity of environmentally responsible role-model facilities among businesses catering to the mass-traveller makes it additionally difficult for travellers to distinguish “good” facilities from “bad”. As expected, and based on the findings of other researchers, economic factors were listed as major drivers for change (Figures 5.7-5.9). Only representatives of Chain 2 indicated the reduction of environmental impacts as the most important. On the other hand, the demands of customers ranked as the second-strongest incentive capable of encouraging hoteliers to undertake more environment-friendly activities. This would indicate that that if customers were to demand more environmentally sound performance from the hotel industry, it would most likely effect a substantial change. The remaining drivers are listed in varied order of importance as discussed below.
0123456
Reducingoperational
costs
Improving thehotel image
Diminishingenvironmentalimpacts of the
hotel
Marketingasset
Availability ofprofessional
advice
7-point Likert scale
Chain and Affiliated, N=428 Independent, N=182
Demands from customers
Recommendations of management
Figure 5.7. Incentives to introduce more environment-friendly initiatives according to independent and chain hotels, average of 7-point Likert type scale.
Among the independent and chain affiliated hotels alike, the desire to improve the image of the facility was in third place, followed by the will to diminish environmental damage. Notably, recommendations from management as an incentive to be more active in environmental issues ranked low. Nor was the availability of professional advice found to be a sufficient incentive to enhance eco-friendliness.
0123456
Reducingoperational
costs
Improving thehotel image
Diminishingenvironmentalimpacts of the
hotel
Marketingasset
Availability ofprofessional
advice
7-point Likert scale
Chain 1, N=62 Chain 2, N=31 Chain 3, N=103 Chain 4, N=94
Demands from customers
Recommendations of management
Figure 5.8. Incentives to introduce more environment-friendly initiatives according to selected
chain hotels, average of 7-point Likert type scale.

28
In the case of selected chain hotels a relationship between the strength of the management contract, corporate environmental policy and the attitudes of individual establishments can be distinguished. To do so, the results of this study need to be looked at in combination with findings of the study performed on corporate attitudes and environmental information on company websites. Chain 4 has no information pertinent to the environment displayed on the website, and according to a company representative no such initiatives are undertaken at the corporate level or demanded from individual hotels. In addition, the management scheme prevailing in this corporation is to franchise facilities. The remaining chains have very comprehensive environmental programs presented on their websites and often cited in various studies. However, it seems that the level of encouragement provided to individual establishments from corporate management differs. Representatives of Chains 1 and 2 believed that environmental commitment and activities at the individual hotels help maintain a positive brand image, and they also indicated the altruistic will to diminish environmental impacts as a key driver for change (especially prominent with Chain 2). Chain 3, although convinced about the need of maintaining the hotel’s positive image and following the recommendations of management, did not seem to associate it with reducing the environmental impacts of their operations.
01234567
Reducingoperational
costs
Improving thehotel image
Diminishingenvironmentalimpacts of the
hotel
Marketingasset
Availability ofprofessional
advice
7-point Likert scale
Sweden, N=225 Poland, N=124 Croatia, N=30
Demands from customers
Recommendations of management
Figure 5.9. Incentives to introduce more environment-friendly initiatives according to hoteliers
from selected countries, average of 7-point Likert type scale. The possibility of reducing operational costs was the strongest incentive for Polish and Swedish hoteliers. In contrast, Croatian hoteliers ranked the potential of improving the hotel’s image as most important. This may be attributed to the recovery of Croatian tourism in recent years and the efforts underway to regain a strong position among Mediterranean holiday destinations. In line with findings from other samples, customer expectations ranked second in the Polish and Swedish samples. Croatian hotels, ranked the goal of decreased environmental impacts as third, and customer expectations as fourth. This again could be explained by the revival of Croatian tourism. Swedish hoteliers also placed decreased environmental impacts as a third priority followed by improved hotel image, while for Polish hoteliers the hotel’s image ranked third before additional marketing assets. This study indicated that the prospect of significant cost savings as well as customer demand, are currently the most likely parameters to enhance environmental responsibility among hoteliers. Undoubtedly a great need remains for increasing environmental knowledge and awareness among hoteliers and the general public. To better understand and develop the

29
marketing potential of environmental responsibility, the mechanisms of customer demand and choice will need to be investigated in more detail in the future.
5.5. Findings The findings of this study provided a number of insights that may have significant relevance for the development of sustainable practices in the hotel industry at large. First, customer demand is believed to be a strong driver for environmental improvements in the hotel industry, however, at the moment, environmentally conscious tourists still represent a niche clientele and do not have significant purchase power to induce changes. On the other hand, the popularity of CSR reporting and sustainability indices, especially among the larger companies, leads the author to believe that the industry is preparing for increased customer pressure and demand. Second, the study findings indicated that both the level of management control of the parent company over individual chain establishments, along with the corporate policy pursued by the top management, have a significant influence on the environmental attitudes and activeness of individual managers and hotel teams. Over and above this, the geopolitical situation in the region/country, and the level of environmental awareness and education at society level all affect the behaviour of individual hotel managers, especially prominent in the independent hotel sector. It was also concluded that, at the moment, the level of environmental awareness among European hoteliers is not high enough to introduce significant changes. However, the efforts made by the major hotel corporations such as Accor, Radisson SAS, Hilton International and Scandic in educating their personnel and pursuing ambitious environmental programs allow the anticipation that the situation will change. In addition to this, actions like Hotel Environmental Action Month organised by IHEI annually, and the EU Leonardo initiative “Train to Eco-label” can be treated as a step in the right direction. The study also identified two major directions that ought to be pursued in the development of hospitality and tourism. First, environmentally responsible practices need to be incorporated into the hotel industry on a large scale, and cost savings associated with these initiatives must be widely demonstrated within the sector. All stakeholders relevant to the industry should participate in these activities. The second line of action identified by this survey relates to the creation and enhancement of travellers’ environmental awareness in an attempt to initiate their demand for ‘‘green’’ practices. This is especially important in the light of these findings, which indicate that customer demand for more environmentally sound performance from the hotel industry is likely to effect a significant change. A wide-reaching pro-ecological educational campaign is needed to initiate a change in social attitudes.

31
6. Energy and water consumption indicators and modelling (Papers V-IX)
6.1. Resource consumption of hotels and environmental performance indicators The resource consumption profile of hotels varies greatly from other commercial buildings as discussed in detail in Bohdanowicz (2003). Factors influencing facility performance can be classified into physical and operational parameters. The physical parameters common to most buildings include size, structure and design of the building (prevailing architectural/construction practices), geographical and climatic location, the age of the facility, the type of energy and water systems installed, the way these systems are operated and maintained, types and amounts of energy and water resources available locally, as well as energy- and water-use regulations and cost. The resource use in hotels is further influenced by very specific operational features. These include different operating schedules for different functional facilities in the hotel building, the number of facilities (restaurants, kitchens, in-house laundries, swimming pools and sports centres, business centres etc.), services offered, fluctuations in occupancy levels, variations in customer preference relevant to indoor comfort, on-site energy and water conservation practices, irrigation needs, as well as culture and awareness of resource consumption among personnel and guests. Some of these factors, such as the level of environmental awareness of users, may be difficult to quantify or evaluate as they are mostly qualitative in character (Despretz, 2001). From an architectural and systems’ perspective a hotel can be seen as a combination of three zones, all serving distinctly different purposes (IMPIVA, 1994; Ransley & Ingram, 2000; Bohdanowicz et al., 2001; Lawson, 2001):
• The guestroom area (bedrooms, bathrooms/showers, toilets) - individual spaces, often with extensive glazing, asynchronous utilization and varying energy loads, as well as highly user-specific patterns of water use;
• The public area (reception hall, lobby, bars, restaurants, meeting rooms, swimming pool, sauna, etc.) - spaces with a high rate of heat exchange with the outdoor environment (high thermal losses) and high internal loads (occupants, appliances/equipment, and lighting). Advanced heating, ventilation and air-conditioning (HVAC) systems installed in these enclosures must be able to respond quickly to fluctuating numbers of occupants and diverse thermal comfort requirements, some of the areas are additionally equipped with high energy- and water-intensive installations;
• The service area (kitchens, offices, storage rooms, laundry, staff facilities, machine rooms and other technical sections) – energy- and water- intensive areas typically requiring advanced air handling (ventilation, cooling, heating). In addition, service spaces typically need to be isolated from public and service areas, e.g. to prevent the transport of odours.
The energy and water flows occurring in these three areas are usually very different, and need to be handled accordingly. Among the system end-users space conditioning (heating/cooling, ventilation, and air-conditioning) is known to be the largest single end-user of energy in hotels accounting for ca. half of the total consumption (as discussed in Bohdanowicz & Martinac, 2002; and Bohdanowicz, 2003). It is thus widely accepted that outdoor weather conditions and floor areas are among the main factors affecting energy use in hotels. In addition, the indoor temperature levels recommended by standards and further adjusted according to individual needs and the perception of users greatly influence the quantity of energy consumed in a building. The influence of indoor temperatures on energy consumption is discussed in detail in Bohdanowicz & Martinac (2002).

32
Domestic hot water is commonly the second largest user, accounting for up to 15% of the total energy demand (IMPIVA, 1994). Depending on the category of establishment, lighting can fluctuate between a range of 12-18% and up to 40% of a hotel’s total energy consumption (IHEI, 1993; IMPIVA, 1994). Services such as catering and laundry also account for a considerable share of energy consumption, particularly considering that they are commonly the least energy-efficient. In kitchens energy consumption is related to the number of meals served per day and the type of food prepared. Total energy used to provide catering services ranges from <4 kWh/food cover to >6 kWh/food cover depending on the efficiency of the kitchen (IHEI, 1993). A large proportion of the energy used in the kitchen is frequently wasted due to improper operational practices. Energy consumption in laundry facilities generally depends on the type of equipment used as well as quantity and quality of linen. The average energy consumption of a laundry is 2-3 kWh per kilo of clothes (IHEI, 1993; IMPIVA, 1994). The energy allotment of lifts, service lifts, pumping and other auxiliary services represents only a small percentage of the total consumption. On the other hand, sports and health facilities are typically high energy consumers (IHEI, 1993; Lam & Chan, 2001). Guestrooms are, on average, responsible for 30% of total energy consumption (IHEI, 1993), and are in general characterised by energy consumption profiles difficult to predict. Much of this use is due to unnecessary energy loss and wastage. Guests are frequently given full control over thermostat settings, individual air conditioning units, as well as operable windows and doors where available, and they adjust these according to their individual preferences with little or no concern for energy conservation. Often windows and doors are opened simultaneously to the operation of the cooling or heating system, or both systems function at the same time, counteracting each other. Also, many (rented) rooms remain unoccupied for prolonged periods of time during the day (ca. 60-65%, Selwitz, 2000), while HVAC systems are left running, often at maximum load. While air quality and thermal comfort obviously need to be high whenever a room is occupied, loads should be adjusted to reasonable levels when the room is unoccupied. In addition, all lights, TVs and other in-room equipment is typically left running or in stand-by mode. Thus energy within a hotel room is frequently consumed 24-hours-a-day, year-round regardless of whether or not the room is occupied. Water at lodging facilities is used for bathing and sanitary purposes, drinking and cooking, cleaning and laundry, fire safety and HVAC systems, as well as recreation (swimming pools and spas). Frequently large quantities are used for gardening. Most of the water supplied to the facility is converted into wastewater and must be collected by the sewage system and treated before discharge. Typically, higher-standard hotels and hotels with in-house laundry and water-intensive recreational services consume more water than similar size establishments of a different standard and with less amenities and services (Deng & Burnett, 2002a). Water consumption at a hotel is closely related to the occupancy rate (IHEI, 1993). Such situation may be attributed to the fact that guestrooms represent a major water consumer in a hotel, and account for 33-44% of the total, depending primarily on the presence of in-house laundry (Meade & Gonzales-Morel, 1999; Webster, 2000; Deng & Burnett, 2002a). The kitchen typically ranks second (18-28% and up to 55%), followed by public toilets (15-17%) and in-house laundry (11-20% and up to 47%) (Meade & Gonzales-Morel, 1999; Webster, 2000; Deng & Burnett, 2002a). Pools and HVAC systems account for 2-3% and 1-2%, respectively. Watering of the grounds may additionally contribute to the overall water consumption. Only 5% of the water in the kitchen is consumed directly in eating and drinking, the rest is used for food preparation and cleaning (Webster, 2000). The quantity of water needed for food preparation ranges from >35 litres/food cover to <45 litres/food cover depending on efficiency (IHEI, 1993). Generally, the (hotel total) daily quantity of linen requiring laundry ranges from 2.7 to 5.9 kg/occupied room depending on the hotel standard (Lawson, 2001). Each kilogram of linen typically requires from 12 to more than 30 litres of water depending on laundry efficiency (IHEI, 1993; Lawson, 2001). Water wastage

33
(through leakage for example) is not uncommon in hotel facilities and can significantly contribute to the total water consumption. A high diversification of consumption profiles and lack of proper monitoring, record keeping and reporting of energy and water utilization by hotels makes it difficult to accurately define the total and disaggregated utility use. Today, most hotel facilities only monitor their overall energy and water expenditure without detailed attention to the different end-uses. Detailed monitoring and documentation of the various utility flows is technically possible but generally regarded as prohibitively complex, human resource-intensive and expensive. Nevertheless, a number of organizations and research groups have recently attempted to measure and estimate resource use of various scales. Some typical values of utility consumption, as well as end-user contributions to the total resource consumption in hotel buildings in various parts of the world can be found in Bohdanowicz (2003), as well as in Papers VIII and IX. The increased requirement for transparency in company performance and the growing popularity of various benchmarking systems evoked the need to establish environmental performance indicators, allowing for clear and easily understandable quantification of hotel environmental performance. The most commonly used indicators present utility consumption per unit of output. For the hotel industry this would be guest-nights sold, occupied rooms, or eventually food covers sold (Despretz, 2001; Stipanuk, 2003 a&b; WTO, 2004):
tt
timeunit per )soldcoversfoodoccupied,roomsserved,(guestsoutputservicetotaltimeunit per on)(consumptiinputresourcetotalchemicals)water,(energy,UseResource = ,
[Eq. 6.1] The time factor, t, can be chosen as annual, monthly or quarterly depending on data availability for both nominator and denominator (the same time scale has to be used in both cases). Some studies suggest weighting the number of guest-nights at facilities offering catering services to make allowances for the different energy and water consumption of hotel vs. restaurant guests. Study by Despretz (2001) suggested a weighting factor with 4 warm food covers equivalent to one full guest-night (based on limited empirical data from German hotels). This number assumes a 3-course meal per person, where the preparation of each dish requires ca. 6 kWh and 50 litres of water (based on the literature and empirical data), while baseline consumption per guest-night is in the range of 80-130 kWh and 700 litres according to Green Globe 21 (Green Globe 21, 2004). For energy, a more traditional approach includes presentation of the annual utility consumption per square meter of the building area (space conditioned). An annual time scale is necessary to correctly account for weather variations and their influence on resource consumption. This indicator is also referred to as the Energy Use Intensity index (EUI) (Despretz, 2001; Deng & Burnett, 2002b; US DOE/EIA, 2002):
)cooledand/or heatedd,conditione(spaceareafloorhoteltotalnconsumptioenergyannualtotal
mkWhIntensityUseEnergy 2 =⎥
⎦
⎤⎢⎣
⎡ , [Eq. 6.2]
The area normalisation of water consumption (Water Use Intensity – WUI) is also exercised, especially in relation to facilities with large green areas requiring watering (Despretz, 2001; Deng & Burnett, 2002a):
watering requiringgrounds landscaped of areatotal areafloorhoteltotalnconsumptiowaterannualtotal
mlitreIntensityUseWater 2 +
=⎥⎦
⎤⎢⎣
⎡ , [Eq. 6.3]

34
Another practice is to normalise the consumption per total number of rooms in the hotel (Stipanuk, 2003 a&b). The units commonly used to express energy consumption include Watt-hours – [Wh] and Joules – [J] (electricity and total energy, SI system), British Thermal Units – [Btu], and therms (energy based on fuels, i.e. natural gas, IP system), while water is typically expressed in litres – [l], cubic metres – [m3] (SI system), or gallons (IP system). Consumption of chemicals, and generation of waste is typically calculated as grams or kilograms (Nordic Ecolabelling, 2002). On top of these commonly used measures, the World Tourism Organisation suggested a number of additional indicators, covering a wider range of sustainability issues and applicable mostly to entire destinations (WTO, 2004):
1. Energy consumption and sources: a. % of businesses in the area participating in energy conservation programs, b. % of energy coming from renewable sources, c. % of businesses using energy coming from renewable sources and/or generating
own energy; 2. Water consumption:
a. % of reduced, recaptured or recycled water, b. % of wastewater or grey water recycled, c. % of establishments participating in water conservation programs, applying water
conservation policies and techniques, recycling treated wastewater (e.g. reusing towels, advising guests on water saving, installing water saving shower heads and flush systems, or using recycled water for irrigation purposes),
d. Number of water shortage incidents per year or number of days per year where there are supply shortages,
e. % loss from reticulated systems, f. % of water supply imported to region, g. Total use of water by tourism facilities and installations as % of installed capacity, h. Total use of water by tourism facilities and installations as % of absolute
consumption, i. Water price per litre or cubic metre;
3. Water quality: a. % of tourist establishments with water treated to international potable water
standards, b. % of local population with access to treated water (according to UN Sustainable
Development Indicators), c. Number of incidents of violation of water standards, d. Frequency of water-borne diseases expressed as % of visitors reporting water-
borne illnesses during their stay, e. Perception of cleanliness of food and water.
In addition, a whole set of other indicators was suggested by the UN WTO and other authors to allow for a comprehensive evaluation of the sustainability status and development progress among tourist facilities and destinations (Leslie, 2001; WTO, 2004).

35
In principle, the indicators suggested and used in the sector seem to be relevant to the uniqueness of performance patterns in the hotel industry. The issues that are often discussed include the accuracy and validity of the published performance indicators and benchmarks (de Burgos-Jiménez et al., 2002; Becken & Cavanagh, 2003; Stipanuk, 2003 a&b; Warnken et al., 2005). The figures reported frequently show large variations within regions and even classes of facilities, and do not provide a perspective on indicators as related to the overall company environment. The variations are typically attributed to the differences in methodology used to collect the data as well as characteristics of the establishments used as a reference (weather conditions, facilities, type of customers served, level of occupancy, building size). Although some of the models and benchmarks suggest corrective factors to be used to account for the type and size of facilities, these are not always fully accurate. Other models establish rigid limits on types of facilities that can be modelled or benchmarked by a given scheme, additionally limiting its applicability. The issue of providing perspective and environmental conditions was addressed by Global Reporting Initiative (2002), which recommended using both absolute figures as well as normalised data when reporting environmental performance. Another issue of concern considers the accuracy of the aggregated indicators (total consumption/total output) when used for comparative benchmarking.
6.2. Commonly applied models of resource consumption The models developed for energy and water consumption should ideally have solid scientific background, be theoretically convincing, empirically applicable and statistically significant. Significant variations in facility types within the hotel sector make it difficult to provide a general model explaining the resource consumption of individual facilities that could be universally applicable to all types of hotels. Nevertheless, as previously mentioned a number of attempts have been made to develop such models. The models vary in applicability (valid for a single hotel or for hotel samples including up to 160 units), number of factors/variables included, data collection and verification procedures, as well as modelling methodologies used (although regression analysis is a typical choice when empirical data is available). While 81 variables were tested for their influence on the total hotel energy use in one study (APEC, 1999), considerably fewer variables are generally considered (due to data availability). The following variables are typically investigated with regard to energy consumption: hotel standard, hotel floor area (or number of guestrooms or beds), heating and cooling degree days, guest-nights (occupancy), (warm) food covers sold, presence of heated swimming pools, presence of food preparation facilities, comfort level, chain affiliation, as well as corporate (management and staff) and customer awareness (Becken et al., 2001; Despretz, 2001; US EPA, 2001; Chan, 2005; Matson & Piette, 2005). Outdoor temperature (degree days), hotel floor area and sometimes guest-nights sold are typically indicated as major energy use drivers (APEC, 1999; Becken et al., 2001; Despretz, 2001; Matson & Piette, 2005). Water consumption is typically considered to depend on guest-nights and food covers sold, the quantity of in-house laundry, hotel floor area, green area watered, climate zone, presence of swimming pools, comfort level, chain affiliation, as well as corporate (management and staff) and customer awareness (Despretz, 2001; Deng & Burnett, 2002a). Although more variables were found to be important water use drivers, number of guests served, warm food covers prepared and quantity of in-house laundry are typically listed as the most significant factors (Despretz, 2001; Deng & Burnett, 2002a). Key correlation coefficients (R2) in these studies were reported as 0.60-0.96 for energy consumption and 0.12-0.88 for water consumption, depending on the model and data available (Despretz, 2001; Deng & Burnett, 2002a; Matson & Piette, 2005).

36
Among the models developed previously, a few deserve special attention, due to the relatively large samples used. The model developed within the framework of the US EPA Energy Star rating has the following form (US EPA, 2001; Matson & Piette, 2005):
(ln(DD))C)Facilities(FoodC)(ln(Rooms)CCEU)SourcePredicted(ln 3210 +++= , [Eq. 6.4] Where: EU= energy use; Rooms= number of hotel rooms; Food Facilities= presence of revenue-generating food and beverage and/or banquet facility (0=no, 1=yes); DD= total heating or cooling degree days (base 18oC). The coefficients vary depending on the type of hotel as presented in Table 6.1.
Table 6.1. Coefficients developed for different types of hotels by the US EPA Energy Star rating model, kBtu/year (Matson & Piette, 2005).
Type of hotel C0 C1 C2 C3 R2 Upper upscale 11.87840 0.942549 0.633806 - 0.842 Upscale 8.034322 1.217668 0.156245 0.307686 0.869 Midscale w F&B 8.598854 1.024112 - 0.357193 0.689 Midscale ww F&B 9.497230 1.121501 - 0.155450 0.601 Economy 7.728508 0.933250 0.466603 0.448884 0.879
A similar approach was used in the APEC study (1999) where the following linear regression model was suggested:
iiemployees3rooms2eaNetFloorAr10 XC...NCNCACClog(EUI) +++++= , [Eq. 6.5]
The final regression model proposed for representing energy use intensity in hotels was (APEC, 1999):
)Nlog(329.0X824.0
)Alog(385.037.7log(EUI)
ityWorkerDenseringyDemandMetElectricit
omrLodgingRollocatedPeFloorAreaA
⋅+⋅+
+⋅−=, [Eq. 6.6]
(With: R2= 0.38) Where: AFloorAreaAllocatedPerLodgingRoom= a derived variable indicating hotel standard and occupancy levels; XElectricityDemandMetering= variable not causing any change in EUI but strongly correlated to other building characteristics, i.e. size; NWorkerDensity= likely to be an indicator of occupancy rates and level of services provided to the guests.
Despretz (2001) suggested the following theoretical models for energy and water consumption:
εααα
αααα
++++
++++=
mingPoolHeatedSwimHSwWarmMealsWMtaysOvernightSOS
LightingLCoolingCoolingCHeatingHeatingH0
VNN
ADDADDAE, [Eq. 6.7]
Where: E= energy consumption [kWh]; A= floor area [m2]; DD= degree days; N= number of items; V= volume [m3]; α= regression parameter for activity x, i.e. specific energy consumption per unit of activity; ε=error term capturing unobserved phenomena and effects.
The final model developed based on data from a set of 80 hotels had the following form (Despretz, 2001):
mingPoolHeatedSwimHeating X840194A0.177299039E ⋅+⋅+= , [kWh] [Eq. 6.8] (With: R2= 0.626)

37
The suggested theoretical water model had the following form (Despretz, 2001):
εXαNαAα
AαXαNααW
olSwimmingPoSwWarmMealsWMenAreaWateredGreWatering
eaNetFloorArCleaningModClimModClimightStaysnOverOS0
++++
++++= , [Eq. 6.9]
Where: W= water consumption [litres]; A= floor or garden area [m2]; N= number of items; X= dummy variable for yes/no; α= regression parameter for activity x, i.e. specific water consumption per unit of activity; ε=error term capturing unobserved phenomena and effects.
The final model developed for European hotels had the form (Despretz, 2001):
WarmMealsN4.27392490W ⋅+= , [litres] [Eq. 6.10] (With: R2= 0.125)
To provide a better understanding of the key factors determining the energy and water consumption in hotel facilities and to link models developed for single facilities with models used to describe groups of hotels with highly varied characteristics, a set of analyses were developed within this project and are presented in detail in Papers VIII and IX. The theoretical models suggested by Despretz (2001) were used in these analyses with some modifications due to data availability.
6.3. Comparison of performance among different chains, and within chain in one location The first study, reported in Paper VIII, investigated the relationship between brand affiliation, hotel standard, and resource management/environmental performance. The sample comprised of 73 Hilton and 111 Scandic hotels from Europe, and annual figures for the year 2004 were used in all analyses. This study also identified and analysed the physical and operational factors affecting resource consumption, and an attempt was made to develop a consumption model for the investigated hotels. The preliminary investigation indicated that higher resource consumption, both total and normalised (intensity), was observed for the upscale brand (Table 6.2). This finding was expected based on results obtained by others (Becken et al., 2001). The individual indicators were however in line with figures reported for other chain hotels of similar standard, as well as benchmarking guidelines. Table 6.2. Statistical overview of the energy and water consumption indicators as well as laundry indicators in the hotels investigated, N=184.
Total energy per unit area, kWh/m2/year
Total energy per guest-night,
kWh/guest-night
Total water per guest-night,
litres/guest-night
Total laundry per guest-night, kg
laundry/guest-night Hilton, N=73
Scandic, N=111
Hilton, N=73
Scandic, N=111
Hilton, N=73
Scandic, N=111
Hilton, N=73
Scandic, N=111
Median 336.3 269.9 79.5 45.4 393.4 203.0 3.69 2.00Mean 364.3 285.7 89.5 47.8 515.6 215.5 4.14 2.021st quartile 280.0 218.0 59.0 37.0 317.0 179.0 2.36 1.833rd quartile 432.0 331.0 114.0 57.0 582.0 240.0 4.45 2.20Skewness 1.07 0.87 0.64 0.91 2.09 1.55 2.70 -1.43Standard deviation 148.6 93.9 39.6 16.9 334.3 59.4 2.46 0.37
Min. 129.3 123.7 17.0 19.1 133.1 85.5 0.68 0.65Max. 859.2 567.7 184.3 102.3 1880.2 506.4 16.17 3.09

38
It was observed that there was a large spread in the characteristics/performance of individual hotels, although standard deviation values were typically smaller in the case of mid-market hotels. Such an observation was expected based on results and comments from other studies (Becken et al., 2001; Warnken et al., 2005). The lower degree of scatter observed for mid-market hotels in the relative frequency (number of hotels in a given class) curves indicated more uniform characteristics and operations for this class of facilities (Figure 6.1).
801-850
701-750
601-650
51-100
451-500
351-400
251-300
151-200
0-50
ranges of normalised energy consumption, kWh/m2/year
30
25
20
15
10
5
0
rela
tive
freq
uenc
y, n
o of
hot
els
Scandic, N=111Hilton, N=73
Scandic:median=269.9mean=285.0
Hilton:median=336.3mean=364.3
a)
1801-2000
1401-1600
1001-1200
901-950
801-850
701-750
601-650
501-550
401-450
301-350
201-250
101-150
0-50
ranges of normalised water consumption, litres/guest-night
40
30
20
10
0
rela
tive
freq
uenc
y, n
o of
hot
els
Scandic, N=111Hilton, N=73Scandic:
median=203.0mean=215.5
Hilton:median=393.4mean=515.6
b)
Figure 6.1. Relative frequency distributions of energy and water consumption indicators for both
brands, a) EUI, kWh/m2/year; b) litres/guest-night. The analysis further lead to the conclusion that physical factors, such as climate, hotel size and services offered, together with operational factors, such as guest-nights and food covers sold and the amount of laundry washed on-site were to a large degree responsible for the total consumption of resources in hotel facilities. A multivariate step-wise regression analysis performed, yielded the following energy models (of total annual energy consumption):
24.1142l006.0fc003.0gn003.0A227.0Eupscale +⋅+⋅+⋅+⋅= , [MWh] [Eq. 6.11] (With: R2=0.751, F statistic (the regression mean square divided by the residual mean square): F=51.33, standard error of the estimate: Se= 2873.52);
66.86-fc009.0gn003.0hc244.6A177.0E market-mid ⋅+⋅+⋅+⋅= , [MWh] [Eq. 6.12]
(With: R2=0.828, F=124.85, Se= 747.3); Where: E= total annual energy consumption [MWh]; A= hotel floor area [m2]; gn= number of guest-nights sold; fc= number of food covers sold; l= amount of laundry washed on-site [kg]; hc= variable assuming the value of 1 for hotels with an on-site health club and 0 for those without.
The following models were developed as rough estimates of the annual water consumption:
2436.26-l029.0fc03.0gn202.0lg865.0A73.0Wupscale ⋅+⋅+⋅+⋅+⋅= , [m3] [Eq. 6.13] (With: R2=0.581, F=18.59, Se= 28812.72);
1891.35-fc006.0gn0.165sp52.1015lg088.0A177.0W market-mid ⋅+⋅+⋅+⋅+⋅= , [m3] [Eq. 6.14]
(With: R2=0.892, F=170.25, Se= 2881.01);

39
Where: W= total annual water consumption [m3]; A= hotel floor area [m2]; lg= total area of landscaped grounds [m2]; gn= guest-nights sold; fc= food covers sold; l= amount of laundry washed on-site [kg]; hc= variable assuming the value of 1 for hotels with an on-site health club and 0 for those without; sp= variable assuming the value of 1 for hotels with spa and pool facilities and 0 for those without.
The results obtained suggested that optimising the performance of upscale hotels on an individual basis may be more justified than benchmarking an entire class of hotels, as the relevance of a uniform benchmark may be questionable. Performance optimisation based on benchmarking appeared, on the other hand, more suited to the mid-market hotels investigated, as these were found to have appreciably more homogeneous characteristics. The main limitation of this study was the use of annual aggregated data and a lack of weather statistics for all locations. This was addressed in the follow-up study reported in Paper IX. This study investigated a group of 15 mid-market hotels (Scandic), all located in the same climate zone (the Greater Stockholm area), and offering relatively uniform services. Key factors determining the energy and water consumption in these hotels were identified and used in developing resource consumption models for these facilities. The individual energy and water performance indicators obtained for these hotels were in agreement with figures reported for other chain hotels of similar standard, as well as benchmarking standards for Sweden. A multivariate step-wise regression analysis indicated that, among (service-wise) homogeneous mid-market hotels, energy consumption was influenced by outdoor temperature, total hotel floor area, and the amount of water consumed:
122.131-w071.0A0.013t957.11E 2004monthly, ⋅+⋅+Δ⋅= , [MWh] [Eq. 6.15]
(With R2=0.838, F=303.5, Se= 62.26); Where: E= total monthly energy consumption [MWh]; Δt= absolute value of temperature difference between the design indoor temperature (tdi) and average monthly outdoor temperature (tmo): modi ttt −=Δ , tdi=18oC (according to Boverket, 2002) [oC]); A= hotel floor area [m2]; w= quantity of water consumed monthly – empirical data [m3].
Water consumption was found to mainly depend on the number of guest-nights sold, total hotel floor area and the presence of spa/pool facilities:
249.706-sp677.150A0.076gn115.0W 2004monthly, ⋅+⋅+⋅= , [m3] [Eq. 6.16]
(With R2=0.846, F=321.22, Se= 332.84); Where: W= total monthly water consumption [m3]; gn= number of guest-nights sold; A= hotel floor area [m2]; sp= variable assuming the value of 1 for hotels with spa and pool facilities and 0 for those without.
To test the accuracy of the models, the respective independent variables for the year 2004 were extracted from the HER database and applied to the models developed. The results from calculations were then compared with measured data for a given month. The trends between the modelled and real data were found to be similar for individual facilities, with better fits achieved for more brand-representative hotels, and those with no water-intensive services (Figure 6.2 & 6.3). For hotels less characteristic of the chain, the model still showed the appropriate trend although the fit with the real data was not always good, and needed to be evaluated on individual basis.

40
Modelled and real monthly energy consumption for:
Hotel 1 - highway location, 11300m2, AC in all areas, district heating and cooling, lodging and conference services
100
150
200
250
300
350
400
450
0 1 2 3 4 5 6 7 8 9 10 11 12 13
Month
Mon
thly
ene
rgy
cons
umpt
ion,
MW
h
Hotel 1 - real data 2004 Hotel 1 - model data 2004
JanuaryFebruary
MarchApril
MayJune
JulyAugust
SeptemberOctober
NovemberDecember
a) Modelled and real monthly energy consumption for:Hotel 2 - city/resort location, 11711 m2, AC in all areas, own gas-fired boiler, lodging,
conference and banquet services
100
150
200
250
300
350
400
450
500
0 1 2 3 4 5 6 7 8 9 10 11 12 13
Month
Mon
thly
ene
rgy
cons
umpt
ion,
MW
h
Hotel 2 - real data 2004 Hotel 2 - model data 2004
JanuaryFebruary
MarchApril
MayJune
JulyAugust
SeptemberOctober
NovemberDecember
b)
Modelled and real monthly energy consumption for: Hotel 3 - city location, 12344m2, AC in meeting rooms only, district heating and
cooling, lodging and catering services
100
200
300
400
500
600
700
0 1 2 3 4 5 6 7 8 9 10 11 12 13
Month
Mon
thly
ene
rgy
cons
umpt
ion,
MW
h
Hotel 3 - real data 2004 Hotel 3 - model data 2004
JanuaryFebruary
MarchApril
MayJune
JulyAugust
SeptemberOctober
NovemberDecember
c)
Figure 6.2. Difference between modelled and real monthly energy consumption for selected hotels.
Modelled and real monthly water consumption for selected facilities
500
1000
1500
2000
2500
3000
0 1 2 3 4 5 6 7 8 9 10 11 12 13
Month
Mon
thly
wat
er c
onsu
mpt
ion,
m3
Hotel 1 - real data 2004 Hotel 1 - model data 2004 Hotel 2 - real data 2004
Hotel 2 - model data 2004 Hotel 3 - real data 2004 Hotel 3 - model data 2004
JanuaryFebruary
MarchApril
MayJune
JulyAugust
SeptemberOctober
NovemberDecember
Figure 6.3. Difference between modelled and real monthly water consumption for selected
facilities. Where: Hotel 1: highway location, 11300 m2, AC in all areas, district heating and cooling, lodging and conference services, swimming pool; Hotel 2: city/resort location, 11711 m2, AC in all areas, own gas-fired boiler, lodging, conference and banquet services, large green area; Hotel 3: city location, 12344 m2, AC in meeting rooms only, district heating and cooling, lodging and catering services.

41
The Stockholm energy model provided a very poor fit for two of the hotels investigated (Figure 6.4 a & b). In the case of water, these hotels showed no major deviation from the trends of fit achieved for other facilities.
Modelled and real monthly energy consumption for: Hotel X - city location, 4260m2, AC in public and meeting rooms, district heating ,
lodging services
-50
0
50
100
150
200
250
0 1 2 3 4 5 6 7 8 9 10 11 12 13
Month
Mon
thly
ene
rgy
cons
umpt
ion,
MW
h
real data 2004 model data 2004 real data 2005 model data 2005
JanuaryFebruary
MarchApril
MayJune
JulyAugust
SeptemberOctober
NovemberDecember
a) Modelled and real monthly energy consumption for: Hotel Y - highway location, 8000m2, no AC, district heating ,
lodging and conference services
0
50
100
150
200
250
300
0 1 2 3 4 5 6 7 8 9 10 11 12 13
Month
Mon
thly
ene
rgy
cons
umpt
ion,
MW
h
real data 2004 model data 2004 real data 2005 model data 2005
JanuaryFebruary
MarchApril
MayJune
JulyAugust
SeptemberOctober
NovemberDecember
b)
Figure 6.4. Difference between modelled and real monthly energy consumption for the two problematic hotels.
Excluding these two hotels from the total sample reduced the accuracy of the model for the remaining 13 hotels. It was thus decided to construct an energy model just for these two unique facilities:
553.153w0.382-A0.019t344.5E X2004,monthly, +⋅⋅+Δ⋅=andY , [MWh] [Eq. 6.17]
(With R2=0.73, F=17.72, Se= 25.58).
The application of these models to the problematic hotels resulted in good fits both for the data from 2004 and 2005 (Figure 6.7). Application of these models to other hotels yielded a very poor fit, highly underestimating the consumption.
Modelled and real monthly energy consumption for: Hotel X - city location, 4260m2, AC in public and meeting rooms, district heating ,
lodging services
0
50
100
150
200
250
0 1 2 3 4 5 6 7 8 9 10 11 12 13
Month
Mon
thly
ene
rgy
cons
umpt
ion,
MW
h
real data 2004 model data 2004 real data 2005 model data 2005
JanuaryFebruary
MarchApril
MayJune
JulyAugust
SeptemberOctober
NovemberDecember
a) Modelled and real monthly energy consumption for: Hotel Y - highway location, 8000m2, no AC, district heating ,
lodging and conference services
0
50
100
150
200
250
0 1 2 3 4 5 6 7 8 9 10 11 12 13
Month
Mon
thly
ene
rgy
cons
umpt
ion,
MW
h
real data 2004 model data 2004 real data 2005 model data 2005
JanuaryFebruary
MarchApril
MayJune
JulyAugust
SeptemberOctober
NovemberDecember
b)
Figure 6.7. Difference between modelled and real monthly energy consumption for the two problematic hotels (model created specifically for these 2 facilities).
This investigation suggested that it may be more accurate to construct models for individual facilities. Simple test regression analyses performed on all Stockholm hotels indicated that energy consumption was dependent on the outdoor air temperature, while water consumption was mainly influenced by the number of guest-nights sold.

42
6.4. Modelling of energy and water consumption at individual facilities The study performed on 20 selected hotels from Sweden aimed to develop simple and user-friendly monthly utility consumption models for individual hotels. The goal was to create models that would yield reliable and accurate consumption forecasts with limited and easily obtainable input data. The models were developed from the available weather and operational monthly data between 2000 (or any later year) and 2005, as well as figures from 2004 alone. The initial year was set as 2000 because most of the currently operating Swedish Scandic hotels were included in the company portfolio following that year. In addition, the quality of verified data after 2000 is believed to be very good. The data for years before 2000 was also verified but it was possible that at times only major discrepancies were identified and corrected. Multi-variate step-wise regression analysis was applied and indicated that, for individual hotels, energy consumption was primarily influenced by actual heating degree days. This correlation may be very specific for facilities located in cold climates. For hotels in other regions it may be more appropriate to develop separate models for heating energy as a function of heating degree days, and for electricity as a function of guest-nights sold and cooling degree days (where the cooling/AC system is run on electricity). Water consumption was, to a large extent, driven by the number of guest-nights sold alone. Other variables, such as guest-nights and food covers sold and the quantity of water consumed (for energy consumption) and food covers sold (for water consumption), did not show up to be statistically significant. This limited input data requirement presented a significant advantage of the scheme, especially from the hotelier perspective. To test the accuracy of the individual models, actual heating degree days and guest-nights sold for all months between 2000 and 2005 were used as independent variables in the respective models and the calculated results then compared with measured data for a given month. The models created in this manner were simple, yet they offered quite accurate results, especially in the case of energy consumption. For half of the facilities investigated, the fit between forecasted and real energy consumption was in agreement (Figure 6.7). Because hotels from all regions of Sweden, representing all sizes and types of energy carriers used for heating (district heating and own oil boilers) can be found in this sample, this share can be assumed to be representative of the remaining hotels in the company portfolio (not modelled in this study).

43
Hotel in Stockholm (JK): highway location, 11300m2, AC in all areas, district heating & district cooling, lodging
& conference services
0
50
100
150
200
250
300
350
400
450
Janu
ary
April
July
Octobe
r
Janu
ary
April
July
Octobe
r
Janu
ary
April
July
Octobe
r
Janu
ary
April
July
Octobe
r
Janu
ary
April
July
Octobe
r
Janu
ary
April
July
Octobe
r
Mon
thly
ene
rgy
cons
umpt
ion,
MW
h
Hotel in Karlstad (W):city location, 10640m2, AC in meeting rooms only, district heating,
lodging & conference services
0
50
100
150
200
250
Janu
ary
April
July
Octobe
r
Janu
ary
April
July
Octobe
r
Janu
ary
April
July
Octobe
r
Janu
ary
April
July
Octobe
r
Janu
ary
April
July
Octobe
r
Janu
ary
April
July
Octobe
r
Janu
ary
Mon
thly
ene
rgy
cons
umpt
ion,
MW
h
Hotel in Vaxjö:
city/shopping district location, 4222m2, no AC, own oil-fired boiler, lodging & limited conference services
0
50
100
150
200
250
Janu
ary
April
July
Octobe
r
Janu
ary
April
July
Octobe
r
Janu
ary
April
July
Octobe
r
Janu
ary
April
July
Octobe
r
Janu
ary
April
July
Octobe
r
Janu
ary
April
July
Octobe
r
Janu
ary
Mon
thly
ene
rgy
cons
umpt
ion,
MW
h
Real energy data Model based on 2000-2005 (only DD) Model based on 2004 (only DD) Figure 6.7. Difference between modelled and real monthly energy consumption for individual hotels (models created individually for each facility, with actual heating degree days as the only
independent variable). For some other hotels, the energy fits obtained were not very precise on a monthly basis but the trends indicated by the modelling clearly followed real consumption (Figure 6.8). No distinct rule related to the occurrence of the discrepancies could be established. These could be found in all seasons of the year. Discrepancies in the summer (model underestimating utility consumption) might be an indication of a higher base load than predicted, or the actual cooling demand covered by the installed AC system (only heating degree days were included in the model, while some of the facilities offer air-conditioning in hotel areas).
Hotel in Stockholm (H):city/resort location, 11711m2, AC in all areas, own gas-fired boiler,
lodging, conference & banquet services
0
100
200
300
400
500
600
700
Janu
ary
April
July
Octobe
r
Janu
ary
April
July
Octobe
r
Janu
ary
April
July
Octobe
r
Janu
ary
April
July
Octobe
r
Janu
ary
April
July
Octobe
r
Janu
ary
April
July
Octobe
r
Mon
thly
ene
rgy
cons
umpt
ion,
MW
h
Real energy data Model based on 2000-2005 (DD only) Model based on 2004 (DD only)
Hotel in Norrköping (C):city centre location, 6600m2, no AC, district heating, lodging & conference services
0
50
100
150
200
250
Janu
ary
April
July
Octobe
r
Janu
ary
April
July
Octobe
r
Janu
ary
April
July
Octobe
r
Janu
ary
April
July
Octobe
r
Janu
ary
April
July
Octobe
r
Janu
ary
April
July
Octobe
r
Janu
ary
Mon
thly
ene
rgy
cons
umpt
ion,
MW
h
Real energy data Model based on 2000-2005 (only DD) Model based on 2004 (only DD) Figure 6.8. Difference between modelled and real monthly energy consumption for individual hotels (models created individually for each facility, with actual heating degree days as the only
independent variable).

44
Another observation was that during the period under investigation, initially, the long-term model “2000-2005” tended to offer good fits between the real and the modelled data although it underestimated the consumption in the colder months. Towards the end of the test period (after 2004) the “2004” model offered an increasingly good fit to the real data (Figure 6.9). This was also true for the period 1996-2005 and might be attributed to energy improvements made to the building envelope and energy installations over time.
Hotel in Kiruna (1996-2005):city centre location, 10071m2, no AC, district heating, lodging & conference services
0
100
200
300
400
500
600
700
Janu
ary May
Septem
ber
Janu
ary May
Septem
ber
Janu
ary May
Septem
ber
Janu
ary May
Septem
ber
Janu
ary May
Septem
ber
Janu
ary May
Septem
ber
Janu
ary May
Septem
ber
Janu
ary May
Septem
ber
Janu
ary May
Septem
ber
Janu
ary May
Septem
ber
Janu
ary
Mon
thly
ene
rgy
cons
umpt
ion,
MW
h
Real energy data Model based on 2000-2005 (only DD) Model based on 2004 (only DD)
Hotel in Kiruna (2000-2005):city centre location, 10071m2, no AC, district heating, lodging & conference services
0
100
200
300
400
500
600
Janu
ary
April
July
Octobe
r
Janu
ary
April
July
Octobe
r
Janu
ary
April
July
Octobe
r
Janu
ary
April
July
Octobe
r
Janu
ary
April
July
Octobe
r
Janu
ary
April
July
Octobe
r
Janu
ary
Mon
thly
ene
rgy
cons
umpt
ion,
MW
h
Real energy data Model based on 2000-2005 (only DD) Model based on 2004 (only DD) Figure 6.9. Difference between modelled and real monthly energy consumption for an individual
hotel located in the far North of Sweden (model applied to 1996-2005 and 2000-2005; model created individually for the facility, with
actual heating degree days as the only independent variable). This study suggested that for the development of a model it was better to use periods of input data longer than 12 months to allow the model to consider and make corrections for the unique thermal and operational characteristics of the hotel (the “2000-2005” models offered better fits in the long run). Preferably, the period used to develop the model should be set in such a way as to account for major changes to the building envelope and energy installations. In most cases, any larger discrepancy between the real data and the model can be treated as an indication of a problem in the energy system or a significant change in the hotel’s characteristics (faulty meter, exceptionally high or low indoor temperatures, or problems with the boiler/district heating/cooling supply system or heat exchanger, as well as one-time, large scale events hosted at the hotel). Fits for water data were typically worse than those for energy, but this was consistent with comments provided by other studies dealing with water modelling in hotels (Despretz, 2001). Most authors concluded that it was very difficult to model water accurately, mainly because of its high dependence on the habits of individual guests. Nevertheless, some hotels in the sample investigated here showed very good fits between the modelled and real data with guest-nights as a major driver (Figure 6.10).

45
Hotel in Kalmar (V):highway location, 5485m2, no AC, district heating, swimming pool,
lodging & limited conference services
0
200
400
600
800
1000
1200
1400
1600
Janu
ary
April
July
Octobe
r
Janu
ary
April
July
Octobe
r
Janu
ary
April
July
Octobe
r
Janu
ary
April
July
Octobe
r
Janu
ary
April
July
Octobe
r
Janu
ary
April
July
Octobe
r
Janu
ary
Mon
thly
wat
er c
onsu
mpt
ion,
m3
Real water data Model based on 2000-2005 (only gn) Model based on 2004 (only gn)
Hotel in Malmö (K):city centre location, 6373m2, AC in public & meeting areas, district heating,
lodging & conference services
0
200
400
600
800
1000
1200
1400
Janu
ary
March
May
July
Septem
ber
Novem
ber
Janu
ary
March
May
July
Septem
ber
Novem
ber
Janu
ary
March
May
July
Septem
ber
Novem
ber
Janu
ary
March
May
July
Septem
ber
Novem
ber
Janu
ary
Mon
thly
wat
er c
onsu
mpt
ion,
m3
Real water data Model based on 2002-2005 (only gn) Model based on 2004 (only gn) Figure 6.10. Difference between modelled and real monthly water consumption for individual
hotels (model created individually for each facility, with guest-nights sold as the only independent variable).
Poor fits for water consumption in most other hotels may be attributed to additional water-intensive services offered at the hotel or guest-specific behaviour. However, at the time of the study there was no relevant data available, which made it difficult to identify these factors. Food covers are frequently mentioned as important drivers of water consumption but in this study these were only available in 2004 and 2005 and for most hotels the Student t-test indicated them as not important. Water models developed in this study, in general, should not be treated as reliable and representative of the entire portfolio. More research is required into factors affecting water consumption in individual hotels to develop accurate consumption models. The modelling of energy and water consumption at 20 selected hotels in Sweden indicated that an individual approach may be more appropriate for the hotel industry than developing models for entire brands or hotel standard categories. The individual models suggested are very simple, do not require highly specific hotel information, rely only on weather and basic operational data, and yet these models still achieve acceptable fits with real data and predict realistic utility consumption. In addition, because of the single independent variable used, these models can be easily developed with the use of the Microsoft Excel program, and do not require much background information or skills from the user. These models can be developed for any type of hotel, since it is a hotel specific approach. The size of the hotel has no influence on the accuracy of individual models, thus precise forecasting can be performed for both small and large hotels. At times where low accuracy is obtained from the model, there must be other factors that have influenced it, and these should be investigated on an individual basis. These may be faulty or not well calibrated meters, a discrepancy between real consumption and the consumption stated on the invoices, or additional highly resource intensive services or installations present in the hotel but not accounted for by the model. It needs to be remembered, that tools such as the above suggested models should not be used as the final and ultimate prediction of the facility’s performance. Instead, they can be used as indicators of possible problems or need and opportunity for improvement. The implementation of the above concepts within a large scale computerised system will be presented in the next chapter.

46
6.5. Findings The findings of this study provided a number of insights that may have significant relevance for the development of resource modelling and performance benchmarking in the hotel industry at large. First, it was concluded that although the commonly reported indicators are relevant to hotel operations, there is a need to provide a perspective as to the environment/conditions in which these indicators are achieved. It is thus suggested that, besides providing performance indicators, absolute consumption figures should also be disclosed. A step further would be to publish reduction goals together with results achieved. These actions would definitely improve the transparency of environmental and performance reporting in the hotel industry, and would also lead to a better understanding of the resource utilisation and environmental impacts of this sector. As indicated by previous studies there are many factors affecting resource consumption and management in hotels. Generally, these include hotel standards and management contracts, type of facility (in terms of services offered as well as building envelope and building system characteristics), climate zone, hotel standard, occupancy rates in the lodging section as well as in other revenue-generating areas, and internal environmental policy, to name but a few. The great variation of hotel characteristics between brands and even within brands makes resource modelling and performance benchmarking of the entire industry not very appropriate or even reliable. It was found that even among relatively uniform/homogeneous (service-wise) hotels the services offered did influence overall consumption, further complicating the concept and applicability of uniform benchmarking. On a monthly basis climate conditions and operational variables were found to define resource consumption. Climate and weather conditions represent the major driver but these are dependent on external forces and businesses cannot affect their influence. Occupancy is also a significant driver, and although it is primarily dependent on the economic situation and market trends which cannot easily be affected by a single enterprise, better promotion, marketing and sales strategies can improve performance of individual hotels as well as entire corporations. The incorporation of new services and products, such as for example adding new pools and spa services, catering outlets, or changing to less resource-intensive services, influences the hotel’s standard and thus performance. Such changes need to be considered while developing resource consumption models and performance benchmarks, by for example, sub-categorisation of hotels. The refurbishment stage and incorporation of new installations is an important phase in the hotel building’s life-cycle, where appropriate decisions related to increasing efficiency and reducing resource wastage can be made, thus improving performance. These also need to be accounted for in the models and benchmarks in a similar manner, as in the case of new services. Operational procedures, including cleaning and maintenance routines and general awareness of the personnel comprise important factors affecting hotel performance, although it is difficult to incorporate these factors in models or benchmarks. The results of improvements in these areas can only be evaluated on a long-term basis. The behaviour of customers and their willingness to act in a more responsible manner can also have a noticeable influence on the overall performance of individual hotels. Hotel businesses may attempt to influence the attitudes and behaviour of the clientele but it is a long-term process requiring a significant effort from all the stakeholders involved. All these issues need to be kept in mind while developing resource consumption models and benchmarks for the hotel sector. This study also indicated that, instead of creating models for hotel categories or brands, it may actually be most accurate to develop models for individual hotels. However, to ensure the user-friendliness and usability of these models they ought to be created based on minimum input data (actual heating/cooling degree days or absolute value of temperature difference between the design indoor temperature (tdi) and average monthly outdoor temperature (tmo) - for energy

47
consumption; and guests served – sleepers, as well as restaurant and conference participants for water use). As indicated in the current study these variables are in most cases significant enough to predict the consumption in a reasonable range (although in some unique cases only trends can be established). For northern European locations forecasting energy consumption seems to be much more accurate than modelling water use, and this needs to be considered if these concepts are to be applied in the industry. In most cases, any larger discrepancy between real and forecast consumption can be treated as an indication of a problem and should result in a closer investigation of the systems. Nevertheless, it needs to be underlined that for some hotels it will not be possible to develop any accurate models based on single input data. For hotels in other regions it may be more appropriate to develop separate models for heating energy as a function of heating degree days, and for electricity as a function of guest-nights sold and cooling degree days (where the cooling/AC system is run on electricity). Other hotels may require inclusion of additional input data in the model (i.e. occupancy rate in the conference rooms – if these rooms are equipped with an AC and the hotel is a popular conference centre; or the swimming pool water refill rates and schedule – if there are large swimming pools). In addition, some facilities may have strongly seasonal trends depending on their location and target clientele. These may thus require creation of separate consumption forecasting models for low and high seasons. The study presented here brought yet another and somewhat new chain of thought. It is well known that hotels are generally complex systems with individual modules/sub-systems, such as guest-rooms, catering outlets, conference centres and recreational amenities combined into a greater whole. Due to these varied service requirements, the acceptable resource intensity for hotel rooms for example, may be quite different from that for conference rooms, or other areas. Due to the difference in distribution (proportion of the overall area or revenue generated) of these modules in different hotels, having one benchmark value for an entire facility and based on absolute figures may appear to be too simplistic (as indicated by the great variation in performance indicators reported in various studies as well as those recommended by relevant organisations). It may thus be more appropriate to disaggregate hotel establishments into individual modules/components, such as catering units, sports and health centres, conference/business centres, and develop consumption models and indicators for these particular sub-systems. The individual efficiencies/performance indicators from modules should then be combined and weighted to provide a just overall evaluation of a facility that could then be compared to a benchmark (developed in the same manner). This would allow the construction of benchmarks for all types of hotels regardless of their service structure, by relying on a “Lego” type construction of benchmarks. More research with highly detailed input data is required to test the above hypothesis and eventually to provide reasonable models, weighting factors and benchmarks.

49
7. Environmental reporting and performance benchmarking tools and strategies (Paper X)
7.1. Existing tools for environmental benchmarking in the hospitality sector The need for transparency in documenting company performance is growing in importance in these times of rapid globalisation, especially from the perspective of fair trade and corporate social responsibility, among other reasons. Benchmarking, on the other hand, is a new management tool, gaining popularity as an extension of already existing quality programs in businesses, although some authors, including Kozak & Nield (2001), conclude that “the use of benchmarking in the tourism industry has been limited and is still in its infancy, restricted to operational units and businesses”. According to Wöber (2001) “benchmarking is a systematic procedure of comparative measurement with the objective to achieve continuous improvement”, while Camp (1989) defines benchmarking as “search for industry best practices that will lead to superior performance”. The main aim of benchmarking is to compare operational efficiency and environmental impact within facilities having a similar portfolio and to indicate possible improvements in business activity, processes and management by establishing more efficient operational standards. Wöber (2002) distinguishes two levels of benchmarking, internal and external. Benchmarking typically involves the analysis of processes within one’s own business and those in other businesses, the comparison between the two, and, eventually, the development of measures aimed at closing identified performance gaps. Comparisons are typically performed at baseline and best practice levels. The success of benchmarking in recent years can be related to its implications for financial benefits and increased environmental awareness. As a highly motivational process, benchmarking encourages company managers to improve environmental performance and thereby increase their profitability. To achieve success, reliable tools for the assessment of hotel environmental performance are needed and relevant quantitative and qualitative information from individual facilities must be collected. The quantitative figures include energy, water and chemicals consumption, waste generation; turnover; number of customers; indoor temperature/humidity conditions; investment within local communities, etc., and are acquired from various meters, invoices and other financial statements. The latter present attitudes, pro-environmental measures and social initiatives in place, and are obtained from questionnaires/interviews with staff and managers, and recommendations made by various stakeholders. The most commonly used environmental indicators are presented in the previous chapter. In addition many economic and social indicators can also be collected (these are presented in Paper VII). While it may be relatively easy to state the commitment to report environmental performance, compliance with the statement is frequently limited by a multitude of factors. Especially since benchmarking of building energy (and even more so, environmental) performance is a relatively new area of interest and, as yet, there is no system or methodology of data collection and monitoring that would be universally accepted or applicable throughout the hotel sector. Recently, a number of environmental reporting/benchmarking tools for hotels have been developed by international environmental organizations, branch associations and even hotel corporations (Paper VII; Matson & Piette, 2005). Major commercially available instruments include IBLF/IHEI benchmarkhotel, Hospitable Climates Hospitality Energy Analysis Tool – HEAT Online, Green Globe 21 scheme, as well as US EPA/DOE Energy Star Portfolio Manager and Green Globes Canada/GEM UK (in Canada upgraded to BOMA Go Green Comprehensive System and BOMA Go Green Plus on May 24, 2005). The two latter tools, although not primarily intended for the hospitality sector offer their services for hotel buildings. In addition, major hotel corporations, including Accor International, Fairmont Hotels & Resorts,

50
InterContinental Hotels Group, Hilton International, Hyatt International, Marco Polo Hotels, Rezidor SAS, Shangri-La Hotels & Resorts have developed their own reporting schemes3. The various schemes differ with regard to geographical/climatic areas covered, types of hotel facilities included, detail of environmental information required, benchmarking methods, user-friendliness and implementation costs. Nevertheless, all these systems aim to assist the hotel manager in evaluating environmental performance of the facility and frequently offer an indication of possible improvements. Most of these tools are for-profit instruments or internal applications and, as a result, there is limited publicly available information on the system development process, its limitations, and the transparency of the data collected. This hinders the reliability of such instruments and does not provide guidance on how to design and successfully incorporate similar system elsewhere. To the best of the author’s knowledge only a few studies have been made of the environmental reporting and benchmarking tools (computerized and traditional) within the hotel industry so far (Papers V-VII; Green Hotelier 16, 1999; APEC, 1999; Despretz, 2001; Matson & Piette, 2005; an accounting web-based reporting system was described by Wöber, 2001). An attempt was thus made to evaluate the existing reporting/benchmarking tools (to the extent that data was available). The resulting comparison of some of the commercially available schemes is presented in Table 7.1, while a detailed description of three of the schemes can be found in Paper VII.
3 References to the existence of reporting schemes were found on company websites, in internal and/or environmental reports, Green Hotelier Magazine (16-1999; 19-2000), in best practice compilations and in Wilson (1999), Burke (2001), and WTO (2004). However, detailed information was rarely available.

51
Table 7.1. Comparison of some of the benchmarking schemes (partially adapted from Paper VII, Matson & Piette, 2005; own experience with IHEI benchmarkhotel software, 2005; HEAT Online, 2006; Green Globes Canada/BOMA Go Green software, 2005-2006; and Energy Star Portfolio Manager software, 2006)
Green Globe 21 IHEI benchmarkhotel HEAT Online US EPA/DOE Energy Star Portfolio Manager
Green Globes Canada / BOMA Go Green
Type of tool Traditional reports On-line (www.benchmarkhotel.com)
On-line (www.hospitableclimates. org.uk)
On-line (www.energystar.gov)
On-line (www.greenglobes.com)
Geographical coverage/ Climatic zones
Accounted for by temperature calculations
Temperate, Mediterranean, tropical
UK only, based on postal codes
USA, accounted for by degree day calculations (based on postal codes)
Canada
Different types of hotels
Yes, 5 types: business hotels, vacation hotels, motels, bed & breakfast, hostels
Yes, 3 types: luxury full-service, mid-range full-service, small & budget
Yes, 3 types: large luxury, medium, small
Yes, 5 types: upper upscale, upscale, mid-scale with food & beverage, mid-scale w/w F&B, economy & budget
Not really for hotels, but contains a module for hotels
Building characteristics, engineering systems
No Mostly included in hotel types, which are very specific
Included in hotel type and detailed additional questions
Mostly included in hotel types, additional information on on-site services and types of spaces required
Yes – detailed
Resource consumption
Building only Building only Building only Building only Building only
Periodical reporting/benchmarking
Annual Annual Annual (suggested), number of months can also be chosen
Monthly for 12 or 24 months
Monthly for 12 months
Type and level of input data
Seven core earthcheckTM indicators: presence of sustainability policy, social commitment, consumption of water, recycled materials, chemicals and energy (all types of fuels), solid waste generation
Hotel profile & operational characteristics, green purchasing, water and energy consumption and costs (all types of fuels), waste water quality, waste generation and minimization
Building information, energy systems and efficiency improvements, services provided, energy consumption and cost data
Location, building type, occupancy characteristics, energy consumption and cost data (a number of meters can be included, few options of fuels and units)
Building characteristics, indoor environment, environmental management systems, consumption of water and energy, generation of emissions and wastes

52
Green Globe 21 IHEI benchmarkhotel HEAT Online US EPA/DOE Energy
Star Portfolio Manager Green Globes Canada /
BOMA Go Green Data quality issues Data verification
by an external organization: Earth Check Ply Ltd
No data verification for the user (development in progress)
No data verification for the user (note on accuracy)
Internal verification system used in weather normalization of data (based on E-Tracker tool), thus floor area & energy consumption data for individual observations may be estimated or rounded
No data verification for the user, data verification by system owner (before it is included in the database)
Level of detail Low Low Moderate Moderate/high High Level of expertise from person performing the analysis
Low Low Moderate (good knowledge of the hotel required)
Moderate High
Report type Graph (Figure 7.1) Table (Figure 7.2) Graph (Figure 7.3) and description
Table (Figure 7.4) Graph and description (Figure 7.5)
Benchmarking Against country baseline and best practice (developed from published statistics and normalized according to local/national conditions)
Against other hotels in the database and literature data
Against other hotels with similar characteristics in Energy Measures database
Against American buildings data collected in CBECS database
Against other buildings in the database
Indication of possibilities of saving and suggestions for improvements
No Yes Yes, comprehensive Not in this program, information available under Energy Star framework; possibility of setting reduction targets
Yes, comprehensive and with links to relevant websites
Cost US$ 20 (guidelines only) US$ 210 Free of charge Free of charge US$ 200

53
350
300
250
200
150
100
145.7187.4
201.1
Year 1 Year 3Year 2
MJ/guest-night
Baseline Performance LevelBest Practice Performance Level
Figure 7.1. Example of Green Globe 21 earthcheckTM energy indicator and benchmark for
accommodation (Scott et al., 2004).
Figure 7.2. Energy performance report generated by IHEI benchmarkhotel
(benchmarkhotel, 2005).

54
Example based on own data from a hotel in London
Example provided by HEAT Online
Figure 7.3. Energy performance report generated by HEAT Online for a hotel facility in London (own analysis, and examples from HEAT Online, 2006).

55
Figure 7.4. Energy Star Portfolio Manager output table for a hotel facility in Stockholm (own
analysis), energy intensities in kBtu/feet2 (US EPA/DOE, 2006).
Figure 7.5. Report with percentage scores achieved by a hotel facility in Stockholm
(own analysis) according to the Green Globes Canada (2005). In addition to the benchmarking instruments presented in this section other aids have also been created for the hotel industry. One of those tools is the XENIOS software and methodology developed within the EU Altener program framework (Dascalaki et al., 2003; Balaras et al., 2004; Dascalaki & Balaras, 2004). The ultimate goal of this software is to assist in hotel audit prior to the renovation process, and to allow for a quick assessment of areas
Percentage Scores
EMS DocumentationIndoor Environment
Emissions
Resources
Water
Energy

56
where energy efficiency improvements can be implemented with highest cost-efficiency. The software has been successfully tested in a number of European locations, however it requires a trained specialist to perform the audit, and it thus cannot be treated as a do-it-yourself/self-assessment tool for the hotel sector. Typically, if the hotel facility is to be renovated a consultant company is contracted to perform all the necessary analyses and visualisations. And unless the consultant uses a tool like XENIOS, it is unlikely that the management would spend extra funds to get another evaluation. On the other hand, if a self-assessment instrument was readily available and easy to use, the probability of its utilisation by individual enterprises would likely increase. Information on tools developed by hotel companies is scarce with only single case study presentations (i.e. the system made by Accor in WTO, 2004; the Scandic Utility System and Hilton Environmental Reporting presented in Papers V-VII and X). A survey performed among the corporate managers provided some important insight into the existence of reporting instruments and their types. Of the 13 hotel corporations that participated in the survey administered in March-April 2006, nine confirmed using a performance reporting tool. Five of those, used their intranet or Internet to collect the information, while the remaining companies rely on e-mail submissions to the headquarters of Microsoft Excel files from individual hotels. Half of the corporations questioned (7 companies) require monthly reports on resources used, their costs and operational data, with two requiring only quarterly figures. One of the companies requires additional and more comprehensive annual reports. Some admitted to collect only financial information, while others require figures on carbon dioxide emissions, recycled materials, as well as noted reductions in utility consumption. The two oldest systems date back to the early 1990s, with most other tools introduced post-2000 (at times these are upgraded versions of the previously existing systems). All sub-brands are encouraged to use the system, and corporate management estimate the active participation of their hotels at the level of 80-100%. All companies communicate the results obtained to their personnel and 7 out of 9 also share the information with their customers and suppliers. Meetings, e-newsletters/staff magazines, intranet and in-house message boards are among the most popular media for communicating environmental performance to hotel personnel, while company web-sites, monthly and annual reports, posters, folders and other marketing materials are used to inform customers and suppliers. The combination of the information received from the respondents with information/descriptions available in published/literature sources (i.e. WTO, 2004) allows for the presentation of a very rough picture of the market penetration by such tools. It was concluded that a considerable number of hotel corporations collect information on the individual performance of hotels. This information is however typically limited to the cost figures, necessary for the preparation of annual financial reports. In addition, the information collected is rarely used to continuously monitor performance of individual facilities, the goal is rather to provide aggregated figures at the end of the fiscal year. Nevertheless, in recent years more and more companies have decided to develop systems that would not only allow for periodical collection of financial information, but also for continuous monitoring of actual performance of individual facilities as well as the entire corporation. Benefits offered by information technology and the Internet in this regard are obvious, as pointed out by academia (Isenmann, 2004) and the industry itself: “Accor is currently planning of the automation of its water and energy consumption data collection systems throughout all its hotels. This will ensure a standardization of reporting which will improve the consistency and efficiency of the Group’s sustainability indicators” (WTO, 2004). This situation calls for a detailed study and thorough understanding of the development, implementation and problem solving in such systems. These issues were studied by the

57
companies that already have reporting tools, but the resulting reports are internal documents not available to the public or competing establishments. The following sections present the author’s experience partaking in the development and upgrading process of the Hilton Environmental Reporting system (also presented in Paper X).
7.2. Transparency, user-friendliness and simplicity of the system The available literature on sustainability indicators provides significant guidance on the choice of relevant performance parameters and the information required (such as the consumption of water, electricity, fuels and chemicals, the generation of waste and laundry, and specific information relevant to facility operation). Related performance monitoring and reporting systems are widely expected to be user-friendly and universally applicable (e.g. throughout a hotel chain), at the same time they need to be flexible enough to account for the unique features of individual facilities. Difficulties typically arise when system users at individual hotels are not able to collect the requested information due to its limited availability on-site. One of the possible solutions is to involve future users in the design and development of the system. First and foremost, staff members located in the hotel have knowledge and experience of the situation and access to real-life data and information. In addition, they can help in assessing what outputs from the system are most useful at department and hotel levels. Finally, when participating in the creation of the system they will identify with the concept and will probably be more willing to use it. Of course, in the case of larger companies it is virtually impossible to involve all personnel in such a project. Therefore, a representative sample of future users ought to be chosen, preferably having different backgrounds, level of technical and environmental knowledge and skills, as well as functions within the hotel structure. In addition, representatives of various levels of the corporate management could also participate in the process, together with an external consultant experienced in environmental management and reporting in hotel businesses. If available, outsourced providers of the services, and thus data, may also be invited to participate. When the system is being developed it is important to provide users with detailed descriptions of what is required from them and where the information can be found. Definitions of various terms ought to be provided and calculations helping in various conversions can be developed (i.e. laundry and waste converters/calculators developed within HER, Figure 7.6). Information that is relatively constant for a given facility (such as facility characteristics, electricity mix, types and quantities of refrigerants used) should preferably be collected in a hotel profile file updated annually to reduce the amount of information reported monthly (Figure 7.7). Comprehensive hotel profile descriptions would also allow for a more accurate benchmarking of performance.

58
Figure 7.6. Laundry and sorted waste calculators developed for HER (HER, 2006).

59
Figure 7.7. Section of a hotel profile developed in HER (HER, 2006).

60
If the possibility exists, data which is difficult to obtain by individual users, i.e. degree days or average monthly outdoor temperatures, could be introduced into the database centrally from one source, as is the case with the upgraded HER version. Frequently, central population/centralised updating of such a database may be a more efficient solution, which would ensure the prompt reporting of high quality information. However, such an arrangement could have a reduced educational purpose, and would not be likely to encourage individuals to be concerned about the performance of their facility. A combination of centrally populated data with information collected and reported by individual users may prove to be the optimal solution. Another argument for centralised updating is that it may reduce the need for technical support. Nevertheless, there will always be technical problems, some of which cannot be solved by the users. Therefore, there must be constant and prompt support from a person with a good knowledge of the system and high level authorization to modify it. A lack of support in solving the problems of the users may reduce their willingness to use the system and thus lead to the failure of the initiative. Central population of the database may also be a solution reducing the risk of incorrect data (avoidance of typing errors or other mistakes made by individual users). Nevertheless, internal (within the computer system itself) or external (by a corporate or regional environmental coordinator or a specially appointed consultant) verification of data quality is necessary, at least periodically (issue emphasized by Wöber, 2002). During the development of the system the issue of data security needs to be addressed, especially with regard to sensitive proprietary data on cost and occupancy. A procedure needs to be designed and enforced to ensure that only company employees have access to the database. Furthermore, the previously mentioned, differentiation of user levels and related rights and access areas in the system may reduce the overall risk of data exposure and ensure useful information provided to each user. Care needs to be taken to have up-to-date information on facility’s status in the database, such as renovations, sales and acquisitions, in order to have all of the operational hotels from the portfolio actually reporting to the system. The transparency of the system ought to be ensured by detailed information on the computer system’s status/development, as well as the conversion factors and mathematical models used in the creation of output reports. Preferably conversion factors and computational procedures developed and accepted by internationally recognized organizations should be used. Climate differences among various locations also need to be considered for the purpose of comparisons, and properly accounted for (either by the sub-classification of hotels into regional groups, or by incorporation of degree day data or average monthly outdoor and indoor temperatures). In order to ensure proper and accurate benchmarking as well as to reduce possible errors, methodologies for data collection and reporting procedures need to be standardized and detailed. The software interface ought to be user-friendly and attractive, both in terms of navigation as well as general layout. It should also be in line with company image and policy. In addition, the system ought to be adapted to the needs and possibilities of users at all levels of the organization. The possibility of personalization of the sites would surely increase the value of the software. In the case of companies with a differing portfolio (a number of hotel standards represented) a hotel sub-classification within the database may be a necessary development, in order to ensure realistic comparisons and benchmarks within the brand. Finally, the tool should be interactive and provide instantaneous feedback to the user.
7.3. Useful feedback and support in the output phase The system could be designed to serve not only as a tool for collecting resource consumption data but also as a framework and monitoring instrument for a more comprehensive environmental program. The type of output provided by the system ought

61
to be well defined, as different information may be of interest at different levels within the company. Typically recognized feedback levels in hotel companies include individual hotel, brand, country and entire portfolio. These are also typical benchmarking groups. For a user at an individual hotel the major interest is to monitor one’s own performance over the years (Figure 7.8a), as well as compare one’s own resource consumption with those of similar hotels in the country (Figure 7.8b). In HER, these reports are available for energy, water, unsorted waste and laundry, while reports presenting emissions of CO2 at hotel level and comparisons with best-in-the-class are being developed. All reports can be downloaded as Microsoft Excel file for future reference and off-line use. The hotel manager may also be interested in following the status of forms reporting at the hotel, provided in the Executive Feedback Report (Figure 7.9).
Total Energy (kWh)2003-2005
0
100 000
200 000
300 000
400 000
500 000
600 000
700 000
January February March April May June July August September October November December
Hilton Stockholm Slussen
Sweden
EA
200320042005
a)
Total Energy / Guest Night (kWh)
Monthly average 2003-2005, Year-To-Date (YTD) January-JuneNote that only fully reported months for every hotel are included in analysis
0
10
20
30
40
50
60
70
80
90
Hilton Stockholm Slussen Average Sweden Average Hilton
Sweden Average Hilton
EA Average Hilton
200320042005
Sweden
b)
Sweden
Figure 7.8. Standard report in HER showing (HER, 2006):
a) total energy per month for an individual hotel compared with absolute figures from earlier years (2003-2005 figures);
b) total energy per guest-night for an individual hotel, compared with the average for the country and the Hilton average (year-to-date, January-June 2003-2005 figures).

62
Figure 7.9. Executive Feedback Report showing the status of form reporting for an individual
hotel (HER, 2006). For users interested in more advanced analysis of their hotel performance so-called Monitoring and Targeting (M&T) reports have been created. These are a set of output reports showing the hotel’s actual performance and the predicted or “forecasted” performance based on models developed from consumption patterns in previous year. For most hotels the drivers currently used are guest-nights sold (both for energy and water), but preparations are being made to use both degree days and guest-nights for energy forecasting. In more complex hotels where additional drivers are indicated to be statistically significant these are included in the models. Models are developed for individual hotels and final mathematical formulas indicated in one of the reports. The M&T reports show comparisons between real and modelled consumption in a number of graphical forms, as presented in Figures 7.10 & 7.11 and discussed in Section 6.4. It also provides information on the shares of various utilities in the total operational costs and differences between forecasted and actual costs of resources (Figure 7.12).
Energy - Actual & Forecast (kWh) Based on last calender year
0
20 000
40 000
60 000
80 000
100 000
120 000
140 000
160 000
Jan2004
Feb Mar Apr May Jun Jul Aug Sep Oct Nov Dec Jan2005
Feb Mar Apr May Jun Jul Aug Sep Oct Nov Dec
Actual Forecast
Energy - actual and forecast (MWh), model based on 2000-2005 data, heating degree days as independent variable
0
50
100
150
200
250
300
350
400
450
Janu
ary
March
May
July
Septem
ber
Novem
ber
Janu
ary
March
May
July
Septem
ber
Novem
ber
MW
h
Real energy data Model data based on 2000-2005 (only DD) Figure 7.10. Actual and forecasted monthly energy consumption in 2004-2005:
a) model based on guest-nights only – M&T tool (HER, 2006); b) model based on actual heating degree days (suggestion).
Water - Actual & Forecast (m3) based on last calender year
0
500
1 000
1 500
2 000
2 500
3 000
3 500
4 000
Jan2004
Feb Mar Apr May Jun Jul Aug Sep Oct Nov Dec Jan2005
Feb Mar Apr May Jun Jul Aug Sep Oct Nov Dec
Actual Forecast
Water - Actual and Forecast (m3)model based on 2000-2005 and 2004, guest-nights as independent variable
0
500
1000
1500
2000
2500
3000
3500
4000
Janu
ary
Februa
ry
March
April
May
June
Ju
ly
Augus
t
Septem
ber
Octobe
r
Novem
ber
Decem
ber
Janu
ary
Februa
ry
March
April
May
June
Ju
ly
Augus
t
Septem
ber
Octobe
r
Novem
ber
Decem
ber
wat
er, m
3
real data model 2000-2005 gn only model 2004 gn only Figure 7.11. Actual and forecasted monthly water consumption in 2004-2005:
a) model based on guest-nights and 2004 data – M&T tool (HER, 2006); b) model based on guest-nights and 2000-2005 data (suggestion).
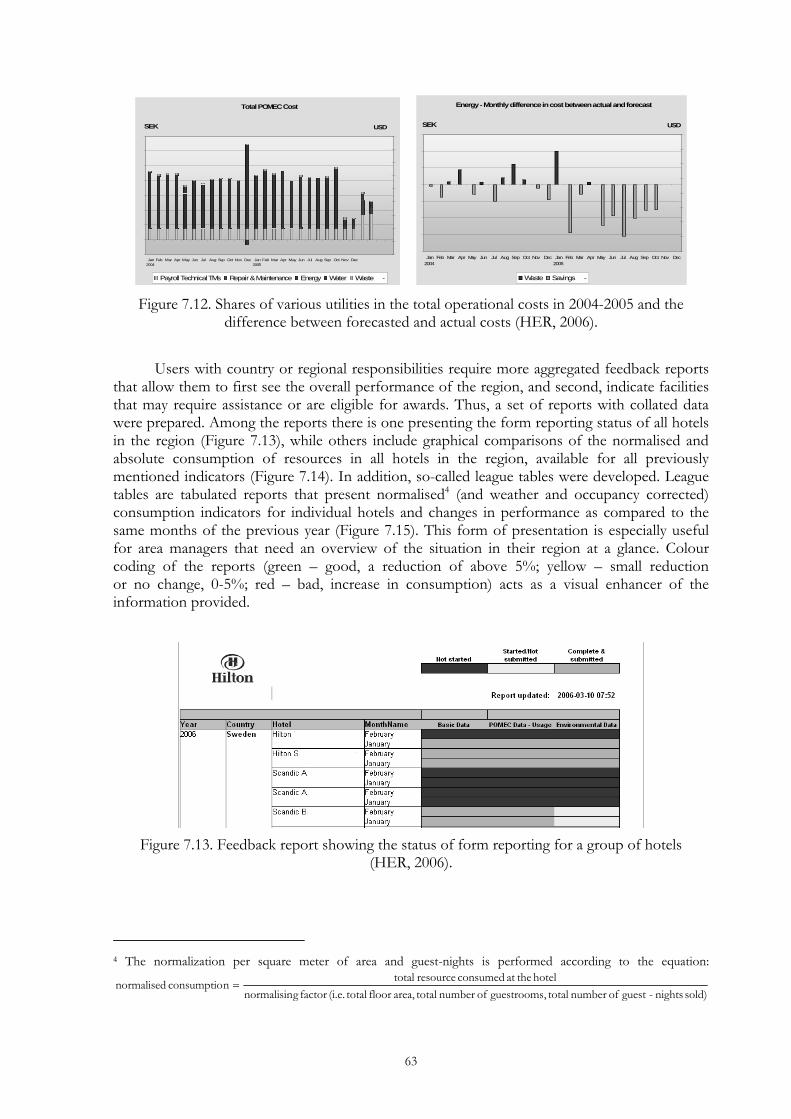
63
Total POMEC Cost
Jan2004
Feb Mar Apr May Jun Jul Aug Sep Oct Nov Dec Jan2005
Feb Mar Apr May Jun Jul Aug Sep Oct Nov Dec
SEK
Payroll Technical TMs Repair & Maintenance Energy Water Waste -
USD
Energy - Monthly difference in cost between actual and forecast
Jan2004
Feb Mar Apr May Jun Jul Aug Sep Oct Nov Dec Jan2005
Feb Mar Apr May Jun Jul Aug Sep Oct Nov Dec
SEK
Waste Savings -
USD
Figure 7.12. Shares of various utilities in the total operational costs in 2004-2005 and the
difference between forecasted and actual costs (HER, 2006). Users with country or regional responsibilities require more aggregated feedback reports that allow them to first see the overall performance of the region, and second, indicate facilities that may require assistance or are eligible for awards. Thus, a set of reports with collated data were prepared. Among the reports there is one presenting the form reporting status of all hotels in the region (Figure 7.13), while others include graphical comparisons of the normalised and absolute consumption of resources in all hotels in the region, available for all previously mentioned indicators (Figure 7.14). In addition, so-called league tables were developed. League tables are tabulated reports that present normalised4 (and weather and occupancy corrected) consumption indicators for individual hotels and changes in performance as compared to the same months of the previous year (Figure 7.15). This form of presentation is especially useful for area managers that need an overview of the situation in their region at a glance. Colour coding of the reports (green – good, a reduction of above 5%; yellow – small reduction or no change, 0-5%; red – bad, increase in consumption) acts as a visual enhancer of the information provided.
Figure 7.13. Feedback report showing the status of form reporting for a group of hotels
(HER, 2006).
4 The normalization per square meter of area and guest-nights is performed according to the equation:
sold)nights-guestofnumbertotal,guestroomsofnumbertotalarea,floortotal(i.e.factorgnormalisinhoteltheatconsumedresourcetotal
nconsumptionormalised =

64
Total Energy / Guest Night (kWh)Monthly average 2004-2006, all years are calculated as Year to date (YTD)
0
50
100
150
200
250
300
Scan
dic
Upp
sala
Nor
d
Scan
dic
Upp
lan d
s V
äsby
Scan
dic
Upl
and i
a
Sca
ndic
Täb
y
Sca
ndic
Sta
r Sol
lent
una
Scan
dic
Söde
rtälje
Scan
dic
Sjöf
a rts
hote
llet
Scan
dic
Ser g
el P
laza
Scan
dic
Park
Scan
dic
Mal
men
Scan
dic
Kung
ens
Kur
va
Scan
dic
Järv
a K
rog
Scan
dic
Infr
a C
ity
Scan
dic
Has
selb
acke
n
Sca
ndic
Co n
tinen
tal
Scan
dic
Bro m
ma
Scan
dic
Aria
dne
Scan
dic
Alvi
k
Hilt
on S
tock
holm
Slu
ssen
Ave
r age
Sw
ede n
Ave
rage
Hilt
on
Sweden Average Hilton
EA Average Hilton
200420052006
Figure 7.14. Regional report showing total energy per guest night for individual hotels in the
region for the past 3 years (YTD information, January-June) (HER, 2006).
Figure 7.15. Regional league table (VP feedback report) showing normalized performance
of individual hotels and % changes in consumption as compared to the same months of the previous year (HER, 2006).
Similar reports are available at the corporate level, with league tables for each management area, and an annual normalised performance comparison for the entire corporation over a particular period of time. In addition, with an increased availability of information and needs identified by the users, new reports can be created. The provision of feedback is a very important aspect of the overall success of the reporting system’s implementation. Users need to see that their efforts in collecting and reporting information are appreciated and used to produce valuable feedback. Further to this, it is of utmost importance that once the system is operational it constantly receives strong

65
corporate support. The continuity of the system’s utilization may be achieved by frequent reference being made to it by the top management, while hotel managers or environmental coordinators may be encouraged to report and discuss the hotel environmental status with all staff members on a monthly basis. It can also be used to evaluate the commitment level of area and hotel managers. At Hilton Europe and Africa, HER is used to identify the winners of the annual “best environmental performer” awards, and monitor progress of the we care! environmental program. In addition, in April 2006, some of the hotels in the Middle East Asia Pacific area (Japan) requested to join the HER system and use it for their environmental program: Mottainai! – Don’t waste!. This request was sent in before the system has officially been launched in that area. To encourage the use of the system and promote the sustainability and efficiency concept through its framework, this tool can contain a forum where users can exchange ideas and experiences, or present their best practices and environmental initiatives. Furthermore, this instrument may be used to provide support and advice to individual managers on how to improve the performance of their facilities, change utility contracts to be more beneficial, or to say which awards and eco-labels to apply for. Such services can be provided via an interactive discussion forum, a FAQ list, or an external consultant.
7.4. Strategies for the implementation of more responsible business practices There are several strategies on how environmental management and responsible resource management programs should be implemented in the hospitality sector. Their applicability differs slightly depending on the type of stakeholder, as well as the individual’s position within the company. First, legislation can be utilised to encourage/impose improved and more nature-friendly business practices, and limit resource wastage (Directive 2002/91/EC of the European Parliament and of the Council of 16 December 2002 on the energy performance of buildings can be used as an example). Economic incentives or disincentives (fees for wastage) can also be applied. Provision of knowledge and awareness raising campaigns are among the most important actions that local authorities, branch associations or company management teams can rely on in the process of greening of the company/sector. The hotel sector is very unique in its reluctance to adopt new solutions other than in marketing or direct customer service. Thus the promotion of alternative operation practices or technologies needs to be performed in a wise way. The authors of the HOTRES project performed among the hotel sector in the European Union, concluded that when appealing to the hotel industry, a regional or even a sectoral approach should be followed, with a highly business-oriented focus (Karagiorgas et al., 2006). The information disseminated should be objective and preferably provided by a trustworthy third party. In addition to this, only commercialised products should be promoted, with a detailed presentation of the overall viability of the technology. Some basic rules of thumb were also developed based on experience from various hotel enterprises, where these had proved to be successful. In brief, the strategies for individual hotels or larger corporations can be summarized as: • Serious commitment, • Partnerships, • Clear goals and implementation plans, • Communication and knowledge transfer, • Continuous improvement. These strategies will be elaborated further below.

66
The first and foremost condition is a sincere desire to improve the environmental performance of the company. This should be followed by an articulated/published corporate commitment at all managerial levels of the company. The development and publication of environmental policy is always a good beginning. The preparation of the environmental policy should be proceeded by an evaluation of the company’s status from an environmental perspective, and a general understanding of what the environment means to its operations. In addition, the costs incurred and expected benefits (economic, marketing, social, etc.) of the environmental profiling of the company and the implementation of a relevant program need to be evaluated against each other to reach a consensus. The environmental policy should be signed by the general manager in independent hotels, and representative CEOs for each region/sub-brand in larger companies. Both for large multi-national corporations and small independently run enterprises the establishment of partnerships with environmental organizations may prove to be a useful and helpful step in the process. There are a multitude of NGOs and commercial institutions that offer such services (i.e., The Natural Step, ISO, EMAS, etc.), with some of them solely focused on the hotel industry (IHEI). Alternatively, published standards, guidelines and best practice case study compilations can be used in the development of environmental policy and program (publications by IBLF, CI, IHEI, UNEP and others). Information published on the websites of other hotel companies, and in their environmental reports may also be used to this end, as it is believed that hoteliers frequently initiate their environmental programs as a response to the actions of competitors in the region (Karagiorgas et al., 2006). Representatives at all levels of a company, or, if possible, all employees should preferably be involved in the process from the very beginning. This would likely significantly affect their willingness to participate in the program once launched, and can bring invaluable input as regards what needs to be done and how. The next step should involve the development of goals and an action plan. The goals ought to be very clear and realistic (i.e. a reduction goal for resource consumption should consider local conditions, economic and technical feasibility). It is thus advised to start by auditing the facility to establish an understanding of the current status of operations, and create a benchmarking baseline in terms of resource consumption. As discussed before, due to the low accuracy of sector-wide benchmarks, it may be more appropriate to set optimization goals relative to one’s own performance, rather than published standards. Furthermore, in setting goals, it is frequently better to underestimate the possible resource reduction and achieve better savings than anticipated, than set too high requirements that none of the businesses can reach. It is also necessary to remember that the goals should not be one-time only, the performance improvement ought to be a continuous process with new goals set periodically. This thus requires a long-term approach/thinking during the design of an environmental action plan. It is advised to start with actions requiring relatively little effort, low capital cost and easy to adopt, but still providing visible results. In this way, employees will become acquainted with the concept in a relatively stress-free manner, and will be more willing to take on more loads when the time comes. The time aspect is another crucial factor in designing a successful environmental program (be it resource reduction, social commitment or general improvement). Deadlines need to be set at all levels of company operations and management structures, and these should be realistic from the technical, economical as well as social perspective. Appointment of an environmental champion, coordinating all actions, may enhance the success of the initiative, however the responsibilities of improving performance should consider all employees. The proper transfer of knowledge and know-how is crucial for the success of any environmental program. The launch of any such initiative ought to be proceeded by an intensive and wide ranging information campaign among all staff members. Training workshops should

67
be arranged for all staff members, while interactive computer training programs and more conventional training materials ought to be made available for later use. These aids could be available on-line on the company intranet or web-site and in printed form in the personnel quarters at the facility. The entire process should be presented in a transparent manner, allowing all employees to understand it and identify with it. Once the program is in place, continuous feedback needs to be provided to all participants. An environmental board where the status reports can be displayed ought to be established at every facility in the personnel access area, and the environmental champion/responsible person required to post reports there monthly. A reminder campaign may be organized periodically, in combination with other environment-related initiatives. In addition, the participants/hotel teams should be given tools allowing them to proceed with the implementation of the action plan. These may include financial resources, technical assistance, or managerial support. All staff members need to be aware of the importance and convinced about the usefulness of the initiative, as well as the reason for using it. Otherwise, there is a great possibility that less committed individuals or individuals not really believing in the concept will likely slowly refrain from applying the rules in their daily operations. Organizing competitions between departments or facilities within the portfolio may be a good means to keep the initiatives alive, under the condition that the competing teams are comparable and goals fair. Environmental commitment and actions undertaken should also be communicated externally to customers and supporting businesses, as this may have important implications on marketing. This may further lead to the incorporation of the suppliers in one’s own environmental program. Once the program is operational, the environmental initiatives and resource management solutions, as well as all the assisting tools, ought to continuously receive the attention and support of the corporate management at all levels of the company. In addition, the programs should regularly be reviewed and updated to ensure the continuous improvement of the facility’s performance. A well designed and implemented environmental and resource management program may certainly bring considerable benefits at an individual as well as a corporate level. These benefits can be referred to as both business and non-business, and include increased profitability due to reduced operating costs, the potential for an improved market-share, and preservation of limited natural resources to promote sustainable development. Examples exist worldwide showing that it is viable to incorporate environmental practices into contemporary business models and still provide high quality hospitality services. Nevertheless to make a significant impact on the sector’s overall performance, such case studies need to be better documented and disseminated among the sector.
7.5. Findings The findings of this study provide a number of insights that may have significant relevance for the development of responsible resource management practices in the hotel sector. First, despite the relatively wide range of available tools and guidelines for the benchmarking of a hotel’s environmental performance, their reliability and accuracy for individual hotels continues to be questionable. A high heterogeneity among individual hotels in the sector limits the applicability of uniform benchmarks. Nevertheless, reporting/benchmarking tools that allow for a hotel’s benchmarking against its own performance and also provide guidance/advice on possible improvements are of high value for hotel managers and engineers. On the other hand, the increasing popularity of reporting and benchmarking tools within large hotel corporations implies their usefulness in monitoring performance among members of the portfolio. Unfortunately, detailed information on the

68
nature of such systems, procedures and group member participation is still limited, thus limiting the transparency of results published based on those data collection systems. The experience gained during the verification and upgrade process of the Hilton Environmental Reporting system taught a number of valuable lessons, which can be considered by others planning to create their own reporting/benchmarking systems. If a company decides to implement its own reporting tool, care needs to be taken during the development process to ensure that the information required from individual departments or hotels is relevant, and relatively easily available. The development process and the system itself ought to be transparent and easily understood by the users. Otherwise there is a risk that it will not be used as designed. Training and information related to the system needs to be provided to all potential users, with additional self-study materials available at hand. The quality of input data ought to be verified constantly or trustworthy external sources used for collecting the information for central scripting. Continuous technical support is crucial to the success of the initiative. All users need to be provided with feedback on their actions, and hotel performance. Users at various levels in the company may require differentiated feedback and output reports from the reporting/benchmarking system and those need to be readily available. Individual users are interested in the performance of their own facilities, while national coordinators or area managers want to have a quick overview of the situation in all their hotels. Graphical representation of results as well as colour-coded tabulated feedback reports are believed to be user-friendly outputs from such systems. Both normalised (per service output or service area) and absolute consumption figures ought to be monitored to ensure comprehensive picture of the situation. Intra-company benchmarks for groups of similar hotels in the portfolio may be created or best-in-the-class standards established. A “best practice” section or a discussion forum where users can exchange ideas and experiences could be created to facilitate improvements at an individual level. In addition, once the system is operational it requires constant support from central management. To ensure the continuity of the reporting system’s utilisation it can be used as a framework and tool for all environmental actions within the company. Such an instrument can also be used to identify winners of any environmental competitions arranged within the company, or even among the departments (if the system allows sub-categorisation of reporting to individual departments). The companies that have implemented computerised reporting systems typically claim to have high participation and positive attitudes among their portfolio members and personnel, and treat these instruments as important management tools within the corporate social responsibility framework. Implementation of environmental and resource management programs is not very difficult but needs to be well-organised and fully supported by the company management. On a sectoral level legislation and economic incentives/disincentives typically serve as driving factors for change. On a company level it is typically the will to change and the commitment expressed by management that drives the implementation. Basic features of a well-developed and successful environmental program can be summarised as commitment, partnership and co-operation, achievable goals, communication, and finally, continuous improvement (with increasingly demanding goals). On a global scale there exist many examples showing that conducting responsible business brings economic benefits, and is increasingly appreciated by the customers. This message should be widely disseminated among hotel businesses to achieve the goal of both “greening the Goliaths and multiplying the Davids”.

69
8. Conclusions and future work
8.1. Conclusions A need for a more environmentally sound development, operation and performance of the hotel industry is currently advocated by many stakeholders involved in tourism and hospitality businesses. As a result numerous pro-ecological initiatives are present in the sector, however, these are still considered to be best practice case studies and not daily routines. The current study indicated that, at the moment, the level of environmental awareness among European hoteliers is not high enough to introduce significant changes. However, the prospect of significant cost savings as well as customer demand, are the most likely parameters to enhance environmental responsibility among hoteliers. Considering that currently, environmentally conscious tourists still represent a niche clientele and do not have a significant enough purchasing power to induce changes, cost issues will be the major driving force for change in the near future. Nevertheless, the popularity of CSR reporting and sustainability indices, especially among the larger companies, leads the author to believe that the industry is preparing for increased customer pressure and demand. It was also concluded that the geo-political, economic and socio-cultural context of a country has an influence on the environmental attitudes of hotel operators. In addition, the level of management control of the parent company over individual chain establishments and the corporate policy pursued by top management were found to have a significant influence on environmental attitudes and the activeness of individual managers and hotel teams. The dilemma of “greening the Goliaths” versus “multiplying the Davids” still remains unsolved, with the optimum solution being to change the operations of both groups into something more responsible. In order to develop a more responsible hospitality and tourism industry, two major directions ought to be pursued. First, environmentally responsible practices need to be incorporated into the hotel industry on a large scale, and the cost savings associated with these initiatives must be widely demonstrated within the sector. Environmental institutions and governments that want to promote environment friendly and sustainable policies need to focus more on and intensify their efforts into informing and reaching unaffiliated hotels, as well as businesses in countries where environmental protection has not been a key governmental focus in the past. And second, travellers’ environmental awareness needs to be enhanced in an attempt to initiate their demand for ‘‘green’’ practices. The research performed indicated that although the commonly reported environmental performance indicators are relevant to hotel operations, there is a need to provide a perspective as to the conditions in which these indicators are achieved. It is thus suggested that, besides providing performance indicators, absolute consumption figures should also be disclosed. A step further would be to publish reduction goals together with results achieved. These actions would definitely improve the transparency of environmental and performance reporting in the hotel industry, and would also lead to a better understanding of the resource utilisation and environmental impacts of this sector. In addition, there is a need for adequate and reliable metrics and comparison schemes in pursuing sustainability not only at an individual facility level but also at destinations. These metrics ought to be constructed in such a manner as to allow the policy makers to use them in their decision processes. Many factors are known to influence resource consumption in hotels. The analyses performed on the information contained in the Hilton Environmental Reporting database indicated that even among relatively uniform (service-wise) hotels the amenities offered did influence consumption, further complicating the concept and applicability of uniform benchmarking and resource consumption modelling. It was thus concluded that, creating

70
a uniform model for all hotels is almost impossible or would require a significant amount of very detailed input data and that this could still result in high inaccuracy in the results. Instead, it was suggested that it might actually be more accurate to develop models for individual hotels. Such an approach would allow the modelling of the behaviour of all types of hotels with no size or standard limitations. Multi-variate step-wise regression analyses performed on individual hotels in Sweden indicated that energy consumption was dependent on the outdoor air temperature/actual heating degree days, while water consumption was mainly influenced by the number of guest-nights sold. For hotels located in warmer climates it may be more appropriate to develop separate models for heating energy as a function of heating degree days, and for electricity as a function of guest-nights sold and cooling degree days (where the cooling/AC system is run on electricity). The strong dependence of utility consumption on a single variable would allow the creation of simple models, requiring minimum input data, which is easily available to hotel personnel. These models could be developed with the use of a standard Microsoft Office software package, and would not require sophisticated programming or advanced skills from the user. It was however concluded that such models should not be used as the final and ultimate prediction of the facility’s performance. Instead, they could be used as indicators of possible problems or improvement needs and opportunities. These tools could also be of assistance in performance optimisation at individual facilities. Hotel performance and environmental benchmarking has been gaining increased attention in recent years, and currently there exist a relatively wide range of tools and guidelines developed by industry associations, governmental organizations and hotel companies. Their reliability and accuracy for individual hotels continues to be questionable, due to the high heterogeneity among the individual hotels in the sector. It was concluded that due to the existing limitations only tools that allow for a hotel’s benchmarking against its own performance, while also providing guidance/advice on possible improvements, are of value to hotel managers and engineers. This study suggested that future developments in environmental performance indicators and benchmarking may be to disaggregate hotels into modules/sub-systems (such as guest-rooms, catering outlets, conference centres) and develop consumption models and indicators for these particular components. Individual efficiencies/performance indicators should then be combined and weighted to provide a just overall evaluation of a facility that could then be compared to a benchmark (developed in the same manner). Such a solution would allow the application of benchmark values to any type of facility/services, in a “Lego” type construction. This would mean that, for a given facility, individual “component” benchmark figures would be collected based on a hotel’s characteristics and then weighted to create an overall benchmark. However, a more accurate and differentiated knowledge of the individual performance of sub-systems is necessary to proceed with such an alternative. In addition, the methodologies for data collection and reporting procedures, at all levels of the company and sector, need to be standardized and detailed. The experience gained during the process of the Hilton Environmental Reporting system upgrade allowed for the formulation of a set of rules of thumb that could be followed in the design of similar schemes. First, care needs to be taken to ensure that the information required from individual departments or hotels is relevant, and relatively easily available. The development process and the system itself need to be transparent and easily understood by the users. The system could be designed to serve not only as a tool for collecting resource consumption data but also as a framework and monitoring instrument for a more comprehensive environmental program. Training and information related to the system needs to be provided to all potential users, with additional self-study materials available at hand. The quality of input data ought to be verified constantly or trustworthy external sources used for collecting the information for central scripting. Continuous technical support is crucial

71
to the success of the initiative. All users need to be provided with feedback on their actions and hotel performance, with due consideration given to the type of feedback and output reports required by users at various levels in the company. The continuity of the system’s utilization requires strong corporate support. This may be achieved by frequent reference to it being made by top management, while hotel managers or environmental coordinators may be encouraged to report and discuss the hotel’s environmental status with all staff members on a monthly basis. It can also be used to evaluate the commitment level of area and hotel managers, as well as a means of identifying “best performers” and screening for ill-performing hotels. The study indicated that the usefulness of such monitoring tools is increasingly appreciated by representatives of the hotel industry, as it helps in reducing the wastage of valuable and costly resources. Environmental management and responsible resource management programs are increasingly implemented in the hospitality sector. This study aimed to identify the strategies that can be used by various stakeholders. It was concluded, that on a sectoral level legislation and economic incentives/disincentives typically serve as driving forces for change. On a company level this is typically followed by the will to change and commitment expressed by the management. Basic features of a well-developed and successful environmental program at the company level can be summarised as commitment, partnership and co-operation, achievable goals, communication, and finally, continuous improvement (with increasingly demanding goals). The experience from various regions and numerous companies suggests that well designed and implemented environmental and resource management programs bring significant benefits at an individual as well as corporate level.
8.2. Future work Future work will focus on the specific patterns of resource utilization and operational procedures in individual components at hotel facilities (such as guestrooms, food and beverage outlets, sports and health centres, back-of-house areas, etc.). Major end-users, as well as internal and external factors affecting energy and water consumption will be identified and extensively studied. Best practice benchmarks for individual components/sub-systems should be identified. Possible weighting factors for individual components ought to be established, depending on their role and importance in overall facility/service performance. This information would later be used to create weighted benchmarks that could be adapted for any type of facility configuration/system of activities occurring on a hotel’s premise. Such benchmarks would account for all activities and resources related to the stay of an individual guest, regardless of whether some of the services are outsourced or not. This solution would give a more comprehensive illustration of the environmental footprint exerted by an individual guest and could serve as a framework for the establishment of a uniform and globally applicable environmental certification scheme. The concept of benchmarking of business decisions should also be investigated. It would also be of interest to investigate the concept of sustainability assessment schemes for destinations and communities. Such systems are a future direction in sustainable development not only in tourism but also in urban planning and local and regional policy development. A need exists for defining reliable, yet easy-to-use metrics, the standardization of data collection procedures, as well as the development of proper systems, or integration of existing schemes of individual components into one comprehensive and usable matrix. All these issues should be addressed in the future. An attempt ought to be made in developing a procedure for the quick and reliable assessment of building performance and identification of potential areas of saving. A strong

72
focus should be directed towards the economic aspects of resource consumption, conservation and efficient use. It would be of interest to investigate capital and operational costs including externalities as well as the roles of various stakeholders in addressing the cost issues. Work in this field should also attempt at developing strategies for promoting the application of sustainable technologies and services/practices (behaviour) in this sector. Special attention ought to be given to the optimisation of the energy-efficiency of heating, ventilation, air-conditioning and lighting systems. Emphasis should be placed on developing strategies for the promotion and implementation of appropriate energy conservation measures, as well as promoting the use of relevant renewable energy systems. Attention should also be directed at a better understanding of the mechanisms of customer demand and choice in decisions relating to environment friendly tourism products. This is necessary to develop more successful marketing strategies for environmentally responsible services.

73
9. References 1. Accor (2003), Understanding and managing water, energy and waste at your hotel. Paris: Accor
Group. 2. AH&LA (2001), Energy management and conservation guide. Washington DC: American
Hotel and Lodging Association. 3. Álvarez-Gil M.J., de Burgos-Jiménez J., Céspedes-Lorente J.J. (2001), An analysis
of environmental management, organizational context and performance of Spanish hotels. International Journal of Management Science – Omega 29(6), 457-471.
4. Anavo Group, STI (2005), Travelers want a greener way to travel by air, available at www.my-climate.com/anavosti.pdf (retrieved March 31, 2006).
5. ANPA (2001), Tourist accommodation EU eco-label award scheme – first activity report. Rome: Italian Environment Protection Agency.
6. APAT (2002), Tourist accommodation EU ecolabel award scheme. Rome: Italian National Agency for the Protection of the Environment and for Technical Services and European Commission.
7. APEC (1999), Institutionalisation of a benchmarking system for data on the energy use in commercial and industrial buildings. Hawaii: Asia-Pacific Economic Co-operation.
8. ASHRAE (2005), ASHRAE Handbook CD+ 2002-2005, SI Edition. Atlanta: American Society of Heating, Refrigerating, and Air Conditioning Engineers.
9. Astbury K., Balzer S., Merck C. (2003), Jones Lang LaSalle Hotels Digest Europe, Vol. V. London: Jones Lang LaSalle Hotels.
10. Balaras C.A., Dascalaki E., Kontoyiannidis S. (2004), Decision support software for sustainable building refurbishment. ASHRAE Transactions 1(1), 592-601.
11. Bass S., Font X., Danielson L. (2001), Standards and certification: a leap forward or a step back for sustainable development?. In: IIED (ed), The future is now: equity for a small planet Vol. 2, 21-31. London: International Institute for Environment and Development.
12. BBC (2004). Green reports shun supply chain. BBC News, 14 December 2004, available at www.bbc.co.uk (retrieved January 25, 2006).
13. Becken S., Cavanagh J.-A. (2003), Energy efficiency trend analysis of the tourism sector. Lincoln: Energy Efficiency and Conservation Authority, Landcare Research.
14. Becken S., Frampton Ch., Simmons D. (2001), Energy consumption patterns in the accommodation sector – the New Zealand case. Ecological Economics 39, 371-386.
15. benchmarkhotel (2005), IHEI hotel benchmarking software, available at www.benchmarkhotel.com (retrieved January 7, 2005 and August 2005).
16. Bendell J., Font X. (2004), Which tourism rules? Green standards and GATS. Annals of Tourism Research 31(1), 139-156.
17. Bohdanowicz J., Bohdanowicz P. (2004), Stymulatory ekonomiczne i prawne polityki ekorozwoju dla turystyki (Economic and political stimulators for a sustainable development policy in tourism – in Polish). In: Proceedings of Główne problemy badawcze i metodologiczne współczesnej politologii w Polsce (Main research and methodological problems of modern political science in Poland), 8-10 November 2004, Władysławowo, Poland.
18. Bohdanowicz P. (2003), A study of environmental impacts, environmental awareness and pro-ecological initiatives in the hotel industry. Stockholm: Royal Institute of Technology.
19. Bohdanowicz P. (2004a), Zielone certyfikaty - Kwiat EUropejski (Green certificates - EU Flower – in Polish). Doradca Hotelarza 3 (Hotel Advisor), 18-21.

74
20. Bohdanowicz P. (2004b), Zielone certyfikaty - Kwiat EUropejski - Kryteria obowiązkowe (Green certificates - EU Flower – Mandatory criteria - in Polish). Doradca Hotelarza 4 (Hotel Advisor), 8-9.
21. Bohdanowicz P. (2004c), Zielone certyfikaty - Kwiat EUropejski - Kryteria obieralne (Green certificates - EU Flower - Optional criteria – in Polish). Doradca Hotelarza 5 (Hotel Advisor), 1-3.
22. Bohdanowicz P. (2004d), Hotele a środowisko - przykład Szwecji, Polski i Chorwacji (Hotels and the environment - case study of Sweden, Poland and Croatia - in Polish). Doradca Hotelarza 8 (Hotel Advisor), 4-5.
23. Bohdanowicz P. (2004e), 10 lat polityki proekologicznej w sieci Scandic (10 years of environmental policy at Scandic - in Polish). Doradca Hotelarza 12 (Hotel Advisor), 2-4.
24. Bohdanowicz P. (2005), Turystyka a świadomość ekologiczna. Toruń: Wydawnictwo Adam Marszałek.
25. Bohdanowicz P., Curie-Kallhaunge A., Martinac I. (2001), Energy-efficiency and conservation in hotels – towards sustainable tourism. In: Proceedings of the 4th International Symposium on Asia Pacific Architecture, University of Hawai’i at Manoa, 5-7 April 2001, Hawai’i, USA.
26. Bohdanowicz P., Martinac I. (2002), Thermal comfort and energy saving in the hotel industry. In: Proceedings of the 15th Conference on Biometeorology and Aerobiology Joint with the 16th International Congress on Biometeorology, 27 October – 1 November 2002, Kansas City, Missouri, USA.
27. Bohdanowicz P., Simanic B., Martinac I. (2004), Sustainable hotels – eco-certification according to EU Flower, Nordic Swan and the Polish Hotel Association. In: Proceedings of the Regional Central and Eastern European Conference on Sustainable Building (SB04), 27-29 October 2004, Warszawa, Poland.
28. Bohdanowicz P., Simanic B., Martinac I. (2005), Environmental action in Scandic hotels. Sustainable Building, an Independent Journal on Building and the Environment 1, 10-13.
29. Boverket (2002), Building Regulations BFS 1993:57 with amendments up to BFS 2002:19. Karlskrona: Swedish Board of Housing, Building and Planning.
30. Bowe R. (2005), Going green: red stripe, yellow curry and green hotels – sustainable tourism in Jamaica. E! – The Environmental Magazine 16(1).
31. Brady, A.K.O. (2004). Forecasting the impact of sustainability issues on the reputation of large multinational corporations. Cambridge: University of Cambridge.
32. Brown M. (1996), Environmental policy in the hotel sector: green strategy or stratagem?. International Journal of Contemporary Hospitality Management 8(3), 18-23.
33. Buckley R. (2002), Tourism eco-labels. Annals of Tourism Research 29(1), 183-208. 34. Burke B. (2001), Utility monitoring system overview (Hyatt International).
In: Proceedings of AH&MA Annual Conference and Lodging Expo, 5 April 2001, Chicago, USA.
35. CADDET (1997), Energy efficiency in hotels and motels. Sittaard: Centre for Analysis and Dissemination of Demonstrated Energy Technologies.
36. Camp R.C. (1989), Benchmarking: the search for best practices that will lead to superior performance. Quality Progress, 61-68.
37. Céspedes-Lorente J.J., de Burgos-Jiménez J., Álvarez-Gil M.J. (2003), Stakeholder’s environmental influence. An empirical analysis in the Spanish hotel industry. Scandinavian Journal of Management 19, 333-358.

75
38. Chan E.S.W., Wong S.C.K. (2006), Motivations for ISO 14001 in the hotel industry. Tourism Management 27(3), 481-492.
39. Chan K.T., Lee R.H.K., Burnett J. (2003), Maintenance practices and energy performance of hotel buildings. Strategic Planning for Energy and the Environment 23(1), 6-28.
40. Chan W.W. (2005), Predicting and saving the consumption of electricity in subtropical hotels. International Journal of Contemporary Hospitality Management 17(3), 228-237.
41. Chan W.W., Lam J.C. (2001a), Environmental costing of electricity consumption in the Hong Kong hotel industry. Asia-Pacific Journal of Tourism Research 6(1), 1-11.
42. Chan W.W., Lam J.C. (2001b), Environmental costing of municipal solid waste originating from rooms and restaurants in the Hong Kong hotel industry. Journal of Hospitality and Tourism Research 25(4), 371-385.
43. Chan W.W., Lam J.C. (2001c), Environmental costing of sewage discharged by hotels in Hong Kong. International Journal of Contemporary Hospitality Management 13(5), 218-226.
44. Chan W.W., Lam J.C. (2002), Prediction of pollutant emission through electricity consumption by the hotel industry in Hong Kong. Hospitality Management 21, 381-391.
45. Chen J.S., Legrand W., Sloan P. (2005), Environmental performance analysis of German hotels. Tourism Review International 9(1), 61-68.
46. CHOSE (2001), Energy savings by combined heat cooling and power plants (CHCP) in the hotel sector. Stockholm: Commission of the European Communities, Directorate General for Energy.
47. CI & IBLF (2005), Sustainable hotel siting, design and construction. London: Conservation International & the Prince of Wales International Business Leaders Forum, Nuffield Press.
48. Clark J., Siddall L. (2001), European hotel’s implementation of environmental policies. Hospitality Directions – Europe Edition, Pricewaterhouse Coopers press release, August 6 2001, available at www.pwcglobal.com (retrieved June 11, 2003).
49. Commission of European Communities (2002), Directive 2002/91/EC of the European Parliament and of the Council of 16 December 2002 on the energy performance of buildings. Official Journal of the European Communities, 4 January 2003.
50. Commission of European Communities (2003), Commission Decision of 14 April 2003 establishing the ecological criteria for the award of the Community eco-label to tourist accommodation service, 2003/287/EC. Official Journal of the European Communities, 24 April 2003.
51. Conner F.L. (2000), Hoteliers and corporate buyers to promote “green” hotels together. The Cornell Hotel and Restaurant Administration Quarterly 41(5), 16.
52. CREM, CH2M-HILL (2000), Feasibility and market study for a European eco-label for tourist accommodations (FEMATOUR). Amsterdam: Consultancy and Research for Environmental Management (CREM), CH2M-HILL.
53. CSD (1999a), Tourism and sustainable development – The global importance of tourism. New York: Commission on Sustainable Development.
54. CSD (1999b), Tourism and sustainable development – Workers and trade unions in the web of tourism. New York: Commission on Sustainable Development.
55. CSD (1999c), Tourism and sustainable development – Sustainable tourism: a local authority perspective. New York: Commission on Sustainable Development.
56. CSD (1999d), Tourism and sustainable development – Sustainable tourism: a non-governmental organization perspective. New York: Commission on Sustainable Development.

76
57. Cunningham P. (2005), Valuing for Ogasawara: implications for sustainable practices within the accommodation sector. Asia Pacific Journal of Tourism Research 10(2), 207-216.
58. Dascalaki E., Balaras C., Francesco A., Cabot J., Caccavelli D., Casanovas X., Cladera A., Lagoudi A., Martinez T., Moya A., Tsakmakidou K. (2003), XENIOS – a decision making methodology and software for assessing refurbishment scenarios in hotels. In: Proceedings of Renewable Energy Sources for Islands, Tourism and Water Desalination (EREC), 26-28 May 2003, Crete, 567-575.
59. Dascalaki E., Balaras C.A. (2004), XENIOS – a methodology of assessing refurbishment scenarios and the potential of application of RES and RUE in hotels. Energy and Buildings 36, 1091-1105.
60. Davies T., Cahill S. (2000), Environmental implications of the tourism industry. Washington DC: Resources for the Future.
61. de Burgos-Jiménez J., Cano-Guillén C.J., Céspedes-Lorente J.J. (2002), Planning and control of environmental performance in hotels. Journal of Sustainable Tourism 10(3), 207-221.
62. Deng S.-M., (2003), Energy and water uses and their performance explanatory indicators in hotels in Hong Kong. Energy and Buildings 35, 775-784.
63. Deng S.-M., Burnett J. (2000), A study of energy performance of hotel buildings in Hong Kong. Energy and Buildings 31, 7-12.
64. Deng S.-M., Burnett J. (2002a), Water use in hotels in Hong Kong. Hospitality Management 21, 57-66.
65. Deng S.-M., Burnett J. (2002b), Energy use and management in hotels in Hong Kong. Hospitality Management 21, 371-380.
66. Despretz H. (2001), Green Flag for greener hotels. Valbonne: European Community, ADEME, ARCS, CRES, ICAEN, IER, SOFTECH.
67. DETR (no date), Environmental reporting – Guidelines for company reporting on greenhouse gas emissions. London: Department of the Environment, Transport and the Regions.
68. Ecotrans (2001, 2003), Ecolabels and awards in tourism in Europe, available at www.eco-tip.org (retrieved March 8, 2001 and July 31, 2003).
69. Ecotrans e.V. (2003), Standards for tourism eco-labels in Europe. The Visit Newsletter 3. 70. EEO/BRE (1994), Introduction to energy efficiency in hotels. Watford: Energy Efficiency -
Best Practice Programme, Department of the Environment, BRESCU. 71. Energy Innovators Initiative (2003), Saving energy dollars in hotels, motels and restaurants.
Ottawa: Natural Resources Canada. 72. ESCWA (2003), A guide to efficient energy management in the tourism sector. New York: United
Nations, Economic and Social Commission for Western Asia. 73. EU Leonardo program, “Train to Eco-label”, available at www.traintoecolabel.com
(retrieved April 20, 2006). 74. European Commission (2003), Basic orientations for the sustainability of European tourism,
Consultation Document. Brussels: European Commission. 75. European Parliament (1990), Report on the measures needed to protect the environment from
potential damage caused by mass tourism as part of European year of tourism. Brussels: European Parliament.
76. Fairmont Hotels & Resorts/Canadian Pacific Hotels (1990), Green Partnership Guide. Toronto: Fairmont Hotels & Resorts.
77. Feilberg N., Livik K. (1993), Energy and load structure at various categories of end-users. Helsinki: EFI SINTEFF GROUP.

77
78. FHRAI (2005), Energy and Environment E2 benchmarking model, available at www.fhrai.com/BenchMark/ (retrieved April 3, 2006).
79. Figueroa E. (2001), Instituting a corporate energy management plan (Hilton Hotels Corporation). In: Proceedings of AH&MA Annual Conference and Lodging Expo, 5 April 2001, Chicago, USA.
80. Font X. (2002), Environmental certification in tourism and hospitality: progress, process and prospects. Tourism Management 23(3), 197-205.
81. Font X. (2003), Labelling and certification: benefits and challenges for sustainable tourism management and marketing. EcoClub – International Ecotourism Monthly 5(50).
82. Font X., Harris C. (2004), Rethinking standards from green to sustainable. Annals of Tourism Research 31(4), 986-1007.
83. Forbes S.P.E. (2001), Environmental compliance and management benefits, Forbes Environmental Engineering, Transformation Strategies, available at www.trst.com/ISOArticleSF.htm (retrieved March 15, 2006).
84. Forte J. (1994), Environmentally-friendly management in hotels. In: B. Taylor, C. Hutchinson, S. Pollack, R. Tapper (eds), Environmental management handbook, 168-186. London: Pitman Publishing.
85. Foster S.T., Sampson S.E., Dunn S.C. (2000), The impact of customer contact on environmental initiatives for service firms. International Journal of Operations and Production Management 20(2), 187-203.
86. Genot H., Pogson N., François P., Carbone G. (2001), Sowing the seeds of change – An environmental teaching pack for the hospitality industry. Paris: EUHOFA, IH&RA, UNEP.
87. Gosline A. (2005), Will global warming impact tourism hotspots?, New Scientist. 88. Gössling S. (2002), Global environmental consequences of tourism. Global Environmental
Change 12, 283-302. 89. Green Globe 21 (2004), Travel and tourism industry earthcheck™ baseline and best
practice indicators, available at www.greenglobe21.com (retrieved November 11, 2004). 90. Green Globes Canada (2005), Green Globes Canada/BOMA Go Green software,
available at www.greenglobes.com (retrieved January 6, 2005). 91. Green Hotelier Magazine. London: International Hotels Environmental Initiative. 92. GRI (2002), Sustainability reporting guidelines. Boston: Global Reporting Initiative. 93. Gustin M.E., Weaber P.A. (1996), Are hotels prepared for the environmental
consumer?. Hospitality Research Journal 20(2), 1-14. 94. Hall M., Higham J. (Eds) (2005), Tourism, recreation and climate change. Clevedon: Channel
View Publications. 95. Hawkins D.E., Holtz Ch. (2001), Environmental policies and management systems
related to the global tourism industry. In: S. Wahab (ed), Tourism in the age of globalization, 261-289. Florence KY: Routledge.
96. HCIMA & Hospitable Climates Interactive Map of environmentally friendly accommodation in Great Britain, available at www.hospitableclimates.co.uk (retrieved May 2, 2006).
97. HEAT Online (2006), Hospitable Climates Hospitality Energy Analysis Tool – HEAT Online, available at www.hospitableclimates.co.uk (retrieved April 2006).
98. HER (2006), Hilton Environmental Reporting internal web site, accessed daily in 2005 and 2006.

78
99. HKHA (2000), Hotel building environmental assessment scheme (HBEAS), An environmental assessment for existing hotels. Version 1/00. Hong Kong: Hong Kong Hotels Association.
100. Honey M. (2001), Setting standards: certification programs in the tourism industry. The International Ecotourism Society Newsletter 1-2, 1-4, 11.
101. Honey M. (2002), Who owns paradise? – Strong certification program separate genuine ecotourism from greenwashing fast-bucks artists. E! – The Evironmental Magazine 13(4), 1-4, 11.
102. Honey M., Rome A. (2001), Protecting paradise: certification programs for sustainable tourism and ecotourism. Washington DC: The International Ecotourism Society.
103. Honey M., Steward E. (2002), The evolution of green standards for tourism. In: M. Honey (ed), Ecotourism and certification: setting standards in practice, 33-72. Washington DC: Island Press.
104. Horwath International and Smith Travel Research (2000), 1998 Horwath worldwide hotel industry study. Horwath International and Smith Travel Research.
105. Hunter C., Green H. (1995), Tourism and the environment: a sustainable relationship?. London: Routledge.
106. IEA (2005), Key world energy statistics 2004. Paris Cedex: International Energy Agency. 107. IH&RA, IHEI, UNEP (1995), Environmental action pack for hotels: practical steps to benefit
your business and the environment. Paris: IH&RA, London: IHEI, Nairobi: UNEP. 108. IHEI (1993), Environmental management for hotels. International Hotel Environmental
Initiative. Oxford: Butterworth-Heinemann. 109. IHEI (2002), Hotels care: community action and responsibility for the environment. London:
International Hotel Environmental Initiative. 110. IMPIVA (1994), Rational use of energy in the hotel sector. Valencia: Instituto de la Mediana
y Pengueña Industria Valenciana. 111. Isenmann R. (2004), Internet-based sustainability reporting. International Journal
of Environment and Sustainable Development 3(2), 145-167. 112. Iwanowski K., Rushmore C. (1994), Introducing the eco-friendly hotel. The Cornell Hotel
and Restaurant Quarterly 35(1), 34-38. 113. Jafari J. (2000), Encyclopedia of tourism. London: Routledge. 114. Jamieson W., Kelovkar A., Sunalai P., Mandke P. (2003), A manual for water and waste
management: What the tourism industry can do to improve its performance. Washington DC: UNEP Publication.
115. Jeong M., Oh H., Gregoire M. (2003), Conceptualizing web site quality and its consequences in the lodging industry. International Journal of Hospitality Management 22, 161-175.
116. Johnson C., Iunius R.F. (1999), Competing in Central Eastern Europe: perspectives and developments. International Journal of Hospitality Management 18, 245-260.
117. Kalafatis S.P., Pollard M., East R., Tsogas M.H. (1999), Green marketing and Ajzen’s theory of planned behaviour: a cross-market perspective. Journal of Consumer Marketing 16(5), 441-460.
118. Karagiorgas M., Tsoutsos T., Drosou V., Pouffary S., Pagano T., Lopez Lara G., Melim Mendes J.M. (2006), HOTRES: renewable energies in the hotels. An extensive technical tool for the hotel industry. Renewable and Sustainable Energy Reviews 10, 198-224.

79
119. Kasim A. (2004), BESR in the hotel sector: a look at tourists’ propensity towards environmentally and socially friendly hotel attributes in Pulau Pinang, Malaysia. International Journal of Hospitality and Tourism Administration 5(2), 61-83.
120. Kay L. (1997), May I green your room now?, Tomorrow 4. 121. Kirk D. (1997), Environmental management for hotels. Oxford: Buttenworth-Heinemann. 122. Kirk D. (1998), Attitudes to environmental management held by a group of hotel
managers in Edinburgh. International Journal of Hospitality Management 17(1), 33-47. 123. Knowles T., Macmillan S., Palmer J., Grabowski P., Hashimoto A. (1999),
The development of environmental initiatives in tourism: responses from the London hotel sector. International Journal of Tourism Research 1, 255-265.
124. Knox S., Maklan S. (2004), Corporate social responsibility: moving beyond investment towards measuring outcomes. European Management Journal 22(5), 508-516.
125. Kolk A. (2004), A decade of sustainability reporting: developments and significance. International Journal of Environment and Sustainable Development 3(1), 51-64.
126. Kozak M. (2004), Destination benchmarking: concepts, practices and operations. Cambridge: CABI Publishing.
127. Kozak M., Nield K. (2001), An overview of benchmarking literature: strengths and weaknesses. In: S. Pyo (ed), Benchmarks in hospitality and tourism, 7-24. Binghampton: Haworth Press.
128. Kulesza I. (1999), Proekologiczne rozwiązania w turystycznych obiektach noclegowych. Warszawa: Instytut Turystyki.
129. Lafferty B.A., Goldsmith R.E. (2005), Cause-brand alliances: does the cause help the brand or does the brand help the cause. Journal of Business Research 58, 423-429.
130. Lam J.C., Chan W.W. (2001), Life cycle energy cost analysis of heat pump application for hotel swimming pools. Energy Conversion and Management 42, 1299-1306.
131. Lawson F.R. (2001), Hotels and resorts – planning, design and refurbishment. Oxford: Architectural Press.
132. Leslie D. (2001), Serviced accommodation, environmental performance and benchmarks. In: S. Pyo (ed)., Benchmarks in hospitality and tourism, 127-148. Binghampton: Haworth Press.
133. Loehr B.C. (2002), Green hotels become mainstream as operators realize dual benefits. Hotel Business 11(9), 32.
134. Mandtke P. (1999), Developing a strategy to increase the participation of hotels in environmental management programs. Bangkok: Canadian University Consortium and Asian Institute of Technology.
135. Matson N.E., Piette M.A. (2005), High performance commercial building systems – review of California and national benchmarking methods, Working draft. Berkeley: Ernest Orlando Lawrence Berkeley National Laboratory.
136. Mavrotas G., Demertzis H., Meintani A., Diakoulaki D. (2003), Energy planning in buildings under uncertainty in fuel costs: the case of a hotel unit in Greece. Energy Conversion and Management 44(8), 1303-1321.
137. McWilliams A., Seigal D. (2001), Corporate social responsibility: a theory of the firm perspective. The Academy of Management Review 26(1), 117-127.
138. Meade B., del Monaco A. (2001), Introducing environmental management in the hotel industry: a case study of Jamaica. International Journal of Hospitality and Tourism Administration 1(3/4), 129-142.

80
139. Meade B., Gonzales-Morel P. (1999), Improving water use efficiency in Jamaican hotels and resorts through the implementation of environmental management systems. Emerging Issues in Global Water Management 115.
140. Meade B., Pringle J. (2001) Environmental management systems for Caribbean hotels and resorts: a case study of five properties in Jamaica. In: S. Pyo (ed), Benchmarks in hospitality and tourism, 149-160. Binghampton: Haworth Press.
141. Medina-Munoz D., Garciá-Falcón J.M. (2000), Successful relationships between hotels and agencies. Annals of Tourism Research 27(3), 737-762.
142. Menguc B., Ozanne L.K. (2005), Challenges of the ‘green imperative’: a natural resource-based approach to environmental orientation-business performance relationship. Journal of Business Research 58(4), 430-438.
143. Mensah I. (2006), Environmental management practices among hotels in the greater Accra region. International Journal of Hospitality Management 25(3), 414-431.
144. Meteotest (2003), Global meteorological database for solar energy and applied meteorology – METEONORM software, available at www.meteotest.ch (retrieved September 2003).
145. Miller K., Florida Energy Extension Service (1994), Energy efficiency and environmental news: Hospitality industry. Florida: University of Florida, Co-operative Extension Service, Institute of Food and Agricultural Sciences.
146. MKG Consulting (2006), The 2006 ranking of the top 10 hotel groups worldwide, Special Report. Hotel Online, April 2006.
147. Nordic Ecolabelling (2002), Nordic ecolabelling of hotels and youth hostels. Criteria document, October 3rd 2002 – September 30th, 2006. Stockholm: Nordic Swan Ecolabel, Nordic Ecolabelling, SIS Miljömärkning.
148. Noren C. (1999), Load shape development for Swedish commercial and public buildings – Methodologies and results. Lund: Lund Institute of Technology.
149. Olsen M.D., Zhao J., Sharma A., Choi J.-G. (2000), Leading hospitality into the age of excellence: Expansion, competition and vision in the multinational hotel industry 1995-2005. Paris: International Hotel and Restaurant Association.
150. Oregon ECDD (2002), Development of criteria and benchmarks for green hotels in Thailand. Portland: Oregon Economic and Community Development Department.
151. Perera O., Hirsch S., Fries P. (2003), Switched on – Renewable energy opportunities in the tourism industry. Washington DC: UNEP Publication.
152. Pils M. (2000), Tourism as an integral part of a European sustainability strategy. European Forum for Sustainable Development, International Friends of Nature.
153. Polonsky M.J., Rosenberger P.J., Ottman J. (1998), Developing green products: learning from stakeholders. Asia-Pacific Journal of Marketing and Logisitcs 10(1), 22-43.
154. Pyo S. (ed) (2001), Benchmarks in hospitality and tourism. Binghampton: Haworth Press. 155. Rada J. (1996), Designing and building eco-efficient hotels. Green Hotelier 4, 10-11. 156. RAMBØLL (2000), Challenging diversity, a review of environmental recognition schemes and other
sustainable tourism activities in the Nordic countries. Lund: Nordic Industrial Fund. 157. Ransley J., Ingram H. (eds.) (2000), Developing hospitality properties and facilities. Oxford:
Butterworth-Heinemann. 158. Revilla G., Dodd T.H., Hoover L.C. (2001), Environmental tactics used by hotel
companies in Mexico. International Journal of Hospitality and Tourism Administration 1(3/4), 111-127.

81
159. Roarty M. (1997), Greening business in a market economy. European Business Review 97(5), 244-254.
160. Robèrt K.-H. (2002), The Natural Step history – seeding a quiet revolution. Gabriola Island: New Society Publishers.
161. Scandic Hotels (2001), Scandic environmental construction standard: sustainable construction and renovations at Scandic Hotels. Version 0.9. Stockholm: Scandic Hotels AB, Hilton International Nordic Region.
162. Scott J.A., Beckenham T., Watt M. (2004), Travel and tourism industry benchmarking methodologies. Green Globe 21, Earth Check Pty Ltd.
163. Selwitz R. (2000), New coalition works to clear the air about air – Hospitality coalition on indoor air quality. Hotel and Motel Management.
164. Slye J. (2005), Green means green: a 90 days process to a money generating eco-makeover. Hotel Business Review.
165. Smith S.M., Haugtvedt C.P. (1997), Implications of understanding basic attitude change processes and attitude structure for enhancing pro-environmental behaviors. In: M.J. Polonsky, A.T. Mintu-Wimsatt (eds), Environmental marketing, 155-176. Binghamton: Haworth Press.
166. SPSS Inc. (2004), SPSS 13.0 Brief Guide. Chicago: SPSS Inc. 167. Stabler M.J., Goodall B. (1997), Environmental awareness, action and performance
in the Guernsey hospitality sector. Tourism Management 18(1), 19-33. 168. Stipanuk D.M. (1996), The U.S. lodging industry and the environment – an historical
view. The Cornell Hotel and Restaurant Administration Quarterly 37(5), 39-45. 169. Stipanuk D.M. (2001), Energy management in 2001 and beyond: operational options
that reduce use and cost. The Cornell Hotel and Restaurant Administration Quarterly 42(3), 57-71.
170. Stipanuk D.M. (2002), Hospitality facilities management and design. Lansing: AH&LA Educational Institute.
171. Stipanuk D.M. (2003a), Benchmarks for hotel energy usage. In: Proceedings of the World Energy Engineering Congress, Association of Energy Engineers, Atlanta, USA.
172. Stipanuk D.M. (2003b), Hotel energy and water consumption benchmarks, Final Report. Washington DC: American Hotel & Lodging Association.
173. Stipanuk D.M., Ninemeier J.D. (1996), The future of the U.S. lodging industry and the environment. The Cornell Hotel and Restaurant Administration Quarterly 37(4), 74-83.
174. Sustainable Travel Report (2005), Selling eco- and sustainable tourism: the right mix. The Responsible Tourism e-Newsletter 3(5).
175. Swarbrooke J., Hornan S. (1999), Consumer behaviour in tourism. Oxford: Buttenworth-Heinemann.
176. Sweeting J.E.N., Rosenfeld-Sweeting A. (2003), A practical guide to good practice: Managing environmental and social issues in the accommodations sector. Paris: Tour Operators’ Initiative for Sustainable Tourism Development, Washington DC: The Center for Environmental Leadership in Business (CELB).
177. Synergy, WWF (2000), Tourism certification: an analysis of Green Globe 21 and other certification programs. Godalming: WWF UK.
178. Ton M., Lin M., Radin D. (1996), Greening your property: a Green Seal guide. New York: Green Seal.
179. Trung D.N., Kumar S. (2005), Resource use and waste management in Vietnam hotel industry. Journal of Cleaner Production 13, 109-116.

82
180. Tzchentke N., Kirk D., Lynch P.A. (2004), Reasons for going green in serviced accommodation establishments. International Journal of Contemporary Hospitality Management 16(2), 116-124.
181. UNEP IE (1995), Environmental codes of conduct for tourism. Paris: UNEP Publications. 182. UNEP, IH&RA (1997), Environmental good practice in hotels. Case studies from the International
Hotel and Restaurant Association Environmental Award - Green Hotelier. Paris: United Nations Environmental Program and International Hotel and Restaurant Association.
183. US DOE/EIA (2002), 1999 commercial buildings energy consumption survey. Washington DC: US Department of Energy and Energy Information Administration.
184. US EIA (1998), A look at commercial buildings in 1995: characteristics, energy consumption, and energy expenditures. Washington DC: Energy Information Administration, Office of Energy Markets and Energy Use.
185. US EPA (2001), Technical description for the hotel/motel model. Washington DC: US Environmental Protection Agency.
186. US EPA/DOE (2006), Energy Star Portfolio Manager software, available at www.energystar.gov/index.cfm?c=evaluate_performance.bus_portfoliomanager (retrieved April-May 2006).
187. Viner D., Becken S. (2003), Climate change mitigation policies and the global tourism industry. Climate Change Management, 12.
188. Wahab S., Pigram J.J. (1997), Sustainable tourism in a changing world. In: S. Wahab, J.J. Pigram (eds), Tourism development and growth: the challenges of sustainability. London: Routledge.
189. Warnken J., Bradley M., Guilding Ch. (2005), Eco-resorts vs. mainstream accommodation providers. An investigation of the viability of benchmarking environmental performance. Tourism Management 26, 367-379.
190. Webster K. (2000), Environmental management in the hospitality industry: a guide for students and managers. London: Cassell.
191. Werther W.B., Chandler D. (2005), Strategic corporate social responsibility as global brand insurance. Business Horizons 48, 317-324.
192. Wight P.A. (1997), Ecotourism accommodation spectrum: does supply match the demand. Tourism Management 18(4), 209-220.
193. Wikipedia contributors (2006), Cite: Resource management. Wikipedia, The Free Encyclopedia, available at http://en.wikipedia.org/w/index.php?title=Resource_management&oldid=52435990, last modified 10 May 2006 (retrieved May 31, 2006).
194. Wilson B. (1999), Monitoring and targeting (at Accor). Green Hotelier 13, 23. 195. Wöber K.W. (2001), Benchmarking for tourism organisations – an eGuide for tourism managers.
Illinois: National Laboratory for Tourism and eCommerce, University of Illinois. 196. Wöber K.W. (2002), Benchmarking in tourism and hospitality industries. Vienna: Vienna
University of Economics and Business Administration, CABI International. 197. WTO (1999), Global code of ethics for tourism. Madrid: World Tourism Organisation. 198. WTO (2004), Indicators of sustainable development for tourism destinations – a guidebook. Madrid:
World Tourism Organization. 199. WTO Djerba (2003), Final Report from the 1st International Conference on Climate Change and
Tourism. WTO, IPCC, UNFCCC, WMO, UNEP, UNCCD, UNESCO. 9-11 April 2003, Djerba, Tunisia.

83
200. WTTC (2002), Corporate Social Responsibility in travel and tourism. London: World Travel and Tourism Council.
201. WTTC, IFTO, IH&RA, ICCL (2002), Industry as a partner for sustainable development – Tourism. Report prepared by World Travel & Tourism Council, International Federation of Tour Operators, International Hotel & Restaurant Association, International Council of Cruise Lines and UNEP. London: The Beacon Press.
202. WTTC, WTO, Earth Council (1996), Agenda 21 for the travel and tourism industry – towards environmentally sustainable development. London: World Travel and Tourism Council, World Tourism Organisation, Earth Council.
203. Wu W. (1997), Environmental enrichment or the lodging industry: a toolkit, Agricultural and Biological Engineering Department, U.S. EPA and Purdue University, available at http://pasture.ecn.purdue.edu/~epados/hotel/src/intro_f2.htm (retrieved March 15, 2006).
204. Zadek S. (2002), Third generation corporate citizenship, AccountAblity website available at www.accountability.org.uk (retrieved December 1, 2005).

Paper I

The CIB 2003 International Conference on Smart and Sustainable Built Environment, 19-21 November 2003, Stamford Plaza, Brisbane, Australia - 1 -
ATTITUDES TOWARDS SUSTAINABILITY IN CHAIN HOTELS – RESULTS OF A EUROPEAN SURVEY
P. Bohdanowicz1 and I. Martinac1
Abstract Hotels typically represent only about 4-5% of a nation’s buildings stock, yet they provide accommodation to 40-50% of all domestic and international visitors. On the European scale this translates to almost 200 million visitors per year. Many of the services provided to hotel guests are highly resource intensive. This particularly reflects on the consumption of energy, water, food and non-durable goods. Indeed, hotels have been found to have the highest negative impact on the environment of all commercial/service buildings, with the exception of hospitals. The successful implementation of more sustainable practices in the hotel industry is highly dependent on the active support and cooperation of all stakeholders involved. The willingness and ability of hotel management to advocate and implement state-of-the-art environmentally responsible behaviour and practices is thus crucial. An e-mail based survey was performed to assess the environmental awareness in the European hotel industry. This paper discusses the outcomes of the questionnaire distributed within a chosen subset of hotel chains, some of which already implement corporate environmental programs. The results obtained via this independent investigation are compared to the information presented in corporate environmental reports, and possibilities of future improvements are discussed. Perhaps the greatest barrier preventing hoteliers from becoming more “green” is a widespread belief that environmental measures are prohibitively expensive. While the necessary modifications in technology, management and behaviour may require investments, it has been shown that such investments are profitable in the longer perspective. The levels of eco-awareness and relevant education obviously need to be increased both in the industry and the public. Hotels have the potential of becoming significant venues of education as they are exposed to the travelling public, a rapidly increasing portion of the world's population. The industry needs good role-models and physical examples of economically successful eco-friendly businesses will go a long way in convincing both customers and the industry that corporate responsibility makes good business sense. Keywords: hotel, chains, environmental attitudes, Europe, survey.
1 Department of Energy Technology, Royal Institute of Technology, Stockholm, Sweden. E-mail: [email protected], [email protected]

The CIB 2003 International Conference on Smart and Sustainable Built Environment, 19-21 November 2003, Stamford Plaza, Brisbane, Australia - 2 -
1. Introduction There are obvious and encouraging signs that the travel and tourism industry, one of the largest industries in the world, has begun to be aware of its substantial negative impacts on the environment, and is stepping up its efforts to embark on a more sustainable path. During 2002, the International Year of Eco-Tourism (an important and rapidly growing segment of the industry), the UN together with the World Tourism Organization and numerous other international (industrial and public) stakeholders arranged a series of conferences and events worldwide to highlight and promote the need for greater environmental responsibility in the tourism industry. A series of follow-up activities and efforts are in progress. Over the years, a number of documents aiming at incorporating environmental and socio-cultural responsibility into tourism business practice have been published. Among the most significant are the 1995 “Lanzarote Charter for Sustainable Tourism” (issued jointly by the World Tourism Organisation, the United Nations Environmental Programme, UNESCO and the Commission of European Communities) [1], and “Agenda 21 for the Travel and Tourism Industry: Towards Eco-friendly Sustainable Development” (launched in 1996 as a result of co-operation between World Travel and Tourism Council, World Tourism Organisation, and the Earth Council) [2]. The mere existence of such documents, however, cannot bring about the significant changes that will need to occur in the travel industry on the way towards more eco-friendly practice. Competent professionals will need to enact the necessary changes. While there is very little data on the exact level of environmental awareness in the industry, it is already obvious that a significant amount of education and training will be required to empower all stakeholders with the knowledge required. European hotel chains were targeted in this survey for a number of reasons. First, the hotel industry represents one of the most important sectors of the tourism industry. Second, the European hotel market, estimated at the level of 205 200 facilities and almost eight million beds, represents half the global market [3,4]. Third, as a consequence of its very specific operational schemes and purposes, the hotel sector constitutes one of the most resource-intensive branches of the tourism industry. Substantial quantities of energy, water and non-durable products are consumed in providing comfort and services to guests, many of who are accustomed to, and willing to pay for exclusive amenities, treatment and entertainment. The resource use efficiency of the many different end-users in hotel facilities is frequently low, and the resulting environmental impacts are, therefore, typically greater than those caused by other types of buildings of similar size [5]. At the same time, eco-friendly initiatives are becoming more and more popular among hoteliers worldwide. Approximately 40 percent of more than 3000 respondents to a 1998 Horwath hotel industry survey confirmed using different quantitative measures of environmental performance, including those relevant to energy use and water consumption, waste disposal, as well as volume and treatment of wastewater [6]. Fourth, chain hotels, as a result of their world-wide presence, have a significant potential of influencing behaviour and practice in the tourism sector,

The CIB 2003 International Conference on Smart and Sustainable Built Environment, 19-21 November 2003, Stamford Plaza, Brisbane, Australia - 3 -
as well as in supporting sectors. It is thus of crucial importance to evaluate the current situation in this sector. 2. Methodology Four hotel chains (Accor, Best Western, Radisson SAS, and Scandic Hotels AB) were chosen to participate in the e-mail based survey presented here. While all four chains operate world-wide, this survey was carried out for European facilities only. Due to the proprietary character of the data collected, the chains are henceforth referred to as Chain 1, Chain 2, Chain 3, and Chain 4. This numbering does not reflect the sequence in which the chain names are listed above. A survey questionnaire was developed (based on a comprehensive literature review) comprising twenty-two multiple-choice questions, occasionally supplemented by open-ended follow-up comments included for clarification. The questionnaire was sent to hotel representatives via e-mail in two stages. Chain 1, 2, and part of Chain 3 were interviewed in the months of October to December 2002. The remaining facilities in Chain 3 and Chain 4 were questioned between March and May 2003. A follow-up reminder was sent to each non-respondent periodically (approximately every two-three weeks). The e-mail addresses of the hotels were mainly obtained from the Internet and from commercially available hotel directories [7-12]. A total of 2198 hotels were targeted, representing 96.2, 97.9, 72.9, and 89% of existing facilities belonging to Chains 1 to 4, respectively. 300 correctly and completely filled-in forms were collected, amounting to response rates of 37.8%, 43.9%, 12.1%, and 10.3%, respectively. The response rates were determined after excluding all facilities, for which the e-mail addresses used proved to be invalid. The response rates based on the number of existing facilities would amount to 29.52%, 42.2%, 8.2%, and 8.9%, respectively for Chains 1 to 4. Surveys, especially those conducted via e-mail, generally suffer from very low response rates, typically ranging from 10.5% to 30.7% [13]. This is believed to be partly due to the lack in e-mailed communications of direct personal contact, resulting in a perceived lesser obligation to respond. While the response rates obtained from Chain 3 and 4 are arguably unrepresentative, the responses collected from Chains 1 and 2 may be treated as reflecting the opinions for the entire chain. Despite these limitations, the authors will explore the trends revealed by the survey. 3. Survey participant profiles While all four hotel chains included in the survey have environmental policies and on-going environmental programs at corporate level, only three of them have such information clearly displayed on their web-pages, or regularly publish environmental reports. In the case of Chain 3, the information about corporate environmental activities was obtained from the questionnaires, where it was mentioned by only a few respondents. As indicated throughout this report, the official corporate attitude seems to have a significant influence

The CIB 2003 International Conference on Smart and Sustainable Built Environment, 19-21 November 2003, Stamford Plaza, Brisbane, Australia - 4 -
on the environmental awareness among the hotel respondents, as well as the existence of environmental initiatives among chain member enterprises. While the questionnaires were typically sent to listed hotel addresses (rather than to specific individuals), at least one third of the forms returned were completed by hotel management. This indicates that the survey was treated seriously, and that the views obtained are likely to be representative for this segment of the European hotel industry. Standard-wise, the chain facilities considered were largely three and four star facilities with the exception of Chain 1 where higher standard hotels (four and five star) prevailed. As to hotel size, the survey included facilities ranging from 22 to over 741 rooms, with the average hotel size being 222.3, 201.2, 83.6, and 144.4 rooms, for Chain 1, 2, 3, and 4 respectively. The majority of hoteliers stated that their establishment belonged to some type of hotel association, including the relevant hotel chain. It is generally believed that hotel and tourism associations (TAs), including hotel corporations, have a very important role in raising environmental awareness and promoting more sustainable practices among the representatives of the hospitality industry. The majority of such organizations have developed individual environmental policies and action plans. They are further able to advise and help hoteliers in making the right decisions. TAs often offer their members training and consulting services, and publish different types of guidelines and best practice case studies [14-18]. According to the World Tourism Organisation [19], leisure and recreation are the dominating purposes for travel. However, substantial numbers of hotels nowadays rely on business and conference guests as basic and major customers, unless the destination is predestined for leisure purposes. More than two-thirds of the respondents from each chain indicated that business guests represent more than half the guests at their facility. Only few respondents claimed that tourists are their major clientele. The customer profile defines the occupancy and operational patterns at a facility, and typically affects customer attitudes towards environmental protection. This clearly also influences the particular traits of a facility, which will be highlighted for promotion and marketing purposes. Facility location and the diversity/quality of services offered are the most commonly marketed hotel features (82.2% to 92.7% positive answers for location, and 82.2% to 96.8% for quality of services). Hoteliers typically believe that these are the two most important factors affecting customer choice. Interestingly, the cost of the services offered typically ranks third. Advertising environmental concern is generally not believed to have a significant influence on customer choice, as only single respondents ranked it as number one on their priority list. Nevertheless, between 16.3% and 70.9% of hoteliers participating in the survey claim to include information on environmental responsibility at their facility in their marketing efforts. The survey further showed that the prospect of enhancing the attractivity of a hotel by promoting it as "green" is typically not considered as a strong enough incentive to motivate eco-friendly action. While this may be interpreted to indicate the lack of sufficient numbers of "green customers", recent studies have shown that environmental concerns are increasingly influencing customer behaviour in Europe, and that this may soon substantially affect the choice of accommodation [3]. In the European context it

The CIB 2003 International Conference on Smart and Sustainable Built Environment, 19-21 November 2003, Stamford Plaza, Brisbane, Australia - 5 -
may thus be expected that the numbers of "green hotel customers" will increase in the coming years. 4. Environment-related information The tourism industry has a dual relationship with the environment. The natural attractivity/exclusivity of a destination is typically its main tourism-related asset, at the same time as it also is the feature most directly threatened by potential over-exploitation. Although environmental responsibility and sustainability are concepts that have only recently come to bear explicitely on the development of tourism, the enforcement of these values has always been essential for the continued attractivity and marketability of any location [3]. Ironically, for many years the industry claimed to be absolutely free of any negative impacts. Indeed, as compared to other industries, the tourism industry does not always offer easily identifiable point sources of pollution. However, the cumulative and long-term effects of large numbers of "small polluters" can be as environmentally harmful as those caused by smaller numbers of more easily identified "heavy polluters". Nowadays, attitudes are changing and tourism authorities readily admit that the industry is not without guilt, both locally and globally. It is therefore a very positive sign that the vast majority of respondents, 100%, 98.4%, 76.2%, and 87.3%, respectively, believe that environmental protection is essential for the performance and further development of the tourism industry. Recognizing the problem is a necessary first step towards remediation and more responsible behaviour. The majority of hotel representatives answered that they are aware that hotel facilities do have an influence on the natural environment. As a matter of fact, the lodging sector constitutes the most environmentally harmful branch of the tourism industry, due to its high resource intensity. It is estimated that 75% of the environmental impacts of the hotel industry can be attributed to the excessive consumption of local/imported non-durable goods, energy and water, followed by emissions released to air, water and soil [3]. European hotels consume, on average, 72-519 kWh of energy per square meter of area, depending on the location and services offered, amounting to a total of 39 TWh/year [20]. Depending on the source of energy (hydro-, wind-, nuclear-, oil-, or coal-based) hotels can be responsible for the annual generation of up to 160 kg of carbon dioxide per square meter of area, which is equivalent to 10 tons of CO2 per bedroom [21]. As regards the consumption of water, it is estimated that - depending on the hotel standard - guests typically use between 90 and 150 litres of water per night [22]. However, a recent report published by one chain provides an average figure of 440 litres/guest-night [23], while another chain reports an average figure of 224 litres /guest-night [24]. Waste generation is probably the most visible impact hotels have on the environment. A typical hotel guest produces 1 kg of waste per day, which leads to tons of waste disposed by hotels monthly. Large proportions (50-60 %) of this waste could be recycled or reused [25-27]. The average quantity of

The CIB 2003 International Conference on Smart and Sustainable Built Environment, 19-21 November 2003, Stamford Plaza, Brisbane, Australia - 6 -
unsorted waste presented in the environmental report of one chain equaled 3.1 kg/guest-night in 2002, with Scandinavian and German facilities ranking appreciably lower (1.5 kg/guest-night) than the corporate average [23]. On the other hand, another chain reports an average of 0.515 kg of unsorted waste per guest-night [24]. The other two chains under investigation do not publish any such information on their web-pages. In light of the above, most respondents believed that environmental impacts caused by hotels are medium to significant (87.1, 96.7, 77.3 and 76.3 % for Chains 1 to 4, respectively), which agrees relatively well with the outcomes of previous scientific investigations [3]. However, among the comments received from the respondents were also those questioning the negative impact of hotels on the environment, and doubting the need for hotels to be eco-friendly at all. Fortunately the number of such statements was very small. Parallel to its significant impact on the environment, the hotel industry, due to its size and global presence, at the same time has a substantial potential for promoting and supporting corporate responsibility. This potential should be wisely used, since the future of the travel and tourism industry highly depends on the continued availability of attractive and marketable environments. It is therefore encouraging that the predominant majority of hoteliers expressed serious concern for the environment. The extent of positive answers ranged from 74.2% for Chain 3 to 100% for Chain 1. The survey further showed, that the level of environmental awareness among the hoteliers was commensurate to the efforts made by the chain management towards developing and enforcing environmental policies and programs. The percentage of positive answers relevant to the possession of information on how to diminish negative impacts arising from the hotel operation was as follows: 51.5% for Chain 3, 70%, 74.2%, and 96.8 % for Chain 4, 2 and 1, respectively. On the other hand, many respondents raised the issue of the cost of becoming “green” and environmentally responsible. Many hoteliers fear that the road to environmental sustainability may be prohibitively expensive, especially in view of the current market fluctuations and international political turmoil. One respondent highlighted the need for a more adequate promotion of environmentally certified establishments. Information about eco-certificates owned by the hotel should be displayed in hotel catalogues/directories, city guides as well as booking and travel agencies. Such information could be especially valuable in view of only 1% of European accommodation facilities currently being eco-labelled [3]. There exists a great need of relevant environmental education and increased awareness among the general public. Despite these limitations, the majority of hoteliers declared to be involved in some kind of environment-oriented activities (68% and 85.4% for Chains 3 and 4, and 100% for Chains 1 and 2). As up to 75% of the environmental impacts caused by the lodging industry are estimated to arise from the excessive consumption of non-durable goods (and consequent waste generation), as well as from the use of energy and water [3], these areas are those most frequently targeted by environmental measures. The type of environmental activities reported by the hoteliers varied significantly, regionally, as well as with facility size and standard. It is likely that those differences were partly the result of differences in local legislation

and regulations, as well as local conditions. The types of measures were further significantly influenced by corporate policy, the level of environmental awareness manifested by management, and the financial state of the establishment. In total, more than 70% of the respondents declared to be involved in energy and water saving measures, as well as in some form of waste management (exception, Chain 3 – 62.5% in case of responsible waste management). For Chains 1 and 2 the corresponding figure was in excess of 93 %. 5. Incentives The hoteliers participating in the survey were asked to rank according to their importance the incentives capable of encouraging them to undertake environmentally-oriented initiatives, with 1- describing the most important incentive, 7 – the least important and 0 – no ranking provided. Unfortunately, in some of the questionnaires collected, this ranking was not done. Often times different features were given the same ranking, or a “yes-no” format was used instead. Where “yes-no” answers were given, all indicated features were assumed to have the highest priority and ranked 1. In the analysis only the highest priority features were included, i.e., the response frequency was calculated based on the number of answers marked 1. For the representatives of Chains 3 and 4 the possibility of reducing operational costs was by far the strongest incentive. By contrast, the hoteliers in Chains 1 and 2 indicated that corporate responsibility was reason enough to take action, see also Figure 1., reflecting a growing international trend in business. Parallel to action taken by the hotel industry itself, adequate environmental measures will continue to be required by ever more stringent environmental laws and regulations.
Figure 1 Top-rated (rank "1") incentives towards greater corporate responsibility
010203040506070
Cost Image Impacts Recom- mendations
Marketingasset
Custo- mers
Profes-sionaladvice
Chain 1 Chain 2 Chain 3 Chain 4
% of respondents
The CIB 2003 International Conference on Smart and Sustainable Built Environment, 19-21 November 2003, Stamford Plaza, Brisbane, Australia - 7 -

The CIB 2003 International Conference on Smart and Sustainable Built Environment, 19-21 November 2003, Stamford Plaza, Brisbane, Australia - 8 -
6. Conclusions The results obtained from the questionnaire study performed for four European hotel chains show that the respondents generally perceived the environment as an important factor for the development and success of tourism and the hotel industry. Hoteliers are typically aware that their facilities influence the natural surroundings, although the magnitude of the impact is often underestimated. Hoteliers do have a certain (though varying) level of environmental knowledge and they are generally aware of measures that can be taken towards greater environmental responsibility. However, respondents frequently expressed their reluctance towards getting involved in environmental initiatives, as they feared that such action might negatively affect customer comfort and satisfaction. With growing awareness of the fact that customers themselves increasingly demand "green alternatives", hoteliers are becoming more motivated and willing to take steps towards greater environmental responsibility. Perhaps the greatest barrier preventing hoteliers from becoming more “green” is a widespread (and equally misplaced) belief that environmental measures are prohibitively expensive. While the necessary modifications in technology, management and behaviour may require substantial investments, there exist convincing show-case examples proving that investments in greater sustainability are profitable in the longer perspective [16, 28-29]. Such role-model examples should be publicized much more widely within the industry. If operational costs can be significantly decreased, and if there exists outspoken customer demand, hoteliers will respond with greater environmental responsibility. There is undoubtedly a great need for education and increase in environmental awareness among the general public. Hotels have the potential of becoming significant venues of such education as they are exposed to the travelling public, a rapidly increasing portion of the world's population. Physical examples of economically successful eco-friendly businesses will go a long way in convincing both customers and the industry that corporate responsibility makes good business sense. As the hotel industry is inter-related with numerous other industries (including a wide range of suppliers), this can have significant spin-off effects. Two of the chains investigated already require from their suppliers to provide them with eco-friendly products, and in some cases they have convinced their suppliers to eco-certify their products and services. The purchase power and market influence of hotels, and even more so of hotel chains, is obviously substantial [30, 31]. Change seldom comes about easy, and it takes a good dose of proactivity, determination and business boldness to explore promising but yet untested alternatives. Today, we have the privilege of being able to look at and learn from some very profitable eco-friendly businesses, who have sweated their way through a healthy dose of trend-setting pioneering work. Let us follow the example of these valuable role models who have shown that sustainability is profitable.

The CIB 2003 International Conference on Smart and Sustainable Built Environment, 19-21 November 2003, Stamford Plaza, Brisbane, Australia - 9 -
References [1] World Conference on Sustainable Tourism (1995) “Charter for sustainable tourism”. Lanzarote Island, Spain. Available at www.insula.org, as accessed 14.06.2001. [2] WTTC, WTO, Earth Council (1996) “Agenda 21 for the Travel and Tourism Industry – Towards Environmentally Sustainable Development”. Available at www.wttc.org, as accessed 14.06.2001 [3] APAT (2002) “Tourist Accommodation EU Eco-Label Award Scheme”. Final Report, 16 October 2002. Italian National Agency For the Protection of the Environment and for Technical Services. [4] IH&RA (2000) “Leading Hospitality into the Age of Excellence: Expansion, Competition and Vision in the Multinational Hotel Industry 1995-2005”. International Hotel & Restaurant Association, Paris. [5] Rada, J. (1996) “Designing and Building Eco-efficient Hotels”. Green Hotelier, 4, 10-11. [6] Vögl A. (1998) “1998 Horwath Worldwide Hotel Industry Study”. Conference Report, IH&RA 36th Annual Congress, 22-26.10.1998, Manila, Philippines. Available at www.ih-ra.com, as accessed 24.10.2001. [7] Accor Hotels. www.accor.com, as accessed 7, 14, 27, 28.02.2003, 1.03.2003. [8] Best Western Hotels. www.bestwestern.com, as accessed 2.10.2002, 6, 28.02.2003. [9] Orbis Hotels. www.orbis.pl, as accessed 1.09.2002. [10] Radisson SAS Hotels and Resorts. www.RadissonSAS.com, as accessed 25.09.2002. [11] Scandic and associated hotels 2002 - Hotel Directory, Scandic Hotels AB. [12] Scandic Hotels AB. www.scandic-hotels.com, as accessed 1.10.2002. [13] Medina-Munoz, D. and Garcia-Falcon, J.M. (2000) “Successful relationships between hotels and agencies”. Annals of Tourism Research, 27 (3), pp.737-762. [14] IHEI (1993) “Environmental Management for hotels”. International Hotel Environmental Initiative. Butterworth-Heinemann, Oxford. [15] IH&RA, IHEI, UNEP (1995) ”Environmental action pack for hotels: practical steps to benefit your business and the environment”. UNEP industry and environment technical report 31. Paris: IH&RA: London: IHEI: Nairobi: UNEP. [16] UNEP, IH&RA (1997) “Environmental good practice in hotels, Case studies from the International Hotel and Restaurant Association Environmental Award, Green Hotelier”. United Nations Environmental Program and International Hotel & Restaurant Association, Paris. [17] Accor Group (1998) “The environment guide for hotel managers”. Accor Group, France. [18] Accor Group (2001) “In Hotels, as in the Home, A few Simple Actions to Conserve the Environment. Practical handbook”. Accor Group, France. Available at http://www.accor.com/, as accessed 6.02.2003. [19] WTO (2000) “Tourism Highlights 2000”. Second Edition. World Tourism Organisation, France. [20] CHOSE (2001) “Energy savings by combined heat cooling and power plants (CHCP) in the hotel sector”. Report of the Commission of the European Communities, Directorate General for Energy, Contract No XVII/4.1031/Z/98-036, May 31st, 2001. [21] EEO (1993) “Energy efficiency in hotels – a guide for owners and managers”, Guide 36. Energy Efficiency - Best Practice Programme, Department of the Environment, BRESCU, UK. [22] THERMIE (1994) “Rational Use of energy in the Hotel sector”. EU Thermie Programme Action B-103. IMPIVA, Valencia.

The CIB 2003 International Conference on Smart and Sustainable Built Environment, 19-21 November 2003, Stamford Plaza, Brisbane, Australia - 10 -
[23] Radisson SAS (2002) “Responsible Business Report 2002”. Radisson SAS Hotels & Resorts. [24] Scandic Hotels AB (1999) “Annual report 1999”. [25] Smith, W.H. (1993) “EcoPurchasing Guide for Hotels and Motels”. University of Florida. [26] Smith-Jessup, L. (1998) “Hoteliers and planners become ecologically sensitive”. Going Green 1998, Meetings Web. Available at www.meetingsweb.com, as accessed 26.01.2001. [27] IHEI (2002) “Hotels Care: Community Action and Responsibility for the Environment”. International Hotel Environmental Initiative, UK. [28] Enz, C.A., Siguaw, J.A. (1999) “Best hotel environmental practices”. The Cornell Hotel and Restaurant Administration Quarterly, 40 (5), 72-77. [29] Martinac, I., Murman, H., Lind af Hageby, A. (2001) “Energy-efficiency and environmental management in a Swedish conference facility – case study: Sånga-Säby Courses & Conferences”, In: Proceedings of PLEA 2001 – The 18th Conference on Passive and Low Energy Architecture, Florianópolis, Brazil, 7- 9 November. [30] Scandic Hotels AB (2003) Personal communication with Jan-Peter Berqvist, Director of Environmental Affairs at Scandic, March 12, 2003. [31] Accor Hotels (2003) “Sustainable Development, Environment”. Available at www.accor.com, as accessed 11.04.2003.

Paper II

__________________________________________________________________________
B.E.S.T. Sustainable Tourism Think Tank IV “Sustainability and Mass Destinations: Challenges and Possibilities”, July 1-4, 2004, Esbjerg, Denmark
1
Attitudes towards Environmental Responsibility among Swedish, Polish and Croatian Hoteliers
FULL PAPER
Paulina Bohdanowicz*1, Vlasta Zanki-Alujević2, Ivo Martinac1
1 Sustainable Building Systems
Department of Energy Technology
Royal Institute of Technology
Brinellvägen 60
100 44 Stockholm, Sweden
Phone: +46 8 790 7682 (P.Bohdanowicz) / +46 8 790 8740 (I.Martinac)
Fax: +46 8 20 30 07 (P.Bohdanowicz) / +46 8 411 23 23 (I.Martinac)
e-mail: [email protected], [email protected]
2 Faculty of Mechanical Engineering and Naval Architecture
University of Zagreb
Ivana Lucica 5
10000 Zagreb, Croatia
Phone: + 385 1 6168 564
Fax: + 385 1 6118 714
e-mail: [email protected]

__________________________________________________________________________
B.E.S.T. Sustainable Tourism Think Tank IV “Sustainability and Mass Destinations: Challenges and Possibilities”, July 1-4, 2004, Esbjerg, Denmark
2
Introduction
The very essence of tourism is based on the availability of a clean natural environment, while the
tourism industry is simultaneously creating substantial pressure on the environment. The need for
more effective measures is being increasingly endorsed globally by both guests and industry
managers alike. Given its size and global presence, the tourism industry has the potential
of becoming a significant venue of education, as it is exposed to the travelling public, a rapidly
increasing portion of the world’s population. However, reaching sustainability in mass tourism
appears to be a near impossible endeavour. Achieving a greater degree of environmental
responsibility within the tourism industry and among travellers is a challenge of significant
proportion.
The hotel industry represents one of the major pillars of travel and tourism, and hotel facilities
have been documented as possessing one of the greatest negative impacts on the environment
among commercial/service buildings (second only to food service and health care). It is therefore
crucial to induce a more environmentally sound development, operation and performance in this
sector.
The successful implementation of more sustainable practices in the hotel industry
is, nevertheless, highly dependent on the active support and cooperation of all stakeholders
involved. The willingness and ability of hotel management to advocate and implement state-of-
the-art environmentally responsible behaviour and practices is therefore imperative. Similarly,
interest in environmental issues expressed by hotel guests, and their active participation in pro-
ecological activities is both necessary and greatly appreciated.
The first step in creating a more environmentally sound hotel industry should be a performance
analysis of the hotel sector from an environmental perspective. An assessment measuring the
level of environmental awareness among hoteliers and their willingness/ability to exercise
corporate environmental responsibility should be performed in order to reveal the strengths and
weaknesses of a hotel-environment relationship. Unfortunately, only a limited number of studies
dealing with environmental attitudes and activities within the hotel industry are currently available.
Two of the most comprehensive investigations include the 2001 Pricewaterhouse Coopers survey
European Hotel’s Implementation of Environmental Policies published in Hospitality Directions –
Europe Edition in July 2001, and the 1999 Worldwide Hotel Industry Study, prepared and
published by Horwath International and Smith Travel Research. The former includes results from
leading European hotel operators accounting for approximately 10% of the total room stock.
The latter is of a more global character and includes data from over 3 000 hotels (Vögl 1998).
Unfortunately, neither of these publications have been available to the authors, indicating
possible difficulties faced by hoteliers interested in reading these reports.
In an attempt to fill in the information gap a study of environmental awareness in the hotel sectors
in Sweden, Poland and Croatia was conducted (Bohdanowicz 2003). The three countries

__________________________________________________________________________
B.E.S.T. Sustainable Tourism Think Tank IV “Sustainability and Mass Destinations: Challenges and Possibilities”, July 1-4, 2004, Esbjerg, Denmark
3
investigated in this survey represent interesting case studies in respect to issues of environmental
concern at different levels of society and economy.
Methods
A survey questionnaire was developed based on a comprehensive literature review, and
questionnaires were prepared in Swedish, Polish and Croatian. It was comprised of twenty-two
(23 for the Swedish sample) multiple-choice questions, occasionally supplemented by open-
ended follow-up comments included for clarification. Two questions required the respondents
to rank their answers using a 6- and 7-point Likert scale of importance (1 – least important, 6 or 7
– most important). In Poland and Sweden the questionnaires were sent to hotel representatives
by way of e-mail. An additional 100 questionnaires were sent to Swedish hotels by air and
surface mail. In Croatia, personal interviews were conducted by students. Hotel e-mail addresses
for Sweden and Poland were obtained from the Internet and commercially available hotel
directories, while in the case of Croatia, a list was provided by the Institute of Tourism.
The survey was performed in the Autumn of 2002 and Spring/Summer of 2003.
A total of 1923 hotels were targeted, 946 in Sweden, 942 in Poland, and 35 in Croatia,
representing 61%, 97.5% and 27.1% of the existing stock in the region, respectively (Table 1).
Three hundred seventy nine (379) correctly and completely filled-in forms were collected,
accounting for an effective response rate of 25.5% for Sweden, 16.5% for Poland, and 85.7% for
Croatia. In the Swedish and Polish samples the effective response rate was determined after
excluding facilities with invalid e-mail addresses.
Table 1. Survey statistics.
Sample Existing in the country
Sent/ distributed % targeted Completed
answers
Effective response rate,
%
Sweden 1550 946 61.0 225 25.51 Poland 966 942 97.5 124 16.51 Croatia 410 35 27.1 30 85.71
The sample size for target populations (Sweden, and Croatia) was relatively small and
presumably biased, and may not fully reflect the populations at large. Typically, only
representatives of hotels already involved in some type of pro-ecological initiatives chose
to participate in the survey. Moreover, one person in the Croatian sample was responsible for
4 facilities (out of a total of 30 participating hotels). The format of the questionnaire may have
rendered the potential respondents from answering it. A number of respondents commented that
it was too long and complicated. Furthermore, some of the potential respondents may not have
had the sufficient knowledge to answer the designated form.
The distribution of the questionnaire by e-mail may have additionally limited the respondents’
willingness to reply. Surveys, especially those conducted by e-mail generally result in a very low

__________________________________________________________________________
B.E.S.T. Sustainable Tourism Think Tank IV “Sustainability and Mass Destinations: Challenges and Possibilities”, July 1-4, 2004, Esbjerg, Denmark
4
response rate, typically ranging from 10.5% to 30.7% (Crawford-Welch 1991 as cited in Medina-
Munoz & Garciá-Falcon 2000). This is believed to be partially attributed to the lack of direct
personal contact in e-mail based communication, resulting in a perceived lesser obligation
to respond. The relatively low response rate might further reduce the depiction of the sample.
No support from local/national hotel or tourism associations was granted despite the fact that
it was requested.
All of the mentioned aspects have had an influence on the final outcome of the survey,
consequently limiting the portrayal of the sample represented. Despite statistical constraints,
the trends identified from the data collected are still believed to provide a reasonably realistic
impression of the current situation.
Tourism and Hotel Markets in Investigated Countries
Europe has traditionally been a major tourism market, accounting for more than half of all global
tourist arrivals. Almost 400 million international tourists visited Europe in 2002, comprising 56.9%
of global arrivals (WTO 2004). Six European countries remain on the top-ten list of world favourite
destinations, with France leading the ranking, followed by Spain. In 2002 Poland ranked ninth
on the list of major European tourist destinations, followed by Croatia in 15th place. Sweden was
outside of the top-twenty ranking (WTO 2004).
Consequently, Europe represents a major hotel market accounting for 55.6% of all world hotels
and 40% of all hotel beds in 1997 (Olsen et. al. 2000). According to EUROSTAT, slightly more
than 197 000 hotels and similar establishments were operating in European Union member
countries in 2000, offering a total of 9.3 million beds (Schmidt 2002). The majority of European
hotels are independently owned and managed, with only 20–29% representing some type
of chain affiliation (Johnson & Iunius 1999; Olszewski 2003). Today, however, a radical
reorganisation and consolidation is gradually changing the profile of the European hotel market,
and international corporations are steadily establishing their position.
Two trends of expansion can be clearly distinguished (Marsan 2001). A number
of companies are focusing on the growth of key markets, as is the case in Scandinavia (Hilton
acquired Scandic Hotels AB in 2001), and Central and Eastern Europe (Accor purchased
of shares of the Polish main hotel chain Orbis in 2000). The second trend is referred to as the
“gateway city approach”, with hospitality firms establishing their presence primarily in capital cities
and major trade centres, then moving to secondary and tertiary markets (Radisson SAS and
Marriott International appearing in major Central and Eastern European cities).
The Western hotel industry is a relatively well-developed market. As a consequence, the most
attractive locations are already occupied. Markets in the Northern and Southern parts of Europe
are conjointly expanding, however Central and Eastern Europe still attract the major attention
of international hospitality enterprises (Johnson & Iunius 1999). Among the primary advantages

of investing in these markets are geographical factors, such as the proximity to major European
markets, vast areas of relatively untouched and unspoiled countryside, and cultural diversity.
Sweden
Sweden is one of the largest countries in Europe, with a total area of 450 000 km2 and population
of 8.9 million (SCB 2003). According to the Swedish Tourism Authority (STA),
the number of nights spent by tourists in commercial accommodation facilities amounted to over
44 million in the year 2003 (approximately 9.7 million were foreign visitors, Figure 1) (STA 2004).
0
10
20
30
40
50
1992 1993 1994 1995 1996 1997 1998 1999 2000 2001 2002 2003
Nights spent at commercial
accommodation, million
Domestic Incoming
Figure 1. The development of tourism in Sweden, millions of nights spent in hotels, holiday villages, youth hostels and camping sites (STA 2004).
The same year total tourist consumption in Sweden, i.e., tourism expenditure, amounted
to US$ 21.07 billion (SEK 163.5 billion). Foreign leisure tourists spent on average US$ 54 per day
(SEK 419/day), while for business trips the value was estimated at US$ 134.5/day
(SEK 1044/day). The numbers for domestic leisure and business tourists are US$ 45.11/day
(SEK 350/day), and US$ 211.2/day (SEK 1639/day), respectively (STA 2004). Approximately half
of all nights spent by foreign visitors in Sweden were at hotel facilities.
A successful promotion of Sweden as a tourism and conference destination has resulted
in a 40% increase in accommodation demand over the last decade, met by a 14% increase
in supply (STA 2002). The hotel industry in Sweden is well established and hotel premises range
from old manor houses and castles that offer accommodation (e.g., Sundbyholms Slott at the lake
Mälaren), to modern skyscrapers, and city hotels, and an establishment that is globally unique,
since it is repeatedly built every year from snow and ice, i.e. the Jukkasjärvi Ice Hotel®
in Lappland.
In 2002 approximately 1976 hotels were in operation in Sweden offering a total of 194 839 beds
in 99 267 rooms (STA 2002). Twenty-one point one million overnight stays were recorded
in hotels in 2003, at an average occupancy rate of 46% (STA 2004). Business guests,
representing 70% of all hotel customers, dominate the market (CHOSE 2001). Major hotel
markets in Sweden are located within the cities of Stockholm, Göteborg, and Malmö, with
Stockholm being one of Europe’s strongest markets. The Arlanda (airport) market is the fourth
__________________________________________________________________________
B.E.S.T. Sustainable Tourism Think Tank IV “Sustainability and Mass Destinations: Challenges and Possibilities”, July 1-4, 2004, Esbjerg, Denmark
5

largest hotel market in Sweden after the three cities mentioned. Hotel rooms in Stockholm ranked
fifth among the most expensive in Europe in the first quarter of 2003 (US$ 166/night) (Świat
Hoteli 6/2003). Milan was the most expensive at US$ 200/night, followed by London, Paris and
Frankfurt.
The Swedish market is dominated by independently owned and managed facilities, with only
some 570 – 580 affiliated hotels present on the market (Capona 2002; Granhed & Andersson
2003). In addition, a number of voluntary marketing associations are operating on the Swedish
market. Affiliated hotels accounted for 71% of the total hotel revenue in the year 2002 (Granhed
& Andersson 2003).
The average hotel facility in Sweden has 50.2 rooms, while the largest, Hotel Gothia Tower
in Gothenburg, has 704 rooms (Pandox 2002). Total investment in both the hotel and restaurant
industry over the next few years is estimated to be between US$ 0.5 – 1 billion (SEK 5 – 10
billion) with overall investment dominated by the hotel industry (SHR 2003).
Among contemporary trends within the Swedish hotel industry, one merits special attention.
Environmental issues have always been among the top priorities in Scandinavia. In 1999 SIS
Miljömärkning introduced a Nordic Swan eco-label for hotel businesses, and since then
a large number of hotels have received this award, attributing to the allocation of a total
of 71 certificates, as of May 18, 2004 (Nordic Ecolabelling 2004).
Poland
Poland is the largest among the ten new EU-member countries. It has an area of 322 577 km2
and a population of over 38.6 million (GUS 2001).
In 2003, the number of foreign tourists (visitors who stayed in Poland for at least one night)
amounted to 13.7 million (Figure 2) (IT 2004 a), while the total tourism expenditure corresponded
to US$ 4.07 billion (IT 2004 b). On average, the foreign visitor to Poland spent US$ 24 per day
in 2003. Approximately 33 per cent (32.5%) was attributed to accommodation (IT 2004 b).
In 2002, 45.1% of all tourists stayed in hotels (IT 2004 c).
0
20
40
60
80
100
1994 1995 1996 1997 1998 1999 2000 2001 2002 2003
Million of arrivals
Arrivals of international tourists Arrivals of foreigners
Figure 2. Inbound traffic to Poland, million of arrivals (IT 2004 a).
__________________________________________________________________________
B.E.S.T. Sustainable Tourism Think Tank IV “Sustainability and Mass Destinations: Challenges and Possibilities”, July 1-4, 2004, Esbjerg, Denmark
6

__________________________________________________________________________
B.E.S.T. Sustainable Tourism Think Tank IV “Sustainability and Mass Destinations: Challenges and Possibilities”, July 1-4, 2004, Esbjerg, Denmark
7
Political stability and economic growth during the last decade, as well as the potential size
of the market, has stimulated investment in the hospitality segment. As a result, between 1994
and 2001, the number of hotel rooms increased by 6.5% and hotel beds by 4.3%, while hotel
stock grew by 11% between 2001 and 2002 alone (IT 2003).
By the end of July 2002, 1070 hotels were operating in Poland, offering a total
of 57 621 rooms and 109 293 beds (GUS 2003). The hotel market is dominated by three- and
two-star properties (42% and 23%, respectively), however five- and four-star establishments
experienced the highest occupancy rates in the year 2002 (51.3% and 44.8% as compared
to 37.9% and 34.3% for 3- and 2-star hotels, the country’s average occupancy rate equalled
36%) (IT 2003).
Approximately 35% of the accommodation stock in Poland was owned by private individuals
in 2000, followed by the State Treasury, state- and municipally-owned premises (23%, 19% and
17%, respectively) (Łopaciński 2001 as cited in Natucka 2003). Foreign entities owned
approximately 6% of the stock at the beginning of the millennium. Today the situation
is slightly different, since many international hotel companies have been steadily expanding and
establishing their own positions on the market. In 2002, nineteen international and national hotel
corporations were operating on the market (Świat Hoteli 9/2003; Witkowski 2003).
The hotel market in Poland is still relatively undeveloped compared to Western Europe, however,
there is a strong belief that the situation will eventually change (Karczewicz 2000). The Institute
of Tourism predicts a consistent expansion in the demand for hotel facilities in the coming
decade. Despite the difficult times faced by Polish hoteliers (low occupancy, and recent cuts
in new investments), the hotel stock owned/managed by international hotel corporations
is expected to increase by approximately 20% in the next few years (Karczewicz 2000). Two
major trends underway are the construction of two- and three-star properties (Express by Holiday
Inn, Four Points by Starwood, Etap by Accor), as well as the renovation and improvement of the
standard and quality of services in existing facilities (e.g., Orbis) (Hotelarz 3-5/2003; Świat Hoteli
5-7/2003). Two-star, economic type facilities are generally seen as having the greatest
development potential (high interest from both Polish and foreign visitors) and lowest investment
risk. Extended-stay hotels are also experiencing an increase in popularity (Świat Hoteli 6-7/2003).
On the other hand, the renovation and modernisation of existing hotels is necessary as most
of the facilities in prime city locations were built during the 1970s, with frequently substandard
interior design technology and construction materials. Furthermore, a number of international
companies are expected to enter the market in the future (e.g., Hilton, InterContinental, Marriott
and Radisson) (Hotelarz 3-5/2003; Świat Hoteli 5-7/2003). The continuous development and wide
incorporation of information technology, general computerisation and automation of hotel facilities
and reservation systems are imperative for conforming Polish facilities to the standards of the EU
hotels. Environment-related issues have additionally become a growing concern in the hotel
industry.

__________________________________________________________________________
B.E.S.T. Sustainable Tourism Think Tank IV “Sustainability and Mass Destinations: Challenges and Possibilities”, July 1-4, 2004, Esbjerg, Denmark
8
Croatia
Croatia is a relatively small country in Southeastern Europe, by the Adriatic Sea. It has an area
of 56 542 km2 with a coastline length of 5835 km2, and a population of 4.44 million (according
to official statistics in 2001) (About Croatia 2004). It has long been a prime destination for tourism
in the Mediterranean region. According to the World Tourism Organisation data, the
Mediterranean countries constitute 20.4% of international tourist arrivals (WTO 2004). After
regaining independence in 1991, the Croatian tourism industry was able to start re-establishing
its position. Today Croatia is regarded as one of the countries with the highest growth rates
in terms of international tourist arrivals (8.4% as compared with annual growth rate for
Mediterranean of 3%) (HGK 2004).
In 2003 almost 9 million tourists visited Croatia (6.7% more than in the previous year, and 4.5%
more as compared to 1990), with domestic tourists representing only 16.5% (MINT 2004).
Notably the 1990 figures for domestic traffic include data for Bosnia & Herzegovina and Slovenia
as well. The total number of recorded overnight stays equalled 46.6 million in 2003 (MINT 2004).
The average tourist stay in Croatia in 2002 was five days (four days for domestic and six for
foreign tourists) (HKG 2004). The foreign tourist market illustrates an evident demand for shorter
holidays, so-called “short-breakes”, rather that longer, seven or fourteen-day holiday
arrangements. According to data from the Croatian National Bank, international tourism revenue
in 2002 amounted to US$ 3.9 billion, which is a 14% increase in comparison with the previous
year (HGK 2004). Tourists in Croatia spend an average of US$ 36 daily, 87% of which is spent on
basic services (food, beverages and accommodation) and 13% on other services (Tomas 2001
as cited in HGK 2004). The revenue generated by international tourism in 2001 amounted
to 17.1% of GDP, 34.6% of total exports of goods and services and 68.4% of total services
exported. In 2002, revenue from international tourism accounted to 17% of Croatia’s GDP, while
income per capita from tourism was US$ 858.9 (HGK 2004).
Nautical tourism is one of the most attractive and prosperous forms of Croatian tourism (HGK
2004). In 2002, the number of tourists staying in marinas rose by 12% and the number
of overnights stays increased by 6% compared to the previous year. As a result, nautical tourists
account for 7.5% of the total number of tourists.
Approximately 90% of all tourist arrivals and 96% of overnight stays were concentrated
in 7 coastal counties (MINT 2004). The largest numbers of tourist and overnight stays in 2003
were recorded at Istria (34.8% of all tourist overnight stays), Primorje – Gorski Kotar (22%), Split
– Dalmatia (14.27%), Zadar (9.23%), Dubrovnik – Neretva (7.84%), Šibenik – Knin (6.1%) and
Lika – Senj (2%). Continental Croatia and Zagreb accounted for the remaining 3.76%.
Consequently, coastal regions are the areas with the most developed hotel infrastructure.
According to data provided by the Ministry of Tourism in 2001, approximately 14 000 000
guestnights were recorded in 22 392 rooms of 132 (3, 4 and 5-star) hotels in 7 of the coastal

__________________________________________________________________________
B.E.S.T. Sustainable Tourism Think Tank IV “Sustainability and Mass Destinations: Challenges and Possibilities”, July 1-4, 2004, Esbjerg, Denmark
9
counties (MINT 2002). In 2002, Croatia had a total of 752 601 beds, 12.8% of which were located
in hotels, 25.6% in camps, 39.1% in private accommodation and 6.9% in marinas.
During the years 1993 to 2001, investment in tourism (hotels, motels and restaurants) accounted
for 2.74% (US$ 1.8 billion) of the total direct equity investment in Croatia (HGK 2004). In 2001
alone, tourism accounted for as much as 6.3% or US$ 6.7 million of all direct investments.
As a consequence, the quality of available accommodation has been constantly improving.
Currently, the majority of hotel facilities (40%) are in the 3-star category, according to the present
categorisation scheme, with only 8% belonging to a 5-star group (HGK 2004). The majority
of accommodation establishments (41%) in Croatia belong to private owners (small stakeholders,
managers and individual private owners), and are represented by small family-run hotels and
B&Bs (HGK 2004). These lodging facilities ensure personalised services and are typically tailored
to customer needs. In 2001, commercial banks owned 26% of accommodation units, privatisation
funds (PIF) – 18%, and the Croatian Privatisation Fund (HFP) – 15%. The current portfolio of the
Republic of Croatia includes 145 tourist companies, in 43 of which the state owns more than 50%
of shares (HGK 2004). Hotels and restaurants employ 81 000 people, with the entire tourism
sector directly employing 140 000 people and an additional 175 000 indirectly (HGK 2004).
Hotels with a distinctive character, so-called “boutique hotels” are currently very popular. Hotels
also compete by specializing in sports, wellness, fitness, and conferences or as hotels for
gourmets, singles, nature-lovers etc. The daily spending in hotels is US$ 49.9 (Tomas 2001
as cited in HGK 2004).
Currently, effort is being devoted to the refurbishment and modernisation of hotel facilities
in response to the growing interest of tourists, thereby giving way to the possibility
of incorporating environmentally sound technologies and practices into the hotel market.
Discussion of Results
The livelihood of tourism, as well as the hotel industry, depends to a considerable extent on the
availability of a clean natural environment. Traditionally, and to some degree understandably –
from a business perspective and in fear of negative publicity – the hotel industry has been
reluctant to assume responsibility for any significant negative environmental impacts occurring
during various stages (including construction, operation, maintenance, retrofitting, demolition)
in the life-cycle of hotel facilities. Recently, however, attitudes have started to change. This was
acknowledged by the majority of respondents, 81.5% in Poland, 82.7% in Sweden and 100%
in Croatia, who believed environmental protection to be essential for the performance and further
development of the tourism industry. Recognizing the problem is a necessary first step towards
change and the implementation of more responsible practices and behaviour.
The majority of respondents, 69.3% in Poland, 83.3% in Croatia, and 87.6% in Sweden, believed
that environmental impacts caused by hotels are moderate to significant (Figure 3), which
supports the findings of previous scientific investigations (APAT 2002; Balaras 2003). By contrast,

in a similar study performed in Guernsey, the Channel Islands, only 38%, respectively 36%, of the
respondents believed that hospitality, or the tourism sector had a moderate to significant impact
on the environment (Stabler & Goodall 1997).
23,6 16,9 10
6452,4 73,3
11,628,2
13,3
3,32,40,8
0%
20%
40%
60%
80%
100%
Sweden, N=225 Poland, N=124 Croatia, N=30
% o
f res
pond
ents
Significant Medium Non-significant None
Figure 3. Magnitude of perceived hotel environmental impacts, % of respondents.
Due to its size and global presence, the hotel industry has a substantial potential for the
promotion and support of corporate responsibility. It is therefore encouraging that a predominant
majority of hoteliers in this study expressed a serious concern for the environment. The extent
of positive answers ranged from 82.3% in the Polish sample, to 94.7% for Swedish and 100% for
Croatian respondents.
Employee awareness of on-going (in-house or corporate-level) activities promoting greater
environmental responsibility and a general concern for environmental issues was highest
in Sweden (66.2% positive answers, including 60.4% actually listing concrete pro-ecological
activities), Croatian hotel representatives ranked second (63.3% and 60%, respectively), followed
by Poland (56.5% and 43.5%). At the same time, many respondents were concerned about the
cost of becoming more environmentally responsible.
Despite existing limitations, a majority of hoteliers declared to be involved in some type
of environment-oriented activity (50% in Croatia, 84.7% in Poland, and 93.3% in Sweden).
Up to 75% of the environmental impacts caused by the lodging industry are estimated to originate
from an excessive consumption of non-durable goods (and consequent waste generation),
as well as use of energy and water (APAT 2002). These areas are those most frequently targeted
by environmental measures. In total, more than 77% of the respondents from Poland and
Sweden, and only 26% from Croatia declared being involved with energy and water saving
measures, and some form of waste management (sorting, recycling). Swedish hoteliers generally
displayed the highest interest in environmental activities, while in Croatia pro-ecological initiatives
were not found to be very common (Figure 4).
__________________________________________________________________________
B.E.S.T. Sustainable Tourism Think Tank IV “Sustainability and Mass Destinations: Challenges and Possibilities”, July 1-4, 2004, Esbjerg, Denmark
10

87,6 85,3 89,983,9 79 77,4
26,7 26,7 36,7
020406080
100
Energy conservation Water conservation Responsible wastemanagement
% o
f res
pond
ents
Sweden, N=225 Poland, N=124 Croatia, N=30
Figure 4. Environmental areas targeted, % of respondents.
Among energy saving options, energy-efficient lighting received the most attention (76%
in Sweden, 70.2% in Poland but only 23.3% in Croatia). A high popularity of energy-efficient
lighting among the respondents may be attributed to promotion campaigns that have been
implemented in many of the regions, as well as the fact that even small savings actually elucidate
reasonable economic benefits. Many people insist that efficient equipment is prohibitively
expensive, however they are often unaware of the fact that the running costs of inefficient
apparatus are frequently much higher than the initial cost of more efficient equipment.
It is therefore important to evaluate the cost of equipment not only based on initial cost, but taking
the entire life-cycle into consideration. This attitude will gradually become more common in the
future and current figures related to the incorporation of energy-efficient equipment into the hotel
market (20% for Croatia, 41.9% for Poland, and 58.2% for Sweden) will undoubtedly increase.
Leaflets encouraging hotel guests to save energy are frequently displayed in the rooms
of Swedish hotels (40.4%), followed by Polish hotels (22.6%), and only marginally in the Croatian
facilities (6.6%). The relatively low popularity of various leaflets may be explained by the role that
hotels have in society. They are a segment of the service industry and designed to provide multi-
facetted comfort and services to guests who are frequently accustomed to, and willing to pay for
exclusive amenities, treatment and entertainment. The placement of any “Please save”
information in the room, may therefore be perceived by the guests as an intrusion on their privacy
and comfort. On the other hand, these leaflets do not oblige anyone to follow their content, their
aim is merely to suggest the possibility of co-operation.
Among water saving measures, the towel and linen reuse program is a well-established practice
in most European countries, with 71.6% respondents from Sweden, 64.5% from Poland and
23.3% from Croatia indicating this area of activity. This initiative saves not only water and
electricity, but also reduces the use of detergents and prolongs the life-expectancy of materials.
The installation of water-efficient fixtures may have a significant influence on the total quantity
of water used. Water saving fixtures are most common in Sweden, with more than 60% of the
hotels in the investigated sample declaring their use. The figure for Poland is 44.4% and for
Croatia – 23.3%. A comment frequently expressed was the fact that these types of fixtures were
generally installed during the refurbishment of the rooms. Leaflets encouraging customers to save __________________________________________________________________________
B.E.S.T. Sustainable Tourism Think Tank IV “Sustainability and Mass Destinations: Challenges and Possibilities”, July 1-4, 2004, Esbjerg, Denmark
11

__________________________________________________________________________
B.E.S.T. Sustainable Tourism Think Tank IV “Sustainability and Mass Destinations: Challenges and Possibilities”, July 1-4, 2004, Esbjerg, Denmark
12
water are less popular, but nevertheless employed by every tenth hotel in Croatia and every
fourth facility in Sweden.
The consumption of non-durable goods and consequent generation of waste is a predominant
issue influencing a hotel’s impact on the environment. The quantity of waste produced at an
average hotel is generally measured in tonnes per month, resulting in significant transportation
and land-filling costs. The avoidance of waste generation is a beneficial solution both
environmentally and economically. Waste sorting, mainly in offices and kitchens, uncommon in
guestrooms, is by far the most widely used practice in Sweden, where four out of five of the
hotels included in the survey have an active waste sorting and recycling program. In the
Scandinavian countries, significant attention is generally given to waste sorting and recycling,
explaining the high performance rate of this activity in Swedish hotels. The relatively low
popularity of waste sorting in Poland and Croatia (30.6% and 30%, respectively) may
be attributed to the lack of sorting facilities in a number of regions in these countries.
Furthermore, as indicated by one of the respondents, there is often only one vehicle collecting
waste in the area, dumping sorted and unsorted debris into a common container, and thus
discouraging locals to continue separating waste. Such barriers could however be relatively easily
overcome by initiating cooperation among hotels located in the same area, as has been shown
by the Budapest Hotels Collective Waste Management Program (UNEP & IH&RA 1997). Much
of the furniture, equipment, textiles and other items found in hotels is still in fairly good condition
when exchanged, therefore donation/sale to local charities is a customary practice (60%
respondents in Sweden, 50.8% in Poland, and 16.6% in Croatia). This initiative corresponds well
with the idea of sustainability, since prolonging the active life-expectancy of various items lowers
their environmental costs (from the life cycle point of view). The issue of food donation
is extremely controversial and often prohibited by local sanitary laws, explaining its low popularity
(32.3%, 17.4% and 0% in Poland, Sweden and Croatia, respectively). Approximately 50% of the
respondents from Poland and Sweden and 0% from Croatia supported the purchase and
utilisation of bulk or/and reusable food and detergent packaging instead of throw-away
alternatives. Hoteliers participating in the survey were further asked to estimate by effectiveness
the incentives, which could induce them to undertake environmentally-oriented initiatives, based
on a 7-point Likert scale (Figure 5). This figure illustrates that the results varied somewhat
between countries.
The possibility of reducing operational costs was by far the strongest incentive for Polish
hoteliers. This was slightly less true in the Swedish and Croatian cases (operational cost savings
ranked an average of 5.8 in Poland, as compared to 5.1 in Croatia and 5.04 in Sweden). This
corresponds well with the findings of the Guernsey study (Stabler & Goodall 1997), where the
prospect of reduced costs was equally found to be the most important. Croatian hoteliers ranked
the potential of improving hotel image as most important. Customer expectations ranked second
in the Polish and Swedish samples. Croatian hotels, ranked the goal of decreased environmental

impacts as third, and customer expectations as fourth. Swedish hoteliers also placed decreased
environmental impacts as a third priority followed by improved hotel image, while for Polish
hoteliers hotel image ranked third before additional marketing assets.
01234567
Reducedoperational
costs
Improved hotelimage
Decreasedenvironmental
impact
Corporatepolicy
Marketing asset
Customerexpectations
Availability ofprofessional
advice
7-point Likert scale
Sweden, N=225 Poland, N=124 Croatia, N=30
Figure 5. Estimating, by effectiveness, incentives supporting pro-ecological behaviour/practices (averaged values estimated with a 7-point Likert scale).
Due to a low customer demand, hoteliers are currently giving eco-friendliness little priority in their
marketing efforts (Figure 6). Low customer demand obviously decreases the marketing value
of corporate environmental responsibility. However, low demand does not necessarily indicate
a low environmental consciousness among travellers, rather a lack of awareness of the ways and
the extent to which hotel facilities may affect the environment negatively. Due to a current lack
of data, more research is needed to investigate customer consciousness, expectations and
behaviour. Also, unless specifically trained, the average traveller cannot be expected to be aware
of, or to know how to use the complex environmental metrics needed for evaluating
environmental performance of hotel facilities. The scarceness of environmentally responsible
role-model facilities makes it additionally difficult for travellers to distinguish “good” from “bad”
facilities.
020406080
100
Location Quality ofservices
Tradition of thehotel
Price Concern for theenvironment
Other
% o
f res
pond
ents
0123456
6-po
int L
iker
t sca
le
Sweden, N=225 (% of respondents) Poland, N=124 (% of respondents) Croatia, N=30 (% of respondents)
Sweden, N=225 (Likert scale) Poland, N=124 (Likert scale) Croatia, N=30 (Likert scale)
Figure 6. Weighing of hotel features affecting customer choice (according to hoteliers), % of respondents and 6-point Likert scale.
__________________________________________________________________________
B.E.S.T. Sustainable Tourism Think Tank IV “Sustainability and Mass Destinations: Challenges and Possibilities”, July 1-4, 2004, Esbjerg, Denmark
13

__________________________________________________________________________
B.E.S.T. Sustainable Tourism Think Tank IV “Sustainability and Mass Destinations: Challenges and Possibilities”, July 1-4, 2004, Esbjerg, Denmark
14
The percentage answers in Figure 6 indicate the number of hotels actually listing given features
in their marketing materials, while the Likert scale refers to the importance of certain features
in affecting customer choices. A 6-point Likert scale was used in the collection of this set of data,
as the questionnaires offered six ranking options in this case.
Conclusions
Swedish hoteliers were generally found to have a higher environmental awareness,
comprehensive knowledge relevant to environmental protection, and well-established pro-
ecological programs and initiatives. Polish hoteliers are at the stage of recognizing the
importance of the environment and initiating various activities. However, since the national level
of environmental education/knowledge is relatively low, most actions undertaken by Polish
hoteliers are aimed at achieving immediate economic benefits, or those required by law.
It is reasonable to conclude that Polish incentives are primarily economically motivated, while any
environmental benefits achieved are seen as an extra bonus. Croatian hoteliers generally seem
to have a high level of environmental knowledge and concern for environmental issues. However,
among the three countries investigated, concrete pro-ecological initiatives were found to be least
likely implemented in Croatia. This may in part be due to the very recent revival of the Croatian
tourism industry, following regional political and economic difficulties in the 1990s. It is reasonable
to expect the situation in Croatia to improve as the industry continues to regain momentum.
This study has indicated that the prospect of significant cost savings as well as customer
demand, are currently the most likely parameters to enhance environmental responsibility among
hoteliers. Undoubtedly a great need remains for increasing environmental knowledge and
awareness among hoteliers and the general public. To better understand and develop the
marketing potential of environmental responsibility, the mechanisms of customer demand and
choice will need to be investigated in more detail in the future.
References
• About Croatia (2004), Croatian Government official web site, available at www.vlada.hr, as accessed 20.05.2004.
• APAT (2002), Tourist accommodation EU ecolabel award scheme – Final report. Italian National Agency for the Protection of the Environment and for Technical Services, European Commission, October 2002, pp.28.
• Balaras C.A. (2003), Editorial, Xenios Newsletter 1, January 2003. • Bohdanowicz P. (2003), A study of environmental impacts, environmental awareness and pro-
ecological initiatives in the hotel industry. Licentiate Thesis. Department of Energy Technology, Royal Institute of Technology, Stockholm, Sweden, December 2003.
• Capona (2002), Capona 2002 Annual Report (in Swedish). Capona AB, Sweden, pp.12.

__________________________________________________________________________
B.E.S.T. Sustainable Tourism Think Tank IV “Sustainability and Mass Destinations: Challenges and Possibilities”, July 1-4, 2004, Esbjerg, Denmark
15
• CHOSE (2001), Energy savings by combined heat cooling and power plants (CHCP) in the hotel sector. Report of the Commission of the European Communities, Directorate General for Energy, Contract No XVII/4.1031/Z/98-036, May 31, 2001, pp.19.
• Granhed G., Andersson H. (2003), Hotellåret 2002 (The hotel year 2002 – in Swedish). Restauratören Nyheter 7, Sveriges Hotell- och Restaurangföretagare, Sweden, pp.14.
• GUS (2001), Rocznik statystyczny 2001 (Statistical data 2001 – in Polish). Główny Urząd Statystyczny - Main Statistics Office Poland, Warszawa, Poland.
• GUS (2003), Accommodation stock in 2002 - state as of July 31, 2002 (Baza noclegowa w 2002 roku - stan 31 VII). Available at the Institute of Tourism web page www.intur.com.pl, last modified 30.6.2003, as accessed 22.7.2003.
• HGK (2004), Tourism, Croatian Chamber of Economy, Tourism and catering industry department, available at www.hgk.hr, as accessed 18.05.2004.
• Hotelarz (Hotel and Motel Management Magazine – in Polish) 3 – 5 (2003). Wydawnictwo SIGMA-NOT, Warszawa, Poland.
• IT (2003), Accommodation stock. Instytut Turystyki. Available at www.intur.com.pl, last modified 30.6.2003, as accessed 22.7.2003.
• IT (2004 a), Inbound traffic to Poland. Instytut Turystyki. Available at www.intur.com.pl, last modified 13.2.2004, as accessed 18.5.2004.
• IT (2004 b), Foreign tourists expenditure in Poland. Instytut Turystyki. Available at www.intur.com.pl, last modified 7.4.2004, as accessed 18.5.2004.
• IT (2004 c), Accommodation stock occupancy. Instytut Turystyki. Available at www.intur.com.pl, last modified 4.5.2004, as accessed 18.5.2004.
• Johnson C., Iunius R.F. (1999), Competing in Central Eastern Europe: perspectives and developments. International Journal of Hospitality Management 18, pp. 245-260.
• Karczewicz A. (2000), The state of Poland’s hospitality industry. Marketing Report, Global Hotel Network(SM), July 22, 2001. Available at www.globalhotelnetwork.com, as accessed 25.2.2002.
• Łopaciński K. (2001), Rynek Powierzchni Rekreacyjnych i Hotelowych w Polsce. Report from the Conference on Recreation and Hotel Space Market in Poland, June 2001, as cited in D. Natucka (2003), Energy in Polish hotels – sources, needs, possibilities of savings and implementation of sustainable energy solutions, an unpublished Thesis for the degree of Master of Science in Sustainable Energy Engineering, Department of Energy Engineering (EGI), Royal Institute of Technology (KTH), Stockholm, Sweden, January 2003.
• Marsan J. (2001), European Empires – overview of European hotel industry. Hotels, June 2001.
• Medina-Munoz D., Garciá-Falcón J.M. (2000), Successful relationships between hotels and agencies. Annals of Tourism Research 27(3), pp.737-762.
• MINT (2002), Sazetak Smjestajnih kapaciteta u hotelima s tri, cetiri i pet zvjezdica (stanje na dan 15.08.2001), available at www.mint.hr/statistika_sadrzaj.htm, as accessed 20.02.2002.
• MINT (2004), Tourist Traffic 2003, Ministry of the Sea, Tourism, Transport and Development, Republic of Croatia, available at http://www.mint.hr, as accessed 18.05.2004.
• Nordic Ecolabelling (2004), Nordic Swan webpage. SIS Miljömärkning. Available at www.svanen.nu, as accessed 18.5.2004.
• Olsen M.D., Zhao J., Sharma A., Choi J.-G. (2000), Leading hospitality into the age of excellence: Expansion, competition and vision in the multinational hotel industry 1995-2005. An IH&RA White Paper on the Global Hospitality Industry. International Hotel and Restaurant Association. Paris, France, p.48.
• Olszewski K. (2003), Świat hoteli (Hotel World Magazine – in Polish) 6, p.29, Brog Media Biznesu, Warszawa, Poland.
• Pandox (2002), Pandox annual report 2002. Pandox AB and LINK Investor Relations, Sweden, pp.40.

__________________________________________________________________________
B.E.S.T. Sustainable Tourism Think Tank IV “Sustainability and Mass Destinations: Challenges and Possibilities”, July 1-4, 2004, Esbjerg, Denmark
16
• SCB (2003), Statistiska Centralbyrån – Statistics Sweden web page. Available at www.scb.se, as accessed 30.6.2003.
• Schmidt H.W. (2002), Stability of tourism flows in the European Union. Statistic in Focus, Industry, trade and services, Theme 4 – 28/2002, European Communities, pp.6.
• SHR (2003), Kort om SHR (Shortly about SHR – in Swedish). Sveriges Hotell- och Restaurangföretagare information folder, pp.8.
• STA (2002), Tourism in Sweden 2002. Report from Turistdelegationen - Swedish Tourist Authority, Sweden, pp.3-9.
• STA (2004), Tourism in Sweden 2003. Report from Turistdelegationen - Swedish Tourist Authority, Sweden, pp.2,3,23,29,39.
• Stabler M.J., Goodall B. (1997), Environmental awareness, action and performance in the Guernsey hospitality sector. Tourism Management 18(1), pp.19-33.
• Świat Hoteli (Hotel World Magazine – in Polish) 5 – 9 2003, Brog Media Biznesu, Warszawa, Poland.
• UNEP, IH&RA (1997), Environmental good practice in hotels. Case studies from the International Hotel and Restaurant Association Environmental Award - Green Hotelier. United Nations Environmental Program and International Hotel and Restaurant Association. Paris, France, pp.10.
• Vögl A. (1998), 1998 Horwath worldwide hotel industry study. Conference Report, IH&RA 36th Annual Congress, October 22-26, 1998, Manila, Philippines. Available at www.ih-ra.com, as accessed 24.10.2001.
• Witkowski K. (2003), Siła systemu (A power of a system – in Polish). Hotelarz – Hotel and Motel Management Magazine 4, pp.16-17, Wydawnictwo SIGMA-NOT, Warszawa, Poland.
• WTO (2004), Tourism Highllights, Edition 2003, World Tourism Organisation, Spain, pp.2, 4-5.

Paper III

10.1177/0010880404273891
European Hoteliers’Environmental
AttitudesGreening the Business
by PAULINA BOHDANOWICZ
Although many hotels rely on the natural environmentto attract guests, a survey of European hoteliers findsthat environmental stewardship has taken a backseatto other operational concerns in many cases. Never-theless, the surveyed hoteliers recognized that thehotel industry would do well to be more environ-mentally conscious. Managers in chain-affiliatedhotels were generally more likely to pay attention toenvironmental issues than were independent opera-tors, many of whom run small properties. The respon-dents noted that few hotel guests demand that hotelsmaintain environmental programs.
Keywords: hotels; Europe; survey; environmental at-titudes; environmental initiatives; incen-tives; independent hotels; chain-affiliatedhotels
The development and well-being of the hotelindustry in tourism destinations depends on aconstant availability of natural resources. Fur-
thermore, the natural appeal of a destination is typi-cally one of its main tourism-related assets. At thesame time, the natural environment is also the featuremost directly threatened by potential overexploitation.Many of the services provided by hotels are resource-intensive, resulting in a significant ecological foot-print. Deterioration of the natural environment inmany places threatens the well-being of the hotel andtourism businesses.
Preserving high environmental quality, as advo-cated by the green movement within the hotel industry,should therefore be one of the priority areas on the busi-ness agenda. To achieve noticeable improvement, hotelmanagers must be willing to act in an environment-
188 Cornell Hotel and Restaurant Administration Quarterly MAY 2005
© 2005 CORNELL UNIVERSITYDOI: 10.1177/0010880404273891Volume 46, Number 2 188-204

friendly manner. They also need to havesufficient knowledge and financial meansto implement state-of-the-art environmen-tally responsible behavior and practices.
In this regard, a significant difference inenvironmental attitudes between the inde-pendent and chain-owned hotels wasreported in a 2000 German study.1 In thecase of independently operated facilities,environmental concern and a willingnessto act are strongly dependent on the hotelmanager’s attitude and knowledge. Incontrast, chain-affiliated hotels oftenincorporate environmental issues in theircompany policies, which usually are im-posed on individual establishments. Fur-thermore, large companies are increas-ingly required to display environmentaland social commitment and achievementsin addition to the traditional financialstatement. These factors, combined withthe chain hotels’ financial resources andthe need to keep a good brand image, arelikely to result in chain-affiliated hotels’being generally more active in environ-mental issues than individually owned andmanaged facilities. The aim of the studyreported in this article was to examine theempirical evidence relating to the abovehypothesis.
To the best of my knowledge, few stud-ies have been made of the environmentalattitudes and ecological initiatives withinthe hotel industry.2 The issue of differ-ences among chain and independenthotels has been studied to an even lesserextent.3
To fill this gap, I have made an attemptto study and compare the level of environ-mental knowledge and awareness amongmanagers of European independent andchain-affiliated hotels. I have also exam-ined the extent of ecological initiatives inday-to-day hotel activities to evaluate theimpact that corporate policy is likely tohave on the operations of individual estab-
lishments. I have additionally attemptedto identify the incentives encouraginghoteliers to implement environmentallyoriented initiatives at their hotels. The out-come of the study is a list of actions thathoteliers and other tourism practitionerscan take to improve their environmentalperformance. One outcome of the study isthat some of the initiatives should befocused on hotel guests to stimulate their“environmental conscience” and create ademand for more green alternatives withinthe hotel and tourism industries.
European hotels were targeted in thisstudy for a number of reasons. First,Europe is a major tourism destination, vis-ited by approximately 400 million inter-national tourists annually.4 Second, theEuropean hotel market, estimated at205,000 facilities and almost 10 millionbeds, represents half the global market.5 Italso provides accommodations for 160million to 200 million international guestsper year.6 Third, a number of local studieson environmental issues have previouslybeen performed, allowing a comparison offindings.7 Fourth, although fewer than 30percent of European hotels are brand affil-iated,8 all major international hotel chainsare represented in the European market.9
As previously mentioned, environmentalpolicies and initiatives are frequentlydeveloped on the corporate level and thusare likely to be relatively similar for allestablishments belonging to a chain.10 It isthus reasonable to assume that attitudesrepresented by managers of chain andassociated hotels in Europe are compara-ble to those on other continents. As re-gards the independently owned and man-aged hotels, the situation is complicatedbecause the managers have considerablefreedom in operating their facilities. Itcould, nevertheless, be assumed that sincethe goals of hoteliers worldwide are simi-lar (that is, bringing in profits and ensur-
MAY 2005 Cornell Hotel and Restaurant Administration Quarterly 189
EUROPEAN HOTELIERS’ ENVIRONMENTAL ATTITUDES EUROPE

ing high quality of service for the cus-tomers), independent operators’ attitudestoward the environment may also becomparable.
In the sections below, I present the find-ings of my work and discuss their rele-vance and potential implications for thelodging industry. To set a context for thisstudy, I first explore existing research onhotels’ environmental impact and thedevelopment of sustainability policieswithin the sector. Next, I explain themethod of my research, its limitations, andthe data collected. The results and discus-sion of the findings are presented underheadings relevant to the sections of thequestionnaire used. Finally, I put forwardsuggestions for proactive managementsolutions within the sector.
Hotels and the EnvironmentThe hotel industry is among the most
energy-intensive sectors of the tourismindustry, and the prevalence of fossil-fuel-generated power and the (still) marginaluse of renewable energy resources trans-late into emissions of carbon dioxide,particulates, nitrogen and sulfur oxides,and other air pollutants. It is estimated thata typical hotel annually releases between160 and 200 kg of CO2 per m2 of roomfloor area, depending on the fuel used togenerate electricity, heating, or cooling.11
European hotels consume 39 TWh(terawatt hours) of energy annually, halfof which is in the form of electricity.12
Assuming, in a worst-case scenario, thatall that energy is generated using coal,hotels located in Europe would be respon-sible for annual emissions of approxi-mately 13.6 megatons of carbon dioxide.13
Water consumption (in terms of overallamounts and use patterns) depends notonly on the type, standard, and size of afacility but also on services and facilities
offered, climate and irrigation needs, andany water-conservation practices. So far,no collective data for water use in Euro-pean hotels have been derived; however, itis estimated that, depending on the hotelstandard, guests generally consume be-tween 170 and 360 liters of water pernight.14 By comparison, a recent reportfrom a European hotel chain provided afigure of 440 liters per guest-night,15 whileanother source reports a consumption of224 liters per guest-night.16
Because hotels are large users of con-sumer goods, waste generation is proba-bly the most visible effect that the hotelindustry has on the environment. By oneestimate, a typical hotel produces in ex-cess of 1 kg of waste per guest per day,which results in tons of waste each month.A large proportion (50 to 60 percent) ofthe materials that constitute this wastecould be recycled or reused.17 The averagequantity of unsorted waste materials forRadisson SAS hotels was reported as 3.1kg per guest-night in 2002, for instance,with Scandinavian and German facilitiesproducing considerably less waste (1.5 kgper guest-night) than the corporate aver-age.18 On the other hand, Scandic Hotelsreported an average of 0.515 kg of un-sorted waste per guest per night.19 Bestpractices in waste minimization and recy-cling have shown that waste generationcan be limited to 50 g of unsorted wasteper guest-night.20
The above figures demonstrate the needfor environment-friendly operation ofhotel facilities. Hotels also are on trial inthe court of public opinion. Increasedenvironmental awareness among thegeneral public, the emergence of socialenvironmental movements, and the devel-opment of the concept of “green consum-erism,” starting in the mid-1980s, havecontributed to raising criticism of the
190 Cornell Hotel and Restaurant Administration Quarterly MAY 2005
EUROPE EUROPEAN HOTELIERS’ ENVIRONMENTAL ATTITUDES

existing tourism practices. The greenmovements within the hotel industry havealso gained momentum through the effortsof various associations. In many parts ofthe world, increasingly stringent environ-ment-related regulations are beingadopted and enforced, and the corporateworld is increasingly required to engage inenvironmental and even triple-bottom-line reporting.
A variety of environmental guidelineshave been developed by different organi-zations, such as the International Hotel &Restaurant Association (IH&RA), theAmerican Hotel & Lodging Association(AH&LA), and the International HotelEnvironmental Initiative (IHEI).21 Evenhotel corporations now prepare their ownaction plans and training programs inenvironmental protection.22 Perhaps mostimportant in the corporate context, there isample evidence showing that resourceefficiency and environmental responsibil-ity make excellent business sense.23
MethodDespite a number of noteworthy contri-
butions, the literature on environmentalattitudes within the hotel sector suffersfrom two significant limitations. First,most of the existing studies investigatedinsufficiently broad samples, in terms ofgeographical or subject scope (typically, asingle destination, region, or brand). Stud-ies by Horwath, Smith Travel Research(STR), and PricewaterhouseCoopers,while broad in scope, involved a limitedlevel of detail. In contrast, my study aimsto cover a substantial portion of the Euro-pean market, with a relatively high degreeof detail. Second, past studies did notexplicitly investigate the difference in atti-tudes and activities between indepen-dently managed and chain hotels (withthe exception of the IER [Institut für
Energiewirtschaft und Rationelle Ener-gieanwendung] study).24 This, therefore,became a major objective of the researchpresented here.
The prospects of economic savings and customer
demand are crucial to hotel industry environmental
awareness and responsible environmental
management.
This study was conducted by sendingan e-mail-based questionnaire to a total of4,049 European hotels.25 I used e-mail dueto time and financial constraints. Thechoice of individual hotels was thus influ-enced by the availability (on the Internetand in hotel directories) of relevant e-mailaddresses. This limitation resulted in acertain sample bias, as 58.3 percent of theparticipating hotels belonged to a chain orassociation.26
A survey questionnaire, developedbased on a comprehensive literature re-view,27 was administered in three stages: inOctober through December 2002, inMarch through May 2003, and in June2003.28 I collected 610 correctly and com-pletely filled-in forms, amounting to aneffective response rate of 16.6 percent—well within the typical range for e-mailsurveys.29 Responses from independenthotels accounted for 29.8 percent of the610 respondents, and the remaining 70.2percent belonged to a specific type ofhotel association or chain. The profile ofparticipants is presented in Exhibit 1.
Despite the relatively low response rateand the preponderance of chain-basedrespondents, the study did provide valu-able insights into environmental attitudesin the European hotel sector. In general,representatives of both chain-affiliated
MAY 2005 Cornell Hotel and Restaurant Administration Quarterly 191
EUROPEAN HOTELIERS’ ENVIRONMENTAL ATTITUDES EUROPE

and independent establishments re-sponded in similar ways to most ques-tions. Their positions diverged, however,on certain topics. I will present the trendsindicated and discuss the reasons for par-ticular answers and possible implications.
Perceived Importanceof the Environment
Hoteliers participating in the surveywere asked whether issues relevant toenvironmental protection are importantfor the performance and development oftourism. Approximately eight out of tenrespondents believe that these issues areimportant (85.7 percent among chainhotels and 78.6 percent among indepen-dent facilities).
One might attribute the prevalence ofsuch a positive attitude to intensiveproenvironmental campaigns carried outacross Europe and, thus, to increased envi-
ronmental awareness among industry rep-resentatives. However, there is a certainrisk in such an interpretation. Pressures toappear socially responsible may lead indi-viduals to overstate their environmentalcommitment and proecological behaviorin the context of surveys. This actuallyseems to be the case in the current re-search. While hoteliers said that environ-mental issues are important for the indus-try, some respondents also indicated thatthey believed environmental issues to bemore relevant to nature-based tourism, assuggested in the following comments:“The environment plays a role in leisure”and “The environment is important fortourism but not in the centre of Paris.”Despite the perception that environmentalconcerns drive customer actions,30 thissurvey revealed that hoteliers do not con-sider environmental commitment to be amajor marketing factor (Exhibit 2).31
192 Cornell Hotel and Restaurant Administration Quarterly MAY 2005
EUROPE EUROPEAN HOTELIERS’ ENVIRONMENTAL ATTITUDES
Exhibit 1:Profile of Survey Participants
ChainFunction or Position of the Respondent Affiliated Independent
Management 52.3% 54.9%Sales and marketing 14.3% 15.4%Front office and services 20.8% 14.3%Environmental coordinator 3.7% 2.7%Anonymous answers 8.9% 12.7%
Size distribution of facilitiesSmall facilities (less than 50 rooms): 29.4%Medium facilities (50 to 149 rooms): 46.9%Large facilities (more than 150 rooms): 23.7%
Sample mean: 110.4 roomsMean for chain-affiliated hotels: 133.2 roomsMean for independent hotels: 56.9 roomsCustomer profile:
Chain-affiliated hotels: 58.4% business andconference guests
Independent hotels: 43.3% business andconference guests

The generally low ranking of environ-mental concern expressed by hoteliersmay be interpreted as indicating a lowinterest in environmental issues among amajority of customers. One respondentfrom Sweden stated that if he had beenasked about the importance of hotel fea-tures three to five years earlier, he wouldhave ranked environmental issues as mostimportant because at that time environ-mental issues were generally treated withhigh priority. In contrast, a hotelier fromDenmark pointed out guests’apparent dis-interest: “In the period of five years whenwe worked with WWF, only two guestsshowed any interest in our environmentalprogram.” Thus, it appears that patronswho include sustainability criteria in theirdecision-making process remain a nicheclientele without sufficient purchasingpower to influence the industry. Accord-ing to a hotelier from Brussels: “Germantour operators are an exception to the
general lack of interest in tourism-environment relations.”
On the other hand, the study has in-dicated that if customers were to de-mand more environmentally sound per-formance from the hotel industry, thatwould likely effect a substantial change(Exhibit 3).32
After the prospects of reducing operat-ing costs, the demands of customersranked as the second-strongest incentivecapable of encouraging hoteliers to under-take more environment-friendly activities.The desire to improve the image of thefacility was in third place, followed by thewill to diminish environmental damage.Due to customers’ apparent indifference,hoteliers are currently assigning eco-friendliness a low priority in their market-ing efforts. If clients do not look for or askabout a hotel’s environmental aspects,those aspects are not marketing assets.However, some case studies show that
MAY 2005 Cornell Hotel and Restaurant Administration Quarterly 193
EUROPEAN HOTELIERS’ ENVIRONMENTAL ATTITUDES EUROPE
0
1
2
3
4
5
6
Location Quality ofservices
Price Tradition ofthe hotel
Concern forthe
environment
Other
6-point Likert scale
0102030405060708090100
% of respondents
Chain and Affiliated, N=428; Likert scale Independent, N=182; Likert scale
Chain and Affiliated, N=428; % of respondents Independent, N=182; % of respondents
Exhibit 2:Features Advertised and Their Perceived Importance in Customer Decision Making

hotels continue to be interested in theenvironment,33 and it is conceivable thatthe trend of increased interest in environ-mental issues will continue.
Notably, recommendations from man-agement as an incentive to be more activein environmental issues ranked low. Norwas the availability of professional advicefound to be a sufficient incentive to en-hance eco-friendliness.
These findings have serious implica-tions for the prospects of introducing envi-ronmental sustainability into the hotelindustry. The study indicates two condi-tions that need to be fulfilled. First, thecost savings associated with environment-oriented initiatives must be widely dem-onstrated within the sector. Second, thereis a need to raise awareness of and initiateor create demand for “green” alternativesamong the customers. One Swedish re-
spondent stated that the customer demandis “already there,” but the point raised byan Italian respondent seems to be morerealistic: “The general public as a whole isnot ready for such a big step [into moreenvironment-oriented behavior and prac-tices], which is absolutely necessary to en-sure a decent future for our children. Atthe moment too much influence and atten-tion is given to the monetary perspective,which does not consider the environmen-tal factors [costs and externalities] at all.Descriptions of trips and journeys solddaily by travel agencies can serve as ex-amples [of lack of interest in environ-mental issues].”
Some of the actions that need to betaken on the way to greater sustainabilityof the hotel sector will be presented belowin the section on future challenges.
194 Cornell Hotel and Restaurant Administration Quarterly MAY 2005
EUROPE EUROPEAN HOTELIERS’ ENVIRONMENTAL ATTITUDES
3,58
4,23
2,82
3,57
4,54,61
5,39
4,2
2,52
3,74
2,63
4,374,53
5,35
0
1
2
3
4
5
6
Reducingoperational costs
Improving thehotel image
Recommendationsof management
Availability ofprofessional
advice
io
p-7i
L tn
s treklace
Chain and Affiliated, N=428 Independent, N=182
Demands fromcustomers
Diminishingenvironmentalimpacts of the
hotel
Marketing asset
Exhibit 3:Incentives to Introduce More Environment-Friendly Initiatives

The Influence of Hotelson the Environment
Nearly all respondents answered thatthey were aware that hotel facilities had aninfluence on the natural environment(98.2 percent among chain hotels and 97.3percent among the independent establish-ments). The belief expressed by most ofthe respondents, namely, that the impactwas medium to substantial, coincides withthe outcome of past scientific investiga-tions (Exhibit 4).34
Some respondents questioned the scaleof hotels’ negative impact on the environ-ment (“The influence of our hotel on theenvironment is both negative and posi-tive”; “It hadn’t occurred to me that a hotelmay have a larger negative environmentalimpact than a house. The only negativeaspect that was obvious to me was that
hotels attract tourists and thus are, in away, responsible for the improper behav-ior of guests”) or relating the magnitude ofimpacts to size and location of the facility(“We are not a large hotel having crowdsof guests and producing tonnes of waste”;“Our impacts are non-significant as we area small hotel”; and “City centre hotels inlarge towns have small or non-significantimpacts, while medium impacts occur inthe case of big leisure resorts”).
Some respondents doubted the need forhotels to be eco-friendly. Said the repre-sentative of marketing department in ahotel belonging to large chain: “Eventhough the environment is important forme personally, so far no one has done any-thing more than comply with basic legalrequirements to make the hotel moreenvironment-friendly.”
MAY 2005 Cornell Hotel and Restaurant Administration Quarterly 195
EUROPEAN HOTELIERS’ ENVIRONMENTAL ATTITUDES EUROPE
24,1 17,6
5756
17,123,6
0,9 2,2
0%10%20%30%40%50%60%70%80%90%
100%
Chain and Affiliated, N=428 Independent, N=182
%f
o er sp
ed
no
tn
s
Significant / Large Medium Non-significant/small There is no influence
Exhibit 4:The Magnitude of the Hotel’s Influence on the Natural Environment (Hoteliers’Perception)

Despite the above comments, whenasked whether their establishment wasconcerned about environmental issues, aclear majority of hoteliers (86.6 percent)answered affirmatively. On the otherhand, a number of respondents (mainlyfrom independent establishments) raisedthe cost-related issue of becoming “green”and environmentally responsible (Exhibit5). Some hoteliers fear that the road toenvironmental sustainability may be pro-hibitively expensive, especially in view ofthe current market fluctuations, as wellas decreasing profits (due to wars, healthrisks, and a general downturn in theeconomy).
One respondent highlighted the needfor a more adequate promotion of environ-mentally certified establishments. Hesaid, “Information about eco-certificatesowned by the hotel should be displayed inhotel catalogues and directories, cityguides, and booking and travel agencies.”
This information could be especially valu-able in view of the fact that only 1 percentof European accommodation facilities arecurrently eco-labeled.35 Relevant environ-mental training and an increased aware-ness among the general public is, there-fore, essential.
Environmental Knowledgeand Information
Knowledge of activities to initiate more“green” hotels seemed to be slightly morewidespread among the hoteliers repre-senting chain establishments (63.3 per-cent positive answers, as compared to 56.1percent from independent hotels).
On the other hand, the study indicated akey difference between the two types ofestablishments investigated. Hotelierswere asked whether they are aware of anyinstitutions (national or international) thatdeal with environmental issues in the hotelindustry, by producing guidelines, offer-
196 Cornell Hotel and Restaurant Administration Quarterly MAY 2005
EUROPE EUROPEAN HOTELIERS’ ENVIRONMENTAL ATTITUDES
Exhibit 5:Independent Hoteliers’ Opinions about Financial Aspects of “Greening” the Facility
“It is too expensive to install energy- and water-efficient equipment.”“Our [limited] financial resources have significant influence on type and scale of
proecological initiatives undertaken.”“Proecological initiatives are too expensive, although profitable in the long run.
That is why in well-organized countries there are special financial schemesavailable, such as grants, loans, tax reductions, and other economic incentives.These are obviously economic aspects that play a decisive role in the decision-making process [concerning environment-oriented solutions].”
“It is important to analyze whether financial resources available to hoteliers aresufficient to undertake otherwise important environment-related initiatives.The environmental awareness of local authorities (especially in the rural areas)is often low, and they have limited budgets. In addition, the application proce-dures for the EU funds are complex and still perceived as unobtainable forsmall enterprises. As a result, hotel companies need to find their own capital.Such a situation concerns countries with relatively low environmental aware-ness and low income (including hotel turnover) [such as Poland and othercountries of the former Eastern Block, now the new members of the EuropeanUnion].”

ing advice, and awarding certificates.More than half (51.4 percent) of the re-spondents from chain-affiliated establish-ments declared knowing of such institu-tions, compared to only 24.2 percentamong the independent facilities. It is
interesting to analyze what types of insti-tutions were mentioned by the respon-dents (Exhibit 6).
By far, the most mentioned organiza-tion is Nordic Ecolabeling-SIS Miljö-markning, which issues the Nordic Swan
MAY 2005 Cornell Hotel and Restaurant Administration Quarterly 197
EUROPEAN HOTELIERS’ ENVIRONMENTAL ATTITUDES EUROPE
Exhibit 6:Organizations Dealing with Environmental Issues Known to Hoteliers
Chain-affiliated respondents (organization—number of mentions)National tourism and hotel associations: Swedish Hotel Association (SHR)—11;
DEHOGA—4; Scottish Tourism Board—3; Swiss Hotel Association—2;HORESTA—1, other—17
International hotel and tourism organizations: International Hotel & RestaurantAssociation (IH&RA)—11; International Hotel Environmental Initiative (IHEI)—10; World Travel and Tourism Council—1
General environmental organizations: The Natural Step—20; WWF—9; UNEP—1National and local governments and NGOs—26Chains and associations: Accor—9; Radisson SAS—7; Best Western—6; Sweden
Hotels—6; Hilton/Scandic—4; Svenska Kursgårdar—4; other—5International standardization institutions: ISO—16; EMAS—2; other—3General eco-labeling organizations:a Nordic Swan—70; KRAV—19; EU Flower—5;
other—1Hotel- and tourism-oriented certification institutions: The Green Key—4;
Hospitable Climates—4; Green Globe 21—3; Ecotel—2; Vihreä Hotelii—2;other—8
Independent respondents (organization—number of mentions)National tourism and hotel associations: Ekotourismföreningen—2; SHR—1;
Turism for Alla—1International hotel and tourism organizations: IH&RA—1General environmental organizations: Greenpeace—1National and local governments and NGOs—2Chains and affiliations: Svenska Kursgårdar—3; Scandic—1International standard institutions: ISO—7; EMAS—3General eco-labeling organizations:a Nordic Swan—17; KRAV—3; EU Flower—2Hotel- and tourism-oriented labeling institutions: Green Globe 21—3; The Green
Key—1; Green Hotel—1
Note: DEHOGA = Deutscher Hotel- und Gaststättenverband; HORESTA = Hotel-, Restaurant-, andTuristhvervet (Danish Association of the Hotel, Restaurant and Tourism Industry); WWF = WorldwideFund for Nature/World Wildlife Fund (in United States and Canada); UNEP = United Nations Environmen-tal Program; ISO = International Organization for Standardization; EMAS = Eco-Management and AuditScheme.a. The Swan (Nordic Swan, Svanen)—the official Nordic eco-label introduced in 1989 by the Nordic Coun-cil of Ministers, available for approximately sixty product groups in Denmark, Finland, Iceland, Norway,and Sweden (including hotels and youth hostels). More information available at www.svanen.nu. KRAVlogo—label for organically produced goods, in accordance with KRAV standards or International Federa-tion of Organic Agriculture Movements Basic Standards, as well as the European Council regulation EEC/2092/91. More information available at www.krav.se. EU Flower eco-certificate was not available forhotels at the time of the survey.

eco-label (87 votes—in Sweden alone, 82out of 225 hotel managers participating inthe study mentioned it). The popularity ofanother high vote getter—the Natural Stepprogram—could be explained by the factthat one of the responding chains based itsenvironmental program on the program’s4-Step principle.36 The environmental ini-tiatives within chains and associationshave been noticed by the unaffiliated hote-liers, but the low awareness of the eco-labels for the hotel industry among theindependent hoteliers indicates lack ofpromotion. Along that line, organizationsdevoted to disseminating environment-related information within the hotel sec-tor, such as IHEI and IH&RA’s GreenHotelier initiative, are barely knownamong the chain hotel managers and al-most completely unknown among the in-dependent hoteliers. Even the initiativesof local governments and NGOs arefamiliar only to large and chain-associatedhotels.
This particular finding indicates that theenvironmental institutions and govern-ments that want to promote environment-friendly and sustainable policies need tofocus more on and intensify their efforts ininforming and reaching unaffiliatedhotels. They should also continue to dis-seminate information among the brand-associated establishments. A number ofpossible ways to achieve this goal will bepresented later.
Areas ofEnvironmental Activities
Despite the existing limitations, betterthan eight out of ten hoteliers in bothgroups (85.7 percent of affiliated man-agers and 81.9 percent of unaffiliatedrespondents) declared that they wereinvolved in some type of environment-oriented activities. More than 40 percentof the chain-hotel managers declared hav-
ing an environmental policy statement intheir business policy, while among theindividually managed facilities, only 18percent responded positively. Environ-mental officers are also more frequentlyobserved among the staff of chain hotels(35.5 percent of respondents). Only 13percent of respondents from the indepen-dent hotel sample declared having a per-son appointed for environmental issues.These two findings show that environ-mental commitment at a corporate level islikely to induce responsible behavior atindividual facilities. This, however,depends on the strength of the linkbetween the mother company and individ-ual facilities, as has been indicated else-where in the example of franchised facili-ties versus hotels with managementcontracts.37 On the other hand, in small,unaffiliated hotels it is more probable thatall members of the staff are assignedcertain environment-oriented duties.
In terms of declared involvement ingeneral proecological initiatives, the dif-ferences between the two types of estab-lishments are negligible and could beattributed to statistical error or samplebias. It has been estimated that roughly 75percent of the environmental impactrelated to the lodging industry originatesfrom the consumption of nondurablegoods (and consequent waste generation),as well as the use of energy and water.38
The activities undertaken by respondinghoteliers to address each of those issuesvary substantially. It is likely that some ofthe differences are a result of local lawsand regulations, local conditions, corpo-rate policy, the level of management’senvironmental awareness, and the estab-lishment’s financial state. Furthermore, inmany cases, the division of hotel owner-ship, operation, and management amongdifferent stakeholders is an additional bar-rier to implementing environmentally re-
198 Cornell Hotel and Restaurant Administration Quarterly MAY 2005
EUROPE EUROPEAN HOTELIERS’ ENVIRONMENTAL ATTITUDES

sponsible business practices. In the case ofthe hotel operator-manager who subletsthe building on a fixed monthly rent, re-gardless of water and energy quantitiesconsumed, neither the building owner northe operator may have enough incentive toinvest in energy- or water-saving mea-sures. On the other hand, possessing atime-limited contract may discourage ahotel operator from making any unnec-essary investments.
In total, more than 70 percent of therespondents in both groups declared thatthey had implemented energy- and water-saving activities, as well as responsiblewaste management (Exhibit 7). Theslightly higher interest and involvement inall types of activities displayed by the rep-resentatives of the chain hotels could beattributed to the existence of a corporateenvironmental policy and action plansamong chain establishments, as well as
the availability of more extensive financialresources.
It is, however, crucial to note that somehoteliers perceive sanctioning measuresimposed on them by law and local stan-dards (e.g., the separation of waste) asbeing enough to make their facility envi-ronmentally responsible, as another Euro-pean study revealed.39 The same study alsofound that for some of the hoteliers, theidea of efficient equipment was equivalentto “new” equipment. Similarly, appliancesand products with the words “eco-” or“bio-” in the name, as stated by manufac-turers but not necessarily confirmed by anofficial certificate, are often treated asenvironmentally sound.
Future ChallengesCorporate environmental and social
commitment is increasingly expectedfrom companies worldwide. This study
MAY 2005 Cornell Hotel and Restaurant Administration Quarterly 199
EUROPEAN HOTELIERS’ ENVIRONMENTAL ATTITUDES EUROPE
77,5 73,1 74,7
8280,881,5
0102030405060708090
100
Energy conservation Water conservation Responsible wastemanagement
% ofrespondents
Chain and Affiliated, N=428 Independent, N=182
Exhibit 7:Fields of Activities Undertaken by Hoteliers

indicates that certain changes need to bemade within the hotel industry to achievean environmentally sustainable perfor-mance. There are two major directionsthat need to be followed. First, environ-mentally sound practices need to be incor-porated into the hotel industry. Second,customers’ environmental awarenessneeds to increase so that guests issue agreater demand for “green” practices.
Hotel establishments need to con-tinue incorporating ecological initiatives,such as energy- and water-saving mea-sures, green purchasing, and waste-minimization practices. It has alreadybeen documented that these activitiesresult in cost savings.40 However, toachieve more environmentally respon-sible behavior in the hotel sector, it isnecessary to further demonstrate the costsavings associated with such practices.Cost-benefit analyses should, therefore,be performed and the findings widely dis-seminated, and new or less expensivetechnologies should be developed to facil-itate the process. Hoteliers and representa-tives of academe could cooperate in thisarea by preparing successful case studies,as well as developing new solutions.Information about best practices shouldbe disseminated among the industry rep-resentatives in the form of publishedmaterials, seminars, and interactive pre-sentations and programs.
Governments should become involvedby providing incentives for the industryto adopt environmentally sound prac-tices. Certain financing schemes, createdspecifically for the promotion of moreenvironment-friendly, sustainable build-ing practices, exist all around the world.While these schemes may not focus exclu-sively on the tourism industry, tourism-related facilities are included. The instru-ments available include “green financing”
and “green investment” schemes initiatedby governments to attract funding atreduced interest rates. Banks operatinggreen-investment funds can offer loans atbelow-market interest rates that are never-theless attractive to investors. Further-more, there is a growing pool of trusts thatinvest in companies that espouse ethicalpolicies and practices and also operate incooperation and agreement with localcommunities. One of the examples is theJupiter International Group PLC, a subsid-iary of Germany-based Commerzbank.41
This institution offers green financing tocompanies worldwide within the frame-work of Jupiter Green, which includesthree distinct funding schemes: JupiterEcology Fund, Jupiter EnvironmentalOpportunities Fund, and Jupiter GlobalGreen Investment Trust. In the UnitedStates institutions offering green fundinginclude Fannie Mae, Bank of America,ShoreBank Pacific, and CommunityDevelopment Financial Institutions.42
Trade associations, in cooperation withenvironmental organizations and hotelcompanies, should develop and offer spe-cial training courses for the hospitalitysector. All staff members at individualfacilities should be encouraged to partici-pate in such courses.43 If national or localtourism and hotel organizations do notoffer educational or advisory services,representatives of the industry should putpressure on them to do so. Together, theycan also influence local or national author-ities to adapt existing regulations to pro-tect environmental quality to a greaterextent, for example, by including certainenvironmental requirements in the hotelstandardization procedures. Environmen-tal organizations should focus their effortson reaching independent establishments,which typically lack professional help andsufficient funding.
200 Cornell Hotel and Restaurant Administration Quarterly MAY 2005
EUROPE EUROPEAN HOTELIERS’ ENVIRONMENTAL ATTITUDES

Hoteliers can also participate in theprocess of enlightening customers, raisingtheir environmental awareness and creat-ing demand for “green” alternatives.44 Oneof the ways to achieve this is to promoteand advertise the hotel’s environmentalcommitment. Environmental activitiesundertaken at the facility should be clearlyvisible to the customer. Moreover, theguest should be invited to participate inthem. This will create awareness of theexisting alternatives and is likely to resultin greater demand for such solutions.
To facilitate the customer decision-making process, hoteliers can apply foreco-labels. This type of certification hasthe potential of becoming a valuable mar-keting tool to reach environmentally con-scious travelers. While it need not be anymore costly to operate a facility in an en-vironmentally responsible way, evidenceexists that some travelers would actuallybe willing to pay a premium for the privi-lege of staying in a “green” facility.45
Irrespective of whether this is based ongenuine environmental concern or ontrendiness, this market still remains apotentially untapped marketing asset.
Even without applying for the actualeco-label, eco-labeling criteria can actu-ally be used as guidelines for how toimprove the environmental performanceof a hotel. When a sufficient number ofimprovements are achieved, a hotel couldthen apply for formal certification.
All the above-mentioned measureshave the potential to create an environ-mentally sustainable hotel sector. My sur-vey results have shown that Europeanhoteliers are increasingly focusing onenvironmental protection and realizingthat protecting the environment meansprotecting the business.
Endnotes
1. Ten hotels were audited by the Institut fürEnergiewirtschaft und Rationelle Energiean-wendung (IER) in February 2000. See HubertDespretz, Green Flag for Greener Hotels, finalreport, LIFE No. ENV/00038/FR (Valbonne,France: European Community, 2001), 35.
2. See Horwath International and Smith Travel Re-search, Worldwide Hotel Industry Study 1998(New York: Horwath International, 1999);PricewaterhouseCoopers, “European HotelsImplementation of Environmental Policies,”PricewaterhouseCoopers Hospitality Direc-tions—Edition Europe (London: Price-waterhouseCoopers, July 2001); Mike J.Stabler and Brian Goodall, “EnvironmentalAwareness, Action and Performance in theGuernsey Hospitality Sector,” Tourism Man-agement 18, no. 1 (1997): 19-33; APAT (ItalianNational Agency for the Protection of the Envi-ronment and for Technical Services), TouristAccommodation EU Eco-Label AwardScheme, final report (Rome: Italian NationalAgency for the Protection of the Environmentand for Technical Services, 2002); MichaelOlsen, Jinlin Zhao, Amimt Sharma, Jeong-GilChoi, Leading Hospitality into the Age of Ex-cellence: Expansion, Competition and Visionin the Multinational Hotel Industry 1995-2005(Paris: International Hotel & Restaurant Asso-ciation, 2000); and Despretz, Green Flag forGreener Hotels.
3. Ibid.4. World Tourism Organization (WTO), Tourism
Highlights 2003 (Madrid, Spain: WTO, 2003),3.
5. APAT, Tourist Accommodation EU Eco-LabelAward Scheme, 12-13; Olsen et al., LeadingHospitality into the Age of Excellence, 48.
6. WTO, Tourism Market Trends—2003 Edition,World Overview and Tourism Topics (Madrid,Spain: WTO, 2004), 11.
7. Stabler and Goodall, “Environmental Aware-ness, Action and Performance in the GuernseyHospitality Sector,” 19-33; Despretz, GreenFlag for Greener Hotels; APAT, Tourist Ac-commodation EU Eco-Label Award Scheme;and Consultancy and Research for Environ-mental Management—CREM and CH2M-HILL, Feasibility and Market Study for a Euro-pean Eco-Label for Tourist Accommodations
MAY 2005 Cornell Hotel and Restaurant Administration Quarterly 201
EUROPEAN HOTELIERS’ ENVIRONMENTAL ATTITUDES EUROPE

(FEMATOUR) (Amsterdam: CREM Projectno. 00.402, commissioned by the EuropeanCommission DG ENV, 2000), 23-31.
8. The share for the world is 20 percent, while forthe United States, the share is 70 percent. SeeWorld Travel & Tourism Council, InternationalFederation of Tour Operators, InternationalHotel & Restaurant Association, InternationalCouncil of Cruise Lines, and United NationalEnvironmental Program (UNEP), Industryas a Partner for Sustainable Development—Tourism (London: Beacon, 2002), 33. SeeColin Johnson and Ray F. Iunius, “Competingin Central Eastern Europe: Perspectives andDevelopments,” International Journal of Hos-pitality Management 18 (1999): 245-60; andAPAT, Tourist Accommodation EU Eco-LabelAward Scheme, 12.
9. Karen Astbury, Sabine Balzer, and CosimaMerck, Jones Lang LaSalle Hotels DigestEurope, vol. 5 (London: Jones Lang LaSalleHotels, 2003), 33.
10. For instance, environmental policy, educationalprogram, and environmental reporting tools forHilton were developed based on the experi-ence from a Scandinavian Scandic chain. SeePaulina Bohdanowicz, Branko Simanic, andIvo Martinac, “Environmental Training andMeasures at Scandic Hotels, Sweden,” in Pro-ceedings of the BEST Sustainable TourismThink Tank IV: Sustainability and Mass Desti-nations: Challenges and Possibilities (Esbjerg,Denmark, July 1-4, 2004); and PaulinaBohdanowicz, Branko Simanic, and IvoMartinac, “Environmental Education atScandic Hotels—Approach and Results,” inProceedings of Sustainable Building 2004—Regional Central and Eastern European Con-ference on Sustainable Building (Warszawa,Poland, October 27-29, 2004).
11. Energy Efficiency Office (EEO), Introductionto Energy Efficiency in Hotels (Garston, UK:Energy Efficiency—Best Practice Programme,Department of the Environment, BRESCU1994), 5, 24; and Wilco W. Chan and Joseph C.Lam, “Prediction of Pollutant Emissionthrough Electricity Consumption by the HotelIndustry in Hong Kong,” Hospitality Manage-ment 21 (2002): 381-91.
12. CHOSE, Energy Savings by Combined HeatCooling and Power Plants (CHCP) in the HotelSector (Stockholm, Sweden: Report of theCommission of the European Communities,
Directorate General for Energy, Contract no.XVII/4.1031/Z/98-036, May 31, 2001), 6-8.
13. Emission factors for coal taken from VolkerQuaschning, Regenerative Energiesysteme(Munich, Germany: Carl Hanser Verlag, 2003).
14. Constantinos S. Verginis and Roy C. Wood,eds., Accommodation Management: Per-spectives for the International Hotel Industry(London: Tourism and Hospitality Manage-ment Series, International Thomson Business,2001), 131.
15. Radisson SAS, Responsible Business Report2002 (Brussels: Radisson SAS Hotels & Re-sorts, 2002), 8-9.
16. Scandic Hotles AB, Annual Report 1999(Stockholm: Scandic Hotels AB, 2000), 14.
17. Wayne H. Smith, Marie S. Hammer, and Jo M.Townsend, EcoPurchasing Guide for Hotelsand Motels (Gainesville: University of Florida,1993), 8; Linnea Smith-Jessup, “Hoteliers andPlanners Become Ecologically Sensitive,” Go-ing Green 1998, www.meetingsweb.com (ac-cessed January 26, 2001); and InternationalHotel Environmental Initiative (IHEI), HotelsCare: Community Action and Responsibilityfor the Environment (London: InternationalHotel Environmental Initiative, 2002), 103.
18. Radisson SAS, Responsible Business Report2002, 8-9.
19. Scandic Hotels AB, Annual Report 1999, 14.20. Sånga Säby Course & Conference:
Miljöredovisning 2002 (Environmental Report2002) (Svartsjö, Sweden: Sånga Säby Kurs &Konferens, 2003), 15.
21. International Hotel Environmental Initiative,Environmental Management for Hotels(Oxford, UK: Butterworth-Heinemann, 1993);International Hotel & Restaurant Association(IH&RA), International Hotel EnvironmentalInitiative (IHEI), UNEP, Environmental ActionPack for Hotels: Practical Steps to Benefit YourBusiness and the Environment, UNEP Industryand Environment Technical Report 31 (Paris:IH&RA/London: IHEI/Nairobi: UNEP, 1995);UNEP and IH&RA, Environmental GoodPractice in Hotels: Case Studies from the Inter-national Hotel and Restaurant Association En-vironmental Award, Green Hotelier (Paris:United Nations Environmental Program andInternational Hotel and Restaurant Associa-tion, 1997); Hotell-, Restaurnagföretagen ochMiljö (Hotels, Restaurants and the Environ-ment) (Stockholm, Sweden: Sveriges Hotell
202 Cornell Hotel and Restaurant Administration Quarterly MAY 2005
EUROPE EUROPEAN HOTELIERS’ ENVIRONMENTAL ATTITUDES

och Restaurangföretagare, 1999); and HélèneGenot, Nicola Pogson, Philippe François, andGiulia Carbone, Sowing the Seeds of Change—An Environmental Teaching Pack for the Hos-pitality Industry (Paris: EUHOFA, IH&RA,UNEP, 2001).
22. The Environment Guide for Hotel Managers(Paris: Accor Group, 1998); Understandingand Managing Water, Energy and Waste atYour Hotel (Paris: Accor Group, 2003). Alsosee Bohdanowicz, Simanic, and Martinac,“Environmental Training and Measures,” and,Bohdanowicz, Simanic, and Martinac, “Envi-ronmental Education at Scandic Hotels,” for adiscussion of interactive environmental training,in the form of Scandic’s “Kunskapsportalen” andHilton “Eco-Learning” www.hiltonecolearning.com; and Jan Peter Bergkvist, “Hilton’s Envi-ronmental Training Campaign,” Green Hote-lier 33 (2004): 11.
23. UNEP and IH&RA, Environmental Good Prac-tice in Hotels; Cathy Enz and Judy Siguaw,“Best Hotel Environmental Practices,” CornellHotel and Restaurant Administration Quar-terly 40, no. 5 (October 1999): 72-77; andOshani Perera, Stephen Hirsch, and Peter Fries,Switched On—Renewable Energy Opportuni-ties in the Tourism Industry (New York: UnitedNations Environmental Program Publication,2003).
24. Despretz, Green Flag for Greener Hotels, 35.25. Paulina Bohdanowicz, A Study of Environmen-
tal Impacts, Environmental Awareness andPro-Ecological Initiatives in the Hotel Industry(Stockholm, Sweden: Royal Institute of Tech-nology, December 2003).
26. Hotel chains investigated were Accor, RadissonSAS, Rica, Scandic/Hilton, and Rocco Forte.The associations were Countryside Hotels,Romantik Hotels, Ditt Hotell, Software Hotels,Design Hotels, Concorde Hotels, Elite Hotels,Leading Hotels of the World, Best Western,First Hotels, Choice Hotels, Sweden Hotels,Svenska Kursgårdar, and Scan+.
27. The survey questionnaire comprised twenty-two multiple-choice questions, occasionallysupplemented by open-ended follow-up com-ments for clarification. Two of the questionsrequired the respondents to rank their answersusing a 6- or 7-point Likert-type scale of impor-tance (1 = the least important, 6 or 7 = the mostimportant). It was prepared in English, Swed-ish, Polish, German, and Portuguese.
28. During the first two phases, a follow-up re-minder was sent to each nonrespondent period-ically (approximately every two to threeweeks). In the third round, the environmentaldirector of one of the chains was asked for sup-port in distributing questionnaires amongSwedish chain representatives.
29. See Diego Medina-Munoz and Juan ManuelGarciá-Falcon, “Successful Relationships be-tween Hotels and Agencies,” Annals of Tour-ism Research 27, no. 3 (2000): 737-62.
30. Surveys performed in Denmark (1996), Ger-many (1999 and 2000), and Italy (2000) sug-gest that customers do not perceive “gray”environmental characteristics of accommoda-tions (such as water and energy savings) as im-portant selection criteria. In contrast, the“green” environmental aspects (natural charac-teristics, rural ambience, presence of water andforests); aspects related to health, safety, peaceand quiet; and quality of air, water, and sur-roundings (including absence of litter) rank rel-atively high on the decision-making agenda.Nevertheless, depending on the way of com-municating these aspects, consumers do appre-ciate and value these features positively oncethey are at the destination or accommodation. Itis further believed that this may lead to anincreasing demand for green alternatives. SeeConsultancy and Research for Environmen-tal Management—CREM and CH2M-HILL,Feasibility and Market Study for a EuropeanEco-Label for Tourist Accommodations(FEMATOUR).
31. Hoteliers were asked to indicate the most com-monly advertised hotel features and to rank theaspects they believed to have the highest influ-ence on the customer’s choice of the facility.The question regarding features advertised re-quired a yes-no answer, while in a subsequentquestion respondents were asked to rank thefeatures according to their importance using a6-point Likert-type scale. Unfortunately, notall questionnaires completed included suchranking. A number of features were commonlygiven the same mark, or a yes-no scheme wasused. The previous outline was unchanged inthe evaluation, while in the case of a yes-noanswer all features indicated were assumed tohave the highest priority, and were all given themark 6. For the purpose of analysis, the meanvalue has been calculated.
MAY 2005 Cornell Hotel and Restaurant Administration Quarterly 203
EUROPEAN HOTELIERS’ ENVIRONMENTAL ATTITUDES EUROPE

32. The hoteliers were asked to rank the incentivescapable of encouraging them to undertake en-vironmentally oriented initiatives according totheir importance, using a 7-point Likert-typescale. Similar problems were encountered aswith the other question that used Likert-typescale ranking, and same solution was applied.For the purpose of analysis, the average wascalculated.
33. Enz and Siguaw, “Best Hotel EnvironmentalPractices,” 72-77; Smith-Jessup, “Hoteliersand Planners Become Ecologically Sensitive”;Ivo Martinac, Hans Murman, and AlexanderLind af Hageby, “Energy-Efficiency and Envi-ronmental Management in a Swedish Confer-ence Facility—Case Study: Sånga-SäbyCourses & Conferences,” in Proceedings ofPLEA 2001—The 18th Conference on Passiveand Low Energy Architecture (Florianópolis,Brazil, November 7-9, 2001), 325-29; andSånga Säby Course & Conference,Miljöredovisning 2002, 15.
34. APAT, Tourist Accommodation EU Eco-Label Award Scheme, 28; and C. A. Balaras,“Editorial,” Xenios Newsletter, no. 1 (January2003).
35. APAT, Tourist Accommodation EU Eco-LabelAward Scheme, 44.
36. Bohdanowicz, Simanic, and Martinac, “Envi-ronmental Training and Measures.”
37. Paulina Bohdanowicz and Ivo Martinac, “Atti-tudes towards Sustainability in Chain Hotels—Results of a European Survey,” in Proceedingsof the CIB International Conference on Smartand Sustainable Built Environment—SASBE2003 (Brisbane, Australia, November 19-21,2003).
38. APAT, Tourist Accommodation EU Eco-LabelAward Scheme, 28.
39. Despretz, Green Flag for Greener Hotels, 31-32, 37.
40. UNEP and IH&RA, Environmental Good Prac-tice in Hotels; Enz and Siguaw, “Best HotelEnvironmental Practices,” 72-77; Martinac,Murman, and Lind af Hageby, “Energy-Efficiency and Environmental Management ina Swedish Conference Facility,” 325-29; andBohdanowicz, Simanic, and Martinac, “Envi-ronmental Training and Measures.”
41. Jupiter Green, www.jupiteronline.co.uk (ac-cessed August 31, 2004).
42. U.S. Department of Energy, Green Develop-ment Financing, Smart Communities Net-work—Creating Energy Smart Communities,www.sustainable.doe.gov/greendev/finance.shtml (accessed August 23, 2004).
43. This education could be arranged in the form ofinteractive computer program as is the case atScandic and Hilton hotels. See Bohdanowicz,Simanic, and Martinac, “Environmental Train-ing and Measures”; Bohdanowicz, Simanic,and Martinac, “Environmental Education atScandic Hotels”; and Bergkvist, “Hilton’sEnvironmental Training Campaign,” 11.
44. “How Hotels Can Influence Consumer Behav-iour,” Green Hotelier 20 (2000), 11-13.
45. Pamela A. Wight, “Ecotourism Accommo-dation Spectrum: Does Supply Match the De-mand?” Tourism Management 18, no. 4 (1997):209-20; and Bohdanowicz, A Study of Environ-mental Impacts, Environmental Awareness andPro-Ecological Initiatives in the Hotel Indus-try, 158-59.
Paulina Bohdanowicz, M.Sc., is on the facultyof Energy Technology at the Royal Institute ofTechnology ([email protected]; [email protected]). Theauthor would like to acknowledge financial sup-port from Statens Energimyndighet (SwedishEnergy Administration), the hoteliers who dedi-cated their time to participate in this survey, Pro-fessors Michael Sturman and Ivo Martinac, twoanonymous reviewers for valuable commentsand insights into the topic, and Anita Elksne andSandra Brunsberg for the proofreading of thismanuscript.
204 Cornell Hotel and Restaurant Administration Quarterly MAY 2005
EUROPE EUROPEAN HOTELIERS’ ENVIRONMENTAL ATTITUDES

Paper IV

ARTICLE IN PRESS
Hospitality Management ] (]]]]) ]]]–]]]
0278-4319/$ -
doi:10.1016/j
�Tel.: +46
E-mail ad
URL: htt
www.elsevier.com/locate/ijhosman
Environmental awareness and initiativesin the Swedish and Polish hotel
industries—survey results
Paulina Bohdanowicz�
Sustainable Building Systems, Department of Energy Technology, Royal Institute of Technology,
Brinellvagen 66, 100 44 Stockholm, Sweden
Abstract
Despite its importance, environmental stewardship is not always the top priority in the hotel
industry in Europe. This study investigates the influence of the geo-political, economic and
socio-cultural context of a country on the environmental attitudes and pro-ecological
initiatives incorporated in this sector. To illustrate the differences, hotels in Sweden and
Poland were targeted and a total of 349 hoteliers participated in an e-mail-based survey. The
study reveals that hotel operators generally recognize the need for environmental protection
and are involved in a number of activities. The economic situation and pro-environmental
efforts initiated by the government were found to have an impact on certain aspects of
hoteliers’ attitudes and actions. The survey has further indicated the two major directions that
need to be followed when introducing environmental sustainability into the hotel industry.
The first involves incorporating responsible technical and behavioural practices in the sector.
The second highlights the necessity of initiating greater demand for ‘‘green’’ practices from the
customers.
r 2005 Elsevier Ltd. All rights reserved.
Keywords: Hotels; Environmental awareness; Environmental initiatives; Survey; Poland; Sweden
see front matter r 2005 Elsevier Ltd. All rights reserved.
.ijhm.2005.06.006
8 790 76 82; fax:+46 8 20 41 61.
dresses: [email protected], [email protected].
p://www.greenthehotels.com.

ARTICLE IN PRESS
P. Bohdanowicz / Hospitality Management ] (]]]]) ]]]–]]]2
1. Introduction
Conventional tourism is often associated with the availability of a clean naturalenvironment, while all sectors of this global industry create pressure on theenvironment. The hotel industry, due to its very specific function, operatingcharacteristics and services provided, consumes substantial quantities of energy,water and non-durable products. The resulting environmental impacts of hotelfacilities are thus characteristically greater than those caused by other types ofbuildings of similar size (Rada, 1996).
In recognition of environmental degradation, governments, along with the greenmovement within the hotel and tourism industry, and travellers, have becomeincreasingly aware of the need for more effective measures to protect theenvironment. In order to achieve noticeable improvement, hotel managers andoperators must be willing to act in an environmentally responsible manner. Theyalso need to have adequate knowledge of the environmental issues pertinent to theiractivities, and sufficient funds to implement state-of-the-art environmentally soundpractices.
In this respect, a hypothesis was put forward stating that environmental attitudesof hoteliers in different geo-political locations are expected to vary. In regions wherepreserving high environmental quality has long received considerable political andfinancial support, such as the Scandinavian countries, the general public andindustry representatives are expected to be involved in environmental practices. Bycontrast, in the countries of the former Eastern Block (Central and Eastern Europe),which faced many economic and socio-political problems after the system change,environmental issues have only recently gained the attention of the authorities.Generally, hoteliers from this region are thus likely to be less concerned about theprotection of nature per se, except for economic or legal reasons. The aim of thestudy reported in this article was to examine the empirical evidence relating to theabove hypothesis.
To the best of the author’s knowledge, few studies have focused on ecologicalinitiatives within the hotel industry (IHEI, 1993; IH&RA et al., 1995; Stabler andGoodall, 1997; Kulesza, 1999; Horwath International and Smith Travel Research,1999; CREM and CH2M-HILL, 2000; Despretz, 2001; Genot et al., 2001;PricewaterhouseCoopers, 2001; APAT, 2002; IHEI, 2002; Bohdanowicz, 2003;European Commission, 2003). Only a few of the above applications present theanalysis of environmental attitudes of hoteliers, while virtually none of them haveinvestigated regional variations based on the geo-political situation.
An attempt was thus made here to study the level of environmental knowledge andawareness among Swedish and Polish hotel managers. The prevalence of ecologicalinitiatives in daily operations was examined to evaluate the potential impact on theoperations of individual establishments of national sustainability policies and thegeneral level of environmental awareness in the country. Finally, the incentives thatwould encourage hoteliers to pursue environmentally oriented initiatives at theirhotels were identified. The results were analysed in the context of socio-culturaldifferences, as well as diversified economic situation in the countries investigated.

ARTICLE IN PRESS
P. Bohdanowicz / Hospitality Management ] (]]]]) ]]]–]]] 3
European countries (Sweden and Poland in particular) were investigated in thisstudy for a number of reasons. First, Europe has traditionally been a major tourismdestination and hotel market. It is visited by approximately 400 million internationaltourists annually (WTO, 2004), while the hotel market, estimated at 205 000 facilitiesand almost 10 million beds, represents half the global market (Olsen, et al., 2000;APAT, 2002). In 2002 Poland ranked ninth on the list of major European tourismdestinations, while Sweden scored below the top-20 ranking (WTO, 2004).
Second, more than 70 per cent of European hotels are independently owned andmanaged (Johnson and Iunius, 1999; APAT, 2002), which implies that managershave considerable freedom in operating their facilities, as compared to affiliatedestablishments, where environmental policies and initiatives are frequently developedat corporate level and maintained chain-wide. In the case of independently operatedfacilities, environmental concern and the willingness to act are strongly dependent onthe hotel manager’s attitude, knowledge and financial situation, see also Despretz,2001; Bohdanowicz and Martinac, 2003; Bohdanowicz, 2005. The Swedish and thePolish markets are both dominated by independently owned and managed facilities.
Third, significant cultural and social differences still exist between the memberstates in the European Union. Very different forces and mechanisms thus drive andcontrol the hotel markets in the individual countries. The hotel sectors in Swedenand Poland are good examples of the influence of appreciable socio-cultural andeconomic differences on the environmental attitudes of tourism operators.
2. Environmental pressures on the hotel markets in Sweden and Poland
With a total area of 450 000 km2 and a population of 9 million, Sweden is one ofthe largest countries in Europe, although not very densely populated (SCB, 2003).The Swedish Tourism Authority (STA) estimates the number of nights spent bytourists in commercial accommodation facilities at approximately 44 million in 2003(approximately 9.7 million were foreign visitors), while the total tourism expenditureamounted to US$ 21.07 billion (SEK 163.5 billion) (STA, 2004).
The successful marketing of Sweden as a tourist and conference destination hasresulted in a 40 per cent increase in accommodation demand during the 1990s, metby a 14 per cent increase in supply (STA, 2003). The hotel industry in Sweden is wellestablished, with 1976 hotels in operation in 2002 offering a total of 194 839 beds in99 267 rooms (STA, 2003). The Swedish market is dominated by independentlyowned and managed facilities, with only some 570–580 affiliated hotels (Capona,2002; Granhed and Andersson, 2003). A total of 21.1 million overnight stays wererecorded in hotels in 2003, at an average occupancy rate of 46 per cent (STA, 2004).
In recent years, the need for increased environmental concern has been among theleading themes in the Swedish hotel industry. A strategic action plan for thedevelopment of sustainable tourism in Sweden was prepared by the STA in 1998. Ayear later, SIS Miljomarkning introduced the Nordic Swan eco-label for hotelbusinesses. As of May 9, 2005, a total of 94 facilities have been certified incompliance with this scheme (Nordic Ecolabelling, 2005).

ARTICLE IN PRESS
P. Bohdanowicz / Hospitality Management ] (]]]]) ]]]–]]]4
Poland is the largest of the ten new EU-member countries. It has an area of322 577 km2, with a population of more than 38 million (GUS, 2004). In 2003, thenumber of foreign tourists (visitors who stayed in Poland for at least one night)amounted to 13.7 million ((INTUR, 2004), while the total tourism expenditurecorresponded to US$ 4.07 billion (INTUR, 2004).
Political stability and economic growth over the last decades, as well as the projectedmarket potential, have stimulated investment in the hospitality sector. Nevertheless, thehotel market in Poland is still relatively undeveloped compared to Western Europe.However, it is predicted to grow substantially over the next decade (Karczewicz, 2000).By the end of July 2002, 1070 hotels were operating in Poland, offering a total of 57 621rooms and 109 293 beds (GUS, 2003). In 2002, 19 international and national hotelcorporations were operating on the market (Witkowski, 2003).
Two major trends underway are the construction of two- and three-starproperties, and the renovation and improvement of the standard and quality ofservices in existing facilities (Hotelarz 3–5, 2003; Swiat Hoteli 5–7, 2003).Furthermore, the information technology (IT infrastructure) is widely introducedinto hotels and reservation systems.
While the 1997 ‘‘Constitution of the Republic of Poland’’ emphasizes the generalneed for sustainable development, to date no detailed environmental policy orprogrammes for the tourism sector have been developed. Nevertheless, environment-related issues are gaining in importance in the hotel industry.
3. Hotels and the environment
It has been estimated that 75 per cent of all environmental impacts created by thehotel industry can be attributed to the excessive consumption of local and importednon-durable goods, energy and water, followed by emissions released to air, waterand soil (APAT, 2002).
Swedish hotels consume, on average, 198–379 kWh of energy per square meter ofarea, depending on the location and services offered (CHOSE, 2001). The acceptableupper limits established by the Nordic Swan Ecolabel are 235–460 kWh/m2,depending on climatic conditions and services offered (Nordic Ecolabelling, 2002).In 2002, Swedish hospitality properties (hotels, restaurants, student dormitories)were estimated to consume 2.14 TWh of energy in the form of heating, cooling andelectricity (SEA, 2003). There are no data available on the exact amount of energyconsumed in Swedish or Polish hotels.
Water consumption depends on the type, standard and size of the facility, as wellas on the services and facilities offered, climate, irrigation needs, and existing waterconservation practices. Currently, there are no collective data for water use inEuropean hotels. A recent report from one of the European hotel chains provides afigure of 440 l/guest-night (Radisson SAS, 2003). Others report consumption of 224l/guest-night (Scandic Hotels AB, 2000). The water benchmark values suggested byInternational Hotels Environment Initiative (IHEI) at the beginning of the 1990swere in the range of 120–280 m3 per guest staying overnight per year (average daily

ARTICLE IN PRESS
P. Bohdanowicz / Hospitality Management ] (]]]]) ]]]–]]] 5
guests) for fairly efficient hotels and below 120–220 m3 for facilities with good waterefficiency, depending on the type and size of the hotel (IHEI, 1993). A more recentbenchmark value from IHEI states the quantity of water below 540 l/guest-night assatisfactory, and below 480 l/guest-night as excellent in the case of luxury hotels(IHEI, 2005), while the range of allowable water consumption according to NordicSwan is 200–300 l/guest-night (Nordic Ecolabelling, 2002).
Because hotels are large users of consumer goods, waste generation is probably themost visible effect the sector has on the environment. A typical hotel guest isestimated to produce at least 1 kg of waste per day (IHEI, 2002). A large proportion(50–60 per cent) of this waste could be recycled or reused (Smith et al., 1993). At1.5 kg/guest-night, the average quantity of unsorted waste in Scandinavian RadissonSAS hotels (data for 2002) scored appreciably below the chain-wide corporateaverage of 3.1 kg/guest-night (Radisson SAS, 2003). Scandic Hotels reported an evenlower average of 0.515 kg of unsorted waste per guest-night (Scandic Hotels AB,2000). Swedish best practice has shown that efficient waste management can reducethis volume to 50 g of unsorted waste per guest-night (Sanga Saby Course andConference (SSCC), 2003). The Nordic Swan eco-label, limits unsorted wastegeneration to 0.5–1.5 kg/guest-night (Nordic Ecolabelling, 2002).
The importance of high environmental quality for the development of tourism wasacknowledged by the WTO in the late 1970s with the establishment of theEnvironmental Committee. Following the 1992 Rio Earth Summit, which identifiedtourism as one of the priority areas for sustainable development, the greenmovements within the hotel industry gained momentum and recognition. Increas-ingly stringent environment-related regulations are now being adopted and enforcedin many parts of the world, including the EU. Hotel and tourism organisations andeven hotel companies are developing environmental guidelines, training programmesand publishing best practice case studies (IHEI, 1993; IH&RA et al., 1995; UNEPand IH&RA, 1997; Accor Group, 1998; SHR, 1999; Genot et al., 2001; Bergkvist,2004; Bohdanowicz et al., 2005). Pro-ecological initiatives are becoming increasinglypopular among hoteliers worldwide. Approximately 40 per cent of more than 3000respondents in a 1998 Horwath international hotel industry survey confirmed thatthey were using different quantitative measures of environmental performance (Vogl,1998). These measures included those relevant to energy and water consumption,waste generation and disposal, and the treatment of wastewater.
The pressure for improved environmental performance within hotels can thereforebe seen as driven by: the need to preserve the local environment, the opportunity toreduce operating costs, the enforcement by authorities of environmental regulationsand a growing demand for environmentally friendly hotels from Europeancustomers (CREM and CH2M-HILL, 2000; APAT, 2002).
4. Methodology
The various investigations on environmental attitudes in the hotel industryperformed prior to the study presented here do not provide any information on the

ARTICLE IN PRESS
P. Bohdanowicz / Hospitality Management ] (]]]]) ]]]–]]]6
differences between European countries from a West–East (or North-Central, or‘‘old EU’’–‘‘new EU’’) perspective. It was thus the scope of this research to focus onthose issues.
This study was conducted by sending an e-mail-based questionnaire to a total of1888 hotels in Poland (942) and Sweden (946). The facilities included represent 97.5and 61.0 per cent of the total hotel stock in Poland and Sweden, respectively(INTUR, 2002; Eiderbrant-Nilsson, 2002). The questionnaire was based on acomprehensive literature review and comprised 22 (23 for Sweden) multiple-choicequestions, occasionally supplemented by open-ended follow-up comment sections toallow for greater clarification (Bohdanowicz, 2003). Two of the questions requiredthe respondents to rank their answers using a 6- or 7-point Likert scale.
No pilot study was performed, and e-mail correspondence was used due to timeand financial constraints. The choice of individual establishments was thusinfluenced by the availability (on the Internet and in hotel directories) of relevante-mail addresses. The survey was performed in two stages: during the months ofOctober, November and December 2002, and in June 2003. A follow-up reminderwas sent to each non-respondent approximately every 2–3 weeks.
Three hundred and forty-nine correctly and completely filled-in returns werecollected before August 1, 2003, accounting for an effective response rate of 25.52per cent for Sweden and 16.51 per cent for Poland. The response rate, based on thetotal number of existing facilities in the population targeted, was 14.52 and 12.84 percent for Sweden and Poland, respectively. Version 12.0 of the SPSS program wasused for the statistical evaluation of the data.
While being low, the effective response rates obtained in this research are quite typicalfor e-mail surveys (Medina-Munoz and Garcia-Falcon, 2000; Jeong et al., 2003). Thelow response rate is assumed to be caused by using e-mail for correspondence (lackingpersonal contact and thus, likely, less binding), the complexity of the questions and thelength of the questionnaire. It may further be assumed that hoteliers who are activelyinvolved in environmental initiatives may be more likely to respond than those who arenot. This limitation may result in a somewhat biased sample and reporting rate. Thus,while the comparative data presented in this paper may be reliable, it is difficult toestablish to what extent the data collected are representative of the overall situation inSwedish and Polish hotels. Nevertheless, the study has provided valuable insights intoenvironmental attitudes in the hotel sectors in both countries.
5. Participant profiles
Profiles of respondents are presented in Table 1.Many responses from the representatives of the hotel management allow the
conclusion that the survey was regarded seriously, despite the lack of support fromany formal tourism organisation. Regarding the reliability of the answers, severalanonymous responses, and those completed by the reception staff, indicated thatsome individual respondents may not possess adequate background information toenable them to answer questions on environmental issues, or other relevant activities

ARTICLE IN PRESS
Table 1
Profile of survey participants, per cent of respondents
Sweden (N ¼ 224) Poland (N ¼ 124)
Function or position of the respondent
Management 57.8 39.5
Sales and marketing 6.2 31.5
Front office and services 21.8 13.7
Environmental coordinator 5.8 —
Anonymous answer 8.4 15.3
Size distribution of facilities
Small (o50 rooms) 30.8 48.4
Medium-size (50–149 rooms) 42.9 38.7
Large (X150 rooms) 26.3 12.9
Average size 111.5 76.4
Customer profile
Business and conference guests 51.5 53.3
Membership in branch associations
Member of a hotel or tourism association 72.4 42.7
P. Bohdanowicz / Hospitality Management ] (]]]]) ]]]–]]] 7
within the facility. This may be attributed to a limited interest in environmentalmatters, and, in the case of Poland, insignificant attention given to these topics intourism and hospitality schools, and during basic training.
The variations in size distribution of facilities can be explained by the diversifiedmarket needs and dynamics, and a variety of ownership schemes present in theinvestigated regions. As regards the customer profile, unless the destination ispredestined for leisure purposes, a substantial number of hotels currently rely onbusiness and conference guests as their basic and major customers, which wasreflected in the samples analyzed.
Hotel and tourism associations, including hotel corporations, are believed to havean important role in promoting environmental awareness and advocating moresustainable practices among the operators of the hospitality industry (CSD, 1999). Inthe Polish sample, the national hotel associations (Polish Hotel Association (PHA)and Polish Hotel House) were the most frequently mentioned organizations (38mentions), with the national tourism organization (Polish Tourism House) and hotelchain/affiliation receiving up to four mentions each. This illustrates the still low levelof corporate hotel market development in Poland, in contrast to Sweden where hotelchains led the ranking with 146 mentions, while national hotel and tourismorganizations (Swedish Hotel and Restaurant Association, and Swedish TourismBoard) received only five mentions each.
6. Hoteliers’ attitudes towards the environment
Eight out of ten participants in the survey expressed the belief that the issues ofnatural environment and its protection are important for the performance and

ARTICLE IN PRESS
P. Bohdanowicz / Hospitality Management ] (]]]]) ]]]–]]]8
further development of the tourism industry. However, pressures to appear sociallyresponsible may lead individuals to overstate their environmental commitment andpro-ecological behaviour in the context of surveys. Therefore, these results need tobe interpreted with a certain degree of caution. This is especially important in thelight of comments received from some of the respondents, who believedenvironmental concerns to be limited to nature-based tourism.
The majority of hotel representatives participating in the survey recognized thathotel facilities had an influence on the natural environment. They further believedthat the environmental impacts of their hotels were medium to significant (64 and23.6 per cent, respectively, of the respondents from Sweden, and 52.4 and 16.9 percent, respectively, from Poland), which corresponded well with the results of pastscientific investigations (APAT, 2002). By contrast, in the Guernsey study, only 38per cent of the respondents believed that both the tourism and hospitality sectorshave a moderate to significant contribution to environmental problems (Stabler andGoodall, 1997). Among the comments received from the respondents in theSwedish–Polish study were those questioning the negative impact of hotels on theenvironment, and doubting the need for hotels to be eco-friendly at all. The numberof such statements, although not significant in this study, is still indicative of theexisting attitudes.
On the other hand, a serious concern for the environment expressed by apredominant majority of hoteliers (94.7 per cent in Sweden and 82.3 per cent inPoland) can be seen as encouraging. In the Swedish case, this can be attributed to thehigh priority given to environmental issues at national level. In the Polish sample, itillustrates growing awareness of the value of nature, despite the economic problemsfaced by the industry. This can be further supported by the fact that in Poland small,individually operated hotels seemed to be those most concerned about theenvironment. In contrast, in Sweden large (often chain-affiliated) establishmentsexpressed greater concern, which can be explained by the will to establish andmaintain a good corporate image.
It was expected that, because of higher governmental involvement in ecologicaleducation in Sweden, hoteliers from this region would possess more knowledge ofthe activities initiating more ‘‘green’’ hotels. Indeed, the evidence collected indicateda difference between the two countries (in Sweden there were 66.2 per cent positiveanswers, including 60.4 per cent actually listing mitigation methods, while in Poland56.5 and 43.5 per cent, respectively). Furthermore, the general trend of chain andaffiliated establishments demonstrating a higher environmental knowledge was clear.This can be attributed to the efforts made by most chain head offices towardsdeveloping and enforcing environmental policies and programmes, as discussedelsewhere (Bohdanowicz and Martinac, 2003; Bohdanowicz, 2005).
As regards the activities mentioned, in Poland issues relating to waterconservation (the towel reuse programme) and wastewater treatment (degreasingtraps on kitchen discharge pipes, and biodegradable detergents) were the mostcommonly listed with 32 mentions, followed by responsible waste management(waste segregation and recycling) — 24 mentions. Energy conservation, primarily inthe form of change/modification of the heating system and fuel, as well as building

ARTICLE IN PRESS
P. Bohdanowicz / Hospitality Management ] (]]]]) ]]]–]]] 9
insulation ranked third with 19 mentions. This ranking reflects the situation inPoland where the low availability of high-quality drinking water and recreationalreservoirs, although less dramatic than a few years ago, is considered by the generalpublic to be a more serious problem than air pollution associated with fossil-fuel-based electricity and heat generation. Only eight ideas relevant to green purchasingwere mentioned.
In Sweden, responsible waste management seemed to attract the most attention,with 44 mentions. This included waste sorting and recycling, as well as minimizingthe use of single packaging. This situation can be attributed to more than 15 years ofcampaigns promoting responsible waste management carried out in the Nordiccountries. Green purchasing, including priority given to environment-friendly,biodegradable detergents and other chemicals, no single packaging, as well as closecooperation with suppliers ranked second (35 mentions), followed by water (27mentions) and energy (25 mentions) conservation. Towel reuse programmes, energy-efficient equipment/lighting and the incorporation of renewable energies were themost frequently mentioned. For the Swedish hoteliers, efficient measures towardssustainability include an effective environmental policy and action plan within thecompany and industry association, and the compliance with the requirements statedin environment-related standards and certificates.
Several respondents raised the cost-related issue of becoming ‘‘green’’ andenvironmentally responsible. Many hoteliers interviewed feared that the road toenvironmental sustainability might be prohibitively expensive, especially in view ofthe current market fluctuations, and decreasing profits (due to wars, health risks andgeneral decrease of the economy). One respondent highlighted the need for a moreadequate promotion of environmentally certified establishments. Informationconcerning eco-certificates attained by the hotel should be displayed in hotelcatalogues/directories, city guides as well as booking and travel agencies. Suchinformation could be especially valuable, considering that only 1 per cent ofEuropean accommodation facilities are currently eco-labelled (APAT, 2002). Thereis, however, a continuous need to educate the general public in an attempt to increaseenvironmental awareness.
7. Environmental activities in the hotel industry
Energy-, water- and waste-related issues are the areas targeted by the majority ofpro-ecological solutions. Fields of activities undertaken by hoteliers participating inthe study vary, often significantly, depending more on the region than on the size ofthe facility. It is likely that some of the differences have been the direct result of lawsand regulations, as well as local conditions. The types of measures are additionallyinfluenced by corporate policy, the level of environmental awareness at managementlevel, ownership–operation agreement, and the financial state of the establishment.
In total, more than 75 per cent of the respondents in both regions reported theirinvolvement in activities relevant to energy and water conservation, as well asresponsible waste management (Fig. 1).

ARTICLE IN PRESS
87.6 85.3 89.983.9 79 77.4
0
20
40
60
80
100
Energy conservation Water conservation Responsible wastemanagement
% o
f re
spo
nd
ents
Sweden, N=225 Poland, N=124
Fig. 1. Main areas of environmental activities undertaken by hoteliers, per cent of respondents
P. Bohdanowicz / Hospitality Management ] (]]]]) ]]]–]]]10
More than half (56.9 per cent) of the Swedish hotel managers indicated having anenvironmental policy statement in their business plan, while in Poland only 4 percent of the respondents indicated the incorporation of such a policy. This situation isbound to improve, as Poland has only recently joined the European Union and willneed to comply with more stringent environmental regulations in the future.
A study performed by PricewaterhouseCoopers on European hotels revealed that80 per cent of the respondents had an environmental policy (Clark and Siddall,2001).
7.1. Energy conservation
The energy-saving potential in hotels has been estimated at 10–25 per cent byvarious studies (West and Elliot, 1996; Blank, 1999), depending on the age and sizeof the hotel, as well as type of equipment installed and the maintenance andoperating procedures in use. The energy conservation potential is typically largest innon-retrofitted facilities, while the attitude of both management and employees has adecisive role on the success of the energy-saving campaign. Currently, measuresaiming at energy conservation are increasingly popular among hotel managers(Fig. 2).
Lighting is typically an area of significant saving potential. Depending on thecategory of the establishment, lighting may account for 7–20 per cent, and in somecases up to 40 per cent of the total energy consumption of a hotel (IMPIVA, 1994;CHOSE, 2001). The high popularity of energy-efficient lighting among allrespondents (over 70 per cent) may be attributed to promotion campaigns thatwere performed in both regions, market availability of such fixtures, and the fact thateven a small energy saving translates to reasonable economic benefits.
Many people claim that efficient equipment is prohibitively expensive. However,they are often unaware of the fact that the running costs of inefficient apparatus arefrequently much higher than the initial cost of installing more effective equipment. It

ARTICLE IN PRESS
76
58.2
40.4
17.8
70.2
41.9
22.6
8.1
0
20
40
60
80
100
Energy-efficient
lighting
Energy-efficient
equipment
Leaflets
encouraging
guests to save
energy
Other
% o
f re
spo
nd
ents
Sweden, N=225 Poland, N=124
Fig. 2. Energy conservation and efficiency measures undertaken by hoteliers, per cent of respondents
P. Bohdanowicz / Hospitality Management ] (]]]]) ]]]–]]] 11
is therefore important to evaluate the cost of equipment not only based on initialcost but also taking into consideration the entire life cycle. This attitude willindisputably become more common in the future, and combined with wideravailability of energy labelling schemes for appliances (well established in Swedenand only recently introduced in Poland) will result in an increase of the market shareof energy-efficient equipment in the hotel sector (from current figures of 58.2 per centin Sweden, and 41.9 in Poland).
Leaflets encouraging hotel guests to save energy are more frequently displayed inthe rooms of Swedish hotels (40.4 per cent), than in Polish hotels (22.6 per cent). Therelatively low popularity of leaflets may be interpreted by the role that hotels have insociety. They are part of the service industry and are designed to provide multi-faceted comfort and service to guests frequently accustomed to, and willing to payfor, exclusive amenities, treatment and entertainment. Therefore, the placement ofany ‘‘Please save’’ information in the room may be perceived by the guests as anintrusion into their privacy and comfort. On the other hand, such leaflets do notoblige anyone to follow their content; their aim is merely to suggest the possibility ofco-operation.
Among other energy efficiency measures, modifications and/or replacements ofexisting space conditioning systems, as well as installation of renewable energysystems, were most commonly reported by the respondents. Various energyconsumption control methods including occupancy sensors for lighting control,master power cards and even computerized Building Management Systems, werealso listed.
7.2. Water conservation
Among water conservation measures, the towel reuse programme is an alreadywell-established practice in most European countries, with more than two-thirds ofthe respondents reporting involvement in such programmes (Fig. 3).

ARTICLE IN PRESS
61.871.6
36.9
7.6
44.4
64.5
18.5
40
20
40
60
80
100
Water efficientfixtures
Towel reuseprogramme
Leafletsencouraging
guests to savewater
Other
% o
f re
spo
nd
ents
Sweden, N=225 Poland, N=124
Fig. 3. Water conservation and efficiency measures undertaken by hoteliers, per cent of respondents
P. Bohdanowicz / Hospitality Management ] (]]]]) ]]]–]]]12
This initiative saves not only water and electricity, but also reduces the use ofdetergents and prolongs the life of materials. According to the Conserving forTomorrow Program developed by Six Continents Hotels, an average 150-room hotelwith an active towel and linen reuse programme can save 22 700 l of water andapproximately 150 l of detergent monthly (SCH, 2001). Furthermore, this initiativehas been well received by hotel customers worldwide. According to the Green HotelAssociation, hotels report a 70–90 per cent guest participation in such programmes,corresponding to savings of US$6.50 per day per occupied room (Griffin, 2002).
Most water consumption occurs in hotel rooms, followed by the laundry units andkitchen facilities (Lawson, 2001). Therefore, the installation of water-efficientfixtures may have a significant influence on the total quantity of water used. Water-conserving fixtures are more common in Sweden, where more than 60 per cent of thehotels in the investigated sample are equipped with such devices. The lowerpopularity of such solutions in Poland can be attributed to their cost. It was alsofrequently commented that these types of fixtures are typically installed during themajor refurbishment of the rooms, usually performed every 15–25 years (Rutes, etal., 2001). The use of environmentally safe detergents and commissioning of anexternal company for laundry services were also mentioned.
Leaflets encouraging water conservation were found to be slightly less popularthan the energy saving-oriented pamphlets (36.9 in Sweden and 18.5 per cent inPoland).
7.3. Responsible waste management
Waste sorting, frequently pursued in offices and kitchens, but not customary inguestrooms, is more common in Sweden, where 80 per cent of hotels included in thesurvey have an active waste-sorting and recycling programme (Fig. 4).

ARTICLE IN PRESS
80
60
17.3
61.8
13.8
30.6
50.8
32.350
3.20
20
40
60
80
100
Sorting ofwaste in
guestrooms,offices and
kitchens
Donation ofhotel furniture
andequipment
Donation ofleftover, goodquality food
Reusable foodand detergent
packaging
Other
% o
f re
spo
nd
ents
Sweden, N=225 Poland, N=124
Fig. 4. Responsible waste management measures undertaken by hoteliers, per cent of respondents
P. Bohdanowicz / Hospitality Management ] (]]]]) ]]]–]]] 13
As previously mentioned, in the Scandinavian countries, significant attention isgenerally placed on waste sorting and recycling, which illustrates why many Swedishhotels implement this activity. The relatively low popularity of waste sorting inPoland (30.6 per cent) may be attributed to the lack of sorting facilities in someregions of the country. Furthermore, as indicated by one of the respondents, there isoften only one truck collecting refuse in the area, dumping sorted and unsorted wasteinto a common container and thus discouraging the locals to continue separatingwaste. Such barriers could, however, be relatively easily overcome by cooperationamong hotels located in the same area.
Textiles found in hotel rooms, such as carpets or draperies, should bechanged every 5 years, while furniture and most other equipment every 10 years(Rutes, et al., 2001). Many of these items are still in fairly good condition; thereforedonation/sale to local charity organizations is a common practice (50.8 per centrespondents in Poland and 60 per cent in Sweden). This initiative supportsthe sustainability concept since prolonging the active life of various itemsminimizes their environmental costs (from a life cycle point of view). The issue offood donation is a very controversial one and often prohibited by local sanitary law,which explains its low popularity (32.3 and 17.4 per cent in Poland and Sweden,respectively).
At least half of the respondents from both countries endorsed the purchase andutilization of bulk or/and reusable food and detergent packaging instead of throw-away alternatives. In addition, food-waste composting and utilization for fertiliserand biogas production, as well as a complete removal of throw-away packaging, waslisted by a number of Swedish hoteliers (five and four mentions, respectively),together with the use of on-site paper compactors and eco-products (two mentionseach). The installation of soap and shampoo dispensers in guest bathrooms insteadof individually packed toiletries was also periodically mentioned. Refurbishment offurnishings rather than the purchasing of new furnishings was mentioned by onerespondent, while another stated that 80 per cent of the furniture at the facility

ARTICLE IN PRESS
P. Bohdanowicz / Hospitality Management ] (]]]]) ]]]–]]]14
originated from a local second-hand antique shop. One hotel chain advertised 97 percent recyclable rooms in their facilities.
7.4. Other initiatives
Restaurant menus containing ecological, and often certified, food was morecommonly mentioned by Swedish respondents (46.2 per cent) than their Polishcolleagues (15.3 per cent). A high percentage of positive answers in the Swedishsample can be attributed to the fact that, in contrast to Poland, in Sweden eco-certified (with KRAV label) food items are readily available and at least one of thechains reported eco-labelled breakfasts as one of its environmental goals.
The proper training and enforcement of behavioural changes among hotelpersonnel as well as regular facility performance monitoring are potentiallysignificant saving options. Generally, these are also more economical solutions thanmost other technological measures. However, such activities were reported by alimited number of facilities and do not appear to be widely applied in the industry.This may be due to the lack of suitable training programmes, as well as a commonlack of belief in their effectiveness. The issue of the influence of behaviour onresource consumption is, nevertheless, gaining increased attention among hoteloperators (Bohdanowicz et al., 2005).
Hoteliers also reported local purchasing of food and other materials aimed atdecreasing transport distances, as well as aiming at bulk purchasing and deliveries. Anumber of Swedish respondents claimed to go one step further with their ecologicalactivities by aiming at involving their suppliers, and by purchasing products withlower life-time environmental impact. In several cases these respondents weresuccessful in persuading producers and suppliers to eco-certify their products andservices. This experience indicates that the purchasing power of a single hotel (e.g.SSCC), not to mention an entire chain (Scandic), can be very substantial (Lind afHageby, 2003; Bergkvist, 2003). This can provide significant environmentalincentives within related businesses.
As another European study revealed, some hoteliers believe that the compliancewith the laws and local standards (e.g., separation of waste) is enough to make theirfacilities environmentally responsible (Despretz, 2001). The same study alsoillustrated that for some hoteliers the concept of efficient equipment was equivalentto ‘‘new’’ equipment, while eco-certified products and appliances were thosecontaining in their names the words ‘‘eco-’’ or ‘‘bio-’’, as supplied by manufacturers,without necessarily being formally certified.
8. Institutional framework
8.1. Environment-related institutions
Over 60 per cent of the Swedish respondents declared being familiar withinstitutions dealing with environmental issues in the hotel industry, which can be

ARTICLE IN PRESS
P. Bohdanowicz / Hospitality Management ] (]]]]) ]]]–]]] 15
attributed to the prominent presence of these organizations in various media.Generally, representatives of larger and affiliated hotels are more aware of theexistence of such bodies. Programmes offered within chains and affiliations areconventionally the most popular, followed by national tourism and hotel associations,and general environmental organizations. The Nordic Ecolabelling/SIS Miljomarkn-ing, renowned for the Nordic Swan ecolabel, is by far the most distinguishedorganization in Sweden (82 mentions, out of 225 participating hoteliers).
General awareness among Polish hoteliers was very poor (10.5 per cent) withsingle mentions given to ISO, Green Globe 21, Greenpeace, local hotel marketingprogrammes and local environmental NGOs. This is a good illustration of thesituation on the market where no such organization actually exists. In response topetitions from hotel representatives, the Polish Hotel Association (PHA) decided toinitiate relevant research and pro-environmental initiatives. PHA aimed to createtheir own eco-certification scheme, EKO HOTEL; however, due to lack of financingthe process has been delayed (Bohdanowicz et al., 2004). On the other hand,Poland’s recent entry into the European Union is bound to have a significant effecton the development of environmental support programmes and certificationschemes, as hoteliers will have easier access to European initiatives and organizations(e.g. the EU Flower eco-label in the category of tourist accommodation).
8.2. Environmental officers and certificates
Resident environmental officers are more frequently found among Swedish hotelstaff (27.6 per cent of the total amount of respondents). Only 14.5 per cent of therespondents from Poland declared having a person appointed to be in charge ofenvironmental issues. In most cases, this is still an additional duty, typically for hoteland kitchen managers, technical as well as administrative or reception staff. This islikely to be due to two factors. First, the difficult economic situation in Poland doesnot allow hotel managers to employ a person whose only responsibility isenvironmental protection. Secondly (and more probably), interest in natureconservation is not significant enough to justify creating such job positions.
Swedish hoteliers were also asked to report any eco-certificates awarded to theirfacilities (no eco-label was available for Polish hotels at the time of the survey). Morethan 26 per cent answered positively. The Nordic Swan is by far the most popularscheme, with 30 hotels labelled at the time of the study. Certificates issued by hotelchains/associations (17 mentions) and local communities (six mentions) also seemedto be popular, along with ISO and KRAV (food products) certifications (fivementions each). Only one respondent stated that the application and acquisitionprocess for Nordic Swan and similar labels was too difficult to bother with.
9. Incentives
The hoteliers participating in this survey were asked to rank the incentives capableof encouraging them to undertake environmentally oriented initiatives according to

ARTICLE IN PRESS
3.814.32
2.632.76
4.554.965.04
4.42
2.623.32
4.074.124.48
5.82
0
1
2
3
4
5
6
7
Reducingoperating
costs
Diminishingenvironmentalimpacts of the
hotel
Marketingasset
Availability ofprofessional
advice
7-p
oin
t L
iker
t sc
ale
Sweden, N=225 Poland, N=124
Demands from customers
Improving the hotel image
Recommendations of management
Fig. 5. Incentives to introduce more environment-friendly initiatives, average of 7-point Likert type scale.
P. Bohdanowicz / Hospitality Management ] (]]]]) ]]]–]]]16
their importance and using the 7-point Likert type scale. For the purpose of analysis,average values were calculated (Fig. 5).
The only feature yielding a statistically significant difference in opinions was theprospect of reducing operating costs (an average of 5.82 in Poland and 5.04 inSweden, first rank in both countries).1 This result coincided with the findings of theGuernsey study, where 26 per cent of respondents stated that cost-cuttingopportunities are the foremost incentive to be environmentally responsible,especially when combined with reduced taxes, operating subsidies and capital grants(Stabler and Goodall, 1997).
Customer demand ranked second, which is understandable considering thatlodging is a service industry. The goal to reduce environmental impacts ranked thirdin Sweden, while in Poland this level of priority was given to improving the image ofthe facility. Notably, management requirements as incentives towards greaterenvironmental responsibility ranked low in both countries. Neither was theavailability of professional advice found to be a sufficient incentive to enhanceeco-friendliness.
The findings of this survey lead to the conclusion that eco-friendliness currentlyranks low on the hotelier’s agenda, mainly due to lack of customer interest. Thehoteliers surveyed ranked environmental concerns fifth on a list of customer decisioncriteria, after location, price, service, and hotel image/tradition, see Fig. 6.
Guests of four Scandinavian hotels surveyed in 2003 ranked environmentalconcerns sixth on their list of facility/destination choice criteria, after location,
1The formula used was: Sx1�x2� 1:96 ¼
ffiffiffiffiffiffiffiffiffiffiffiffiffiffiffiffiffiffiffiffiffiffiffiffiffiffiffiffiffi½Sx1
�2 þ ½Sx2�2
q� 1:96, and the value was compared to
x1 � x2, where x1 was the average value for Sweden, and x2 for Poland. The formula was taken from the
U.S. Department of Energy CBECS survey 1995.

ARTICLE IN PRESS
0
1
2
3
4
5
6
Location Quality ofservices
Price Tradition ofthe hotel
Concern forthe
environment
Other
6-p
oin
t L
iker
t sc
ale
0
20
40
60
80
100
120
% o
f re
spo
nd
ents
Sweden, N=225; Likert scale Poland, N=124; Likert scale
Sweden, N=225; % of respondents Poland, N=124; % of respondents
Fig. 6. Features advertised and their perceived importance in customer decision making, per cent of
respondents and average of 6-point Likert type scale.
P. Bohdanowicz / Hospitality Management ] (]]]]) ]]]–]]] 17
previous experience/recommendations, quality of service, price, and hotel tradition,as presented elsewhere (Bohdanowicz, 2003). Despite the low ranking of environ-ment-related issues, some hotels have designated environmental concern as theleading theme of their marketing strategy. Some of these facilities, including theSSCC (Sweden), report increased numbers of guest-nights and higher profits as theresult of ‘‘greening’’ their facilities and marketing them as such (Martinac, et al.,2001; SSCC, 2003).
10. Conclusions
The survey performed among Swedish and Polish hoteliers casts some light on theperception of environmental issues within the hotel sector and on factors affectingrelevant attitudes. The hoteliers participating in the study recognize that theirfacilities influence the natural surroundings, although the magnitude of the impactsis often underestimated. They are also aware that the hotel industry would benefitfrom environmental pro-activeness among operators. In response to emergingcustomer demand for ‘‘green’’ operations, combined with the growing evidence offinancial benefits from managing resource-efficient facilities (UNEP and IH&RA,1997; Martinac, et al., 2001; SSCC, 2003; Bohdanowicz, et al., 2005), hoteliers aremore willing to make changes to accommodate pro-ecological programmes.
The study indicated that the geo-political, economic and socio-cultural context ofa country has an influence on the environmental attitudes of hotel operators. The‘‘green’’ image of Scandinavian countries, where considerable emphasis is placed onpreserving high environmental quality, is reflected in the attitudes and actions ofSwedish hoteliers. They were generally found to have higher environmentalawareness, comprehensive knowledge relevant to environmental protection andwell-established pro-ecological programmes and initiatives. On the other hand,

ARTICLE IN PRESS
P. Bohdanowicz / Hospitality Management ] (]]]]) ]]]–]]]18
Polish hoteliers were found to be at the stage of recognizing the importance ofenvironmental concern and initiating various activities. However, due to therelatively low level of environmental knowledge and the lack of relevant policies forsustainable tourism development, most actions undertaken by Polish hoteliers areaimed at achieving immediate economic benefits, or are those required by law. It canbe concluded that initiatives in Poland are primarily economically motivated, whileany environmental benefits achieved are seen as a bonus.
The findings of this study provide a number of insights that may have significantrelevance for the development of sustainable practices in the hotel industry at large.Two major directions that ought to be pursued were identified. First, environmen-tally responsible practices need to be incorporated into the hotel industry. Thisshould be accompanied by the demonstration of cost savings associated with thesesolutions. Hoteliers, sector associations and representatives of academia shouldcooperate in developing new and less expensive technologies, disseminatinginformation about best practices and findings of cost–benefit analyses. The lowawareness of the environment-oriented institutions identified among Polish hoteliersindicates an urgent need for the creation of such bodies. Furthermore, thegovernment and existing international and national environmental organizationsshould intensify their efforts in providing hoteliers in Poland with appropriateinformation.
Special training courses should be developed and participation of all staffmembers at individual facilities encouraged. Formal tourism and hotel educationcurricula should include extended modules dedicated to environmental issues andpro-ecological solutions. Governments and other decision-making institutionsshould become involved by providing legal and economic incentives for the industryto adopt environmentally sound practices. The issue of financial aid seems to beespecially important in countries like Poland, where the hotel sector is going throughfinancially difficult times.
The second line of action identified by this survey relates to the creation andenhancement of travellers’ environmental awareness in an attempt to initiate theirdemand for ‘‘green’’ practices. It is especially important in the light of these findings,which indicate that customers’ demand for more environmentally sound perfor-mance from the hotel industry is likely to effect a significant change. Althoughenvironmental concerns are believed to be increasingly driving customer choice anddecisions in Western and Northern Europe, this is still not the case in Central andEastern Europe. A wide-reaching pro-ecological educational campaign is needed toinitiate a change in social attitudes.
Hoteliers and other tourism operators can participate in the process by, forexample, advertising the environmental commitment in their facilities and invitingguests to participate in pro-ecological activities. Tools of informal education, in theform of brochures, exhibitions, ecological corners, seminars and multimediapresentation kiosks, can also be used. By applying for eco-labels hoteliers canfurther facilitate the customer decision-making process. Evidence exists that sometravellers are willing to pay a premium for the privilege of staying in a ‘‘green’’facility (Wight, 1997; Bohdanowicz, 2003). This extra income combined with lower

ARTICLE IN PRESS
P. Bohdanowicz / Hospitality Management ] (]]]]) ]]]–]]] 19
operating costs at the resource-efficient facility make environmentally responsibleoperation practice a good business decision.
The creation of an environmentally sustainable, ‘‘green’’ hotel market is one of thechallenges of today. The author believes, however, that the recognition of benefitsassociated with managing environmentally sound hotel facilities will spread across theworld, making it a common practice. It is also believed that the demand for ‘‘green’’hotel operations will increase among customers. However, those pioneering in relatedenvironmental work and efforts are most likely to reap most of the early benefits.
Acknowledgements
The author would like to acknowledge the financial support from StatensEnergimyndighet (Swedish Energy Administration).
The author would like to thank the hoteliers who dedicated their time toparticipate in this survey, Prof. Ivo Martinac, and the two anonymous reviewers forvaluable contributions and comments on the topic, and to Anita Elksne and SandraBrunsberg for the proof-reading of this manuscript.
References
Accor Group, 1998. The environment guide for hotel managers. Accor Group, Paris, France.
APAT (Italian National Agency for the Protection of the Environment and for Technical Services), 2002.
Tourist accommodation EU eco-label award scheme – Final Report. Italian National Agency for the
Protection of the Environment and for Technical Services, Rome, Italy.
Bergkvist, J.P., 2003. Personal communication with Jan-Peter Bergkvist, Director of Environmental
Sustainability at Hilton International and Scandic. March 12, 2003, Stockholm, Sweden.
Bergkvist, J.P., 2004. Hilton’s environmental training campaign. Green Hotelier 33, 11.
Blank, D., 1999. Energy-saving efforts help hotels reduce maintenance and expenses. Hotel and Motel
Management, November 1, 1999.
Bohdanowicz, P., 2003. A study of environmental impacts, environmental awareness and pro-ecological
initiatives in the hotel industry. Royal Institute of Technology, Stockholm, Sweden.
Bohdanowicz, P., 2005. European hoteliers’ environmental attitudes: Greening the business. Cornell Hotel
and Restaurant Quarterly 46, 188–204.
Bohdanowicz, P., Martinac, I., 2003. Attitudes towards sustainability in chain hotels – results of a
European survey. In: Proceedings of the CIB International Conference on Smart and Sustainable Built
Environment (SASBE2003), November 19–21, 2003, Brisbane, Australia.
Bohdanowicz, P., Simanic, B., Martinac, I., 2004. Sustainable hotels – eco-certification according to EU
Flower, Nordic Swan and the Polish Hotel Association. In: Proceedings of the Regional Central and
Eastern European Conference on Sustainable Building (SB04), October 27–29, 2004, Warszawa,
Poland.
Bohdanowicz, P., Simanic, B., Martinac, I., 2005. Environmental training and measures at Scandic Hotels,
Sweden. Tourism Review International 9, 7–19.
Capona AB, 2002. Capona 2002 Annual Report (in Swedish). Stockholm, Sweden.
CHOSE, 2001. Energy savings by combined heat cooling and power plants (CHCP) in the hotel sector.
Commission of the European Communities, Directorate General for Energy. Stockholm, Sweden.
Clark, J., Siddall, L., 2001. European hotel’s implementation of environmental policies. Hospitality
Directions – Europe Edition, PricewaterhouseCoopers Press Release, August 6, 2001. Retrieved June
11, 2003 from http://www.pwcglobal.com.

ARTICLE IN PRESS
P. Bohdanowicz / Hospitality Management ] (]]]]) ]]]–]]]20
CREM (Consultancy and Research for Environmental Management), CH2M-HILL, 2000. Feasibility and
market study for a European eco-label for tourist accommodations (FEMATOUR). Amsterdam, The
Netherlands.
CSD (Commission on Sustainable Development), 1999. Sustainable tourism: a non-governmental
organization perspective. New York, USA.
Despretz, H., 2001. Green Flag for greener hotels, Final Report. European Community, Valbonne,
France.
Eiderbrant-Nilsson, G., 2002. E-mail communication with Mrs Gunlog Eiderbrant-Nilsson, the head of
Travellers and Tourism Statistics at the Statistiska Centralbyran (Statistics Sweden), December 2002,
Stockholm, Sweden.
European Commission, 2003. Structure, performance and competitiveness of European tourism and its
enterprises. Luxembourg.
Genot, H., Pogson, N., Franc-ois, P., Carbone, G., 2001. Sowing the seeds of change — an environmental
teaching pack for the hospitality industry. EUHOFA, IH&RA, UNEP, Paris, France.
Granhed, G., Andersson, H., 2003. Hotellaret 2002 (The hotel year 2002 — in Swedish). Restauratoren
Nyheter 7, Sveriges Hotell-och Restaurangforetagare, Stockholm, Sweden.
Griffin, P., 2002. Green Hotel Association press release from September 25, 2002, based on National
Association of Institutional Linen Management’s Membership Survey 2000–2001. Retrieved February
6, 2003 from http://www.greenhotels.com.
GUS (G"owny Urzad Statystyczny—Main Statistics Office), 2003. Accommodation stock in 2002—state
as of July 31, 2002. Retrieved July 22, 2003, from http://www.intur.com.pl.
GUS (G"owny Urzad Statystyczny—Main Statistics Office), 2004. Rocznik statystyczny 2003 (Statistical
yearbook 2003 — in Polish). Warszawa, Poland.
Horwath International and Smith Travel Research, 1999. Worldwide Hotel Industry Study 1998. Horwath
International, New York, USA.
Hotelarz (Hotel and Motel Management — in Polish) 3–5, 2003.
IH&RA, IHEI, UNEP, 1995. Environmental action pack for hotels: Practical steps to benefit your
business and the environment. UNEP Industry and Environment Technical Report 31. Paris, London,
Nairobi.
IHEI, 1993. Environmental management for hotels. Butterworth-Heinemann, Oxford, UK.
IHEI, 2002. Hotels Care: Community action and responsibility for the environment. London, UK.
IHEI, 2005. A quick guide to benchmarkhotel. Retrieved May 4, 2005 from http://www.
benchmarkhotel.com.
IMPIVA, 1994. Rational use of energy in the hotel sector. EU Thermie Programme Action B-103.
Valencia, Spain.
INTUR (Institute of Tourism), 2002, 2004. Statistical information about tourism and accommodation
stock in Poland. Warszawa, Poland. Retrieved November 28, 2002 and May 18, 2004 from http://
www.intur.com.pl.
Jeong, M., Oh, H., Gregoire, M., 2003. Conceptualizing web site quality and its consequences in the
lodging industry. International Journal of Hospitality Management 22, 161–175.
Johnson, C., Iunius, R.F., 1999. Competing in Central Eastern Europe: perspectives and developments.
International Journal of Hospitality Management 18, 245–260.
Karczewicz, A., 2000. The state of Poland’s hospitality industry. Marketing Report, Global Hotel
Network(SM), July 22, 2001. Retrieved February 25, 2002 from http://www.globalhotelnetwork.com.
Kulesza, I., 1999. Proekologiczne rozwiazania w turystycznych obiektach noclegowych (Pro-
ecological solutions in tourism accommodation — in Polish). Institute of Tourism, Warszawa,
Poland.
Lawson, F.R., 2001. Hotels and Resorts – Planning, Design and Refurbishment. Architectural Press,
London, UK.
Lind af Hageby, A., 2003. Personal communication with Alexander Lind af Hageby, Environmental
Director at Sanga Saby Course and Conference. March 5, 2003, Svartsjo, Sweden.
Martinac, I., Murman, H., Lind af Hageby, A., 2001. Energy-efficiency and environmental management in
a Swedish conference facility— Case study: Sanga-Saby Courses & Conferences. In: Proceedings of the

ARTICLE IN PRESS
P. Bohdanowicz / Hospitality Management ] (]]]]) ]]]–]]] 21
18th Conference on Passive and Low Energy Architecture (PLEA2001), November 7–9, 2001,
Florianopolis, Brazil.
Medina-Munoz, D., Garcia-Falcon, J.M., 2000. Successful relationships between hotels and agencies.
Annals of Tourism Research 27 (3), 737–762.
Nordic Ecolabelling, 2002. Nordic ecolabelling of hotels and youth hostels. Criteria document, October
3rd 2002 — September 30th 2006, Version 2.0. SIS Miljomarkning, Stockholm, Sweden.
Nordic Ecolabelling, 2005. Nordic Swan webpage. SIS Miljomarkning. Retrieved May 9, 2005 from
http://www.svanen.nu.
Olsen, M.D., Zhao, J., Sharma, A., Choi, J.-G., 2000. Leading hospitality into the age of excellence:
Expansion, competition and vision in the multinational hotel industry 1995–2005. An IH&RA White
Paper on the Global Hospitality Industry. IH&RA, Paris, France.
PricewaterhouseCoopers, 2001. European hotels implementation of environmental policies. Pricewater-
houseCoopers Hospitality Directions—Edition Europe, July 2001. PricewaterhouseCoopers, London,
UK.
Rada, J., 1996. Designing and building eco-efficient hotels. Green Hotelier 4, 10–11.
Radisson SAS, 2003. Responsible Business Report 2002. Radisson SAS Hotels & Resorts, Brussels,
Belgium.
Rutes, W.A., Penner, R.H., Adams, L., 2001. Hotel Design, Planning and Development. W.W. Norton
and Company, London, UK.
Scandic Hotels AB, 2000. Annual report 1999. Scandic Hotels, Stockholm, Sweden.
SCB, 2003. Statistiska Centralbyran — Statistics Sweden web page. Retrieved June 30, 2004 from http://
www.scb.se.
SCH (Six Continent Hotels), 2001. Our Planet—The environmental update from Bass Hotels and Resorts
3, 7.
SEA (Swedish Energy Administration), 2003. Energistatistik for lokaler 2002 (Energy statistics for non-
residential premises in 2002 – in Swedish). EN 16SM 0301. SEA, Eskilstuna, Sweden.
SHR (Sveriges Hotell och Restaurangforetagare), 1999. Hotell-, Restaurangforetagen och Miljo (Hotels,
restaurants and the environment — in Swedish). SHR, Stockholm, Sweden.
Smith, W.H., Hammer, M.S., Townsend, J.M., 1993. EcoPurchasing guide for hotels and motels.
University of Florida, Gainesville, USA.
STA (Swedish Tourist Authority), 2003. Tourism in Sweden 2002. Turistdelegationen, Stockholm,
Sweden.
STA (Swedish Tourist Authority), 2004. Tourism in Sweden 2003. Turistdelegationen, Stockholm,
Sweden.
Stabler, M.J., Goodall, B., 1997. Environmental awareness, action and performance in the Guernsey
hospitality sector. Tourism Management 18 (1), 19–33.
SSCC (Sanga Saby Course & Conference), 2003. Sanga Saby Kurs & Konferens: Miljoredovisning 2002
(Environmental Report 2002—in Swedish). SSCC, Svartsjo, Sweden.
Swiat Hoteli (Hotel World — in Polish) 5–7, 2003.
UNEP, IH&RA, 1997. Environmental good practice in hotels, Case studies from the International Hotel
and Restaurant Association Environmental Award, Green Hotelier. IH&RA, Paris, France.
Vogl A., 1998. 1998 Horwath Worldwide Hotel Industry Study. In: Proceedings of IH&RA 36th Annual
Congress, October 22–26, 1998, Manila, Philippines. Retrieved October 24, 2001, from http://www.
ih-ra.com.
West, M., Elliot, L., 1996. Energy management programs that increase hotel and motel profits. Fact Sheet
EES-122. University of Florida, Gainesville, USA.
Wight, P.A., 1997. Ecotourism accommodation spectrum: does supply match the demand. Tourism
Management 18 (4), 209–220.
Witkowski, K., 2003. Si"a systemu (The power of the system – in Polish). Hotelarz (Hotel and Motel
Management) 4, 16–17.
WTO (World Tourism Organisation), 2004. Tourism Highlights 2003. WTO, Madrid, Spain.

Paper V

_______________________________________________________________________________ Proceedings of the Regional Central and Eastern European Conference on Sustainable Building (SB04), October 27-29, 2004, Warszawa, Poland.
1
ENVIRONMENTAL EDUCATION AT SCANDIC HOTELS – APPROACH AND RESULTS
Paulina Bohdanowicz*
Tek.Lic., M.Sc. B.Sc., PhD candidate Dep. of Energy Technology, Royal Institute of Technology, 100 44 Stockholm, Sweden
E-mail: [email protected], Phone: +46 8 790 7682, Fax: +46 20 30 07
Branko Simanic M.Sc. B.Sc., PhD candidate
Dep. of Energy Technology, Royal Institute of Technology, 100 44 Stockholm, Sweden E-mail: [email protected], Phone: +46 8 790 7682, Fax: +46 20 30 07
Ivo Martinac
Ph.D., Associate Professor Dep. of Energy Technology, Royal Institute of Technology, 100 44 Stockholm, Sweden
E-mail: [email protected], Phone: +46 8 790 8740, Fax: +46 8 411 23 23
Abstract
Energy is one of the most crucial resources utilised by the hotel industry. High proportions of fossil fuel generated energy, with the utilisation of renewable energy sources still at a marginal level, directly translate into significant pollution of the environment, both locally and globally. At the same time, the very essence of tourism is based on the availability of a clean natural environment. The need for more effective environmental protection measures is being increasingly recognised by both travellers and industry. The successful implementation of more sustainable practices in the hotel industry is, however, highly dependent on the active support and cooperation of all stakeholders involved. In this paper the development of Scandic’s environmental program in Sweden will be presented, followed by a comparison of the level of environmental awareness and involvement in energy conservation activities pursued by Scandic and other Swedish hoteliers. Moreover, an analysis of energy consumption patterns resulting from the incorporation of the “Resource Hunt” program will be presented. The analysis is based on data reported in the Scandic Utility System (SUS) database. Finally, benefits resulting from environmental/energy education will be discussed. Keywords: hotels, education, energy, Scandic, energy conservation

_______________________________________________________________________________ Proceedings of the Regional Central and Eastern European Conference on Sustainable Building (SB04), October 27-29, 2004, Warszawa, Poland.
2
1. Introduction
Hotels typically represent only about 3–5% of a nation’s building stock [1, 2, 3], yet they constitute one of the most important sectors of the travel and tourism industry, and provide accommodation to 40–50% of all domestic and international visitors [3, 4, 5]. On the European scale this translates to 160–200 million guests per year [6]. Hotels are designed to provide high levels of comfort and services to customers on a 24-hour-a-day, 7-day-a-week, year-round basis. The competition on the hotel market is fierce. To attract more customers and remain profitable, hotels are continuously trying to offer more diverse and better services, as well as a higher quality and quantity of entertainment. This is typically done with little concern for associated environmental or socio-economic impacts, leading to many forms of overexploitation (not only of energy and other resources). Hotel facilities rank among the top five in terms of energy consumption in the commercial/service building sector (minor only to food service and sales, health care and certain types of offices) [2]. European hotels were estimated to use 39 TWh of energy in 2000 alone [7]. Taking into consideration that three-quarters of primary energy in Europe are derived from fossil resources, the sector’s contribution to global environmental problems, particularly acid rains, global warming and climate change is not negligible. Assuming a worst case scenario where all the energy used in hotels would be based on coal and electricity as a primary energy source, hotels located in Europe would be responsible for the annual emission of 13.6 to 16.77 megatonnes of carbon dioxide (emission factors for coal taken from [8] and for electricity from [9]). There is no data available specifying the exact amount of energy consumed by Swedish hotels, however, in 2002 Swedish hospitality properties (hotels, restaurants, student dormitories) were estimated to consume 2.14 TWh of energy in the form of heating, cooling and electricity [10]. It is believed that a significant amount of the energy used in this sector is wasted, leaving ample room for ambitious measures of energy-efficiency and conservation. The willingness and ability of hotel management to advocate and implement state-of-the-art environmentally responsible behaviour and practices is crucial for the incorporation of more sustainable hotel practices. Hotel corporations, representing 20-29 % of all hotels in Europe and as much as 70 % in North America [11, 12, 13], may play a very important role in changing the image and performance of the hotel sector. Nowadays, environmental responsibility is frequently a corporate issue, and various pro-ecological initiatives proposed by top management are increasingly implemented at various corporate levels. A central approach to promoting environmental concern has been successfully implemented by Scandic Hotels. Scandic, now a member of Hilton International, is one of the largest hotel companies in Sweden and in Scandinavia. Currently there are almost 150 hotels bearing the Scandic logo in northern Europe. In 1993, the management of Scandic Hotels decided to focus more on environmental issues in order to become “one of the most environmentally friendly hotel chains”. The “Environmental Dialogue” project was launched and internal training material based on The Natural Step's System terms was produced. Over time, a new goal was set – “to become the most resource-efficient hotel company” and Scandic aims to achieve this “whilst retaining or increasing comfort and customer benefit”. The work continues and the results already achieved are highly encouraging.
2. The development of the Scandic environmental program
2.1 The Environmental Dialogue
Environmental concern became a fundamental part of the Scandic agenda in the early 1990s. A new Scandic environmental profile was developed on the basis of The Natural Step concept [14]. The Natural Step defines its basic concept in the following manner [15]: “In a sustainable society, nature is not subject to systematically increasing…

_______________________________________________________________________________ Proceedings of the Regional Central and Eastern European Conference on Sustainable Building (SB04), October 27-29, 2004, Warszawa, Poland.
3
1. …concentrations of substances extracted from the Earth’s crust (use all mined materials efficiently, and systematically reduce dependence on fossil fuels);
2. …concentrations of substances produced by society (substitute persistent and unnatural compounds with ones that are normally abundant or break down more easily in nature, and use all substances produced by society efficiently);
3. …degradation by physical means (use only resources from well-managed eco-systems, and use both resources and land more efficiently);
and in that society… 4. …human needs are met worldwide (use all resources fairly and responsibly so that the
needs of all people on whom we have an impact, and the future needs of people who are not yet born, stand the best chance of being met).”
During 1994, Roland Nilsson, the CEO of Scandic AB, worked together with Karl-Henrik Robèrt from The Natural Step and the environmental teams from both companies to develop the “Environmental Dialogue” training program for Scandic. The program focused on providing education in the area of environment, involving team members in various pro-ecological activities, and providing feedback on environmental performance of particular facilities and the entire chain. It contained the following four components: environmental guide, environmental meeting, an environmental program and an environmental barometer. The environmental guide includes a description of the “Environmental Dialogue” process, the Scandic Environmental Policy and goals, as well as information on current activities and suggestions aimed at stimulating environmental concern. In 2001 a new interactive program was introduced and is currently available at the Scandic intranet platform, Kunskapsportalen. The opportunity of receiving environmental training is provided for all employees joining Scandic, and it is currently being incorporated at Hilton in the form of an “Eco-learning” program. The interactive environmental training, included in the “Get on Board” section, also termed “checkin@scandic”, includes information on personal and hotel-related dependence on natural resources as well as impacts created. It also poses a series of questions concerning personal attitude towards proper environmental behaviour, as well as recommendations on how to become more environmentally conscious. The training lasts for approximately 2 hours, but does not have to be performed at once. Every hotel is equipped with a computer dedicated solely to the purpose of training team members, enabling personnel to visit Kunskapsportalen at a time suitable to them. To facilitate the understanding of issues covered in the training pack, several intermediate tests are included, while, at the conclusion of the training, a 10-minute test is given, and upon the successful completion of this test (which can be repeated as many times as necessary) team members will receive employment benefits. The training program is initiated with a short overview of the history of life on Earth and human dependence on natural resources, followed by the introduction and explanation of the Natural Step concepts. Thereafter, information is divided into categories dealing with energy, water, waste and chemicals, their consumption and conservation options. It includes an indication of the most environmentally-sound choices, as well as information about the suppliers’ role in the overall environmental performance, followed by an explanation of eco-labels, as well as information on organic and eco-food. The concept of environmentally-sound transportation is also examined, together with the choices of building materials used at Scandic. Most of the issues are analysed from a Scandic perspective and all Scandic-specific concepts are introduced and explained (i.e. 97% recyclable room, Scandic Environmental Construction Standard). Furthermore, relevant Scandic examples and success-stories are presented. So far, 2100 out of 3200 Scandic team members have successfully completed the basic environmental training [16], and a total of 9000 Scandic and Hilton-related people have learned to think environmentally [17]. While new Scandic team members typically need time to become acquainted with the practice of environmental training, long-term employees generally treat this issue as part of the company’s own culture. Nevertheless, the majority of Scandic employees are proud to work in a company that has clearly defined environmental goals and programs. For team members interested in expanding their environmental

_______________________________________________________________________________ Proceedings of the Regional Central and Eastern European Conference on Sustainable Building (SB04), October 27-29, 2004, Warszawa, Poland.
4
knowledge, complimentary courses are arranged at the Scandic Business School, approximately once a year. Furthermore, during the recent process of Swan-labelling of facilities, team members have received a considerable amount of knowledge on environmental protection. An environmental meeting is arranged about one week after co-workers have received the environmental guide. Alternatively, the interactive environmental training is performed in a group. The meeting should ultimately result in the development of an environmental program – an improvement action plan for a particular hotel. The environmental meeting is also treated as a forum for the environmental coordinators from all Scandic hotels, who can regularly meet in order to discuss various issues. The environmental program is displayed in every hotel in an area accessible to team members only. It divides activities into three categories: those already accomplished, those in progress / or at the research stage, and those requiring significant capital investment and consequently included in the long-term planning. To facilitate the process, a specific deadline is set and a person responsible for the incorporation and completion of each activity is designated. The action plan is constantly updated to ensure continuous improvement of performance. The presence of individual hotel environmental programs proved to be of significant assistance during the eco-labelling of hotels, as this was one of the requirements stated by the Nordic Swan eco-certificate. The environmental barometer was developed as a semi-annual or annual publication containing status reports from every hotel, summarizing how particular facilities have succeeded in meeting the goals set in the environmental program. It is not used currently since the hotels are assessed according to the Nordic Swan criteria.
2.2 Resource use efficiency and benchmarking
In order to assess the environmental performance of Scandic hotels in a more detailed and uniform manner, the Environmental Index benchmarking tool was developed in 1995. Approximately 60 environmental measures were identified in 9 areas, defining how specific operations at Scandic should be carried out, based on an ideal case scenario. The environmental index has been deactivated when the majority of Scandic facilities became eco-labelled and currently the Nordic Swan criteria are used. The next step undertaken by Scandic aimed at focusing more on the resource use efficiency. In 1997 the “Resource Hunt” program was implemented. A specific and detailed action plan within the “Resource Hunt” program has been developed by each hotel. It divides activities into those immediately incorporated, those requiring further investigation, and/or capital investment, and those proposed to become a corporate target. A computer database, the Scandic Utility System – SUS, was developed and incorporated to allow for the monitoring of resource consumption, and is presented further on in this paper. Although the “Resource Hunt” program includes an employee reward system, where financial rewards are transferred to a special fund at the hotel and allocated for various activities designated for use by hotel team members, its success at any particular hotel is highly dependent on the commitment of individual team members or environmental groups responsible for the incorporation of an action plan. A new version of the database is currently being introduced (Hilton Environmental Reporting - HER). The Scandic environmental department has further developed the Best in the Class system (BINC) based on SUS, and measuring 18 key indicators over time-intervals of different length. The results achieved are displayed in the team members’ access areas at each facility.
2.3 Supply-chain involvement and certification
The decision to take the environmental message outside the company by involving Scandic suppliers in the company’s environmental program followed, accompanied by the commitment to purchase products with a low (lifecycle) environmental impact. Since the end of the 1990s all new suppliers have been expected to document their corporate environmental

_______________________________________________________________________________ Proceedings of the Regional Central and Eastern European Conference on Sustainable Building (SB04), October 27-29, 2004, Warszawa, Poland.
5
policies, and required to sign the Scandic’s Supplier Declaration. Starting in 2004, all Scandic suppliers are requested to sign the Declaration [16]. Already since 2000, most of Scandic hotels in Sweden have been powered by hydro-based electricity. In January 2004 an official contract was signed with Vattenfall (one of the main energy companies in Sweden), and currently all Swedish Scandic facilities are supplied with the “green” electricity (originating from wind- or hydro-plants), and thereby further endorsing the environmental friendliness of the chain [18]. In several cases, Scandic successfully persuaded producers and suppliers to make their products more environmentally-sound (low-energy lamps from Auralight and Ahlsell) [16, 19]. Scandic has also recognized the continuous retrofitting of its facilities as an excellent opportunity for further improvement of its buildings’ performance and reducing environmental impacts. The concept of eco-room (a 97% recyclable hotel room), was introduced in 1995. Materials used to construct these rooms are 97% recyclable and include wooden furniture and floors, pure cotton or wool textiles, and limited amount of fittings made of chrome, metal or plastic [15]. At present, Scandic stock includes more than 10 000 eco-rooms, and 7 environmental hotels [18]. In a further step Scandic developed its own Environmental Construction Standard, listing materials, which may not be used in their facilities, and specifying acceptable alternatives [15]. The basic concept of any project should be the 4R’s rule: reuse - renovate – recycle – re-construct, while all materials and products used should be well documented. Furthermore, all materials and equipment should be resource-efficient and sustainable in a lifecycle perspective. Materials containing or suspected of emitting potentially harmful substances must not be used. On the other hand, eco-labelled materials should always be given a purchase priority. More specifically, no PVC is allowed to be used in Scandic hotels, while only windows with U-value lower than 1.5 W/m2K should be installed during refurbishment or new construction. Demand-controlled heating, ventilation and air-conditioning systems should be incorporated and equipped with energy recovery at every air handling unit. CFC- and HCFC-based refrigerants must not be used at all. Electricity should not be used for heating purposes, with the exception of direct electric floor heating in bathrooms. Whenever possible, lighting should be demand-controlled and based on Compact Fluorescent Lamps, while hotel rooms should be equipped with main electricity switches or master key cards. Only low energy equipment is allowed, including TV sets of maximum 5 W power and minibars with the maximum energy consumption value equal to 1.2 kWh/day. Synthetic flooring, furniture and textiles, as well as exotic wood types are “checked out”, while the use of local, and preferably, eco-labelled wood, furniture, textiles and paper is encouraged. At the beginning of the millennium, there was a common feeling among Scandic team members that in the aftermath of the intense pro-ecological efforts of the mid-1990s, environmental issues were not receiving enough attention. In an effort to bring environmental efforts back into focus of team members and customers, corporate management decided to eco-certify all of their Swedish facilities with a Nordic Swan eco-label by the end of 2004 [17]. This decision was highly appreciated by Scandic team members, and 48 Scandic and two Hilton facilities in Sweden are currently Nordic Swan-labelled [20]. Furthermore, all Norwegian Scandic hotels are expected to be Swan-labelled by the end of 2005 [21]. A network of environmental coordinators has been created to facilitate the dissemination of information, the general process of environmental education, as well as participation in various activities. Feedback on facility performance is continuously provided through various publications, as well as by the Scandic intranet. The environmental performance is further communicated to guests and the general public.
3. Managers’ survey
The results of an independent survey performed among Scandic managers and other Swedish hoteliers in the autumn of 2002 and spring/summer of 2003 further confirmed the benefits of corporate pro-ecological policy and environmental education. The study has been described in more detail elsewhere [22, 23]. For the purpose of this comparison, Scandic respondents were excluded from the total sample, leaving a total of 177 hotels in the Swedish and 49 facilities

_______________________________________________________________________________ Proceedings of the Regional Central and Eastern European Conference on Sustainable Building (SB04), October 27-29, 2004, Warszawa, Poland.
6
in the Scandic sample.. The response rates obtained in the study are 20.1% and 75.3% for Sweden in general and among Scandic hoteliers, respectively. All Scandic respondents and 77.4% of Swedish respondents in the survey emphasized that environmental protection has been essential for the performance and further development of the tourism industry. The results of Scandic corporate efforts in promoting environmental awareness are further apparent as more than 79% of respondents declared having some knowledge of activities aimed at developing “greener” hotels (75% listed at least one improvement possibility), as compared to 62.7% (respectively 57.6%) in the Swedish sample. All Scandic hoteliers further declared to be involved in some type of environment-oriented activity, as compared to 91.5% among Swedish hoteliers. All Scandic respondents declared being involved in energy saving measures (mainly energy-efficient lighting, Figure 1), as compared to 84.2% among Swedish hoteliers in general.
100
81,3 75
12,5 18,631,1
51,469,5
0
20
40
60
80
100
Energy-efficientlighting
Energy-efficientequipment
Leafletsencouraging to
save energy
Other
% of respondents
Scandic hoteliers, N=49 Swedish hoteliers, N=177
Figure 1. Energy-oriented initiatives at Scandic hotels and other Swedish hotels. Such a high rate of positive responses among Scandic managers can be attributed to corporate policy on energy saving and energy-efficiency, and, as will be shown later, actually contributes to significant energy savings.
4. Scandic Utility System Database
4.1 The history of SUS
Since 1997 the company has been working with energy, water and waste issues under the umbrella of the “Resource Hunt” program. A measurement system called SUS (Scandic Utility System), has been developed and incorporated to help in keeping track of resource usage and and its variation over time. Currently a new, more sophisticated, version of SUS, namely Hilton Environmental Reporting (HER), is being incorporated in all Scandic and Hilton establishments. It is available via Hilton intranet but can only be accessed by authorised team members. Within SUS Scandic hotels were required to send monthly reports documenting the consumption of electricity for appliances and heating, energy in the form of district heating and cooling, fuels for heating and other purposes (oil, propane/butane, town gas, LPG), water and unsorted waste, as well as a number of other key parameters (property area, number of guestnights, turnover). Being located between 56º and 68º northern latitude, Sweden encompasses a number of different (northern) climate zones. In order to compare the heating energy consumption of hotels in various climatic zones, heating degree days are used and included in the database. In HER, two levels of reporting are used [24]. First, a hotel profile form is created for each facility, which includes basic facility information such as brand, city, floor area, number of floors and rooms of various types, restaurants and kitchens, as well as additional services (health club, pool, jacuzzi, etc.), mechanical systems (air conditioning, CHP units, cooling towers, solar energy systems), as well as a list of central suppliers, including those

_______________________________________________________________________________ Proceedings of the Regional Central and Eastern European Conference on Sustainable Building (SB04), October 27-29, 2004, Warszawa, Poland.
7
environmentally approved. The second level of reporting needs to be performed on a monthly basis, and covers all the issues previously reported to SUS, including a few additional areas. The new additions to the database include information on the energy mix used to generate electricity, district heating and cooling, as well as the types of fuels utilised by the vehicle fleet. As Hilton hotels are located in many climatic zones worldwide, heating as well as cooling degree days need to be reported, where applicable. Types and amounts of refrigerants used need to be documented, while waste generated is reported as unsorted, sorted and hazardous. In addition, monthly expenses relevant to resource consumption and engineering expenses need to be included in the report.
4.2 Limitations
The SUS database has suffered from a number of limitations. Some of those have been overcome with time, others remain. Initially, some team members responsible for resource use reporting encountered difficulties in understanding what exactly should be reported, and had problems with handling different types of energy units. While most of these problems can be solved by additional education and through experience, these difficulties are likely to recur whenever a new employee is appointed to the task of HER reporting. Also, some hotels keep reporting their monthly electricity consumption as being between 0.9 and 1.1 MWh, whereas their real consumption is likely to be much higher based on their size and the climate they are located in. Spelling or typing errors also do happen, sometimes resulting in the reported monthly resource use being off track by at least one order of magnitude. Often, reports for single or multiple months are missing from the database. Some hotels do not report at all, which may be a result of the existing ownership/management situation. Sometimes Scandic rents buildings at fixed or flexible rates, and its staff may not have access to meters located in the building. In other cases, buildings may house more than just a Scandic hotel. There may still exist only a single central meter, with individual costs distributed based on some formula relevant to assumed usage, while values reported to SUS may include more than what has actually been consumed at the facility. Some hotels report identical values every month, which makes it very difficult to correlate the data collected with weather oscillations or variations in occupancy rates. This problem is typically encountered with the reporting of the amounts of unsorted waste generated, but also as regards the utilization of electricity, district heating or fuels. To further complicate issues, meter readings may be collected on different days every month, further affecting the comparability of monthly data. The Nordic Swan team is currently assessing the credibility and value of the various types of data collected, as well as their compliance with relevant limit values. Over the years, both the reporting skills and SUS itself have been improved. Nevertheless, there still remains room for improvement. The newly developed and currently implemented Hilton Environmental Reporting scheme is much more comprehensive, and is believed to allow for the establishment of a reliable benchmark for all Hilton hotels. In order to avoid some of the problems faced by SUS, a number of innovative solutions were incorporated into HER. First, an automatically generated e-mail message reminds key team members of upcoming report deadlines and provides a direct link to the electronic report form. Next, when a form for a new month is created, the latest reported values are automatically filled in, to reduce the risk of incorrectly entered data. To safeguard the validity of the information collected, a double-check process has been introduced, with the general manager of each facility being responsible for accepting and signing all forms before these are submitted to the central system. For additional safety, in Sweden the environmental coordinator at the company headquarters performs periodical checks on the data submitted.
4.3 Results

_______________________________________________________________________________ Proceedings of the Regional Central and Eastern European Conference on Sustainable Building (SB04), October 27-29, 2004, Warszawa, Poland.
8
For the purpose of this analysis, only hotels providing complete monthly reports on energy-related data and number of guestnights were selected [25]. Hotels missing at least one monthly report in any category were rejected, as were those reporting identical values for electricity, district heating or fuel use for each month. Also, if the magnitude of values reported was in disagreement with common sense (e.g., utilization of 1.1 MWh electricity/month in a 10 000 m2 property, or the amount of district heating for 11 months reported as double-digit, while a single summer month showed a triple-digit value, i.e. several times the average consumption) the data were adjusted and used. Due to the limitations mentioned above, this analysis does not include the entire Swedish branch of Scandic hotels, since some facilities still do not report to SUS. Also, a number of hotels were rejected in each annual sample due to incomplete or unrepresentative data (Table 1). Nevertheless, the authors will attempt to interpret the trends indicated by the analysis.
Table 1. Statistics for hotels analysed.
Year Properly reporting hotels Non-reporting hotels Rejected hotels 1996 44 1 5 1997 45 1 4 1998 46 0 6 1999 42 2 12 2000 46 3 14 2001 48 6 13 2002 43 6 19 2003 47 6 16
The total area of Scandic-operated properties has been fluctuating over the years following sales and acquisitions, as well as due to the refurbishment and modernisation of facilities. In a 10-year perspective, however, a trend of increasing area is evident, as indicated in Figure 2 (it has to be kept in mind that this analysis does not cover all Scandic facilities). As can be seen from Figure 2, the changes in the consumption in the Scandic chain of electricity and heating energy (space heating and domestic hot water production – DHW), is related to the fluctuations in the total area. If the energy consumption is analysed as a function of occupancy, it can be seen that the number of guests accommodated seems to have little influence on the total energy used by the chain (Figure 3).
0
20000
40000
60000
80000
100000
120000
140000
1996 1997 1998 1999 2000 2001 2002 2003
Ann
ual e
nerg
y co
nsum
ptio
n,M
Wh
0
100000
200000
300000
400000
500000
600000
Tot
al p
rope
rty
area
, m2
Total energy, MWh/yrTotal energy for heating and DHW, MWh/yrTotal property area, m2
Figure 2. Consumption at Scandic facilities of total energy and energy for space heating and domestic
hot water generation related to total property area.

_______________________________________________________________________________ Proceedings of the Regional Central and Eastern European Conference on Sustainable Building (SB04), October 27-29, 2004, Warszawa, Poland.
9
0
20000
40000
60000
80000
100000
120000
140000
1996 1997 1998 1999 2000 2001 2002 2003
Ann
ual e
nerg
y co
nsum
ptio
n,M
Wh
0
500000
1000000
1500000
2000000
2500000
3000000
Num
ber
of g
uest
nigh
ts so
ld
Total energy, MWh/yrTotal energy for heating and DHW, MWh/yrNo of guestnights sold
Figure 3. Consumption at Scandic facilities of total energy and energy for heating and domestic hot water generation related to occupancy (expressed as number of guestnights).
The correlation coefficients for the annual variations of (total energy used versus property area), (total energy used for space heating and DHW generation versus property area), and (total energy utilization versus number of guestnights sold) are relatively high. They range from 0.43 to 0.74 for the total energy used in relation to the property area, 0.11 – 0.43 for heating energy to area, and 0.35 – 0.62 for total energy vs. guestnights sold. This indicates that both property area and the amount of guests served have an impact on the overall energy consumption at a facility. Correlation factors are relatively high for the year 1996 (0.64, 0.24, and 0.57 respectively). In 1997 they drop to 0.43, 0.11 and 0.35 respectively, showing a rising tendency in subsequent years, Table 2. The results shown in Table 2 indicate that the energy management at individual Scandic facilities has improved over time. Relatively low correlation coefficients for the variations of heating energy demand to property area are most likely due to the heating demand being more dependent on climatic conditions than on property area alone. Further investigation will include an analysis of the heating demand variation as a function of climatic variations. It is also intended that further investigation will separately report the amounts of energy used for domestic hot water generation and space heating.
Table 2. Correlation coefficient, R2, for 1996-2003.
Year Total energy vs. property area
Total energy for space heating and DHW generation vs.
property area
Total energy vs. number of guestnights sold
1996 0.648 0.246 0.579
1997 0,431 0.113 0.355
1998 0.578 0.174 0.486
1999 0.619 0.230 0.529
2000 0.617 0.290 0.526
2001 0.694 0.421 0.620
2002 0.744 0.415 0.601
2003 0.742 0.432 0.603
Over time, energy saving efforts, as well as increased energy utilization efficiency have lead to a gradual decrease in total energy consumed per unit property area (see Figure 4), although the overall energy utilization in 2001 was unusually high.

_______________________________________________________________________________ Proceedings of the Regional Central and Eastern European Conference on Sustainable Building (SB04), October 27-29, 2004, Warszawa, Poland.
10
It is worth mentioning that during the first two years of the “Resource Hunt” program most of the savings achieved can be entirely attributed to education and behavioral changes among the hotel team members. Technical improvements were incorporated later.
0100200300400500
1996 1997 1998 1999 2000 2001 2002 2003
kWh/m2
Figure 4. Variations of Energy Use Index – total energy consumption per floor area, mean value and standard deviation, kWh/m2.
With regard to the energy consumption per guestnight, the downward trend, though present, is less evident. Values have not changed significantly since 1999 (see Figure 5).
020406080
100120
1996 1997 1998 1999 2000 2001 2002 2003
kWh/guestnight
Figure 5. Energy consumption as related to the number of guestnights,
mean value and standard deviation, kWh/guestnight.
The above analysis shows that Scandic corporate efforts in promoting, incorporating and enforcing energy efficiency and energy conservation have paid off. Though the hotel sample for which the data was collected does not include every single Scandic facility, it is reasonable to assume that the above conclusions may be extrapolated for the whole chain. It can also be assumed that the general trends established here would be valid for the entire chain. Similar downward trends were observed in the analyses of water consumption and waste generation patterns at Scandic, and have been presented elsewhere [26].
5. Conclusion
A decade of ecological education and training, as well as many environmental initiatives have all significantly improved the knowledge of Scandic team members and management on the environmental impacts of chain operations, as well as on appropriate strategies of environmental control and prevention. Over the same period, the environmental awareness among company employees has improved substantially. The incorporation of various efficiency and conservation measures into daily hotel operations has further resulted in a significant decrease in resource consumption, as evident from the information provided by the SUS database. After the first 24 months of implementing the “Resource Hunt” program in the Scandic Nordic facilities, a 23%-reduction (on a kWh/guestroom-used basis) in energy consumption was achieved [27]. Between 1996 and 2003, the energy consumption in the Swedish Scandic

_______________________________________________________________________________ Proceedings of the Regional Central and Eastern European Conference on Sustainable Building (SB04), October 27-29, 2004, Warszawa, Poland.
11
branch was reduced by approximately 15% on a kWh/m2 basis (with 1996 as the reference year), and approximately 12% on a kWh/guestnight basis. It is estimated that the “Resource Hunt” program generated direct financial benefits in excess of 6 MSEK (USD 800 000) in 1997 alone [14]. During the more recent Nordic Swan labelling process, the SUS database proved to be an invaluable source of data covering a number of consecutive years. Such information is necessary to estimate the degree of compliance with Nordic Swan requirements with regard to the consumption of energy, water and chemicals, as well as waste generation. While it is expected that Nordic Swan certification will stimulate additional improvements in performance, these effects may take some time to show. Scandic’s strong environmental commitment has already earned the chain global brand recognition. Scandic’s competitive advantage is bound to increase even more, once Scandic has achieved its goal of becoming the first international hotel chain to eco-certify all of its facilities with a label awarded by an independent cognizant authority. Scandic’s environmental program has substantially improved the quality of the employees’ working environment. It has also stimulated a couple of thousand staff to become more environmentally responsible. Scandic team members express pride in their environmental achievements, environmental training programs, the incorporation of pro-ecological measures in their daily working routines, as well as the KRAV- and SWAN-labelling of chain services. In terms of environmental performance Scandic has gone a long way since the beginning of the 1990s and can now serve as a role model for Hilton and other hotel chains, convincingly showing that environmental commitment does make good business sense.
Acknowledgement
The authors would like to acknowledge the financial support of Energimyndigheten (Swedish Energy Agency) which finances the doctoral research project in progress at the Royal Institute of Technology in Stockholm, Sweden, of which this survey was an integral part. The authors would also like to thank all Scandic hoteliers that dedicated their time to participate in this survey, as well as JanPeter Bergkvist, Anders Hedin and Wilhelm Hardt at Hilton International and Scandic Headquarters who provided us with access to and training relevant to the Scandic Utility System and Hilton Environmental Reporting, and who always willingly answered all our questions.
References
[1] Energimyndigheten, Statistiska Centralbyrån, ”Energistatistik för lokaler 2002 – Energy statistics for non-residential premises in 2002”, Sveriges Officiela Statistik – Statistiska Meddelanden, EN 16 SM 0301, Sweden 2003, pp.4. [2] Energy Information Administration, “A look at commercial buildings in 1995: characteristics, energy consumption, and energy expenditures”, DOE/EIA-0625(95), Distribution Category UC-950, Office of Energy Markets and End Use, U.S. Department of Energy, Washington 1998.
[3] European Commission Directorate General XXIII, “Facts and figures on the Europeans on holidays 1997-1998”, European Commission, Brussels 1998, pp.8. [4] INTUR, “Korzystający z bacy noclegowej”, Instytut Turystyki, available at www.intur.com.pl, last modified 4.05.2004, as accessed, 23.06.2004. [5] Turistdelegationen, “Tourism in Sweden 2004”, Swedish Tourist Authority, Stockholm 2004, pp.23. [6] World Tourism Organization, “Tourism Market Trends - 2003 Edition, World Overview and Tourism Topics”, Madrid, Spain, pp.11.

_______________________________________________________________________________ Proceedings of the Regional Central and Eastern European Conference on Sustainable Building (SB04), October 27-29, 2004, Warszawa, Poland.
12
[7] CHOSE, “Energy savings by combined heat cooling and power plants (CHCP) in the hotel sector”, Report of the Commission of the European Communities, Directorate General for Energy, Contract No XVII/4.1031/Z/98-036, May 31, 2001, p.3-6. [8] Volker Quaschning, “Regenerative Energisysteme”, Carl Hanser Verlag Munchen, 2003
[9] National Energy Foundation, Emission Calculator [online], updated 3 January 2003. Available from World Wide Web: (http://www.natenergy.org.uk/convert.htm), as accessed 15.06.2004. [10] Energimyndigheten, Statistiska Centralbyrån, ”Energistatistik för lokaler 2002 - Energy statistics for non-residential premises in 2002”, Sveriges Officiela Statistik – Statistiska Meddelanden, EN 16SM 0301, Sweden, p.23-26.
[11] Johnson C., Iunius R.F., Competing in Central Eastern Europe: perspectives and developments. International Journal of Hospitality Management (1999) 18, pp. 245-260. [12] Olszewski K., Świat hoteli 6 (2003), Brog Media Biznesu, Warszawa, Poland, pp.29. [13] WTTC, IFTO, IH&RA, ICCL, “Industry as a partner for sustainable development – Tourism”, Report prepared by World Travel & Tourism Council, International Federation of Tour Operators, International Hotel & Restaurant Association, International Council of Cruise Lines and UNEP. The Beacon Press, Great Britain 2002, pp.33. [14] Nattrass B., Altomare M., “The Natural Step for businesses: wealth, ecology and the evolutionary corporation”, New Society Publishers, Gabriola Island, BC 1999, pp. 75-100. [15] Scandic Hotels, “Scandic environmental construction standard: sustainable construction and renovations at Scandic”. Version 0.9 published November 14, 2001. Scandic AB, Hilton International Nordic Region, Sweden 2001. [16] Hardt W., E-mail communication with Wilhelm Hardt, Environmental Coordinator at Hilton International and Scandic, March 17, 2004. [17] Scandic, “Environmental common sense – that’s sustainability in practice”. Scandic AB, Hilton International Nordic Region, Sweden 2003. [18] Hardt W., Personal communication with Wilhelm Hardt, Environmental Coordinator at Hilton International and Scandic, February 18, 2004. [19] Bergkvist J.P., Personal communication with Jan-Peter Bergkvist, Director of Environmental Sustainability at Hilton International and Scandic, March 12, 2003.
[20] Nordic Ecolabelling, Nordic Swan webpage. SIS Miljömärkning. Available at www.svanen.nu, as accessed 23.06.2004. [21] Bergkvist J.P., Personal communication with Jan-Peter Bergkvist, Director of Environmental Sustainability at Hilton International and Scandic, May 12, 2004. [22] Bohdanowicz P., Martinac I., Attitudes towards sustainability in chain hotels – Results of a European survey, Proceedings of the CIB International Conference on Smart and Sustainable Built Environment, November 19–21, 2003, Brisbane, Australia. [23] Bohdanowicz P., A study of environmental impacts, environmental awareness and pro-ecological initiatives in the hotel industry, Licentiate Thesis. Department of Energy Technology, Royal Institute of Technology, Stockholm, Sweden, December 2003.
[24] HER, Hilton Environmental Reporting database, Hilton intranet. [25] SUS, Scandic Utility System database, own analysis [26] Bohdanowicz P., Simanic B., Martinac I., Environmental training and measures at Scandic hotels, Sweden, Proceedings of the BEST Sustainable Tourism Think Tank IV: "Sustainability and Mass Destinations: Challenges and Possibilities", July 1-4, 2004, Esbjerg, Denmark; also submitted to International Journal of Tourism Reviews - Special Issue. [27] Scandic Hotels, “Annual report 1999”. Scandic AB, Sweden 2000, pp.14.

Paper VI

Tourism Review International, Vol. 9, pp. 7–19 1544-2721/05 $20.00 + .00Printed in the USA. All rights reserved. Copyright © 2005 Cognizant Comm. Corp.
www.cognizantcommunication.com
7
Address correspondence to Paulina Bohdanowicz, Sustainable Building Systems, Department of Energy Technology, Royal Instituteof Technology, Brinellvägen 66, 100 44 Stockholm, Sweden. Tel: +46 8 790 7682; Fax: +46 8 20 41 61; E-mail:[email protected], URL: www.greenthehotels.com
ENVIRONMENTAL TRAINING AND MEASURES AT
SCANDIC HOTELS, SWEDEN
PAULINA BOHDANOWICZ, BRANKO SIMANIC, and IVO MARTINAC
Sustainable Building Systems, Department of Energy Technology, Royal Institute of Technology, Sweden
Abstract: Mass tourism destinations and facilities, accounting for the most significant share of theglobal tourism market, are still largely managed with little or no environmental concern. The willing-ness and ability of facility management and staff to adopt greater environmental awareness and re-sponsibility is crucial in striving towards a higher degree of sustainability in the tourism sector. Theaim of this article is to provide an overview of the environmental proactiveness and ground-breakingwork that has been carried out within the Scandic hotel chain over the past decade. This is an accountof how environmental responsibility can become a top corporate priority and lead to significantlydecreased environmental impacts, excellent economic performance, and a considerably upgradedenvironmental image.
Key words: Scandic; Hotels; Environmental sustainability; Environmental program; Sweden;Resource consumption
tions and facilities, accounting for the most sig-nificant share of the global tourism market, are stilllargely managed with little or no environmentalconcern. The accommodation sector is one of themost economically important stakeholders in thetourism industry, and a significant contributor tothe overall environmental degradation at mass des-tinations. Future sustainability discussions and en-vironmental work should be more balanced, andto a much greater degree cater to the obvious needsand problems in mass tourism accommodations anddestinations.
Introduction
Ecotourism, including ecotourism destinationsand facilities, is a widely favored theme in discus-sions related to sustainable tourism. However, ac-cording to the World Tourism Organization,ecotourism and all nature-related forms of tourismrepresent only one fifth of total international travel(TIES, 2000). Eco-resorts are typically designedand operated with environmental responsibility, ca-tering to an equally conscious and appreciating cli-entele. On the other hand, mass tourism destina-

8 BOHDANOWICZ, SIMANIC, AND MARTINAC
Hotels are traditionally geared towards providinga high level of comfort and entertainment, as wellas a broad spectrum of services, often without giv-ing much concern to associated environmental orsocioeconomic impacts. Hotel companies typicallycompete on a global market by offering more com-fortable and spacious accommodation, diversifiedfoods, more sophisticated services, entertainmentetc., commonly leading to the overexploitation ofenergy and other resources. At the same time, thenumbers of customers, including tourists, activelychoosing products or companies that are environ-mentally responsible is constantly growing, espe-cially in Northern and Western Europe. In responseto such growing demand, hotel companies shouldchange their attitudes and become more environmen-tally conscious.
The willingness and ability of hotel managementto advocate and implement state-of-the-art environ-mentally responsible behavior and practices is, how-ever, crucial for the incorporation of more sustain-able hotel practices. Hotel corporations/chains,representing 20–29% of all hotels in Europe and asmuch as 70% in North America (Johnson & Iunius,1999; Olszewski, 2003; WTTC, IFTO, IH&RA, &ICCL, 2002), may come to play a very importantrole in changing the overall environmental imageand performance of the hotel sector, as they typi-cally operate facilities catering to mass travel. Cur-rently, environmental responsibility is often regardeda corporate issue, and various proecological initia-tives originating from central management are in-creasingly implemented at different corporate lev-els. The aim of this article is to provide an overviewof the environmental proactiveness and ground-breaking work that has been carried out within theScandic chain (henceforth referred to as Scandic)over the past decade. This is an account of how en-vironmental responsibility can become a top corpo-rate priority and lead to significantly decreased en-vironmental impacts, excellent economicperformance, and a considerably upgraded environ-mental image.
Scandic is one of the largest hotel chains inScandinavia with 65 facilities in Sweden and a totalof over 150 in Northern Europe and the Baltic Searegion. Scandic’s well-established and widely rec-ognized presence in most strategic tourist and busi-ness destinations in Scandinavia made the company
an attractive acquisition object for Hilton Interna-tional, a part of the Hilton Group Plc, who acquiredthe chain in 2001. Currently, Scandic is a vital partof Hilton, and a role model in the area of environ-mental and social initiatives. If successful, these maycome to be implemented in over 400 Hilton-oper-ated establishments located in key mass tourismdestinations all over the world. A global marketingalliance between Hilton International and the NorthAmerican-based Hilton Hotels Corporation (HHC)extends the number of hotels operated by both com-panies worldwide to over 2400.
A number of previous studies have dealt with re-source consumption in hotels, typically focusing ona specific type of resource, such as energy or water(Asia Pacific Sustainable Development Center[APSDC], 1999; Deng, 2003; Deng & Burnett, 2000,2002a, 2000b; Stipanuk, 2003a, 2003b). Hotel com-panies and corporations publish resource consump-tion indicators and guidelines in their annual reportsand manuals (Accor Group, 1998; Scandic, 2000;Radisson SAS, 2002; Sånga Säby Course and Con-ference [SSCC], 2003). Similarly, hotel and tour-ism associations and certification organizations de-velop resource consumption indicators, as well asbenchmarking guidelines and tools (Green Globe 21,2004; International Hotel Environmental Initiative[IHEI], n.d.; Nordic Ecolabelling, 2002).
Methods
A comprehensive literature review was comple-mented by interviews with key corporate managers,including Jan-Peter Bergkvist, Director of Environ-mental Sustainability at Hilton International andScandic; Wilhelm Hardt, Environmental Coordina-tor; and Anders Hedin, Project Manager, Project andMaintenance, at Hilton Scandic Nordic region. Ananalysis of the Scandic Utility System database wasperformed, and a survey among hotel managers andteam members carried out at Scandic, Sweden(Bohdanowicz, 2003; Bohdanowicz & Martinac,2003). The authors also had the opportunity to par-ticipate in an environmental training session at Scandicduring February 2004. Scandic collectively refer totheir hotel personnel (staff and management) as “teammembers,” and this term will be used in this article.
The Scandic Utility System (SUS, active 1996–2003) is a data-collecting system developed and in-

ENVIRONMENTAL TRAINING AND MEASURES AT SCANDIC HOTELS 9
corporated to help in keeping track of resource useand changes over time. Scandic hotels are requiredto send monthly reports documenting the consump-tion of electricity for appliances and heating, energyin the form of district heating and cooling, fuels forheating and other purposes (oil, propane/butane,towngas, LPG), water, and unsorted waste, as wellas a number of other key parameters (property area,number of guest-nights, turnover). For the purposeof this analysis, only Swedish Scandic hotels pro-viding complete monthly reports on energy-,water-, and waste-related data and number of guest-nights were selected. Hotels missing at least onemonthly report in any category were rejected. Inaddition, any hotel reporting identical values of elec-tricity, district heating, fuel, or water use for eachmonth was rejected. Constant values for waste gen-eration were accepted in the analysis, leading how-ever to a certain bias in the results. On the other hand,if the reported values appeared unreasonable (i.e.,1.1 m3 water/month for a 10,000-m2 property) ordistrict heating reported for 11 months as double-digit, while a single summer month scored a triple-digit value (i.e., appreciably above average), thevalues were corrected and the data used. Due to thelimitations mentioned above, this analysis does notinclude the entire Swedish branch of Scandic ho-tels. Some hotels did not report to SUS, while a num-ber of hotels were rejected in each annual sampledue to incomplete or unrepresentative data (Table1). Nevertheless, the authors will attempt to inter-pret the trends depicted by the analysis.
The other source of information in the form of asurvey questionnaire was developed based on a com-prehensive literature review. It was comprised of 23
multiple-choice questions, occasionally supple-mented by open-ended follow-up comments in-cluded for clarification. Two questions required therespondents to rank their answers using a 6- and 7-point Likert scale of importance (1 = least impor-tant, 6 or 7 = most important). A survey question-naire was distributed among the hotel team membersby way of e-mail during the months of October toDecember 2002. An additional questionnaire surveywas carried out among hotel managers in June 2003,with the support of the Scandic environmental de-partment (Bohdanowicz, 2003).
All 65 Swedish Scandic hotels and four SwedishHilton hotels (operating at that time) were targeted.Forty-nine correctly and completely filled-in formswere collected, accounting for an effective responserate of 71%. Other mail- and interview-based sur-veys conducted among the staff/operators of the hotelindustry had populations between 65 and 600 busi-nesses, and yielded a response rate ranging from 12%to 80% (Langer, 1996; Schmidgall, Damitio, &Singh, 1997), with the majority of cases having aresponse rate between 20% and 35% (Medina-Munoz & Garciá-Falcon, 2000; Nankervis &Debrah, 1995; Pizam & Thorburg, 2000; Schmidgall& DeFranco, 1998; Verginis & Wood, 1999). Mostof these surveys involved human resource manage-ment and budgeting/forecasting issues. The environ-mental awareness study performed among 301 ho-teliers in Guernsey in the Channel Islands yielded aresponse rate of 45% (Stabler & Goodall, 1997). Therelatively high response rate obtained in the Scandicstudy indicates that the survey was taken seriously.The trends observed may, therefore, be consideredrepresentative of the Swedish branch of the Scandicchain. Results obtained from both sources indicatethat the environmental training and work carried outat Scandic are producing very encouraging results.
The Development of anEnvironmental Program at Scandic
In 1993, Scandic management decided to accen-tuate environmental issues with the aim to become“one of the most environmentally friendly hotelchains.” Environmental education and initiativesquickly became a fundamental part of the Scandicagenda, and consequently the goal “to become themost resource-efficient hotel company” was estab-
Table 1
Statistics of Analyzed Hotels, Number of Hotels
Properly Nonreporting RejectedYear Reporting Hotels Hotels Hotels
1996 44 1 51997 45 1 41998 46 0 61999 42 2 122000 46 3 142001 48 6 132002 43 6 192003 47 6 16

10 BOHDANOWICZ, SIMANIC, AND MARTINAC
lished. Scandic aims at achieving this “whilst retain-ing or increasing comfort and customer benefit.” In1994, Roland Nilsson, CEO of Scandic Hotels AB,contacted Karl-Henrik Robèrt at The Natural Stepand found their concept to be suitable for develop-ing the New Scandic profile. Scandic subsequentlydeveloped their training program “The Environmen-tal Dialogue,” based on The Natural Step (Nattrass& Altomare, 1999). The Natural Step defines its basicconcept as follows:
In a sustainable society, nature is not subject to sys-tematically increasing . . .
. . . concentrations of substances extracted from theEarth’s crust (use all mined materials efficiently, andsystematically reduce dependence on fossil fuels);
. . . concentrations of substances produced by society(substitute persistent and unnatural compounds withones that are normally abundant or break down moreeasily in nature, and use all substances produced bysociety efficiently);
. . . degradation by physical means (use only resourcesfrom well-managed eco-systems, and use both re-sources and land more efficiently);
and in that society . . .
. . . human needs are met worldwide (use all resourcesfairly and responsibly so that the needs of all peopleon whom we have an impact, and the future needs ofpeople who are not yet born, stand the best chance ofbeing met). (Scandic, 2001)
The four components of the initial program in-cluded an environmental guide, environmental meet-ings, an environmental program, and an environmen-tal barometer. The environmental guide includes adescription of the environmental dialogue process,the Scandic environmental policy and goals, infor-mation on current activities, and suggestions aimedat stimulating environmental concern, and is pro-vided to all employees joining the Scandic team. Ithas been developed as an e-learning program, andsince 2001 a new version is available on the“Kunskapsportalen” intranet platform in Scandichotels in Sweden, Denmark, Finland, and Norway.The environmental training pack is included in the“Get on Board” section, also termed “checkin@scandic,” together with a welcome note and shortsecurity and service training package.
The interactive environmental training programincludes information on personal and hotel-related
dependence on natural resources, as well as impactsgenerated. It also proposes a series of questions con-cerning personal attitude towards appropriate envi-ronmental behavior and recommendations how tobe more environmentally conscious. Several inter-mediate tests are included to facilitate the under-standing of previously covered issues. The trainingprogram is initiated with a short overview of the his-tory of life on Earth and human dependence on natu-ral resources. Then the Natural Step concepts areintroduced and explained. Thereafter, informationis divided into categories dealing with energy, wa-ter, waste, and chemicals, their consumption andpossible conservation options, including most envi-ronmentally sound choices, as well as informationabout the suppliers’ role in the overall environmen-tal performance, followed by an explanation of eco-labels, as well as information on organic and eco-food. The concept of environmentally soundtransportation is also examined, together with theutilization of building materials at Scandic. Most ofthe issues are analyzed from a Scandic perspectiveand all Scandic-specific concepts are introduced andexplained (i.e., 97% recyclable room, Scandic En-vironmental Construction Standard). RelevantScandic success stories are also presented. Traininglasts for approximately 2 hours, but does not haveto be performed all at once. Every hotel is equippedwith a computer dedicated solely to the purpose oftraining team members, enabling personnel to visit“Kunskapsportalen” at a time suitable to them. Atthe conclusion of the training program, a 10-minutetest is given, and upon the successful completion ofthis test (which can be repeated as many times asnecessary) team members will receive employmentbenefits (staff card).
While long-term Scandic employees generallytreat the issue of environmental training as part ofthe company’s own culture, new team members gen-erally need time to become acquainted with this prac-tice. Nevertheless, the majority of Scandic employ-ees are proud to work in a company that has clearlydefined environmental goals and programs. W.Hardt, Environmental Coordinator at Hilton ScandicNordic (personal communication, March 9, 2005),indicated that 2688 out of 3145 persons employedat Scandic have successfully completed the basicenvironmental training program. For team membersinterested in expanding their environmental knowl-

ENVIRONMENTAL TRAINING AND MEASURES AT SCANDIC HOTELS 11
edge, complimentary courses are arranged at theScandic Business School, approximately once a year.Experts from The Natural Step and other environ-mental organizations are invited to lecture, togetherwith members from the top management at Scandic.Initially, these courses were very popular, particu-larly among long-term employees. However, as allScandic hotels have successfully implemented theNordic Swan labeling of their facilities,1 fewer par-ticipants are inclined to participate (W. Hardt, per-sonal communication, February 18, 2004). However,this does not indicate a decrease in environmentaleducation, as during the process of Swan labelingteam members receive a considerable amount ofknowledge on environmental protection.
An environmental meeting is scheduled 1 weekafter receiving the environmental guide. Alterna-tively, interactive environmental training is per-formed in a group. The meeting should ultimatelyresult in the development of an environmental pro-gram—an action plan designated for the implemen-tation of a number of improvements at a particularhotel. The environmental meeting is also treated asa forum for the environmental coordinators from allScandic hotels, who can regularly meet in order todiscuss various issues.
The environmental program is displayed in everyhotel in the area accessible to team members only. Itdivides activities into three categories: those alreadyaccomplished, those in progress or at a researchstage, and those requiring significant capital invest-ment and consequently included in long-term bud-geting/planning. A responsible person is designatedand a deadline set for the completion and incorpo-ration of each activity. The action plan is constantlyupdated in an effort to ensure continuous qualityperformance. The presence of individual hotel en-vironmental programs proved to be very useful dur-ing the eco-labeling of hotels, as this was one of therequirements stated by the Nordic Swan eco-certifi-cate. The environmental barometer was developedas a semiannual or annual publication containingstatus reports from every hotel, summarizing howparticular facilities have succeeded in meeting thegoals set in the environmental program. It is not cur-rently used because the hotels are being assessedaccording to the Nordic Swan criteria.
In 1995, a more sophisticated benchmarking tool,the environmental index, was developed. Approxi-
mately 60 environmental measures were identifiedin nine areas, defining how specific operations atScandic should be conducted, based on an ideal casescenario. The environmental index is currently notimplemented; instead criteria from the Nordic Swaneco-label are used. In order to focus more on re-source use efficiency, the “Resource Hunt” Programwas initiated. A specific and detailed action planwithin the “Resource Hunt” Program has been de-veloped by each hotel, dividing activities into thoseimmediately incorporated, those requiring furtherinvestigation and/or capital investment, and thoseproposed to become a corporate target. The successof the “Resource Hunt” at a particular hotel is de-pendent on the commitment of individual team mem-bers or environmental groups responsible for theincorporation of an action plan. A computer data-base, the Scandic Utility System, was developed andincorporated to allow for the monitoring of resourceconsumption. The “Resource Hunt” Program in-cludes an employee reward system, where monetaryrewards are transferred to a special fund at the hoteland allocated for various activities designated foruse by hotel team members. The Scandic environ-mental department has further developed the Bestin the Class system (BINC) based on SUS and mea-suring 18 key indicators over time intervals of dif-ferent length. The results achieved are displayed inthe team members’ access areas at each facility.
In the next stage, Scandic decided to involve theirsuppliers in the environmental program, and com-mitted to purchasing products with a low (life cycle)environmental impact. All new suppliers were ex-pected to document their corporate environmentalpolicies, and were required to sign the Scandic Sup-plier Declaration. From 2004, all Scandic suppliersare requested to sign the Declaration (W. Hardt, per-sonal communication, March 17, 2004). Accordingto Scandic’s Director of EnvironmentalSustainability, the company successfully persuadedproducers and suppliers to make their products moreenvironmentally friendly (low-energy lamps manu-factured by Auralight and Ahlsell) and even eco-cer-tify them (chemicals from Ecolab and liquid soapfrom Diversey Lever) (J.-P. Bergkvist, personal com-munication, March 12, 2003; W. Hardt, personalcommunication, March 17, 2004). Since 2000, mostScandic hotels in Sweden have been powered byhydro-based electricity. In January 2004, an official

12 BOHDANOWICZ, SIMANIC, AND MARTINAC
contract was signed with Vattenfall (one of the mainenergy suppliers in Sweden), and currently all Swed-ish Scandic facilities are supplied with “green” elec-tricity (generated by hydro- or wind-powered plants),thereby further reducing the corporate environmen-tal impact (W. Hardt, personal communication, Feb-ruary 18, 2004). Since 2001, all Scandic facilities inSweden offer KRAV-certified breakfasts, implyingthat at least 11% of all meals served in breakfastbuffets are KRAV-labeled2 (Scandic, 2004). Scandichas also recognized the continuous retrofitting of itsfacilities as an excellent opportunity of further re-ducing environmental impacts. In 1995, Scandicintroduced the concept of a 97% recyclable hotelroom, also termed eco-room. Materials used in roomsare 97% recyclable and include wooden floors andfurniture, pure wool or cotton textiles, and very fewfittings made of chrome, metal, or plastic (Scandic,2001). Currently more than 10,000 rooms in theScandic stock are 97% recyclable (W. Hardt, per-sonal communication, February 18, 2004).
Scandic has additionally developed its own Envi-ronmental Construction Standard, listing materialsthat may not be used in their facilities, and specify-ing acceptable alternatives (Scandic, 2001). Thebasic concept of any project should be the 4Rs rule:reuse–renovate–recycle–reconstruct, as well as docu-menting all materials and products used. Further-more, all materials and equipment should be resourceeffective/efficient and sustainable in a life cycle per-spective. Materials containing or suspected of emit-ting potentially harmful substances must not be used.On the other hand, eco-labeled materials should al-ways be given purchase priority. More specifically,no PVC, synthetic flooring, furniture, or textiles areallowed to be used in Scandic hotels. Exotic woodtypes are also “checked out,” while the use of localand, preferably, eco-labeled wood and furniture isencouraged. Paints, varnishes, and oils containingorganic solvents should be substituted with water-based solvents wherever possible. Swan-labeledwallpaper is a preferable choice as well. Demand-controlled heating, ventilation, and air-conditioningsystems should be incorporated and equipped withenergy recovery at every air-handling unit. CFC- andHCFC-based refrigerants must not be used at all.Electricity should not be used for heating purposes,with the exception of direct electric floor heating inbathrooms. Whenever possible, lighting should be
demand controlled, and based on compact fluores-cent lamps (CFLs). Hotel rooms should be equippedwith main electricity switches connected to magnetickey cards. Only low-energy and water-efficientequipment is allowed. The use of eco-cotton, as wellas Swan- and KRAV-labeled textiles and leather ishighly encouraged. Finally, the following construc-tion substances cannot be used at any stage of hotelconstruction and operation: lead, glycol ether, chlo-rine paraffines, acrylates, isocyanates, epoxi, form-aldehyde, coal tar, and buthylhydroxytoluen.
At the onset of the millennium there was a com-mon feeling among Scandic team members that, inthe aftermath of the intense proecological efforts ofthe mid-1990s, environmental issues were not re-ceiving enough attention. In an effort to bring envi-ronmental matters back to focus, corporate manage-ment decided to eco-certify all of their Swedishfacilities with a Nordic Swan eco-label by the endof 2004 (Scandic, 2003). This decision was highlyappreciated by Scandic team members, and allScandic (65) and two Hilton facilities in operationin Sweden are currently Nordic Swan-labeled (Nor-dic Ecolabelling, 2005). According to the Directorof Environmental Sustainability at Hilton Interna-tional and Scandic, all 18 Norwegian Scandic ho-tels are expected to be Swan-labeled by the end of2005 (J.-P. Bergkvist, personal communication, May12, 2004). Currently, four hotels are already certi-fied (Nordic Ecolabelling, 2005).
A network of environmental coordinators has beencreated to facilitate participation in various activi-ties. Feedback on facility performance is continu-ously provided to team members through variouspublications, as well as by means of the Scandicintranet. Environmental performance is further com-municated to guests and the general public througha number of channels, including the “Environmen-tal Corner,” hotel TV, a booklet entitled “TheEcoLogical Choice,” notices displayed in variousparts of hotel rooms, the company web page, as wellas annual reports, containing sections devoted solelyto environmental activities undertaken at Scandic.
Results
As a result of many years of environmental workand training, the environmental performance atScandic hotels has improved significantly. After the

ENVIRONMENTAL TRAINING AND MEASURES AT SCANDIC HOTELS 13
first 24 months of implementing the “ResourceHunt” Program in the Scandic Nordic facilities, a23% reduction (on a kWh/guestroom-used basis)in energy consumption was achieved (Scandic,2000). Between 1996 and 2003, energy consump-tion in the Swedish Scandic branch was reducedby approximately 19% on a kWh/m2 basis (with1996 as a reference year), as indicated in Figure 1(NB: only properly reporting hotels are includedin the analysis). The overall decrease in energyconsumption over time was found to be statisticallysignificant.3 During this time, more energy-efficientsystems (including air conditioning systems inguestrooms and conference halls, as well as officeequipment and relaxation facilities) and serviceswere introduced in most Scandic facilities. Somemodernization and refurbishment work was alsoperformed, including the installation of controlsystems for ventilation, space conditioning, and in-room electricity (in some facilities), as well as en-ergy-efficient light fixtures. These measures re-sulted in a significant decrease in the overall energyconsumption.
At 267.91 kWh/m2, the average energy consump-tion in Scandic facilities during 2003 was within thelimits defined by Nordic Ecolabelling for Nordic-Swan-certified facilities, specifying a maximum of280-420 kWh/m2 for Class A establishments locatedin Sweden, and 250–390 kWh/m2 for Class B facili-ties4 (Nordic Ecolabelling, 2002). The 2003 Scandicfacility average was also lower than the EUI value
of 320–345 kWh/m2 recommended for AccorMercure and Novotel hotels located in temperate andcontinental climates (Accor Group, 1998).
In terms of energy consumption on a kWh/guest-night basis, the overall reduction achieved in theperiod investigated was 15%, and the change wasstatistically significant. The consumption fluctuatedover the years, as indicated in Figure 2 (NB: onlyproperly reporting hotels are included in the analy-sis). Nevertheless, the value of 48.73 kWh/guest-night reported for 2003 is lower than the baselinevalue (133 kWh/guest-night) and the best practicebenchmark value (61.1 kWh/guest-night) specifiedfor hotels in Sweden (Green Globe 21, 2004). Fig-ure 2 documents periods when the energy use perguest-night decreased with increasing arrivals. Thisis interpreted as reflecting the energy base load be-ing distributed over a greater number of guest-nights.Decreasing energy consumption during times of rela-tively constant or decreasing arrivals is seen as trulyreflecting greater energy efficiency.
During the first 24 months of implementing the“Resource Hunt” Program, the overall reduction inwater consumption on a Scandic Nordic corporatebasis was estimated at 12%, while the amount ofunsorted waste decreased by 38% (Scandic, 2000).Between 1996 and 2003, water consumption in theSwedish Scandic branch was reduced by approxi-mately 6% on a liter/guest-night basis (with 1996 asa reference year), as indicated in Figure 3 (NB: onlyproperly reporting hotels are included in the analy-
Figure 1. Changes in energy consumption at Scandic in Sweden 1996–2003, specific energyconsumption in kWh/m2.
267.9266.7
296.6279.1
294.1305.9
317.7330.5
0
50
100
150
200
250
300
350
1996 1997 1998 1999 2000 2001 2002 2003
En
erg
y co
nsu
mp
tio
n, k
Wh
/m2
average energy consumption per unit area, kWh/m2

14 BOHDANOWICZ, SIMANIC, AND MARTINAC
sis). This difference is not statistically significant.The value of 239 L/guest-night is below the limitsspecified by the Nordic Swan criteria (250–300 L/guest-night depending on the type of establishment)(Nordic Ecolabelling, 2002). This value is also lowerthan the baseline and best practice values providedby Green Globe 21 (700 L/guest-night and 500 L/guest-night, respectively), as well as the values re-ported by other hotel chains (440 L/guest-night atRadisson SAS) (Green Globe 21, 2004; RadissonSAS, 2002).
The green purchasing policy included in Scandic’senvironmental program successfully prevented thedisposal of 200 million items of dispensable pack-aging over a period of 7 years (1995–2001), whichsignificantly reduced the overall amount of wastegenerated (Scandic, 2004). Between 1996 and 2003the amount of unsorted waste decreased by approxi-mately 48% on a kg/guest-night basis (with 1996 asa reference year), as indicated in Figure 4 (NB: onlyproperly reporting hotels are included in the analy-sis). The difference is statistically significant. The
Figure 2. Changes in energy consumption at Scandic in Sweden 1996–2003, specific energyconsumption in kWh/guest-night compared to the number of guest-nights sold.
48.746.1
48.644.546.5
50.0
60.557.1
2687538
2629693
2832089
27656952519393
2661416
22084492223525
0
10
20
30
40
50
60
70
1996 1997 1998 1999 2000 2001 2002 2003
En
erg
y co
nsu
mp
tio
n,
kWh
/gu
est-
nig
ht
0
500000
1000000
1500000
2000000
2500000
3000000
Nu
mb
er o
f g
ues
t-n
igh
ts
average energy consumption per guest-night, kWh/guest-nightnumber of guest-nights sold
Figure 3. Changes in water consumption at Scandic in Sweden 1996–2003, specificwater consumption in liters/guest-night compared to the number of guest-nights sold.
254282
223 216234 232 239
227
26875382629693
28320892765695
25193932661416
22084492223525
0
50
100
150
200
250
300
1996 1997 1998 1999 2000 2001 2002 2003
Wat
er c
on
sum
pti
on
,
L
/gu
est-
nig
ht
0
500000
1000000
1500000
2000000
2500000
3000000
Nu
mb
er o
f g
ues
t-n
igh
ts
average water consumption per guest-night, L/guest-nightnumber of guest-nights sold

ENVIRONMENTAL TRAINING AND MEASURES AT SCANDIC HOTELS 15
value of 0.47 kg of unsorted waste produced perguest-night is lower than the Nordic Swan limit of1–1.5 kg/guest-night (Nordic Ecolabelling, 2002).The average quantity of unsorted waste for RadissonSAS hotels was reported as 3.1 kg/guest-night in2002, with Scandinavian and German facilities pro-ducing considerably less waste (1.5 kg/guest-night)than the corporate average (Radisson SAS, 2002).On the other hand, best practice in waste minimiza-tion and recycling has shown that waste generationcan be limited to 50 g of unsorted waste per guest-night (SSCC, 2003). As a result of corporate policyconcerning eco-breakfasts, over 580 metric tons ofecological food are served annually at Scandic fa-cilities, including 14 million cups of ecological cof-fee (Scandic, 2004).
The creation of a SUS database allowed for thecontinuous tracking of changes in resource consump-tion patterns, and has been very useful during theNordic Swan certification process. It should be men-tioned that all resource use reductions achieved dur-ing the first 2 years of the “Resource Hunt” Pro-gram were achieved entirely by behavioral andattitude changes among the team members. Tech-nological solutions were incorporated later.
The results of an independent survey performedamong Scandic managers further confirmed the ben-efits of corporate proecological policy. All respon-dents in the survey emphasized that environmentalprotection was essential for the performance andfurther development of the tourism industry. They
furthermore believed that environmental impactscaused by hotels were medium to significant (me-dium 56.3%, significant 43.7%), and expressed aserious concern for the environment. The results ofcorporate efforts in promoting environmental aware-ness are additionally apparent as more than 79% ofrespondents declared having some knowledge ofactivities aimed at developing “greener” hotels (75%listed at least one improvement possibility). All butone respondent declared having some knowledgeabout institutions dealing with environmental issuesin the hotel industry. In fact, 40 respondents wereable to mention various organizations by name.
All hoteliers declared to be involved in some typeof environmentally oriented activity. Thirty-eightmanagers mentioned having an individual Environ-mental Policy Statement. Because up to 75% of theenvironmental impacts caused by the lodging indus-try are estimated to originate from the excessiveconsumption of nondurable goods (and consequentwaste generation), as well as the use of energy andwater (APAT, 2002), these areas are those most fre-quently targeted by environmental measures. Allrespondents declared being involved in energy-sav-ing measures (primarily energy-efficient lighting),along with some type of environmentally respon-sible waste management. Water conservation mea-sures ranked second, with 95.8% of the respondentsacknowledging their involvement.
When asked to rank on a 7-point Likert scale theincentives most likely to stimulate them in conduct-
Figure 4. Changes in unsorted waste generation at Scandic in Sweden 1996–2003, specific un-sorted waste generation in kilograms/guest-night compared to the number of guest-nights sold.
0.470.470.480.490.510.54
0.91
0.7
2687538
2629693
2832089
2765695
2519393
2661416
2208449
2223525
0
0,1
0,2
0,3
0,4
0,5
0,6
0,7
0,8
0,9
1
1996 1997 1998 1999 2000 2001 2002 2003
Un
sort
ed w
aste
gen
erat
ion
, kg
/gu
est-
nig
ht
0
500000
1000000
1500000
2000000
2500000
3000000
Nu
mb
er o
f g
ues
t-n
igh
ts
average unsorted waste generation per guest-night, kg/guest-nightnumber of guest-nights sold

16 BOHDANOWICZ, SIMANIC, AND MARTINAC
ing environmentally oriented activities, the hotelierscollectively mentioned customer expectation as theirtop priority, followed by their own commitment tomitigate environmental impacts. For the purpose ofanalysis the average was calculated and presentedin Figure 5. Due to a relatively low demand fromcustomers, hoteliers are currently giving eco-friend-liness low priority in their marketing efforts. Never-theless, 79% of respondents mentioned that infor-mation relevant to their environmental work is beingused as a marketing tool. Scandic’s efforts towardsgreater corporate responsibility have received inter-national recognition, and the chain has received anumber of prestigious environmental awards fromdifferent industry associations (Scandic, 2004). Thecompany received the “Environmental Stand Award”in 1995 and the “Greening the Business” TourismAward in 1996. The eco-room concept was giventhe ‘‘1999 European Design and DevelopmentAward.” The International Hotel and RestaurantAssociation named Scandic as “Highly Recom-mended” in 2001, and the chain received the “Envi-ronmental Award” in 2002.
The Importance of Role Models
One of the greatest barriers preventing hoteliersfrom promoting “greener” establishments is a wide-spread (and equally misleading) belief that environ-mental measures are prohibitively expensive. Thisattitude was encountered by the author in numerousinterviews with the industry. While the necessarymodifications in technology may require substan-tial investments, behavioral and operational changescan often be achieved at no or minimal costs. More-
over, it has been previously shown that environmen-tally responsible behavior can be profitable in thelong run (Enz & Siguaw 1999; Martinac, Murman,& Lind af Hageby, 2001; SSCC, 2003). Experiencesfrom ecologically and economically successful fa-cilities should be made available to all segments ofthe hotel and other related industries.
The Scandic case history shows that environmen-tal concern can be made a corporate priority andlead to significant environmental improvements inan entire hotel chain. The next step in Scandic’s com-mitment to sustainable development is expectedto take shape in the “Scandic in the Society (SIS)”initiative. A number of hotels have already initiatedthis program. However, as of March 2005, this wasstill not part of any central corporate campaign. Theinitiative undertaken at central level in 2003/2004was to donate to the SOS Estonia Youth Facilityproject in Keila, Estonia the funds (ca. 202,000SEK = ca. US$27,000) saved by not sending the tra-ditional Christmas card. In 2004/2005 the moneywas donated to the disability sports associations inthe Nordic countries (J.-P. Bergkvist, personal com-munication, December 23, 2004) In general, how-ever, as Jan-Peter Bergkvist (personal communica-tion, July 19, 2004), the Director of EnvironmentalSustainability at Hilton International and Scandic,points out: “The heart of SIS is what happens at thehotels.”
It is further believed that Scandic’s attitude willhave a positive influence on the environmental man-agement in the entire Hilton International groupand that it will over time be incorporated in Hiltonfacilities in (mass) tourism destinations all over theworld. Hilton is currently in the process of incor-
Figure 5. Incentives to become more environmentally friendly, average ratings on a 7-point Likertscale.
4.8
2.8
4.9 4.9 4.44.1 3.9
01234567
Demands fromcustomers
Reducingoperational
costs
Marketingasset
Availability ofprofessional
advice
7-p
oin
t L
iker
t sc
ale
Diminishing environmental impacts of
the hotel
Improving the hotel image
Recommendations of management

ENVIRONMENTAL TRAINING AND MEASURES AT SCANDIC HOTELS 17
porating an “Eco-learning” program, an interactiveenvironmental training scheme based on the FourSteps developed by and for Scandic with the helpof The Natural Step (www.hiltonecolearning.com).Hilton International trained all 15,000 UK and Ire-land employees in environmental sustainability inthe first half of 2004 (J.-P. Bergkvist, personal com-munication, July 19, 2004). The Scandic UtilitySystem database was replaced in February 2004by its new version, Hilton Environmental Report-ing (HER) System, which is believed to be morecomprehensive and reliable in benchmarking theperformance of Hilton hotels. It is also anticipatedthat by following Scandic’s example, Hilton hotelswill in the near future also be eco-labeled (with aninternal environmental label, or internationally rec-ognized certificate). Although no specific corpo-rate plan exists for the time being, Scandic antici-pates that Nordic Swan-labeled hotels will not incurany difficulties in complying with the EU Flower,the European eco-label for tourist accommodation(W. Hardt, personal communication, March 17,2004). Scandic believes this to be true even of theirother facilities.
Conclusions
After extensive training and many years of envi-ronmental work, Scandic team members and man-agement executives are well updated on the envi-ronmental impacts of chain operations, as well asappropriate strategies of environmental control andprevention. The creation of SUS has allowed Scandicmanagement to track changes in the patterns of re-source consumption and identify problem areas. Theincorporation of various efficiency and conservationmeasures into daily hotel operations has resulted ina significant decrease in resource consumption. Be-tween 1996 and 2003 the energy consumption atScandic hotels in Sweden decreased by 19% on akWh/m2 basis, and 15% on a kWh/guest-night ba-sis. Within the same period water consumption wasreduced by 6% and waste generation by 48% on aliter/guest-night and kilogram/guest-night basis, re-spectively. This has led to substantial reductions inoperational costs. It is estimated that the “ResourceHunt” Program generated direct financial benefitsin excess of 6,000,000 SEK (US$800,000) in 1997alone (Nattrass & Altomare, 1999).
The Scandic brand name became widely recog-nized as an establishment concerned with environ-mental improvement, while the environmental pro-gram has lead to the creation of a more healthy workenvironment for its employees (i.e., less chemicalsused in cleaning). It would, undoubtedly, have beeneasier to facilitate the continuity of the environmen-tal work if there had been at least one person em-ployed at every hotel with the sole task to supervisethe incorporation of environmental initiatives (atScandic everyone is responsible for improving theirenvironmental performance). Nevertheless, Scandichas gone a long way since the beginning of the 1990s,and showed that even large-scale operations can bemanaged with great environmental responsibility.
Scandic team members are proud of their envi-ronmental achievements, environmental trainingprogram, and incorporation of proecological mea-sures in daily work routines, as well as the KRAVand Swan labeling of chain services. Scandic’s en-vironmental work has earned the chain an image ofenvironmental commitment with competitive advan-tages including a more recognized and valuable cor-porate brand. This value is bound to increase evenmore once Scandic has reached its goal of becom-ing the first international hotel chain (catering tomass customers) to eco-certify all of its facilities withan external label.
Acknowledgments
The authors wish to acknowledge the financial sup-port for this research project received fromEnergimyndigheten (The Swedish Energy Agency).The authors would also like to thank all Scandic ho-teliers who have dedicated their time to participate inthis survey, as well as Jan-Peter Bergkvist, AndersHedin, and Wilhelm Hardt at Hilton International andScandic Headquarters who provided us with accessto the Scandic Utility System and Kunskapsportalenand always patiently answered our questions.
Endnotes
1The Swan (Nordic Swan, Svanen), the officialNordic eco-label introduced in 1989 by the NordicCouncil of Ministers, available for approximately60 product groups in Denmark, Finland, Iceland,Norway, and Sweden. More information is availableon the following website: http://www.svanen.nu

18 BOHDANOWICZ, SIMANIC, AND MARTINAC
2KRAV logo, label for organically producedgoods, in accordance with KRAV standards and/orInternational Federation of Organic AgricultureMovements Basic Standards, as well as the Euro-pean Council regulation EEC/2092/91. More infor-mation is available on the following website: http://www.krav.se.
3The formula used was: 21 xxS − × 1.96 =
[ ] [ ]2221 xx SS + × 1.96 and the value was compared
to, x1
– x2, where x
1 was the average value for the
year 1996, and x2 for the year 2003. The formula
was taken from the U.S. Department of EnergyCBECS survey 1995.
4Nordic Ecolabelling categorizes the establish-ments as Class A or Class B depending on the shareof the restaurant turnover as the total turnover forrestaurant and lodging, the lodging occupancy rateas well as presence of pool facilities.
Biographical Notes
Paulina Bohdanowicz is a doctoral student and a lecturer atthe Department of Energy Technology, Royal Institute ofTechnology, Stockholm, Sweden. Her research area includesenvironmental issues in the hotel, travel, and tourism indus-try, with particular focus on energy aspects. She is also in-terested in eco-certification and eco-labeling schemes forthe hotel and tourism industry. Within her research she in-vestigates how tourism can enhance the environmental aware-ness among the general public, as well as the tools that canbe developed and used to that end. She is also closely coop-erating with the hotel industry in Sweden and internation-ally.
Branko Simanic is a doctoral student at the Department ofEnergy Technology, Royal Institute of Technology,Stockholm, Sweden. His research focuses on issues relevantto energy efficiency and conservation in tourism facilities(with a special emphasis on hotels). In his work he cooper-ates very closely with the hotel industry. He has been ac-tively involved in a number of projects dealing with resourceuse efficiency in the built environment.
Ivo Martinac is Head of the Division of Sustainable Build-ing Systems at the Royal Institute of Technology, Stockholm,Sweden. His main research expertise is in the domain of en-ergy efficiency and environmental management in buildings,with a focus on tourism facilities. He has a special interest inresponsible tourism (infrastructure) development, particu-larly in Asia-Pacific. He is visiting Professor at the School
of Architecture, South East University Nanjing, China, aswell as the Space Thermal Science Center at Shandong Uni-versity, Jinan, China.
References
Accor Group. (1998). Accor environmental guide 1998 (p.17). Paris, France: Author.
APAT. (2002, October). Tourist accommodation EU ecolabelaward scheme—final report. Italian National Agency forthe Protection of the Environment and for Technical Ser-vices. Rome, Italy: European Commission.
Asia Pacific Sustainable Development Center. (1999). Insti-tutionalization of a benchmarking system for data on theenergy use in commercial and industrial buildings. USA:Asia Pacific Economic Cooperation.
Bergkvist, J.-P. (2004). Hilton’s environmental training cam-paign. Green Hotelier, 33, 11.
Bohdanowicz, P. (2003, December). A study of environmen-tal impacts, environmental awareness and pro-ecologi-cal initiatives in the hotel industry. Stockholm, Sweden:Department of Energy Technology, Royal Institute ofTechnology.
Bohdanowicz, P., & Martinac, I. (2003). Attitudes towardssustainability in chain hotels—results of a European sur-vey. Proceedings of the CIB International Conference onSmart and Sustainable Built Environment (SASBE 2003),Brisbane, Australia.
Deng, S. M. (2003). Energy and water uses and their perfor-mance explanatory indicators in hotels in Hong Kong.Energy and Buildings, 35, 775–784.
Deng, S. M., & Burnett, J. (2000). A study of energy perfor-mance of hotel buildings in Hong Kong. Energy andBuildings, 31, 7–12.
Deng, S. M., & Burnett, J. (2002a). Water use in hotels inHong Kong. Hospitality Management, 21, 57–66.
Deng, S. M., & Burnett, J. (2002b). Energy use and manage-ment in hotels in Hong Kong. Hospitality Management,21, 371–380.
Enz, C. A., & Siguaw, J. A. (1999). Best hotel environmentalpractices. The Cornell Hotel and Restaurant Administra-tion Quarterly, 40(5), 72–77.
Green Globe 21. (2004). Travel and tourism industryearthcheck™ baseline and best practice indicators. http://www.greenglobe21.com (retrieved November 11, 2004)
International Hotel Environmental Initiative. (n.d.).benchmarkhotel. http://www.benchmarkhotel.com (re-trieved November 11, 2004)
Johnson, C., & Iunius, R. F. (1999). Competing in CentralEastern Europe: Perspectives and developments. Inter-national Journal of Hospitality Management, 18(3), 225–328.
Langer, G. (1996). Traffic noise and hotel profits—is there arelationship? Tourism Management, 17(4), 295–305.
Martinac, I., Murman, H., & Lind af Hageby, A. (2001).Energy-efficiency and environmental management in aSwedish conference facility—case study: Sånga-SäbyCourses & Conferences. Proceedings of the 18th Con-

ENVIRONMENTAL TRAINING AND MEASURES AT SCANDIC HOTELS 19
ference on Passive and Low Energy Architecture (PLEA2001) (pp. 325–329), Florianópolis, Brazil.
Medina-Munoz, D., & Garciá-Falcón, J. M. (2000). Success-ful relationships between hotels and agencies. Annals ofTourism Research, 27(3), 737–762.
Nankervis, A. R., & Debrah, Y. (1995). Human resourcemanagement in hotels. Tourism Management, 16(7), 507–513.
Nattrass, B., & Altomare, M. (1999). The Natural Step forbusinesses: Wealth, ecology and the evolutionary corpo-ration (pp. 75–100). Gabriola Island, BC: New SocietyPublishers.
Nordic Ecolabelling. (2002). Nordic ecolabelling of hotelsand youth hostels. Criteria document, October 3rd 2002–September 30th, 2006, Version 2.0. Stockholm, Sweden:Nordic Swan Ecolabel, Nordic Ecolabelling, SISMiljömärkning.
Nordic Ecolabelling. (2005). Nordic Swan webpage. SISMiljömärkning. http://www.svanen.nu (retrieved March8, 2005)
Olszewski, K. (2003). wiat hoteli, 6 (Hotel World Magazine)(in Polish), 29.
Pizam, A., & Thorburg, S.W. (2000). Absenteeism and vol-untary turnover in Central Florida hotels: A pilot study.International Journal of Hospitality Management, 19(2),211–218.
Radisson SAS. (2002). Responsible business report 2002.Brussels, Belgium: Author.
Sånga Säby Course and Conference. (2003). Sånga SäbyMiljö redovisning 2002 (Environmental report) (in Swed-ish). Svårtsjö, Sweden: Author.
Scandic. (2000). Annual report 1999. Stockholm, Sweden:Author.
Scandic. (2001, November). Scandic environmental construc-tion standard: Sustainable construction and renovationsat Scandic (Version 9). Stockholm, Sweden: Scandic AB,Hilton International Nordic Region.
Scandic. (2003, February). Environmental common sense—that’s sustainability in practice. Stockholm, Sweden:Scandic AB, Hilton International Nordic Region.
Scandic. (2004). Scandic company web page. http://www.scandic-hotels.com (retrieved July 14, 2004)
Schmidgall, R. S., & DeFranco, A. (1998). Budgeting andforecasting: Current practice in the lodging industry. TheCornell Hotel and Restaurant Administration Quarterly,39(6), 45–51.
Schmidgall, R. S., Damitio, J. W., & Singh, A. J. (1997).What is capital expenditure? How lodging industry fi-nancial executives decide. The Cornell Hotel and Res-taurant Administration Quarterly, 38(4), 28–33.
Stabler, M. J., & Goodall, B. (1997). Environmental aware-ness, action and performance in the Guernsey hospitalitysector. Tourism Management, 18(1), 19–33.
Stipanuk, D. M. (2003a). Benchmarks for hotel energy us-age. Proceedings of the World Energy Engineering Con-gress, Association of Energy Engineers, Atlanta, Geor-gia, USA.
Stipanuk, D. M. (2003b). Hotel energy and water consump-tion benchmarks. Final Report to American Hotel & Lodg-ing Association. Washington, DC, USA.
TIES. (2000). Ecotourism statistical fact sheet. http://www.ecotourism.org/research/stats/files/stats.pdf (re-trieved March 4, 2005)
Verginis, C. S., & Wood, R. C. (Eds). (1999). Accommoda-tion management: Perspectives for the international ho-tel industry. London, UK: International Thomson Busi-ness.
WTTC, IFTO, IH&RA, & ICCL (2002). Industry as a part-ner for sustainable development—tourism. Report pre-pared by World Travel & Tourism Council, InternationalFederation of Tour Operators, International Hotel & Res-taurant Association, International Council of Cruise Linesand UNEP. London: The Beacon Press.

Paper VII

The 2005 World Sustainable Building Conference, Tokyo, 27-29 September 2005 (SB05Tokyo)
04-006
SUSTAINABLE HOTELS – ENVIRONMENTAL REPORTING ACCORDING TO GREEN GLOBE 21, GREEN GLOBES CANADA / GEM UK, IHEI BENCHMARKHOTEL AND HILTON
ENVIRONMENTAL REPORTING
Paulina BOHDANOWICZ, M.Sc.1Branko SIMANIC, M.Sc.2Ivo MARTINAC, Ph.D.3
1Department of Energy Technology, Royal Institute of Technology, Brinellvägen 60, 100 44 Stockholm, Sweden, [email protected] 2 Department of Energy Technology, Royal Institute of Technology, Brinellvägen 60, 100 44 Stockholm, Sweden, [email protected] 3 Department of Energy Technology, Royal Institute of Technology, Brinellvägen 60, 100 44 Stockholm, Sweden, [email protected] Keywords: hotels, environmental reporting, benchmarking, Green Globe 21, Green Globes Canada, IHEI benchmarkhotel, Hilton Environmental Reporting
Summary The ever increasing environmental loads generated in/by the built environment, and their growing diversity call for more effective measures aimed at reducing the ecological footprint of buildings. In the tourism industry, hotels account for a significant amount of the overall pollution generated by this sector. The potential of implementing more sustainable practices in the hotel sector requires the availability of reliable tools for assessment and benchmarking of hotel environmental performance. A number of such tools have been developed by international environmental organizations, branch associations and even hotel corporations. The various schemes differ with regard to geographical/climatic areas covered, types of hotel facilities included, detail of environmental information required, benchmarking methods, user-friendliness and implementation cost. In this paper, four reporting and benchmarking schemes (three of them Internet-based) will be presented and compared, followed by a discussion of their relevance and usefulness for the hotel sector. The tools investigated were developed by different types of organizations, which is reflected by the variety of approaches taken and areas covered. They include Green Globes 21 (GG21), the Green Globes Canada (GGC), International Hotel Environmental Initiative (IHEI) benchmarkhotel, and Hilton Environmental Reporting (HER). Developing and making available reliable tools for benchmarking environmental performance are important steps in the quest for sustainability in hotel facilities.
- 1642 -

The 2005 World Sustainable Building Conference, Tokyo, 27-29 September 2005 (SB05Tokyo)
04-006
1. The Concept of Sustainability in the Hotel Industry In light of the growing environmental degradation, society is becoming increasingly aware of the need of adopting and enforcing more effective measures of environmental protection. Sustainable development, including the development of a more sustainable built environment, has thus become a vital priority and a veritable challenge of our time. The issue of sustainability should be addressed at all levels, in cooperation with policy makers, academia, industry, the general public and many other stakeholders. A number of factors indicate that the hotel industry has an important responsibility in this process.
1.1 Global Hotel Industry and the Environment Although hotels typically represent less than 5% of a nation’s building stock (Bohdanowicz et al., 2004), the global hotel industry, comprising over 300 000 facilities, constitutes one of the most important sectors of the tourism industry (Olsen et al., 2000). Hotels provide accommodation to half of all national and international visitors (EC, 1998), which, in Europe alone, account for 160-200 million international visitors per year (WTO, 2004). Due to the high level of resource utilization (energy, water, consumables) in hotel facilities, the environmental footprint of hotels is typically larger than those of other types of buildings of similar size (Rada, 1996). According to Perrera et al. (2003), the entire American lodging industry (including hotels, dormitories and other accommodation facilities) was estimated to consume 55.6 TWh of energy/year in 2000, while the corresponding figure for European facilities was 39 TWh (CHOSE, 2001). The prevalence of fossil-fuel generated power translates into commensurate emissions of carbon dioxide, particulates, nitrogen and sulphur oxides, and other air pollutants, both locally and globally. It is estimated that a typical hotel releases between 160 and 200 kg of carbon dioxide per m2 of room floor area annually, depending on the fuel used to generate electricity, heating, or cooling (Chan and Lam, 2002). Bohdanowicz (in press) estimates that European hotels emit more than 10 megatonnes of CO2. There is no collective data for hotel water consumption on a global, or a European scale, but according to Davies and Cahill (2000) tourists in the American lodging industry consume approximately 174.88 million m3 of water annually. Most of the water consumed is released in the form of sewage, requiring adequate treatment. Since hotels are large users of consumer goods, waste generation is one of the more visible impacts the hotel industry has on the environment. According to an IHEI (2002) estimate, a typical hotel produces in excess of 1 kg of waste per guest-day, which, for a typical facility, results in many tons of waste each month. These figures illustrate the urgent need for more environmentally sound practices and products in the hotel industry.
1.2 Sustainable Development of the Hotel Industry Until quite recently, the hotel industry has been rather oblivious of the extent of environmental damage caused by its services and operations. The last two decades, however, have brought about an increased environmental awareness among the general public, the emergence of social environmental movements, and the development of the concept of “green consumerism”. This has eventually spurred growing criticism of existing tourism/hotel practices. In the recent past, environmental responsibility has been receiving more attention in the hotel industry and is now increasingly becoming a corporate issue. However, in order to achieve greater environmental responsibility, proper implementation tools and strategies are necessary. The primary instruments of action include the enforcement of relevant laws and regulations (health and safety requirements, planning and building regulations, laws relevant to water utilization, waste generation and the release of emissions), the levying of environmental taxes (e.g. based on the amount of water and energy used), as well as voluntary standards. The latter are generally less binding, and provide guidelines indicating specific levels of environment-related performance that ought to be achieved. Certification and labelling schemes offered internationally, nationally or locally by industrial organizations, governmental and non-governmental institutions are increasingly growing in popularity. In order to assist hoteliers in running more environmentally responsible businesses, branch associations, NGOs, academic communities and hotel companies themselves continue to develop guidelines, manuals and training modules. Hoteliers are increasingly aware that the environment and its protection are crucial to hotel industry development and performance. As reported by Bohdanowicz (in press), and Bohdanowicz et al. (in press), there is a growing number of examples showing that pro-ecological initiatives are being developed and pursued at various levels, typically upon the initiative and under the stewardship of top management. The availability of facility-specific data (at the required level of detail), and access to information on relevant best practice are essential for assessing and benchmarking the environmental performance of hotel facilities. 2. Environmental Reporting and Benchmarking
2.1 Environmental Audits In recent years, hotel companies are increasingly being evaluated by the degree of their environmental and social commitment and achievements rather than only by their financial performance. In this context, industry benchmarking is gaining attention and continuing to develop (Wöber, 2001). Performing an audit is the first step in facility performance evaluation. The American Hotel and Lodging Association (2001) recognizes two main audit types: historic (based on past performance), and diagnostic (focused on improvement possibilities). An audit includes investigating the system, its efficiency and impact exerted on the surroundings, followed by proposing areas of possible improvement. The variables collected can be
- 1643 -

The 2005 World Sustainable Building Conference, Tokyo, 27-29 September 2005 (SB05Tokyo)
04-006 quantitative or qualitative. Information is collected on energy, water and chemicals consumption, as well as waste generation, as recorded by monitoring systems including electric power, water flow, and indoor temperature/humidity meters. Additional data is obtained from electric/gas/oil bills, turnover and occupancy records, data on investment within local communities, etc. Information relevant to pro-environmental measures and social initiatives at the destination is collected by way of questionnaires/interviews with staff and managers and other stakeholders. The most commonly used environmental indicators provide information on resource consumption (water, electricity, energy, and fuels, such as coal, oil, gas, biofuels, renewable energy, as used in hotel facilities or related transportation), and weather conditions - to allow for a comparison of energy consumption as related to climatic conditions (e.g., outdoor temperatures, heating and/or cooling degree days); consumption of consumables (chemicals, consumer products, food etc.); emissions (to air, water, and soil) and waste generation; information on supply chain characteristics; significant changes to facility structure and systems (affecting resource consumption); and specific activities at the facility (exhibitions, congresses and conferences). Economic indicators provide information on the number of customers served; turnover; types and quantities of jobs created; interaction with local supply chains; as well as costs and benefits to local communities. Socio-cultural indicators relate to host communities participation in decision-making processes, local employment opportunities; other benefits/costs to the local community; local access to infrastructure and services; freedom from oppression, mistreatment and violence; and local community and guest satisfaction.
2.2 Environmental Benchmarking Facility audits and proper monitoring systems are necessary pre-conditions to facility benchmarking. Benchmarking is a new management tool, gaining popularity as an extension of already existing quality programmes in businesses. According to Wöber (2001) “benchmarking is a systematic procedure of comparative measurement with the objective to achieve continuous improvement”. The main aim of benchmarking is to compare operational efficiency and environmental impact within facilities having a similar portfolio and to indicate possible improvements in business activity, processes and management by establishing more efficient operational standards. Wöber (2002) distinguishes two levels of benchmarking: internal – within a company, between different departments, or sections; and external – comparing with other organizations at different levels: competitive benchmarking (with rivals in the same industry), best practice benchmarking (with non-competing firms), and sector benchmarking (comparing with specific sectors or industries). Benchmarking typically involves the analysis of processes within one’s own business and those in other businesses, the comparison between the two, and, eventually, the development of measures aimed at closing performance gaps identified. Comparisons are typically performed at baseline and best practice levels. The success of benchmarking in recent years can be related to its direct implications on financial benefits and increased environmental awareness. As a highly motivational process, benchmarking encourages company managers to improve environmental performance and thereby increase their profitability. A number of environmental reporting/benchmarking tools for hotels have been developed by international environmental organizations, branch associations and even hotel corporations. The various schemes differ with regard to geographical/climatic areas covered, types of hotel facilities included, detail of environmental information required, benchmarking methods, user-friendliness and implementation cost. They all, however, aim at helping hotel managers in evaluating hotel performance from an environmental perspective, and, generally, offer solutions based on the data collected. In this paper, four reporting and benchmarking schemes (three of them Internet-based) will be presented and compared, followed by a discussion of their relevance and usefulness for the hotel sector. The tools investigated were developed by different types of organizations, reflected by the variety of approaches taken and areas covered.
3. Green Globe 21 The Green Globe 21 (GG21) scheme is one of the first self-regulation systems and currently the most widely recognized initiative within the travel and tourism industry. It was launched in 1994 by the World Tourism and Travel Council (WTTC) and the International Hotel and Restaurant Association (IH&RA) as a result of the 1992 Earth Summit in Rio. It is based on the principles of Agenda 21 and ISO-type standards. The Green Globe 21 initiative is dedicated to improving the environmental performance of all travel and tourism companies, regardless of size, sector, location or level of environmental activity. Currently four operational standards have been developed: the GG21 Company Standard; the GG21 Community Standard; the GG21 International Ecotourism Standard; and the GG21 Design and Construction Standard (GG21, 2005).
3.1 Reporting Scheme: Criteria and Procedure Green Globe 21 uses a series of earthcheck™ quantitative indicators to benchmark the key aspects of environmental and social performance of an enterprise in a sector of the travel and tourism industry (Scott et al., 2004). The results of indicators for a particular type, activity, market and location of an enterprise are compared with the relevant baseline and best practice levels. These level values are developed for each country and type of facility based on the data published worldwide in industry surveys and audits, case studies and design handbooks. Furthermore, the indicator benchmark values are normalized based on regional and national data on resource consumption and environmental practices to allow for the
- 1644 -

The 2005 World Sustainable Building Conference, Tokyo, 27-29 September 2005 (SB05Tokyo)
04-006 establishment of reasonable performance targets. The performance levels for earthcheckTM indicators are continuously reviewed and updated. Recognizing variations within the types of services delivered and markets targeted, accommodation facilities were divided into five separate sub-sectors: business hotels, vacation hotels, motels, bed and breakfasts and motels. The Green Globe benchmarking user guide can be purchased for US$20 (AUD$30), while the cost of joining the GG21 scheme varies from US$225 to over US$6000 depending on the size and operational scale of the enterprise (GG21, 2003) Accommodations are benchmarked according to seven core earthcheckTM indicators (Scott et al., 2004): 1. Presence of sustainability policy (yes-no). 2. Energy consumption (MJ/guest-night, all types of energy consumed have to be reported). 3. Potable water consumption (kL/guest-night). 4. Solid waste production (m3 of landfilled waste/guest-night). 5. Social commitment (total number of employees with their primary address within a 20 km distance from the work place/total number of employees, %). 6. Resource conservation (weight of eco-labelled paper purchased in kg per year/total weight of paper purchased in kg per year, %; recognizing varied availability of eco-labelled paper in the world, paper with recycled content can be considered). 7. Chemicals use (total weight of biodegradable active chemicals use in kg per year/total weight of active chemicals used in kg/year, %; it includes cleaning chemicals and land applied chemicals, and guidelines used to determine the biodegradability are provided). For energy and water consumption, baseline and best practice levels are adjusted to the climatic conditions of the location. Companies following the Green Globe 21 benchmarking scheme are required to register with GG21 and pay a fee. They then receive a full set of guiding materials and can proceed with the monitoring process. The values for all indicators must be reported annually to Green Globe 21 by the hotel company.
3.2 Benchmarking Report On behalf of Green Globe, Earth Check Ply Ltd independently assesses the reports submitted and produces an analysis of performance against appropriate baseline and best practice levels (Scott et al., 2004). The enterprises evaluated are provided with an assessment of the indicator outcomes similar to that presented in Figure 1. No extra information is provided to the company on improvement potential or saving options. If the company desires to be certified with Green Globe 21, the third party assessment performed by a certified body is required.
350
300
250
200
150
100
145.7187.4
201.1
Year 1 Year 3Year 2
MJ/guest-night
Baseline Performance LevelBest Practice Performance Level
Figure 1 Example of earthcheckTM energy indicator and benchmark for accommodation (Scott et al., 2004)
4. Green Globes Canada / GEM UK Green Globes Canada (GGC) was developed in Canada with the support of federal and provincial ministries and public utilities, while GEM was developed in the UK by the RICS Foundation and Faber Maunsell. The GGC/GEM UK is a self-assessment tool based on BREEAM/Green Leaf, aimed at helping building owners and managers to monitor and assess the performance of their buildings and benchmark it against best practice criteria. The tool also suggests corrective and improvement actions. Currently, Green Globes assessment schemes are available in 3 countries: USA – Green Globes Design; Canada – Green Globes for Existing Buildings, Green Globes Design and Green Globes Fit-Up; and the UK – GEM for Existing Buildings. In this paper, Canadian Green Globes for Existing Buildings will be analyzed.
4.1 Reporting Scheme: Criteria and Procedure The Green Globes audit criteria are based on the internationally accepted Building Research Establishment Environmental Assessment Method (BREEAM), and BREEAM Canada, as published by the Canadian Standards Association (CSA) (Green Globes Canada, 2005). Canadian Green Globes for Existing Buildings is available for two types of buildings: Offices and Multi-Unit Residential Buildings (MURBs). The latter has been used to evaluate the performance of hotel facilities. Building performance is compared to facilities with similar properties contained in a database. The assessment is performed on-line (www.greenglobes.com) for US$200 (CAN$250) per building assessment (Green Globes Canada, 2005). This fee includes data input,
- 1645 -

The 2005 World Sustainable Building Conference, Tokyo, 27-29 September 2005 (SB05Tokyo)
04-006 compilation of a report, access to a hard-copy report, as well as the possibility to update this report and access the database and online resources throughout one year. The assessment questionnaire is divided into 7 modules and requires the input of the following information (Green Globes Canada, 2005): 1. Building information (building location, year of construction, size, types of tenancies and services provided, number of occupational units and occupants, type of building management). 2. Energy. Energy consumption (monthly quantities and prices for electricity and gas for the given year); energy features (lighting, boilers, controls, hot water, building envelope, green electricity and utilization of renewable energies); energy management (energy policy, audits, monitoring and performance targets, training, budgeting, energy metering and sub-metering, regular and preventive maintenance); transportation (access to public transit and provision of bicycle storage facilities, carpooling). 3. Water. Water consumption (monthly quantities and prices for the given year); water conservation (water-saving features, landscape irrigation, water-cooling towers); water management (audits, monitoring and performance targets, leak detection systems). 4. Resources. Waste reduction and recycling (waste reduction and recycling facilities, composting, reuse of building materials in construction or demolition, monitoring, reduction plans and targets); site (environmental site assessments, remediation and ecological enhancement). 5. Emissions. Air emissions (NOx emissions, boiler control and upgrades, monitoring, analysis of flue gases); ozone depletion (refrigerant type, phase out plans for ozone depleting refrigerants, leak detection and recovery, refrigerant inventories and storage); water effluents (protection of floor drains, roof drains disconnected from sanitary or combined sewers, non-toxic cleaning supplies, landscaping practices, minimization of glycol loss); hazardous materials (asbestos, radon, PCBs, storage tanks, lead and bacteria in drinking water); hazardous products, health and safety (storage and handling of hazardous materials, pesticides, Health and Safety Committee, complaints investigation and resolution protocol). 6. Indoor Environment. Indoor air (type and characteristics of ventilation and air filtration systems; humidification, cooling towers, measures to control pollutants at source, dwelling unit indoor air quality, IAQ management, training, monitoring and auditing); lighting (features and management); noise (levels and acoustic privacy). 7. Environmental Management. EMS documentation (strategic planning, performance targets, action plans, training, regulatory compliance, continuous improvement); purchasing policy (environmental purchasing, contract procurement and energy efficient equipment); emergency response (risk assessment and emergency response procedures to chemical spills, asbestos, accidental CFC release); tenant awareness (communications to occupants regarding environmental initiatives in the building and ways they can contribute to energy conservation, waste reduction and the improved handling of toxic products). There are on average 75 questions, most requiring a simple yes-no response. Only questions concerned with resource consumption require an input of monthly data for a given 12 month period. The questionnaire can be completed in 2 to 3 hours.
4.2 Benchmarking Report Following the completion of the questionnaire a report is generated. It contains the building eco-ratings in the area of energy, water, resources (waste and site), indoor environment and environmental management (Figure 2). These quintile ratings compare the investigated building to others that have been assessed previously.
20
EMS Documentation
Indoor Environment
Emissions
Resources
Water
% Scores
1008060400
Energy
90%
80%
100%
33%
85%
65%
Overall Rating 74%
Figure 2 Report with percentage scores achieved by a hotel facility in Stockholm (own analysis) according to Green Globes
The report additionally highlights the achievements made, and suggests improvements for the building, including information on the potential of saving energy and water. Finally, links to information on building systems and management are also provided. The building can subsequently be certified through third part verification.
5. IHEI benchmarkhotel In response to the demand shown by hoteliers, the International Hotels Environmental Initiative (IHEI) in cooperation with WWF-UK and funding from Biffaward, developed its own, Internet-based environmental
- 1646 -

The 2005 World Sustainable Building Conference, Tokyo, 27-29 September 2005 (SB05Tokyo)
04-006 benchmarking tool - benchmarkhotel. The tool was launched in September 2001. A number of IHEI hotel member groups including Hilton International, Marriott International, Scandic Hotels AB and Six Continents Hotels assisted in the tool development by providing data and testing the tool to ensure its usefulness for various types of hotels (Hooper et al., 2001).
5.1 Reporting Scheme: Criteria and Procedure Currently the benchmarking scheme is available for three types of hotels (luxury full-service, mid-range full-service, and small and budget) located in three climate zones (temperate, Mediterranean and tropical). Only hotels that match the given characteristics can expect to obtain accurate results. Hotel performance in terms of resource consumption is compared with that of similar hotels worldwide. The assessment is performed on-line (www.benchmarkhotel.com) at an annual registration cost of US$210 (GBP120). The assessment questionnaire consists of 6 modules and requires the input of the following information for the period of 12 months (benchmarkhotel, 2005): 1. Hotel profile and operation characteristics (total hotel area, number of guest rooms available, room occupancy records, guest-nights records, guest covers served, employee covers served, presence of swimming pool and on-site laundry - including the weight of linen in kg per occupied room per day). 2. Energy management (total energy consumption and costs – electricity and fuels). 3. Potable water consumption (total potable water consumption and costs, all water provided by the water company and any potable water generated on-site - drawn from a well or purified in a plant). 4. Waste minimization (volume or weight of non-hazardous waste sent for landfill disposal or dumped, exclusive of recycled and hazardous waste; costs of disposal; information on recycled and composted wastes). 5. Waste water quality (biochemical oxygen demand – BOD of waste water discharged to sewer/treatment plant; volume of waste water produced in m3). 6. Green purchasing (a list of all purchases of chlorine bleach, and volume of CFCs consumed). All data collected is confidential and not accessible to anyone except the hotelier entering it.
5.2 Benchmarking Report Following the completion of the questionnaire, a report is generated. benchmarkhotel calculates the volume/quantity of resources consumed by the hotel and, compares it (confidentially) with resource consumption of similar businesses, and established practices worldwide (Table 1).
Table 1 Water performance report generated by benchmarkhotel (benchmarkhotel, 2005)
Excellent Satisfactory High Excessive Target Benchmark (m3/guest-night) less than 0.48 from 0.48
to 0.54 from 0.54 to 0.88
greater than 0.88
Your Hotel’s Score (m3/guest-night) 0.49 Potential Saving (currency used to enter data)
at least 6497 in currency used to enter data
between 0 and 6497 in currency used to enter data
This tool also calculates the financial and resource savings that can be achieved by improving the environmental performance of a facility, and suggests measures aimed at reducing resource consumption.
6. Hilton Environmental Reporting - HER Hilton Environmental Reporting (HER) is a scheme developed by the Hilton International, a company operating over 400 hotels worldwide. It is based on experience from 7 years of resource consumption reporting at the Scandic hotel chain. To help in keeping track of resource usage and its variation over time a measurement system called SUS (Scandic Utility System) was developed and implemented (Bohdanowicz et al., in press). When Scandic was acquired by Hilton International, efforts were undertaken to develop a more sophisticated version of SUS applicable to all Hilton International facilities. As a result, HER was launched globally in February 2004.
6.1 Reporting Scheme: Criteria and Procedure HER is available on the Hilton Intranet and on the Internet (www.hiltonher.com) and accessible to authorized team members only. Two levels of reporting and three separate forms are used (HER, 2005): 1. Hotel profile – updated whenever hotel characteristics change (basic facility information: brand, city, year of construction, floor area, number of floors, number and types of rooms, restaurants and kitchens; additional services, i.e. health club, pool, jacuzzi, on-site laundry, landscaped grounds; types and locations of mechanical systems i.e. air conditioning, combined heat and power (CHP) units, cooling towers, solar energy systems; a list of central suppliers, including those environmentally approved).
- 1647 -

The 2005 World Sustainable Building Conference, Tokyo, 27-29 September 2005 (SB05Tokyo)
04-006 2. Environmental data – on a monthly basis (environmental initiatives carried out, number of environmental awards received, number of reportable environmental incidents and environmental legal actions, inventory of cleaning chemicals used; quantity of unsorted, sorted and hazardous waste produced and their individual costs, types of recycled materials; vehicle fleet, and number of low emission vehicles, quantity and types of fuels consumed; types and quantities of refrigerants used). 3. Resource consumption data – on a monthly basis (consumption of electricity, district heating and cooling energy, and the energy mix used; proportion of electricity used for heating and that produced by on-site CHP units; fuels for heating and other purposes i.e. oil, propane/butane, town gas, LPG; consumption of water; heating and cooling degree days; expenses relevant to resource consumption and engineering/maintenance). In response to some of the problems experienced with using SUS, a number of innovative solutions were incorporated into HER. First, an automatically generated e-mail message reminds key team members of upcoming report deadlines and provides a direct link to the electronic report form. Next, when a form for a new month is created, the latest reported values are automatically filled in, to reduce the risk of incorrectly entered data. To safeguard the validity of the information collected each general manager receives monthly an executive feedback report with the overview of resource consumption and environmental status of the hotel. For additional safety and quality assurance of the process, the system is being reviewed by an external company (Acona Ltd), and in Sweden, the environmental manager at the company headquarters performs periodical checks on the data submitted.
6.2 Benchmarking Report A number of reports can be obtained from HER. Individual hotel performance is compared with data for the same month of the previous year, and also to performance of Hilton hotels in the same country and worldwide as presented in Figure 3.
Energy use index (total energy consumption/total hotel area),kWh/guestnight
Hilton Hotel X incountry Y
20042003
Average forHilton Hotels
globally
Average forHilton hotels in
country Y
2003 20042004
71
49
76
46
66
40
60
80
100
20
Figure 3 Energy usage report generated by HER – illustrative purpose only (HER, 2005) The system is user-friendly and the graphical presentation of the data facilitates the communication of the environmental message to hotel team members. So far, the aim of this initiative has been to collect data and establish a database on resource utilization at Hilton International facilities. In the future it may be used for creating a more sophisticated internal benchmarking tool.
7. Schemes comparison and conclusions The reporting tools investigated were developed by different types of organizations, reflected by the variety of approaches taken and areas covered. A short comparison of the schemes is presented in Table 2.
Table 2 Comparison of the four reporting schemes Green Globe 21 Green Globes
Canada IHEI benchmarkhotel
HER
Climatic zones Accounted for by temperature calculations
Canada Temperate, Mediterranean, tropical
Accounted for by heating/cooling degree days
Different types of hotels
Not specified Not primarily intended for hotels
3 categories Not specified
Building characteristics, engineering systems
Not considered Considered in detail
Mostly indirectly included in the hotel categories
Considered in some detail
Resource consumption
Only within the facility (building)
Only within the facility (building)
Only within the facility (building)
Within facility and related to transportation
Periodical reporting /benchmarking
Annual Monthly for 12 months
Annual Monthly
Level of detail Low High Low Moderate/high Level of expertise from Low High Low Moderate/high
- 1648 -

The 2005 World Sustainable Building Conference, Tokyo, 27-29 September 2005 (SB05Tokyo)
04-006 person performing the analysis Report Graph Graph and
comments Table Graph
Benchmarking Against country baseline and best practice
Against other buildings in the database
Against other hotels in the database and literature data
Against other Hilton hotels in the country and worldwide
Indication of saving possibilities
No Yes Yes No
Cost US$ 20 (guidelines only)
US$ 200 US$ 210 No fees – internal costs only
The benchmarking tools developed by Green Globe 21 (GG21) and IHEI are relatively simple to use, but they do not consider information relevant to building characteristics or the systems installed. By contrast, the Green Globes Canada (GGC) tool focuses in detail on a wide range of building characteristics and requires a high degree of user competence. HER is a very sophisticated tool for data collection, but stops short of providing suggestions relevant to savings potential or recommendations on system improvements. The GGC and IHEI schemes have limited applicability outside the narrow climate zones indicated. The general conclusion of this paper is that the hotel industry is in need of a reliable and universally applicable tool for reporting and benchmarking environmental performance. The necessary work should be carried out in cooperation with various sectors of the hotel industry, academia and authorities.
References American Hotel and Lodging Association 2001, Energy management and conservation guide. Washington DC, USA. benchmarkhotel 2005, IHEI benchmarkhotel web site available at http://www.benchmarkhotel.com, 7.01.2005. Bohdanowicz P. European hoteliers’ environmental attitudes: greening the business, Cornell Hotel and Restaurant Quarterly (in press). Bohdanowicz, P., Simanic, B., Martinac, I. 2004, Sustainable hotels – eco-certification according to EU Flower, Nordic Swan and the Polish Hotel Association, In Proceedings of the Regional Central and Eastern European Conference on Sustainable Building (SB04), Warszawa, Poland. Bohdanowicz, P., Simanic, B., Martinac, I. Environmental training and measures at Scandic Hotels, Sweden. Tourism Review International (in press). Chan, W.W., Lam, J.C. 2002, Prediction of pollutant emission through electricity consumption by the hotel industry in Hong Kong. Hospitality Management 21, pp. 381–391. CHOSE 2001, Energy savings by combined heat cooling and power plants (CHCP) in the hotel sector. Report of the Commission of the European Communities, Directorate General for Energy, Stockholm, Sweden. Davies, T., Cahill, S. 2000, Environmental implications of the tourism industry. In Resources for the Future, Washington, USA. European Commission 1998, Facts and figures on the Europeans on holidays 1997-1998. European Commission Directorate General XXIII, Brussels, Belgium. Green Globe 21 2003, Green Globe 21 global fee structure 2003. Green Globe Asia Pacific, Australia. Green Globe 21 2005, Green Globe 21 web site available at http://www.greenglobe21.com, 6.01.2005. Green Globes Canada 2005, Green Globes Canada web site available at http://www.greenglobes.com, 6.01.2005. HER 2004, Hilton Environmental Reporting internal web site available at http://www.hiltonher.com, 26.02.2005. Hooper, S., Tantram, J, Gaywood, A. 2001, Benchmarking tool identifies £400m potential environmental cost savings for hotels, available at http://www.iblf.org/ , 6.01.2005. International Hotel Environmental Initiative 2002, Hotels care: Community action and responsibility for the environment. IHEI, London, UK. Olsen, M.D., Zhao, J., Sharma, A., Choi, J.-G. 2000, Leading hospitality into the age of excellence: Expansion, competition and vision in the multinational hotel industry 1995-2005. An IH&RA White Paper on the Global Hospitality Industry. International Hotel and Restaurant Association, Paris, France. Perera, O., Hirsch, S., Fries, P. 2003, Switched on – Renewable energy opportunities in the tourism industry. United Nations Environmental Program Publication, Washington DC, USA. Rada, J. 1996, Designing and building eco-efficient hotels. Green Hotelier Magazine 4, pp. 10-11. Scott, J.A., Beckenham, T., Watt, M. 2004, Travel and tourism industry benchmarking methodologies. Green Globe 21, Earth Check Pty Ltd. Wöber, K.W. 2002, Benchmarking in tourism and hospitality industries. Vienna University of Economics and Business Administration, CAB International, Austria. Wöber, K.W. 2001, Benchmarking for tourism organizations - an eGuide for Tourism Managers. National Laboratory for Tourism and eCommerce. World Tourism Organization (WTO) 2004, Tourism market trends - 2003 edition, world overview and tourism topics. WTO, Madrid, Spain.
- 1649 -

Paper VIII

+ Models
Determinants and benchmarking of resource consumption in
hotels—Case study of Hilton International and Scandic in Europe
Paulina Bohdanowicz a,*, Ivo Martinac b,1
a Sustainable Building Systems, Department of Energy Technology, Royal Institute of Technology,
Brinellvagen 68, 100 44 Stockholm, Swedenb School of Travel Industry Management, University of Hawai’i at Manoa, 2560 Campus Road, #225 Honolulu,
HI 96822, United States
Received 28 November 2005; received in revised form 3 May 2006; accepted 10 May 2006
www.elsevier.com/locate/enbuild
Energy and Buildings xxx (2006) xxx–xxx
Abstract
This paper reports on a study of resource consumption in 184 Hilton International and Scandic hotels in Europe. An overview of the
characteristics of these two brands (upscale and mid-market, respectively), as well as the collective resource consumption in these hotels is
presented (2004 data). This is followed by a more detailed analysis of a number of physical and operational factors that may potentially influence
the energy and water use in these hotels. A multiple variable regression analysis indicated that, in the absence of climate data, hotel standard, total
hotel floor area, number of guest-nights sold and number of food covers sold all affect the energy and water use in these facilities. The survey results
further document significant differences in the energy- and water-utilisation in Hilton and Scandic hotels. This indicates that establishing realistic
resource consumption benchmarks or models requires classifying hotels (especially those belonging to the upscale brand) into sufficiently
specialised sub-groups representing facilities with comparable properties. It is further suggested that benchmarking of facility components may be
necessary. The paper concludes with some recommendations on the procedure and criteria for establishing a useful reporting system and
benchmarking model.
# 2006 Elsevier B.V. All rights reserved.
Keywords: Hotel; Resource consumption; Physical and operational factors; Benchmarking; Modelling; Hilton International; Scandic
1. Introduction
As a major sub-sector of the tourism industry, the hotel
sector accounts for a significant amount of the overall resource
consumption in the world’s largest export industry, as well as
for a substantial portion of the environmental impacts it
generates [1]. Hotel facilities rank among the top five in terms
of energy consumption in the commercial/service building
sector (minor only to food services and sales, health care and
certain types of offices) [2]. Although no collective data is
available on the global energy consumption in the hotel sector,
Gossling [1] estimated that 97.5 TWh (351.1 PJ) of energy was
used in hotel facilities worldwide in 2001. Furthermore,
* Corresponding author. Tel.: +46 8 790 76 82; fax: +46 8 20 41 61.
E-mail addresses: [email protected],
[email protected] (P. Bohdanowicz),
[email protected] (I. Martinac).
URL: http://www.greenthehotels.com1 Tel.: +1 808 203 7276; fax: +1 808 956 5378.
0378-7788/$ – see front matter # 2006 Elsevier B.V. All rights reserved.
doi:10.1016/j.enbuild.2006.05.005
European hotels were estimated to use a total of 39 TWh in
2000 [3]. Considering that three quarters of primary energy in
Europe are derived from fossil sources, the sector’s contribution
to global environmental problems, including global warming
and climate change is not negligible. Bohdanowicz [4]
estimates that European hotels emit more than 10 Mt of
carbon dioxide annually, while global hotel-based CO2
emissions were assumed to be at the level of 55.7 Mt in
2001 [1]. It is further believed that a significant amount of the
energy used in this sector is wasted, leaving ample room for
enhancing energy-efficiency and resource conservation.
While the research conducted did not provide any collective
data on water consumption in European hotels, the figures are
assumed to be similar to those for the American lodging
industry (based on a comparable number of hotel rooms, and
similar industry profiles), i.e. in the range of 150–200 mil-
lion m3 of water per annum [5]. Most of the water consumed is
released in the form of sewage, unfortunately often without
adequate treatment. Waste generation is another (often highly
visible) impact the hotel industry has on the environment.
ENB-2111; No of Pages 14

P. Bohdanowicz, I. Martinac / Energy and Buildings xxx (2006) xxx–xxx2
+ Models
According to an International Hotel Environmental Initiative
[6] estimate, a typical guest produces in excess of 1 kg of waste
per day, amounting to millions of tonnes of waste generated
each year in hotels worldwide.
These figures indicate an urgent need for more environmen-
tally sound practices and products in the hotel industry.
Moreover, the constantly increasing prices of basic commod-
ities, such as energy resources and water, are in favour of
implementing energy and water efficiency and conservation
measures in hotel facilities. For these programmes to be
successful, detailed and reliable information is required on the
energy and water consumption in hotel buildings as a whole, as
well as relevant to the various end-users. Also, consumption
patterns and parameters crucial to the resource consumption
need to be identified and reliable tools for assessment and
benchmarking of hotel environmental performance available.
The aim of this study is to provide a better understanding of
the key factors determining the energy and water consumption
in hotel facilities. First, the relationship between brand
affiliation, hotel standard, and resource management/environ-
mental performance is investigated. Next, the physical and
operational factors affecting resource consumption are identi-
fied and analysed. This is followed by a regression analysis
aimed at finding adequate key indicators describing the use of
energy and water. Finally, some recommendations on environ-
mental reporting, benchmarking, and performance modelling
are given.
2. Resource consumption in hotel facilities
A number of international studies on resource consumption
in hotels and other accommodation facilities have been
performed [7–24]. Some consumption indicators are also
Table 1
Average energy consumption for hotel buildings worldwide, kWh/m2/year, unless
Country (data for the year) Average energy use, kW
Canada (1991) 688.7
Japan (1991) 745
Europe (1990s) 238.9–300
Hong Kong (1995–1997) 148.4–988, average 564
250–844, average 406
US (1999) 313.9
UK (1988) 200–1000, average 495
715
New Zealand (1999) 158.6
Sweden (1999, 2001, 2003–2004) 100–200
198–379
282–300
Cyprus (2001) 103–370, average 272.6
Greece (2001) 72–519, average 289.9
Italy (2001) 249–436, average 364.4
Portugal (2001) 99–444.6, average 296.4
Europe (1990s) 55.5 kWh/guest-night
New Zealand (1999) 9.7–105.6, average 43.1
Zanzibar (2000) 61.4–254.4, average 71.1
Cyprus (2001) 24.2 kWh/guest-night
Majorca (2001) 14.2 kWh/guest-night
included in the environmental reports of hotel companies [25–
27]. However, only few of the above studies actually
investigated the influence of various operational characteristics
on the energy and water consumption [10,12–17,19]. Most
investigations focused on determining the consumption
indicators for various regions as presented in Tables 1 and 2.
The resource consumption profile of hotels differs from the
patterns in other types of commercial buildings. Also, as
indicated in the above tables, the values of the consumption
indicators vary greatly not only between regions, but also
within a region. Factors influencing facility performance can be
classified into physical and operational parameters.
The physical parameters common to most buildings include
size, structure and design of the building (prevailing
architectural/construction practices), geographical and climatic
location, age of the facility, type of energy and water systems
installed, operation and maintenance schemes, types and
amounts of energy and water resources available locally, as well
as energy- and water-use regulations and cost.
The resource use in hotels is further influenced by very
specific operational features. These include different operating
schemes for sub-facilities including catering outlets, laundries,
swimming pools and spas, recreational and business centres,
etc., services offered, fluctuations in occupancy levels,
variations in customer preference relevant to indoor comfort,
as well as culture and awareness of resource consumption.
Some of these factors, such as the level of environmental
awareness of users, may be difficult to quantify or evaluate as
they are mostly qualitative in character [15].
Significant variations in facility type within the hotel sector
make it difficult to provide a general model explaining the
resource consumption of individual facilities. At the same time,
benchmarking is becoming a popular tool for verifying and
specified otherwise
h/m2/year, unless specified otherwise Source
[13]
[28]
[14]
[13,19]
[29]
[18], average not
only from hotels
[7]
[13]
[14]
[12]
[3]
[30]
[3]
[3]
[3]
[3]
[14]
kWh/guest-night [14]
kWh/guest-night [1]
[1]
[1]

P. Bohdanowicz, I. Martinac / Energy and Buildings xxx (2006) xxx–xxx 3
+ Models
Table 2
Average water consumption for hotels worldwide, l/room or l/guest-night
Country (data for the year) Average water use, l/room/day, unless specified otherwise Source
Thailand (1990s) 913–3424 [31]
Australia (1993) 750 [32]
Hong Kong (1996–1997) 336–3198, average 939.2 [19]
Philippines (2000) 1499 [33]
USA (2000) 382–787, average 583 [5]
Forecasts for 2010: 1798 [33]
Germany (1990s) 90–900, average 342 l/guest-night [15]
275 l/guest-night [11]
Jamaica (1999) 527–1595.7, average 981.9 l/guest-night [34]
Spain (2000) 440–880 l/guest-night [35]
Zanzibar (2000) 200–2000, average 930.9 l/guest-night [36]
Sweden (Sanga Saby Course & Conference Centre, 2002) 314 l/guest-night [26]
promoting pro-environmental business engagement in this
sector [37–39]. A number of environmental benchmarking
schemes have been developed internationally, some of which
have gained publicity and market penetration [40]. The
question remains, however, how valid and reliable these
benchmarks are, and how they are established. In this paper an
attempt is made to determine what factors affect resource
consumption, as well as to determine their individual impacts.
This information is essential in establishing the criteria and
specifying appropriate target groups for benchmarking in the
hotel industry.
3. Methodology
One of the leading global hotel corporations, Hilton
International2 and Scandic, granted access to their internal
environmental reporting database—Hilton Environmental
Reporting (HER). HER is a web-based system where individual
hotels report their monthly (operational, environmental and
resource) performance figures. The system has been described
in detail in [23,24,40]. For the purpose of this study, the data
was first reviewed and all hotels reporting their figures in the
system were contacted and asked to double-check and verify
the data contained in the database. As a result, a sample of 184
properly reporting hotels was extracted for analysis and the data
for the year 2004 was used. Non-reporting hotels or hotels with
incomplete hotel profiles (missing floor area or year of
construction) were excluded. The hotels chosen operate year-
round and are all located in Europe. Facilities bearing the
Hilton logo are classified as upscale, while Scandic hotels are
rated as mid-market.
Upscale hotels are typically equipped with centralised HVAC
plants (including boilers, chillers and cooling towers). Some of
the properties sampled are connected to district heating/cooling
networks. Many properties offer extensive meeting and
2 Hilton International operates 262 Hilton and 131 Scandic hotels worldwide
(with the exception of the USA). On 23 February 2006 it was acquired by Hilton
Hotels Corporation (NYSE:HLT), the leading global hospitality company, with
nearly 2700 hotels and 475 000 rooms in more than 80 countries. All activities
described in this paper relate to Hilton International (i.e. Hiltons and Scandics
outside the US, and more specifically in Europe).
convention facilities. Some have substantial on-site laundry
operations enhancing the use of energy and water. In the case of
mid-market facilities, space heating and hot water is typically
provided by centralised systems (district heating networks),
while air conditioning and cooling may be decentralised.
Meeting and convention spaces of varying size are commonly
available on-site, while laundry services are typically outsourced.
Both brands provide food and beverage (catering) outlets.
The hotels investigated represent 72% of all European
facilities of Hilton International and Scandic, and the results
can be treated as representative for the European portfolio of
the corporation. Also, the general trends observed in this
research may be assumed to be relevant to the entire Hilton
International chain due to a uniform corporate policy.
For the purpose of this study the following data for the year
2004 was extracted from the database: hotel name, brand,
location, year of construction, total hotel floor area (space
conditioned—heated and/or cooled, m2), area of irrigated
landscaped grounds in m2, number of guestrooms, number of
kitchens and restaurants, restaurant seating capacity, additional
services offered (i.e. conference centres, health clubs, spa and
pool facilities), number of guest-nights sold, number of food
covers sold, amount of in-house and outsourced laundry,
quantities of all types of energy resources utilised (i.e. electricity,
district heating/cooling, fuel oil, diesel oil, town gas, LPG), and
the total quantity of water used at the premises (cold and hot).
From this data, various indicators were derived and will be
presented and discussed below. The most commonly used
indicators correlate utility consumption with unit of output.
Indicators typically used in the hotel industry include the
number of guest-nights sold, room occupancy, or food covers
sold [15,21,22,41], to name just a few. In this study, energy
consumption was normalised for unit hotel floor area, number
of guestrooms, and guest-nights sold. Water consumption was
normalised for guestrooms and guest-nights, while laundry was
normalised for guest-nights, based on:
normalised consumption
¼ total resource consumed at the hotel
normalising factor ði:e: total floor area; total number of
guest rooms; total number of guest-nights soldÞ

P. Bohdanowicz, I. Martinac / Energy and Buildings xxx (2006) xxx–xxx4
+ Models
The relevant climate zone was defined based on hotel
location, as the energy data was not adjusted for degree days
(not all hotels reported degree days into the system). Koppen’s
climate classification was used [42,43]. Average monthly
temperatures for a number of hotel locations were obtained
from the Meteonorm software [44]. The statistical analysis of
the data was performed using the Statistical Package for Social
Sciences—SPSS software (Version 13.0) [45].
4. Limitations
The HER database, despite being very comprehensive and
broad from the corporate perspective and needs, suffers from
certain limitations when used for academic purposes. Some
information that would be desired for the analysis and proper
modelling, such as detailed description of hotel services,
facilities, and mechanical systems installed, as well as number
of conference participants and daily guests staying at the hotel,
is not collected in the current version of the reporting system.
The system developers are currently evaluating whether the
range of data collected needs to be expanded.
For the purpose of this paper, additional sources of
information were used (including hotel directories and direct
communication with general managers and system users) to
complement HER data. These sources supplied additional
information on physical factors, such as type of hotel (city/
business, airport, resort, conference centre) and services offered
(swimming pool, spa, gym, health club).
Despite the limitations mentioned above, the trends and
patterns indicated by the analysis will be presented and
discussed in this paper.
5. Results
5.1. Sample characteristics
The facilities investigated are located in 24 European
countries in the geographical zone of 98W–358E, and 708N–
358S, comprising all European climate zones. The hotels
investigated belong to two brands serving different markets
and, thus, offering different standard of services. Accordingly,
the sample was divided into upscale (Hilton, N = 73) and mid-
market (Scandic, N = 111) hotels. All analyses were initially
performed on these two sub-groups. As discussed further
below, additional sub-groups needed to be formed when
specific issues were investigated.
The hotel facilities investigated included a variety of hotel
categories, with a majority representing city centre (both
brands), suburban, airport (among Hilton) and highway hotels
(mostly Scandic). The hotels sampled, frequently offered on-
site conference facilities of varying scale. The upscale brand
included a considerable number of resort facilities and wellness
centres. Based on size (in the range of 53–788 rooms, and
2025–89 695 m2), the hotels sampled can be classified as
medium to large. In general, the mid-market portion of the
chain is characterised by smaller and older facilities. The
average number of guestrooms is 189 and 291 at Scandic and
Hilton, respectively (with median values of 160 and 272,
respectively). The average construction year was 1969 for the
mid-market brand, and 1975 for the upscale segment (median
values of 1976 and 1988, respectively). It is important to note
that the HER system requires that hotels provide only the initial
construction year without considering subsequent retrofitting.
As is typical for this industry, however, many older facilities
have been retrofitted since their construction (some extensively,
and more than once). This issue will be discussed further below.
It is further worth noting that the values of standard deviation
for the parameters investigated are high overall, indicating a
significantly heterogeneous sample. These high standard
deviation values were observed throughout this study which
is believed to have significant relevance for the benchmarking
process, as will be discussed further below.
As expected, all hotels investigated have on-site kitchens
and restaurants (at least one). Mid-market hotels typically have
fewer kitchens and restaurants (1.2 and 1.3 at Scandic,
respectively, 2.3 and 1.9 at Hilton), while restaurant seating
capacity is comparable for both brands (mean values of 224 and
206 for mid-market and upscale facilities, respectively, with
median values of 200 for both brands). Fewer meals are served
per guest at Scandic than at Hilton facilities (1.7 versus 2.6).
This factor is expected to have an influence on overall resource
consumption.
5.2. Resource consumption indicators at upscale and mid-
market hotels
The European segment of Hilton International and Scandic
hosted more than 13 million travellers in 2004, accounting for ca.
3% of all visitors in Europe, or about 8% of all international hotel
guests (assuming that 40% of visitors stay at hotels) [46]. In the
same year, the hotels investigated collectively consumed
892 GWh of energy, and almost 5 � 106 m3 of water. The
energy mix for the two brands is presented in Fig. 1. As can be
seen, electricity is the dominant energy carrier. Most of the
electricity is used for lighting, operating appliances, air
conditioning, and in few cases even for heating. The other
energy sources are mainly used for space heating and on-site
domestic hot water (DHW) generation. About half the energy in
these hotels is used for space conditioning and DHW (51% for
the upscale and 52% for the mid-market brand), which is in line
with the findings of previous studies indicating 47–48% of
energy used for space conditioning and an additional 12–40% for
DHW [47]. The amount of space conditioning energy reported
here does not include electricity used for cooling, as it was not
possible to distinguish that fraction from the total electricity
consumed. The utilisation of renewable energy in the sample
investigated is typically limited to the purchase of ‘‘green’’
electricity. Only few Mediterranean facilities utilise solar
thermal technology for hot water generation. The low level of
solar energy utilisation in the hotels investigated is typical for the
entire sector, as reported by Dascalaki and Balaras [48].
The upscale part of the brand, representing 63% of the total
floor area and catering to 52% of all guests served, used 67% of
the total energy and 72% of total water resources. Normalising

P. Bohdanowicz, I. Martinac / Energy and Buildings xxx (2006) xxx–xxx 5
+ Models
Fig. 1. Energy mix for the hotels investigated, %.
resource consumption for area, number of rooms and guest-
nights, resulted in higher values of key consumption indicators
at upscale hotels than at mid-market facilities, as indicated in
Tables 3 and 4. The individual indicators are in line with figures
reported for other chain hotels of similar standard, as well as
Table 3
Statistical overview of the energy consumption indicators in the hotels investigate
Total energy per unit area, EUI,
kWh/m2/year
Total ene
MWh/ro
Hilton, N = 73 Scandic, N = 111 Hilton, N
Median 336.3 269.9 25.6
Mean 364.3 285.0 28.1
1st quartile 280 218 19.4
3rd quartile 432 331 35.3
Skewness 1.07 0.87 1.15
Standard deviation 148.6 93.9 11.5
Minimum 129.3 123.7 7.0
Maximum 859.2 567.7 68.9
Table 4
Statistical overview of water consumption and laundry indicators in the hotels inv
Total water per guestroom,
m3/room/year
Total wa
l/guest-n
Hilton, N = 73 Scandic, N = 111 Hilton, N
Median 135.7 61.3 393.4
Mean 162.7 64.6 515.6
1st quartile 103.4 52.7 317
3rd quartile 181.5 73.7 582
Skewness 3.1 0.96 2.09
Standard deviation 102.9 21.2 334.3
Minimum 63.6 25.4 133.1
Maximum 754.4 138.1 1880.2
benchmarking guidelines, as shown in Tables 5 and 6. It is
worth noting that the standard deviation values obtained are
consistently high (although smaller in the case of mid-market
hotels) indicating a large spread in the characteristics/
performance of individual facilities.
d, N = 184
rgy per guestroom,
om/year
Total energy per guest-night,
kWh/guest-night
= 73 Scandic, N = 111 Hilton, N = 73 Scandic, N = 111
12.8 79.5 45.4
14.2 89.5 47.8
10.7 59 37
16.9 114 57
1.28 0.64 0.91
5.4 39.6 16.9
4.9 17.0 19.1
34.5 184.3 102.3
estigated, N = 184
ter per guest-night,
ight
Total laundry per guest-night,
kg laundry/guest-night
= 73 Scandic, N = 111 Hilton, N = 73 Scandic, N = 111
203.0 3.69 2.00
215.5 4.14 2.02
179 2.36 1.83
240 4.45 2.20
1.55 2.7 �1.43
59.4 2.46 0.37
85.5 0.68 0.65
506.4 16.17 3.09

P. Bohdanowicz, I. Martinac / Energy and Buildings xxx (2006) xxx–xxx6
+ Models
Table 5
Average annual energy use in chain hotel facilities—reports and recommendations, kWh/m2/year (unless otherwise stated)
Country (year for which data was obtained) Indicator value Source
Figures reported
US (2000) 114.2–801.6, average 407.5—resort; 174.3–723.5,
average 397.3—luxury & upscale; 183.6–468.9, average 312.6—mid-market
[22]
Rezidor SAS (2004) 281—Radissson SAS, 262—Country Inn,
118—Park Inn, average 220—Rezidor SAS
[27]
Scandic Sweden (1996 and 2003) 330.5 (1996)–267.9 (2003); 57.1 (1996)–48.7 (2003) kWh/guest-night [24]
Benchmarking recommendations
Accor (1998)—temperate and continental climates <385—Sofitel, <345—Mercure, <320—Novotel, 157—Etap, Formule 1 [49]
Nordic Swan (2002–2006) 280–420—Class A hotela, 250–390—Class B hotela [50]
IHEI benchmarkhotel (satisfactory performance in
temperate climates)
<345—luxury hotels, <280—mid-range fully serviced hotels [51]
Green Globe 21 (2003) for vacation and business
hotels in Europe
83.3–133.3 kWh/guest-night—baseline,
38.9–61.1 kWh/guest-night—best practice
[52]
a Nordic Ecolabelling categorizes the establishments as Class A or Class B depending on the share of the restaurant turnover, the total turnover for restaurant and
lodging, the lodging occupancy rate, as well as the availability of pool facilities.
For the purpose of comparing the unit resource consumption
at the two brands, distribution curves were drawn (Figs. 2 and
3). Relative frequency (number of hotels in a given class) is
intended to illustrate the relative distributions. The frequency
curves for EUI per area show an asymmetric distribution with
positive skew (Fig. 2a). This indicates that most observations
are in the medium and lower consumption range with only few
(<10%) hotels reporting high energy consumption per unit
area. For upscale facilities, a prevalence of higher key indicator
values was observed (concentrating towards the right-tail of the
curves), resulting in higher skewness (1.07 for Hilton versus
0.87 for Scandic). Mean and median values were also found to
be higher for upscale facilities than for mid-market hotels.
Distribution curves for energy use normalised per guest-night
are more differentiated but with similar trend (Fig. 2b).
The general conclusion from Table 3 and Fig. 2 is that mid-
market hotels are more likely to have lower normalised energy
consumption than upscale facilities. The energy consumption
for most Scandic facilities was found to be in the low to
moderate range, although some facilities reported high energy
intensity. The latter are typically located in the northern and
north-eastern part of Europe, where climate conditions require
significant heating energy. As most of these high tail Scandic
Table 6
Water consumption in chain hotels worldwide—reports and recommendations, l/g
Country (data for the year) Indicator val
Reported figures
Scandic Hotels (1998) 224–230
Scandic Sweden (1996 and 2003) 254 (1996)–2
Rezidor SAS (2004) 454—Radiss
average 262—
Benchmarking recommendations
Accor (1998)—temperate and continental climates 580—Sofitel
Nordic Swan (2002–2006) 250–300 (de
IHEI benchmarkhotel (satisfactory performance) Luxury hotel
fully service
International Tourism Partnership working group <600—luxur
Green Globe 21 (2002) 700—baselin
hotels also offer large conference facilities used by day-guests
(i.e., ‘‘non-sleepers’’), the energy utilisation per guest-night
(based on ‘‘sleepers’’) was somewhat overestimated. The lower
degree of scatter observed for mid-market hotels indicates more
uniform characteristics and operations for this class of
facilities. On the other hand, the generally lower energy
consumption in Scandic facilities is (undoubtedly) partly
related to comprehensive environmental initiatives and
resource conservation programmes implemented over the last
10 years throughout Scandic Sweden (major share of the
sample), see also [24,53]. At Hilton some area-specific
programmes for technical improvements have been imple-
mented, but system improvements have been more commonly
carried out in individual facilities. The energy monitoring and
benchmarking initiatives at Hilton Europe and Africa jointly
resulted in reducing the energy utilisation in these facilities by
16% over 4 years [39]. Hilton facilities observed to report the
highest energy utilisation typically had on-site combined heat
and power (CHP) generation, where the entire amount of heat
and power produced is reported to the HER system, although, a
portion may be sold to and utilised by external users.
Mediterranean facilities were among those with the highest
energy per guest-night consumption, which is believed to be
uest-night
ue Source
[11,25]
39 (2003) [24]
son SAS, 214—Country Inn, 118—Park Inn,
Rezidor SAS
[27]
, 340—Mercure, 310—Novotel [49]
pending on hotel class) [50]
s—temperate: <560, Mediterranean <750; mid-range
d hotels—temperate: <410, Mediterranean: <600
[51]
y hotel, <400—mid-market hotel [51]
e, 500—best practice [52]

P. Bohdanowicz, I. Martinac / Energy and Buildings xxx (2006) xxx–xxx 7
+ Models
Fig. 2. Relative frequency distributions of energy consumption indicators for
both brands: (a) EUI, kWh/m2/year and (b) kWh/guest-night.
Fig. 3. Relative frequency distributions of water consumption indicators for
both brands, l/guest-night.
due to a high cooling demand (regardless of occupancy), and
generally low efficiency of the equipment installed.
Distribution curves for guest-night-normalised water
consumption also provide some interesting observations
(Fig. 3). The difference in unit water consumption between
the two brands is highly visible with the frequency curve of
Scandic being strongly asymmetric. Over 70% of the facilities
are located in the 151–250 l/guest-night class. On the other
hand, for the upscale facilities the distribution appears as being
almost bi-modal with a major frequency peak at 301–400 l/
guest-night and a second top at 850–1400 l/guest-night. The
higher water use observed in some facilities, especially in the
upscale category (second peak), was observed for Mediterra-
nean hotels operating large spa and pool facilities (frequently
multiple) with many day-guests. Higher water consumption at
facilities with multiple and large swimming pools was also
observed at Scandic. Currently only overnight guests are
included in the database, but it is obvious that additional guest
categories are contributing to the overall resource consump-
tion. Furthermore, highly water-intensive facilities typically
have landscaped grounds, sometimes requiring extensive
irrigation. A more detailed analysis of the water consumption
as related to water-intensive services is reported in the
following sections.
Higher laundry per guest-night loads in upscale facilities are
partly the result of day-time activities in sport and health
centres (offered by some hotels), as well as varying textile
quality/weight of laundry items (i.e. very large towels at spa
facilities and LivingWell gyms at Hilton).
This preliminary investigation indicated that higher resource
consumption, both total and normalised, was observed for the
upscale brand. Hotel standard is obviously one determinant of
the level of resource consumption, a view shared also by
Becken et al. [14] and Warnken et al. [54] based on their studies
of various types of accommodation. The next step involved a
more detailed investigation of the factors influencing energy
and water consumption in both brands.
5.3. Physical factors affecting energy and water
consumption
Physical factors influencing resource consumption in
buildings include the age of the building, its architecture,
structural characteristics, size, systems and facilities installed,
climate conditions, as well as any alterations to the system
(retrofits) performed. In this section, the influence of different
physical parameters on resource consumption indicators will be
investigated. In this paper, an indicator with a coefficient of
correlation greater than 0.6 will be treated as a potential
indicator, and that with R2 > 0.8—as a potentially strong
indicator. This is in line with assumptions made for similar
studies [14,19,55].

P. Bohdanowicz, I. Martinac / Energy and Buildings xxx (2006) xxx–xxx8
+ Models
5.3.1. Year of construction
The database lacks information on the times of renovations/
refurbishments, thus the influence of facility age on normalised
resource consumption cannot be accurately established. The
coefficient of correlation, R2, for mid-market hotels was
0.0056, while for upscale hotels it was 0.02. Both coefficients
are too low to allow the year of construction to serve as an
indicator of energy consumption. A similarly inconclusive
correlation was obtained for water consumption.
5.3.2. Total hotel floor area (A)
The total energy consumption in individual facilities and the
variation in energy use between hotels correlates significantly
with floor area, as indicated in Fig. 4. The value of R2 > 0.7
obtained for the correlation between energy use and the floor area
is in good agreement with findings from other studies, where
similar values were reported (0.48–0.76) [10], and 0.77 [14]. The
performance of mid-market facilities is much more clustered,
resulting in a somewhat higher level of correlation than observed
in upscale facilities. The more uniform performance observed in
mid-market hotels is to a large degree seen as the result of long-
term corporate-wide resource optimisation.
As regards water use, the coefficient of correlation for water
consumption versus floor area was 0.47 for Hilton and 0.76 for
Scandic. When the area of landscaped grounds (for upscale
facilities only) was combined with the hotel floor area, the
coefficients of correlation between water utilisation and total
area of the premises were found to be 0.62 for facilities with no
gardens, 0.75 for facilities with gardens larger than 10 000 m2
and located in warm climates, and 0.3 for facilities with
landscaped grounds smaller than 10 000 m2 and typically
located in temperate climates. Higher correlation between the
water consumption and combined floor and landscape grounds
area in the warm climates may be indicative of considerable
irrigation needs in these regions, as compared to temperate
zones. The presence of landscaped grounds had some but
Fig. 4. Total annual energy consumption vs. total hotel floor area and brand.
limited influence on the water consumption in Scandic
facilities, due to the infrequent presence of such areas and
the prevailing temperate and cold climates.
The total annual energy utilisation normalised for floor area
(EUI, kWh/m2/year) and plotted against the floor area did not
yield any clear trends, and R2 values were very low (0.03 for
mid-market and 0.09 for upscale facilities). This finding may
support some concerns that have been voiced relevant to the
adequacy of using EUI values as benchmarks or rating bases
[10]. When group averages are used, individual buildings with
excessively high or low EUI’s can strongly influence the
average. It is thus argued that differentiated benchmarking
should rather be used, and that rating systems based on the
simple EUI need to be normalised for other secondary drivers.
Neither did energy or water use normalised per guestroom and
plotted against the number of rooms provide any clear trends.
5.3.3. Services and facilities
The types of services offered and the type (and level of
sophistication) of the technical installations in hotel buildings
are both factors that typically influence resource consumption.
In general, the upscale brand is twice as frequently equipped
with space conditioning systems and other energy- and water-
intensive systems such as health clubs, jacuzzis, spa and pools
as well as on-site laundries, as the mid-market brand (Table 7).
In this study, the differentiation of hotels based on facilities
and specific technical equipment installed was not found to
clearly affect energy consumption. It is reasonable to assume
that the prevalence of air-conditioned (AC) spaces in upscale
hotels does enhance energy use. Here, it was difficult to
evaluate the influence of particular air conditioning systems on
the overall energy consumption, as no system-specific energy
consumption data was available. Mid-market hotels without AC
had an overall (slightly) lower and more clustered normalised
energy consumption, with R2 = 0.17 for EUI versus floor area.
On the other hand, hotels with AC in one or more zones were
found to consume slightly more energy per unit square floor
area, but the correlation factor was lower (less than 0.15).
The availability of health clubs, spas and/or pool facilities was
found to have almost no direct effect on either total or area-
normalised energy consumption versus floor area for the upscale
brand and limited influence for the mid-market group. Also, spa
Table 7
Occurrence of specific services and space conditioning installations in hotel
facilities, % of hotels
Service Hilton, N = 73 Scandic, N = 111
Air conditioning (AC)
in public spaces
90.4 45.0
AC in meeting rooms 100.0 49.5
AC in guestrooms 84.9 27.0
Cooling tower 50.7 9.0
CHP unit 35.6 12.6
Health club 78.1 27.0
Jacuzzi 43.8 (1–16 units,
average 2)
20.7 (1–4 units,
average 1)
On-site laundry 46.6 17.1

P. Bohdanowicz, I. Martinac / Energy and Buildings xxx (2006) xxx–xxx 9
+ Models
and pool facilities were generally found to reduce the correlation
factor for total water utilisation versus floor area, especially in
upscale hotels. Correlation factors were typically higher for
hotels without water-intensive installations (R2 values of 0.65
and 0.41 for Hilton, and 0.79, 0.73 for Scandic facilities, without
and with spa and pool, respectively). This indicates that floor area
in upscale hotels with water-based activities is not a significant
indicator of overall water consumption.
5.3.4. Climate
Considering that half the energy consumed in the hotels
sampled is used for space conditioning, it would be reasonable
to assume that site-specific climate conditions would sig-
nificantly affect the total energy consumption. However, such a
correlation could not be established based on the annual data
collected (Fig. 5). It was difficult to discern any significant
seasonal or brand-related trends. The data collected for 45
individual hotels was thus analysed on a monthly basis,
considering climate variations.
An analysis of individual hotels with monthly energy
consumption and averaged temperature data (obtained from the
Meteonorm software) showed correlations in the range of
R2 = 0.48–0.95 for total energy, and 0.51–0.97 for space
conditioning energy. Deng and Burnett [17] obtained values of
R2 = 0.748 (diesel)–0.897 (electricity) for hotels in Hong Kong.
In the current study, the lower values typically belonged to
hotels offering a large range of additional services, and hotels
located in non-distinctive climates. By contrast, hotels located
in colder climates with more pronounced seasonal weather
variations showed higher R2 values (>0.7). This is partly seen
as a result of the HER database not providing detailed
information on cooling energy (with the exception of district
cooling). On the positive side, HER does provide detailed
information on the energy resources used for heating. Also, the
temperature data provided by the Meteonorm software does not
reflect the actual temperatures measured in a given year but
rather 30-year averages.
Fig. 5. Range of energy use index (EUI) for hotels located in various climate
zones in Europe.
The analysis performed on individual hotels at 17 locations
confirms the assumption that climate conditions in a particular
location are strong determinants of the final energy consump-
tion. In order to develop a reliable resource consumption model,
all space conditioning energy should be adjusted for degree
days. The upgraded version of the reporting tool includes
information on actual heating and cooling degree days,
allowing for more accurate analysis in the future. Alternatively,
measured monthly mean temperatures should be included in the
model. Further investigations on the influence of climate on
energy consumption should be performed based on actual data
from hotels located in the same climatic zone (e.g. the same
city). Water consumption was not found to be highly dependent
on weather conditions.
The above analysis leads to the conclusion that physical
factors, such as climate, hotel size and services offered are to a
large degree responsible for the total consumption of resources in
hotel facilities. For a more comprehensive picture, the influence
of ‘‘dynamic’’—operational factors needs to be evaluated.
5.4. Operational factors affecting energy and water
consumption
Operational factors are the dynamic determinants of hotel
performance. They include the number of guest-nights sold,
food covers served and the amount of laundry washed in-house.
Furthermore, the numbers of daily guests such as conference
participants and users of spa and sport facilities should be
included in the analysis. This study did, unfortunately, not
provide any information on latter variables.
5.4.1. Guest-nights sold
Both energy and water consumption depend to a large extent
on the number of guest-nights sold (Figs. 6 and 7). The
correlation coefficients are, again, higher for the mid-market
hotels, supporting the assumption that these hotels represent
more uniform facility characteristics than the upscale brand.
Fig. 6. Total annual energy consumption vs. number of guest-nights sold.

P. Bohdanowicz, I. Martinac / Energy and Buildings xxx (2006) xxx–xxx10
+ Models
Fig. 7. Total annual water consumption vs. number of guest-nights sold.
An interesting observation was made when water consump-
tion was correlated with the availability of spa/pool facilities.
For Hilton hotels without spa/pool installations the correlation
factor for total water consumption versus total guest-nights sold
was equal to 0.63, while for facilities with spa/pool, R2 = 0.27.
For Scandic hotels there was basically no difference with R2
values of 0.89 and 0.87, respectively. This finding indicates
that, for upscale hotels with spa and pool services, the guest-
night factor alone is not significant enough to explain water
consumption. It is assumed that the correlation factor would be
higher if the number of day-time guests (not staying at the hotel
but using the services) had been considered in the analysis.
While the current HER-system version does not provide such
information, it is intended that the future version will. Further
research is clearly necessary to establish the metrics that will
best describe the water consumption in the upscale brand.
5.4.2. Food covers served
It is reasonable to assume that catering operations would
have a considerable influence on the total consumption of
energy and water in hotels. One food cover served requires
approximately 4–6 kWh of energy and 35–45 l of water [56]. In
the current study, food covers were found to be an important
factor influencing both energy and water consumption at Hilton
and Scandic. As expected, the coefficients of correlation were
higher in the case of mid-market facilities (R2 = 0.66 and 0.6 for
energy and water, respectively). For upscale hotels the
coefficient of correlation was 0.51 for energy and 0.37 for
water consumption.
5.4.3. In-house laundry load
In-house laundry facilities significantly influence resource
consumption. One kilogram of laundry is estimated to require
2–3 kWh of energy and 20–30 l of water [56]. In this study, the
comparison between the two brands could not be performed as
the mid-market brand out-sources all laundry services.
6. Discussion and recommendations
A multiple variable regression analysis was performed to
search for strong indicators of energy and water consumption
and to develop realistic annual consumption models. The initial
versions included a wide range of parameters. In the refining
process, variables that were identified as insignificant (based on
Student’s t-test at a = 0.05, or following common sense) were
excluded from the model. Eventually, this yielded the following
energy models (of total annual energy consumption):
Eupscale ðMWhÞ
¼ 0:227Aþ 0:003gnþ 0:003 fcþ 0:006lþ 1142:24; (1)
where R2 = 0.751, F statistic (the regression mean square
divided by the residual mean square): F = 51.33, standard error
of the estimate: Se = 2873.52;
Emid-market ðMWhÞ
¼ 0:177Aþ 244:6hcþ 0:003gnþ 0:009 fc� 66:86; (2)
where R2 = 0.828, F = 124.85, Se = 747.3; E = total annual
energy consumption (MWh), A = total hotel floor area (m2),
gn = number of guest-nights sold, fc = number of food covers
sold, l = amount of laundry washed on-site (kg), hc = variable
assuming the value of 1 for hotels with an on-site health club
and 0 for those without.
The coefficients of correlation achieved are high, and can be
considered satisfactory for this type of cross-sectional data with
indicated limitations [15]. Although some variables did not
score well in t-tests, they were still included in the model based
on experience that indicated their importance. Of the variables
included, the total hotel floor area (A) is the most significant for
both brands (t = 6.09 for Hilton and t = 7.02 for Scandic). For
the upscale segment, this is followed by the amount of laundry
washed on-site (l) (t = 2.93), food covers ( fc) (t = 0.93) and
guest-nights (gn) sold (t = 0.29). For the mid-market brand food
covers sold (t = 5.71) is the second most influential variable,
followed by the presence of a health club (hc = 1) (t = 1.45) and
guest-nights sold (t = 0.57). According to these results, every
square meter of floor area increases the annual energy
consumption in Scandic and Hilton facilities sampled by
0.117 and 0.227 MWh, respectively. In addition, each guest-
night sold increases the total energy consumption by
0.003 MWh for both brands, while each food cover sold adds
0.003 MWh at upscale hotels and 0.009 MWh at mid-market
facilities. It is assumed that the stronger influence on the total
energy consumption of food covers versus guest-nights sold is
due to catering facilities in these hotels being generally energy-
intensive, and because food and beverage services are
significant service components in upscale hotels and upper
echelon mid-market hotels (especially those located in city
centres and housing popular restaurants and bars). The Grand
Hotel Stockholm is a good example in this context, as discussed
in [30].
It should be noted that the results discussed here suffer
somewhat from the lack of real-life climate data (outdoor

P. Bohdanowicz, I. Martinac / Energy and Buildings xxx (2006) xxx–xxx 11
+ Models
temperature). The availability of accurate weather data would
have undoubtedly had an effect on the overall analysis. Further
work is required to establish the effect of weather conditions on
the energy consumption in hotels.
Based on the assumptions made earlier, water consumption
in upscale facilities was separately modelled for hotels with and
without spa and pool facilities. The following models were
developed as rough estimations of the annual water consump-
tion:
Wupscale ðm3Þ
¼ 0:73Aþ 0:865lgþ 0:202gnþ 0:03 fcþ 0:029l
� 2436:26; (3)
where R2 = 0.581, F = 18.59, Se = 28812.72;
Wupscale-WITH SPA&POOL ðm3Þ
¼ 0:726Aþ 0:872lgþ 0:158gnþ 0:031fcþ 0:025l
þ 3392:16; (4)
where R2 = 0.508, F = 8.05, Se = 36079.79;
Wupscale-NO SPA&POOL ðm3Þ
¼ 0:708Aþ 0:322gnþ 0:032 fcþ 0:04l� 14653:2; (5)
where R2 = 0.886, F = 44.82, Se = 10874.56;
Wmid-market ðm3Þ ¼ 0:177Aþ 0:088lgþ 1015:52sp
þ 0:165gnþ 0:006 fc� 1891:35; (6)
where R2 = 0.892, F = 170.25, Se = 2881.01;
W = total annual water consumption (m3), A = total hotel
floor area (m2), lg = total area of landscaped grounds (m2),
gn = guest-nights sold, fc = food covers sold, l = amount of
laundry washed on-site (kg), hc = variable assuming the value
of 1 for hotels with an on-site health club and 0 for those
without, sp = variable assuming the value of 1 for hotels with
spa and pool facilities and 0 for those without.
The coefficients of correlation for the above models are
much higher than those obtained in a similar study
(R2 = 0.125) [15] and similar to those obtained in other
studies (R2 = 0.88) [16]. Although some variables did not
score well in t-tests, they were still included in the model
based on experience that indicated their importance.
Significant differences in water consumption were observed
between Hilton and Scandic hotels. For the mid-market brand,
guest-nights sold is by far the most influential variable
(t = 9.63) with each additional guest consuming 0.165 m3 of
water, followed by total hotel floor area (t = 3.92, and
0.376 m3 for each m2). If a hotel offers a spa/pool facility the
total annual water consumption of the premise increases by
approximately 1015 m3, while each food cover sold consumes
an additional 0.006 m3. If the hotel has grounds that require
irrigation, each square meter of landscaped ground area
consumes 0.088 m3 of water per year.
Although the presence of spa/pool facilities was not
formally significant (based on t-testing), distinguishing
between upscale facilities with and without water-intensive
facilities yielded some interesting results. In the overall sample
the presence and area of landscaped grounds (requiring
watering) was found to be most significant (t = 3.36), followed
by guest-nights sold (t = 2.21), total hotel floor area (t = 1.84)
and food covers sold (t = 1.52). A very similar pattern can be
observed in the sample with water-intensive facilities. The only
difference is that floor area seems to be more important than
guest-nights. The higher influence of floor and garden area may
be attributed to most of these hotels being located in
Mediterranean climates with extensive irrigation requirements.
It may also be concluded that overnight-guests are not the
primary users of the water facilities. At Hilton facilities without
swimming pools, guest-nights sold was by far the most
important variable (t = 5.68), further supporting the above
conclusion. This was followed by the laundry (t = 3.21)—most
of these hotels are equipped with LivingWell gyms implicating
high demand for clean towels, hotel floor area (t = 0.71), and
food covers sold (t = 0.97).
In general, the correlations between resource utilisation and
indicators were weaker for Hilton than for Scandic facilities
indicating a much more diversified situation in the former
group.
Based on the investigation performed, the following
determinants are considered to be significant in resource
consumption modelling and hotel benchmarking:
� H
otel standard—reflecting the presence and diversity ofenergy- and water-intensive installations for indoor comfort
and service quality;
� T
otal hotel floor area—determining the total consumption ofresources;
� C
limate conditions, including outdoor temperatures and/ordegree days—strongly influencing the energy requirements
for space conditioning;
� P
resence and characteristics of energy- and water-intensivefacilities/services—partially defined by the hotel standard but
not in all cases;
� N
umber of guest-nights sold;� N
umber of food covers served.Additional parameters to be considered include information
on conference centre capacities, space conditioning installa-
tions and requirements of conference rooms, actual number of
conference participants, type, dimensions and water volume
flows at pool/spa facilities, size and water-intensity of
landscaped grounds, number of daily guests using recreational
and health facilities. All space conditioning energy used should
be corrected for degree days to allow for a balanced comparison
between facilities in different locations and individual hotels in
a longer time-span.
These profile data can be used to classify hotels into sub-
groups having similar characteristics. Such sample diversifica-
tion is expected to help in developing more precise resource
consumption models, as well as in establishing adequate and

P. Bohdanowicz, I. Martinac / Energy and Buildings xxx (2006) xxx–xxx12
+ Models
reliable benchmarks [54]. Consumption models should be
developed for highly specialised hotel sub-groups first and then
expanded/generalised to account for larger groups where
applicable.
The results presented above suggest that optimising the
performance of upscale hotels on an individual basis may be
more justified than benchmarking an entire class of hotels, as
the usefulness of a uniform benchmark may be questionable. A
number of options are available towards decreased resource
consumption and improved efficiency in hotel facilities. These
include behavioural changes, mechanical and building system
modifications and retrofits, using computerised building
management systems (BMS), or increasing the use of
renewable energy. A variety of guidelines and recommenda-
tions developed by environmental NGOs, energy information
groups and hotel associations, as well as scientific and research
groups provide useful information along these lines
[7,16,17,19,20,49,51,56–61]. Some of the reporting and
benchmarking tools developed for hotels offer additional
suggestions on possible improvements (IHEI benchmarkhotel,
Hospitable Climates’ HEAT On-line, EPA/DOE Energy Star
Portfolio Manager), while the XENIOS software, developed
within the EU Altener project, was specifically designed to
evaluate the condition and retrofit potential of hotel buildings
[48,62]. The European Union has further sponsored a number
of projects aimed at increasing the awareness of hotel
managers of the need to switch to renewable energy resources
(HOTRES [63]), and to promote eco-labels (EU Leonardo
‘‘Train to eco-label’’ project). On the other hand, performance
optimisation based on benchmarking appears more suited to
the mid-market hotels investigated, as those were found to have
appreciably more homogeneous characteristics. It is believed
that the above findings would be applicable even to other hotel
brands/chains, especially those with facilities having similar
characteristics.
This study brings yet another conclusion, or rather chain of
thoughts. It is well known that hotels are generally complex
systems with individual modules, such as guestrooms, catering
outlets, conference centres, combined into a greater whole. Due
to varied service requirements, the acceptable resource
intensity for e.g. hotel rooms may be quite different from that
for conference rooms, or other areas. Due to the difference in
distribution (proportion of the overall area) of these modules in
different hotels, having one benchmark value for an entire
facility and based on the absolute figures may appear as being
too simplistic. It may thus be more appropriate to disaggregate
hotels into such modules and develop consumption models and
indicators for these particular components. The individual
efficiencies/performance indicators should then be combined
and weighted to provide a just overall evaluation of a facility
that could then be compared to a benchmark (developed in the
same manner).
7. Conclusions
A survey of energy and water use in 184 Hilton International
and Scandic hotels in Europe indicated significant differences
in resource consumption between the two brands. Despite the
limited amount of data available in this study, a number of
significant energy- and water- utilisation indicators were
identified, including hotel standard, location/climate, facility
size, occurrence of energy- and water-intensive services,
number of guest-nights and food covers sold, as well as
quantities of laundry washed on-site. It was further found that a
high heterogeneity of hotel characteristics requires the sub-
classification of hotels into specialised groups or even
disaggregating hotel facilities into components, if reliable
consumption models and benchmarks are to be developed. It is
also suggested that the individual performance optimisation of
upscale hotels may lead to better economic and environmental
results than benchmarking.
Further research is necessary to verify and validate the
findings of this study. Preferably, a consumption model for a
group of hotels in one location should be developed from the
time data. Modelled data should be validated by, e.g.,
comparing predicted and measured energy and water con-
sumption over a period of time of significant duration.
Acknowledgements
The authors wish to acknowledge the financial support for
this research project received from Statens Energimyndighet
(The Swedish Energy Agency). The authors would also like to
thank anonymous reviewers for valuable comments and
insights into the topic and Hilton International and Scandic
for granting access to the HER database.
References
[1] S. Gossling, Global environmental consequences of tourism, Global
Environmental Change 12 (2002) 283–302.
[2] U.S. Energy Information Administration, A look at commercial buildings
in 1995: characteristics, energy consumption and energy expenditures,
Washington DC, 1998.
[3] CHOSE, Energy savings by combined heat cooling and power plants
(CHCP) in the hotel sector, Report of the Commission of the European
Communities, Directorate General for Energy, Stockholm, 2001.
[4] P. Bohdanowicz, European hoteliers’ environmental attitudes: greening
the business, Cornell Hotel and Restaurant Quarterly 46 (2005) 188–
204.
[5] T. Davies, S. Cahill, Environmental implications of the tourism industry,
Resources for the Future, Washington DC, 2000.
[6] International Hotel Environmental Initiative, Hotels care: community
action and responsibility for the environment, London, 2002.
[7] Building Research Establishment and Department of Energy Efficiency,
Energy-efficiency in hotels — a guide for owners and managers, Best
Practice Program Guide, vol. 36, Building Research Establishment and
Department of Energy Efficiency, London, 1993.
[8] R.G. Zmeureanu, Z.A. Hanna, P. Fazio, Energy performance of hotels in
Ottawa, ASHRAE Transactions 100 (1) (1994) 314–322.
[9] C. Noren, J. Pyrko, Typical load shapes for Swedish schools and hotels,
Energy and Buildings 28 (1998) 145–157.
[10] Asia-Pacific Economic Cooperation, Institutionalisation of a benchmark-
ing system for data on the energy use in commercial and industrial
buildings, Asia-Pacific Economic Cooperation, Hawaii, 1999.
[11] B. Nattrass, M. Altomare, The Natural Step for Businesses: Wealth
Ecology and the Evolutionary Corporation, New Society Publishers,
Gabriola Island, BC, 1999.

P. Bohdanowicz, I. Martinac / Energy and Buildings xxx (2006) xxx–xxx 13
+ Models
[12] C. Noren, Load shape development for Swedish commercial and public
buildings — methodologies and results, Lund Institute of Technology,
Lund, 1999.
[13] S.-M. Deng, J. Burnett, A study of energy performance of hotel buildings
in Hong Kong, Energy and Buildings 31 (2000) 7–12.
[14] S. Becken, Ch. Frampton, D. Simmons, Energy consumption patterns in
the accommodation sector—the New Zealand case, Ecological Economics
39 (2001) 371–386.
[15] H. Despretz, Green flag for greener hotels, LIFE No. ENV/00038/FR,
ADEME, ARCS, CRES, ICAEN, IER, SOFTECH, European Community,
Valbonne, 2001.
[16] S.-M. Deng, J. Burnett, Water use in hotels in Hong Kong, Hospitality
Management 21 (2002) 57–66.
[17] S.-M. Deng, J. Burnett, Energy use and management in hotels in Hong
Kong, Hospitality Management 21 (2002) 371–380.
[18] U.S. Energy Information Administration (U.S. EIA), 1999 commercial
buildings energy consumption survey, Washington DC, 2002.
[19] S.-M. Deng, Energy and water uses and their performance explanatory
indicators in hotels in Hong Kong, Energy and Buildings 35 (2003) 775–
784.
[20] O. Perera, S. Hirsch, P. Fries, Switched On—Renewable Energy Oppor-
tunities in the Tourism Industry, United Nations Environmental Program
Publication, 2003.
[21] D.M. Stipanuk, Benchmarks for hotel energy usage, in: Proceedings of the
World Energy Engineering Congress, Association of Energy Engineers,
Atlanta, 2003.
[22] D.M. Stipanuk, Hotel energy and water consumption benchmarks, Final
report to American Hotel and Lodging Association, Washington, DC,
2003.
[23] P. Bohdanowicz, B. Simanic, I. Martinac, Environmental education at
Scandic hotels—approach and results, in: Proceedings of the Regional
Central and Eastern European Conference on Sustainable Building
(SB04), Warszawa, 2004.
[24] P. Bohdanowicz, B. Simanic, I. Martinac, Environmental training and
measures at Scandic Hotels, Sweden, Tourism Review International 9 (1)
(2005) 7–19.
[25] Scandic Hotels AB, Annual report 1999, Stockholm, 2000.
[26] Sanga Saby Kurs och Konference (SSCC), Environmental report 2002,
Svartsjo, 2003 (in Swedish).
[27] Rezidor SAS, Responsible Business progress report 2004, Brussels, 2005.
[28] S.C.M. Hiu, Other energy efficiency technologies—energy consump-
tion patterns in hotels and hospitals, 1991. (http://arch.hku.hk/�cmhui/
SBT/SBT.htm) (last updated 4 February 1999, retrieved 29 November
2000).
[29] F.W.H. Yik, J. Burnett, I. Prescott, Predicting air-conditioning energy
consumption of a group of buildings using different heat rejection
methods, Energy and Buildings 33 (2001) 151–166.
[30] M. Gustafsson, Analysis of electricity consumption and possible savings
at Grand Hotel in Stockholm, Royal Institute of Technology, Stockholm,
2005 (in Swedish).
[31] Canadian University Consortium and Asian Institute of Technology,
Environmental management in Thai hotel industry, 1998.
[32] Australian Institute of Hotel Engineers 1993, Quoted at Australia Save
Water Program web page (http://www.savewater.com.nu) (retrieved 28
July 2003).
[33] S. Alexander, C. Kennedy, Green Hotels: opportunities and resources for
use, Zero Waste Alliance, Washington, DC, 2002.
[34] B. Meade, A. del Monaco, Environmental management: the key to
successful operation, in: Proceedings of the First Pan-American Con-
ference, Latin American Tourism in Next Millennium: Education, Invest-
ment and Sustainability, Panama City, 1999.
[35] S. Gossling, Tourism’s contribution to global environmental change:
space, energy, disease, water, in: C.M. Hall, J. Higham (Eds.), Tourism,
Recreation and Climate Change, Channel View Publications, Clevedon,
2005.
[36] S. Gossling, The consequences of tourism for sustainable water use on a
tropical island: Zanzibar, Tanzania, Journal of Environmental Manage-
ment 61 (2) (2001) 179–191.
[37] S. Pyo (Ed.), Benchmarks in Hospitality and Tourism, Haworth Hospi-
tality Press, Binghampton, 2001.
[38] K.W. Wober, Benchmarking in Tourism and Hospitality Industries, CABI
Publishing, Cambridge, 2002.
[39] International Business Leaders’ Forum & WWF, Why environmental
benchmarking will help your hotel, London, 2005.
[40] P. Bohdanowicz, B. Simanic, I. Martinac, Sustainable hotels—environ-
mental reporting according to Green Globe 21, Green Globes Canada/
GEM UK, IHEI benchmarkhotel and Hilton Environmental Reporting, in:
Proceedings of Sustainable Building (SB05) Conference, Tokyo, (2005),
pp. 1642–1649.
[41] WTO, Indicators of Sustainable Development for Tourism Destinations—
A Guidebook, World Tourism Organization, Madrid, 2004.
[42] H. Coch, Energy and architecture: Bioclimatism in vernacular architec-
ture, Renewable and Sustainable Energy Review 2 (1998) 67–87.
[43] Square One research PTY, Environmental design website 1997–2005
(http://www.squ1.com) (retrieved 15 September 2005).
[44] Meteotest, Global meteorological database for solar energy and applied
meteorology—METEONORM software, 2003 (http://www.meteotest.ch).
[45] SPSS Inc., SPSS 13.0 Brief Guide, SPSS Inc., Chicago, 2004.
[46] World Tourism Organisation, WTO World Tourism Barometer 3 (1)
(2005).
[47] P. Bohdanowicz, A study of environmental impacts, environmental aware-
ness and pro-ecological initiatives in the hotel industry, Royal Institute of
Technology, Stockholm, 2003.
[48] E. Dascalaki, C.A. Balaras, XENIOS—a methodology of assessing
refurbishment scenarios and the potential of application of RES and
RUE in hotels, Energy and Buildings 36 (2004) 1091–1105.
[49] Accor Group, The Environmental Guide for Hotel Managers, Accor
Group, Paris, 1998.
[50] Nordic Ecolabelling, Nordic ecolabelling of hotels and youth hostels,
Criteria Document, Version 2.0, 3 October 2002–30 September 2006,
Nordic Swan Ecolabel, SIS Miljomarkning, Stockholm, 2002.
[51] Conservation International and the Prince of Wales International Business
Leaders Forum, Sustainable Hotel Sitting Design and Construction,
Nuffield Press, London, 2005.
[52] Green Globe 21, Travel and tourism industry earthcheckTM
baseline and
best practice indicators, 2004 (http://www.greenglobe21.com) (retrieved
11 November 2004).
[53] A. Goodman, Implementing sustainability in service operations at Scandic
Hotels, Interfaces 30 (2000) 202–214.
[54] J. Warnken, M. Bradley, Ch. Guilding, Eco-resorts vs. mainstream accom-
modation providers. An investigation of the viability of benchmarking
environmental performance, Tourism Management 26 (2005) 367–379.
[55] N.E. Matson, M.A. Piette, High performance commercial building sys-
tems — review of California and national benchmarking methods, Ernest
Orlando Lawrence Berkeley National Laboratory, Berkeley, 2005.
[56] International Hotel Environmental Initiative, Environmental Management
for Hotels, Butterworth–Heinemann, Oxford, 1993.
[57] IH&RA, IHEI, UNEP, Environmental Action Pack for Hotels: Practical
Steps to Benefit Your Business and the Environment, IH&RA, IHEI,
UNEP, Paris, London, Nairobi, 1995.
[58] Centre for Analysis and Dissemination of Demonstrated Energy Tech-
nologies, Energy efficiency in hotels and motels, Sittard, 1997.
[59] American Hotel and Lodging Association, Energy Management and
Conservation Guide, Funded by American Hotel and Lodging Foundation,
Washington, 2001.
[60] H. Genot, N. Pogson, P. Francois, G. Carbone, Sowing the Seeds of
Change—An Environmental Teaching Pack for the Hospitality Industry,
EUHOFA, IH&RA, UNEP, Paris, 2001.
[61] Energy Innovators Initiative, Saving Energy Dollars in Hotels Motels and
Restaurants, Natural Resources Canada, Ottawa, 2003.
[62] E. Dascalaki, C. Balaras, A. Francesco, J. Cabot, D. Caccavelli, X.
Casanovas, A. Cladera, A. Lagoudi, T. Martinez, A. Moya, K. Tsakma-
kidou, XENIOS—a decision making methodology and software for
assessing refurbishment scenarios in hotels, in: Proceedings of the Renew-
able Energy Sources for Islands, Tourism and Water Desalination, EREC,
Crete, (2003), pp. 567–575.

P. Bohdanowicz, I. Martinac / Energy and Buildings xxx (2006) xxx–xxx14
+ Models
[63] M. Karagiorgas, T. Tsoutsos, V. Drosou, S. Pouffary, T. Pagano, G. Lopez
Lara, J.M. Melim Mendes, HOTRES: renewable energies in the hotels. An
extensive technical tool for the hotel industry, Renewable and Sustainable
Energy Reviews 10 (2006) 198–224.
Paulina Bohdanowicz is a lecturer at the Department of Energy Technology,
Royal Institute of Technology, Stockholm, Sweden. Her research area includes
corporate social responsibility and environmental issues in the hotel, travel, and
tourism industry, with particular focus on energy aspects. She is also interested
in eco-certification and eco-labelling schemes, as well as environmental
reporting and benchmarking tools for the hotel and tourism industry. Within
her research she investigates how tourism can enhance the environmental
awareness among the general public, as well as the tools that can be developed
and used to that end. She is also closely cooperating with the hotel industry in
Sweden and internationally.
Ivo Martinac is director of the Environmental Sustainability in Tourism
Program at the School of Travel Industry Management at the University of
Hawai’i at Manoa and head of the Division of Sustainable Building Systems at
the Royal Institute of Technology, Stockholm, Sweden. His main research
expertise is in the domain of energy efficiency and environmental management
in buildings, with a focus on tourism facilities. He has a special interest in
responsible tourism (infrastructure) development, particularly in Asia-Pacific.
He is visiting professor at the School of Architecture, South East University
Nanjing, China, as well as the Space Thermal Science Center at Shandong
University, Jinan, China.

Paper IX

Submitted to Building and Environment
1
A study of resource consumption modelling of mid-market chain hotels in Stockholm
Paulina Bohdanowicz * and Ivo Martinac
Paulina Bohdanowicz, TeknLic., MSc., BSc. (corresponding author)
Sustainable Building Systems, Department of Energy Technology, Royal Institute of Technology,
Brinellvägen 68, 100 44 Stockholm, Sweden
Phone: +48 662 25 25 20, Fax: +46 8 20 41 61
E-mail: [email protected], [email protected]
URL: www.greenthehotels.com
Ivo Martinac, PhD
School of Travel Industry Management, University of Hawai'i at Manoa,
2560 Campus Road, #225 Honolulu, HAWAI'I 96822
Phone: +1 (808) 203-7276, Fax: +1 (808) 956-5378
E-mail: [email protected]
Abstract
This paper reports on a study of resource consumption in 15 mid-market chain hotels in the Greater
Stockholm area. An overview of the characteristics and performance indicators of these hotels is
first presented. This is followed by the development of an energy and water consumption model for
this group of facilities based on single-year (2004) and multi-year (2000-2004) monthly data. A
multiple-variable regression analysis indicated that, among (service-wise) homogeneous mid-
market hotels, energy consumption was influenced by the absolute difference between the design
indoor temperature and monthly average outdoor temperature, total hotel floor area, and the
amount of water consumed (R2=0.838). Water consumption was found to mainly depend on the
number of guest-nights sold, total hotel floor area and the presence of spa/pool facilities (R2=0.846).
The trends between modelled and real data were found to be similar for individual facilities, with
better fits achieved for more brand-representative hotels.
The paper concludes with recommendations on data collection procedures relevant to the reliable
modelling of resource consumption in hotels.

Submitted to Building and Environment
2
Keywords: chain hotels, resource consumption, performance indicators, energy and water use
modelling, Scandic, Stockholm
1. Introduction
Hotels represent a unique category of commercial buildings. They are designed to provide
high levels of comfort and services to customers on a 24-hour-a-day, 7-day-a-week, year-round
basis. In order to attract more customers and remain profitable on a highly competitive market, the
hotel industry is continuously seeking to improve on the level of differentiation and quality of its
products. On a global scale, this is often done with little concern for associated environmental or
socio-economic impacts, leading to many forms of overexploitation (not only of energy and other
resources). Gössling [1] estimated that global hotel industry occupies ca. 480 km2 of land, and that
hotel facilities worldwide consumed 97.5 TWh (351.1 PJ) of energy in 2001. The existing data on
water consumption in the international hotel industry is, unfortunately, not detailed enough to
provide an accurate picture of the global situation. With ca. 50% of all hotel rooms located in
Europe [2], the absolute resource consumption figures for the region constitute less than half of the
global amounts [3].
Increasing social awareness about the built environment’s contribution to growing
environmental degradation, combined with continuously increasing prices of basic commodities,
such as energy and water resources, call for a significant reduction in resource utilisation in the built
environment. In addition, the concept of Corporate Social Responsibility (CSR) is gaining increased
interest in many branches of industry. CSR is broadly defined as “actions that appear to further
some social good, beyond the interests of the firm and that which is required by law” [4]. Discussing
Social Corporate Responsibility a reference is frequently made to a triple bottom line concept which
covers economic, as well as social and environmental benefits [5]. CSR is believed to be a way to
reduce energy consumption and waste generation, as well as to save costs related to high labour
turnover [6]. Businesses, especially some multinational corporations, use CSR as means of building
trust in their organisation and its products [7], as well as additional brand quality insurance [8]. In
addition, CSR is increasingly used by businesses within the context of product/service
differentiation and marketing strategies as a tool for enhancing competitive advantage and
corporate reputation [9]. Many leading European companies regularly publish reports on social and
environmental issues relevant to their operations, in addition to traditional financial statements [10].
This also applies to the hotel industry, where interest in CSR and sustainability indicators, such as
Global Reporting Initiative (GRI), Dow Jones and FTSE4Good indexes, is growing rapidly.

Submitted to Building and Environment
3
Resource efficiency and environmental responsibility are increasingly becoming integral aspects of
hotel operations.
Increasing energy and water prices (worldwide) are providing additional incentives to
integrate resource utilisation efficiency into daily hotel operations. In response to growing demand,
numerous guides on how to responsibly manage facilities and conserve resources have been
published internationally [11-24].
While the literature dealing with performance indicators in the international hotel industry is
relatively extensive (reviewed in [25]), only few studies have dealt with the influence on the energy
and water consumption of operational drivers, or modelled the use of resources in hotels [26-35].
The aim of this study is to provide a better understanding of key factors determining the
energy and water consumption in mid-market chain hotels. First, the hotel characteristics and key
performance indicators are presented and discussed. Next, resource consumption models for a
sample of Stockholm hotels are developed and tested based on single-year and multi-year monthly
resource consumption data, and the influence of operational characteristics on resource
consumption in individual hotels is analyzed. Finally, recommendations are given relevant to
appropriate data collection and resource consumption modelling in hotels.
2. Modelling resource consumption in hotel facilities
The resource consumption in hotels differs from what is commonly seen in other types of
commercial buildings. As reported in the literature, consumption varies significantly not only
between regions, but also within a region (summarised in [25,35]). Variations in reported and
recommended resource consumption indicators in Sweden are presented in Table 1.
Insert Table 1 about here
Significant variations in facility types within the hotel sector make it difficult to provide a
general model explaining the resource consumption of individual facilities. Nevertheless, as
previously mentioned, a number of attempts have been made to develop such models. The models
vary in applicability (valid for a single hotel or for hotel samples including up to 160 units), number of
factors/variables included, data collection and verification procedures, as well as modelling
methodologies used. While 81 variables were tested for their influence on the total hotel energy use
in one study [26], considerably fewer variables are generally considered (due to availability). The
following variables are typically investigated with regard to energy consumption: hotel standard,
hotel floor area, heating and cooling degree days, guest-nights (occupancy), (warm) food covers
sold, presence of heated swimming pools, comfort level, chain affiliation, as well as corporate

Submitted to Building and Environment
4
(management and staff) and customer awareness [29,30,35,43]. Outdoor temperature (degree
days) and hotel floor area are typically indicated as major energy use drivers [26,30]. Water
consumption is typically considered to depend on guest-nights and food covers sold, quantity of in-
house laundry, hotel floor area, green area watered, climate zone, presence of swimming pools,
comfort level, chain affiliation, as well as corporate (management and staff) and customer
awareness [30,31,35]. Although more variables were found to be important water use drivers,
number of guests served, warm meals prepared and quantity of in-house laundry are typically listed
as the most significant factors [30,31,35]. Key correlation coefficients (R2) in these studies were
reported as 0.63-0.96 for energy consumption and ca. 0.125-0.88 for water consumption,
depending on the model and data available.
This study attempts to link models developed for single hotel facilities with models used to
describe groups of hotels with highly varied characteristics. To this end, a group of mid-market
hotels, all located in the same climate zone, and offering relatively uniform services were
investigated. Key factors determining the energy and water consumption in these hotels were
identified and used in developing resource consumption models for these facilities. The paper
concludes with recommendations concerning data collection procedures in the context of resource
consumption modelling in hotels.
3. Methodology
This study is based on data obtained from the Hilton Environmental Reporting (HER)
database, to which access was granted by Hilton International1 and Scandic. HER is a web-based
platform developed to allow individual hotels to report their monthly (operational, environmental and
resource-consumption related) performance data to a central database. The system has been
described in detail in [38,44-46]. Following an initial review of the data submitted, all reporting
facilities were asked to double-check and verify the data contained in the database. For the purpose
of this study, 15 hotels located in the Greater Stockholm area were selected from the database, and
the monthly reports for these facilities, submitted for the period 2000-2005 were used. One hotel in
this sample belongs to the Hilton brand (upscale) while all others are Scandic facilities (mid-market).
Despite this apparent difference in hotel class, all 15 hotels were analysed without brand
1 Hilton International operated 262 Hilton and 131 Scandic hotels worldwide (with the exception of
the USA). On 23 February 2006 it was acquired by Hilton Hotels Corporation (NYS:HTL), the
leading global hospitality company, with nearly 2700 hotels and 475000 rooms in more than 80
countries. All activities described in this paper relate to Hilton International and Scandic facilities in
Stockholm.

Submitted to Building and Environment
5
differentiation, as this particular Hilton facility (re-branded from Scandic to Hilton in 2001) reported
resource consumption data comparable to the data submitted for the 14 Scandic facilities.
The hotels investigated represent 88% of all Hilton and Scandic facilities in Stockholm, and
14% of all hotels in Stockholm [47]. A pre-study of 111 European Scandic hotels2 reported in [35]
indicated a high level of homogeneity among these facilities, and the results of the analysis
presented here can be considered representative for the Nordic portfolio of Hilton International and
Scandic. The general trends observed in this research are also assumed to be representative of
other chain hotels within the mid-market range with similar operational characteristics.
For the purpose of this study, the following monthly data for the years 2004 and 2005 was
extracted from the database: hotel name, brand, year of construction, total hotel floor area - A
(space conditioned – heated and/or cooled, m2), area of irrigated/landscaped grounds (m2), number
of guestrooms, number of catering outlets, restaurant seating capacity, presence of pool & spa
facilities, presence of small and large conference facilities (below/above 250 participants), presence
of air-conditioned spaces, number of permanent team members, number of guest-nights sold,
number of food covers sold, amounts of all types of energy resources utilised (i.e. electricity, district
heating/cooling, fuel oil, diesel oil, town gas, LPG), total amount of water used (cold and hot), as
well as actual and standardised heating degree days.
For the period 2000-2003, the following data was considered: hotel name, brand, year of
construction, hotel floor area, number of guestrooms, number of guest-nights sold, amounts of all
types of energy resources utilised, heating degree days, and the total amount of water used (on a
monthly basis). Weather data, such as average monthly temperatures (tmo, oC) for Stockholm, was
obtained from the Swedish Meteorological and Hydrological Institute (SMHI). The consumption of
heating energy was corrected for degree days3, or correlated to average outdoor temperatures. The
corrected total energy consumption was normalised for unit hotel floor area and guest-nights sold,
2 Information on hotel characteristics (year of construction, total hotel floor area, landscaped area,
services and amenities offered), total number of guest-nights and food covers sold, as well as total
amounts of energy and water used in the year 2004 was extracted from the HER database. A multi-
variate step-wise regression analysis was used to develop annual energy and water consumption
models. 3 All heating energy (district heating and natural gas used for heating) was corrected for heating
degree days assuming: daysdegreeactual
daysdegreeedstandardiznconsumptioenergyactualnconsumptioenergyedstandardiz ×=

Submitted to Building and Environment
6
while water consumption was normalised for guest-nights4. The statistical data analysis (multi-
variate step-wise regression) of the data was performed using the Statistical Package for Social
Sciences – SPSS software (Version 13.0) [48].
4. Limitations
While the HER database is unusually comprehensive and broad from the current corporate
perspective (and needs identified), it suffers from certain limitations when used for academic
purposes. Some information that would be helpful for a more accurate analysis and modelling, such
as a detailed description of hotel services and facilities, or the number of conference participants
and daily guests, is not collected in the existing version of the reporting system. The issue of
broadening the range of data collected is currently being addressed by the system developers.
For the purpose of this paper other sources of information were used, including hotel
directories and direct communication with general managers and system users. These sources
provided information relevant to physical factors, such as type of hotel (city/business, highway, or
resort) and services offered (swimming pool, spa, sauna, jacuzzi, capacity of the conference
centre). Two hotels with in-house restaurant facilities did not report food covers sold and were
initially not included in some of the models. Data from all hotels was however included in the final
models.
Bearing in mind these limitations, the trends and patterns that resulted from the data
analysis will be presented and discussed.
5. Characteristics of the hotels investigated
Scandic is strongly positioned within the mid-market class of hotels in Scandinavia. The 15
facilities investigated are all located in the Greater Stockholm area (17OE and 59ON), and are
representative of the chain in terms of location (city centre, or along highways), year of construction
(1957-2002), building size (113-403 rooms, 4 260-25 000 m2) and energy sources used.
Fourteen facilities are connected to the local district heating network providing space heating
and hot water, while one facility uses a gas-fired boiler for heat generation. Six hotels use natural
gas in the kitchen. Six facilities are fully air-conditioned (AC), three provide air conditioning in some
areas, while the remaining six have no air conditioning at all. Six facilities are served by district
4 The normalisation was performed assuming:
sold)nights-guestofnumbertotalarea,floortotal(i.e.factorgnormalisinhoteltheatconsumedresourcetotalnconsumptionormalised =

Submitted to Building and Environment
7
cooling. Eight hotels offer conference facilities for over 250 participants, while the others offer
smaller meeting rooms. Sauna facilities are offered in eleven hotels, four of which also provide pool
and spa services.
In 2004, the hotels investigated collectively consumed about 50.5 GWh of energy, and
almost 297 x 103 m3 of water, serving ca. 1.3 million guests. (Hydro)Electricity was the dominant
energy carrier (47.6%), followed by district heating (44.3%), natural gas (4.7%) and district cooling
(3.4%). Indicators of energy and water performance for this hotel group are presented in Table 2.
Insert Table 2 about here
The individual indicators were in agreement with figures reported for other chain hotels of
similar standard, as well as benchmarking guidelines, as shown in Table 1. It is worth noting that
the standard deviation values obtained were relatively high, indicating a significant spread in
performance between the individual facilities. An overview of performance data for the period 2000-
2004 is provided in Table 3.
Insert Table 3 about here
Table 3 shows that the area-normalised energy consumption and its variation have been
decreasing over the time studied, indicating a more uniform energy performance. This is interpreted
as being (at least partly) the result of comprehensive environmental initiatives and resource
conservation programmes implemented at Scandic Sweden facilities over the last 10 years, see
also [38]. The values of energy and water consumption normalised for guest-nights show a greater
degree of variation and less clear trends.
The next step involved a more detailed investigation and modelling of the factors influencing
energy and water consumption in this group of hotels.
6. Modelling energy and water utilisation
Resource use intensities (energy use intensity – EUI, and water use intensity - WUI) are
important indicators of hotel performance but they do not provide any information on factors
affecting resource consumption. An initial study on resource consumption in 111 European Scandic
hotels indicated that total hotel floor area, guest-nights and food covers sold are among the factors
influencing annual utility use according to the following models [35]:
86660090003062441770 .fc.gn.hc.A.(MWh)E marketmid −⋅+⋅+⋅+⋅=− (1)

Submitted to Building and Environment
8
Where: E = total annual energy consumption (MWh), A = total hotel floor area (m2), hc = variable
assuming the value of 1 for hotels with an on-site health club and 0 for those without, gn = number
of guest-nights sold, fc = number of food covers sold; (with: R2=0.828, F=124.85 (F statistic =
regression mean square divided by the residual mean square); Se= 747.3 (standard error of the
estimate));
35.1891006.0165.052.1015lg088.0177.0)( 3 −⋅+⋅+⋅+⋅+⋅=− fcgnspAmW marketmid (2)
Where: W = total annual water consumption (m3), A = total hotel floor area (m2), lg = total area of
landscaped grounds (m2), sp = variable assuming the value of 1 for hotels with spa and pool
facilities and 0 for those without, gn = number of guest-nights sold, fc = number of food covers sold;
(with R2=0.892, F=170.25, Se= 2881.01).
That study was, however, incomplete as weather data and detailed descriptions of the
facilities were not available. In this follow-up study, the previous deficiency is addressed by
incorporating monthly average outdoor temperatures in the models.
A multiple step-wise regression analysis was applied in this study. First, monthly data from
the year 2004 was used to create energy and water consumption models for the hotel sample
investigated. While the initial models included a wide range of factors, some variables turned out to
be insignificant (based on Student’s t-test at α=0.05, or by simple logic) and were excluded from the
final models. The models developed using 2000-2004 data only consider variables that were found
significant for the 2004 data-set. The resulting models are described in more detail further below.
Single-year energy and water consumption models (2004 data)
Factors initially tested in the energy model included: absolute value of temperature
difference between design indoor temperature (tdi) and average monthly outdoor temperature (tmo):
modi ttt −=Δ , tdi = 18oC (according to Swedish building regulations [49]), total hotel floor area (A),
number of catering outlets, restaurant seating capacity, presence of spa/pool and sauna/jacuzzi,
presence of small/large conference facilities (below/above 250 participants), presence of air
conditioned spaces, number of permanent team members, number of guest-nights and food covers
sold and the amount of water used (all on monthly basis). The heating energy data used in the
model was not corrected for degree days. As two hotels did not provide information on the number
of food covers sold, or the number of permanent team members employed, these facilities were
excluded from the initial analysis. Although the overall fit of the initial model was quite good (with

Submitted to Building and Environment
9
R2=0.893, Se=53.67 and F=97.35), subsequent t-testing rendered some indicators insignificant (for
df>150, t significant: -1.96 ≥ t ≥ 1.96 [50]) and these were excluded from the model. The final model
for total monthly energy consumption (based on data reported for all 15 hotels, and using the
indicators presented in Table 4) assumed the following form:
131.1220710013.0957.112004, −⋅+⋅+Δ⋅= w.At(MWh)Emonthly (3)
Where: E = total monthly energy consumption (MWh); Δt = absolute value of temperature
difference between the design indoor temperature (tdi) and average monthly outdoor temperature
(tmo): modi ttt −=Δ , tdi = 18oC (according to [49]) (oC); A = total hotel floor area (m2); w = quantity of
water consumed monthly, measured quantity (m3); (with R2=0.838, F=303.5, Se= 62.26).
Insert Table 4 about here
The coefficient of correlation achieved was high, and can be considered satisfactory for this
type of cross-sectional data, considering the limitations mentioned earlier [30]. The absolute
temperature difference was found to have the strongest influence on the overall energy
consumption, which is in line with space-conditioning (mainly heating) being the dominant energy
expenditure in the Swedish climate. According to these results, every square meter of floor area
increased the (total monthly) energy consumption in the hotels sampled by 0.013 MWh, while each
cubic meter of water used increased energy consumption by 0.071 MWh. A 1-degree-C increase in
Δt increased the energy consumption by 12 MWh. While many hotels provide air conditioning, the
prevailing summer air temperatures in Stockholm do not require extensive cooling. By contrast,
conference spaces require cooling year round, regardless of outdoor temperatures. Contrary to the
initial European study, but in line with study by [30], food covers were not found to significantly
influence energy consumption, which allowed all 15 hotels to be included in the final model.
Water consumption was initially modelled based on total hotel floor area, landscaped
grounds area, number of catering outlets, restaurant seating capacity, presence of spa/pool
facilities, presence of conference facilities, number of permanent team members, average monthly
outdoor temperature, and the number of guest-nights and food covers sold. Contrary to the results
of the European pre-study [35] and study by [30], an initial analysis of Stockholm facilities sampled
indicated that food covers served did not have a significant impact on water consumption.
Therefore, all 15 hotels were included in the modelling. It is assumed that this is because most
hotels only provided breakfast service, and did not offer more advanced dining options (except for
some facilities that operated restaurants open to the public). It was further observed that HER

Submitted to Building and Environment
10
system users sometimes estimated the amount of food covers sold based on the amounts of raw
products purchased rather than actual restaurant data, thus introducing additional errors into the
reporting system. Upon excluding all insignificant variables, a regression analysis yielded the results
shown in Table 5, leading to the following model for total monthly water consumption:
706.249677.150076.0115.0)( 32004, −⋅+⋅+⋅= spAgnmWmonthly (4)
Where: W = total monthly water consumption (m3); gn = number of guest-nights sold; A = total hotel
floor area (m2); sp = variable assuming the value of 1 for hotels with spa and pool facilities and 0 for
those without; (with R2=0.846, F=321.22, Se= 332.84).
Insert Table 5 about here
The correlation coefficient for water consumption was found to be much higher than that
obtained by [30] in a similar study (R2= 0.125). Guest-nights sold, and total hotel floor area, were
found to have the most significant influence on monthly water consumption. The analysis yielded
that each guest-night sold accounted for the consumption of 115 litres of water. Similarly, each
square meter of gross hotel floor area translated into a (base) use of 76 litres of water/month. The
presence of spa or pool facilities increased the monthly water consumption by 151 m3.
Model validation
Next, an attempt was made to validate the models. First, the above energy model was
applied to the independent variables from 2004 and the results compared with the total monthly
energy consumption reported for individual facilities (Figure 1).
Insert Figure 1 about here
It can be concluded that the overall trend predicted by the model fits well with the trend in
measured data. For facilities most representative of the Scandic brand (highway location, lodging
and some conference facilities), the model showed a good fit to the measured data (Figure 1a). At
times, however, the model underestimated the energy consumption during the summer months. It is
assumed that this is because the model did not account for the real base load of the facility
(electricity). For the hotel equipped with an on-site gas-fired boiler (Hotel 2, Figure 1b) this under-
prediction may (in part) be the result of differences in heating efficiency, as most heating energy
data in the sample was submitted by facilities served by district heating. The latter report the
amount of heat actually delivered to their facilities (invoices are based on the volumetric flow of

Submitted to Building and Environment
11
water and temperature differences between supply and return lines), while this particular hotel
reported the amount of town gas purchased (in m3), and no correction for the conversion efficiency
could be made. The model sometimes underestimated energy consumption during the winter
months, while it overestimated the consumption in the summer months (Figure 1c). The under-
predicting during winter is assumed to be due to the actual heating and lighting energy use
exceeding the values predicted based on the input data. On the other hand, the over-predicting
during summer is believed to be the result of the physical lack of cooling installations in some
facilities, while the model predicted a cooling load for the summer months. Differences between
modelled and predicted values are further assumed to be due to differences in the (building
envelope) thermal characteristics of different hotels, as well as to differences in the energy-
efficiency retrofits carried out in the various facilities.
The energy model was subsequently validated against data reported in 2005. Applying the
model to individual hotels yielded similar results as before in terms of divergence between
calculated and real data. The trends between modelled and real data were, nevertheless, found to
be similar for all facilities, with better fits achieved for more brand-representative hotels.
A similar analysis on 2004 data was performed for water consumption, and indicated that the
model was generally most accurate for facilities that were not water-intensive (Figure 2). Similar to
the energy consumption case the model did not account for the possible efficiency improvements
incorporated in the facility, thus the consumption was frequently overestimated. The presence of
swimming pool, although accounted for by the model still resulted in underestimated monthly
consumption figures (Hotel 1). The model would have benefited from more detailed information on
the dimensions of the swimming pool, or water volume flow data (unavailable at the time of study).
For the Stockholm case, the presence of green areas requiring watering did not affect the accuracy
of the model (Hotel 2). As the water use for the catering purposes has not been accounted for in the
model, the calculated values underestimated the water consumption for hotels with significant
catering services (Hotel 3).
Insert Figure 2 about here
Similar as for energy, the model was next validated for 2005 data. Applying the model to
individual hotels yielded comparable results in terms of the divergence between calculated and real
data. The trends between modelled and real data were, again, found to be similar for all facilities,
with better fits achieved for more brand-representative hotels.
This suggests that the models presented here may be applicable to other Scandic hotels
characteristic of their brand.

Submitted to Building and Environment
12
Multi-year energy and water consumption model (2000-2004)
The multi-year (2000-2004) regression analysis was based on the variables established as
significant in the single-year models, yielding the following models for total monthly energy and
water consumption:
668.1430580017.0133.1220042000, −⋅+⋅+Δ⋅=− w.At(MWh)Emonthly (5)
Where: E = total monthly energy consumption (MWh); Δt = absolute value of temperature difference
between the design indoor temperature (tdi) and average monthly outdoor temperature (tmo):
modi ttt −=Δ , tdi = 18oC (according to [49]) (oC); A = total hotel floor area (m2); w = quantity of water
consumed monthly (m3); (with R2=0.751, F=808.6, Se= 87.61).
776.264775.161077.0127.0)( 320042000, −⋅+⋅+⋅=− spAgnmWmonthly (6)
Where: W = total monthly water consumption (m3); gn = number of guest-nights sold; A = total hotel
floor area (m2); sp = variable assuming the value of 1 for hotels with spa and pool facilities and 0 for
those without; (with R2=0.737, F=750.91, Se= 470.21).
As can be seen in Eqs. 5 & 6 the various coefficients are comparable to those established
for the 2004 models (Eqs. 3 & 4), indicating similar hotel performance over time.
Performance indicators at individual hotels
The dependence of resource consumption in individual hotels was further analysed as a
function of operational and weather data. In this case, the energy model was developed to include
monthly average outdoor temperature, number of guest-nights sold and total water consumption,
while only guest-nights were considered in the water consumption model. First, the long term data
(2000-2004) was used, yielding coefficients of correlation in the range of 0.533-0.94 for energy (one
facility with R2=0.127 was excluded, while 9 facilities scored R2>0.8), and 0.176-0.873 for water (4
hotels with R2<0.1 were excluded, while 3 hotels scored R2>0.81). Next, single year data was used
(2004 and 2005, respectively, with food covers sold as an additional independent variable),
resulting in appreciably higher coefficients of correlation (see Table 6).

Submitted to Building and Environment
13
Insert Table 6 about here
As presented in Table 6, showing the dependence of total monthly energy consumption on
the chosen set of variables (tmo, gn, fc, w), R2 values ranged 0.562-0.922 (2004 data) and 0.580-
0.980 (2005 data), with R2>0.9 for the majority of facilities investigated. Correlation coefficients for
the dependence of monthly water consumption on guest-nights and food covers sold were much
lower: 0.062-0.98 for 2004 data, and 0.081-0.94 for 2005 data. Typically, hotels characterized by
low water R2 coefficients were those with swimming pools, large landscaped areas and conference
facilities, as well as popular restaurants. Swimming-pool water needs to be continuously
circulated/refreshed, regardless of the number of users, which may partly explain the low coefficient
of correlation between water consumption and guest-nights sold in facilities with swimming
pools/spas. Also, one of the hotels has no individual water metering and receives invoices bi-
monthly (reporting identical water consumption for every set of two consecutive months) which
decreases the validity of this data for any particular month. Conference participants and restaurant
guests also use water, but the current reporting system does not collect relevant data.
With the above exceptions, the analysis performed on individual hotels leads to the
conclusion that the energy consumption in individual facilities is highly dependent on outdoor air
temperature (the most significant according to t-statistic), while water consumption is mainly
influenced by the number of guest-nights sold and the (base-load related) regression “constant”.
These observations are in line with the expectations.
The general similarity of the hotels sampled facilitated the development of models based on
a very limited number of key indicators. The fit between modelled and reported data was particularly
close for brand-specific facilities, allowing the establishment of a common benchmark for highly
uniform mid-market hotels, based on relevant climate zone and with due correction of key
performance indicators for applicable total hotel floor area and number of guest nights sold.
7. Discussion and recommendations
Based on the investigation performed, the following determinants are considered to be
significant in resource consumption modelling in hotels belonging to specific brands/categories:
Total hotel floor area – determining the total consumption of resources;
Climatic conditions, including outdoor temperatures, degree days, and locally specific design indoor
temperatures – strongly influencing the energy requirements for space conditioning;

Submitted to Building and Environment
14
Presence of energy- and water-intensive facilities/services (such as conference centres, availability
and type of air conditioning, pools/spas, saunas/jacuzzis, etc.) – differentiating hotels within one
class;
The number of guest-nights sold;
The number of food covers served.
Other parameters believed to be of importance include information on the actual number of
conference participants, as well as the number of daily guests using spa/pool and health facilities.
Unfortunately, it was impossible to verify the influence of these parameters on resource
consumption as this data was not available from the system or directly from individual hotels.
Information on pool dimensions and water flow rates within water-intensive installations would have
enhanced model accuracy.
For greater reliability, resource use data should preferably be collected from (several)
independent sources, including on-site metering, invoice data, and readings made by utilities.
Estimating the number of hotel/conference guests, or meals served should be avoided, and actual
data used to the extent possible. Climatic data should be obtained from reliable meteorological
databases, with due relevance for the locations in question.
7. Conclusions
A survey of energy and water use in 15 mid-market Scandic hotels in Stockholm was
performed. The individual energy and water performance indicators obtained for these hotels were
in agreement with figures reported for other chain hotels of similar standard, as well as
benchmarking standards for Sweden.
A multiple-variable step-wise regression analysis indicated that, among (service-wise)
homogeneous mid-market hotels, energy consumption was influenced by the absolute difference
between the design indoor and monthly average outdoor temperature, total hotel floor area, and the
amount of water consumed (R2=0.838). Water consumption was found to mainly depend on the
number of guest-nights sold, total hotel floor area and the presence of spa/pool facilities (R2=0.846).
The trends between modelled and real data were found to be similar for individual facilities, with
better fits achieved for more brand-representative hotels.
On individual facility level, energy consumption was found to be highly dependent on the
outdoor air temperature, while water consumption was mainly influenced by the number of guest-
nights sold. Overall trends and resource consumption models developed in this study may be
applicable to other hotels provided their characteristics are similar. It is further concluded that for
groups of highly uniform (mid-market) hotels it is possible to establish a common benchmark, based

Submitted to Building and Environment
15
on relevant climate zone and with due correction of key performance indicators (floor area and
guest-nights sold).
8. Future studies
Further research is necessary to verify and validate the findings of this study. Preferably, a
consumption model should be developed for a larger group of hotels belonging to a specific class,
with a differentiated repertoire of services, and located in different climate zones. This ought to
provide more detailed information on the influence of climatic parameters, and individual services
on the overall resource consumption. Development of consumption models should also be
performed for individual facilities representing various system and service configurations
characteristic for the chain studied. More differentiated sub-metering of the energy and water
utilisation in individual hotels also ought to provide a better understanding of the contribution to
overall resource consumption of individual sub-systems. Studies conducted over greater lengths of
time should better capture the influence of engineering, system or behavioural
improvements/changes occurring over the lifetime of a facility.
Acknowledgements
The authors wish to acknowledge the financial support for this research project received from
Statens Energimyndighet (Swedish Energy Agency). The authors would also like to thank Hilton
International and Scandic for granting access to their database (HER).
References
[1] Gössling S. Global environmental consequences of tourism. Global Environmental Change
(2002), 12; 283-302.
[2] Olsen MD, Zhao J, Sharma A, Choi J-G. Leading hospitality into the age of excellence:
Expansion, competition and vision in the multinational hotel industry 1995-2005, An IH&RA White
Paper on the Global Hospitality Industry. Paris: International Hotel and Restaurant Association,
2000.
[3] Bohdanowicz P. European hoteliers’ environmental attitudes: greening the business. Cornell
Hotel and Restaurant Quarterly (2005), 46; 188-204.

Submitted to Building and Environment
16
[4] McWilliams A, Seigal D. Corporate social responsibility: a theory of the firm perspective. The
Academy of Management Review (2001), 26(1); 117-127.
[5] Zadek S. Third generation corporate citizenship. AccountAblity website, 2002,
(www.accountability.org.uk) (retrieved December 1, 2005).
[6] Knox S, Maklan S. Corporate Social Responsibility: moving beyond investment towards
measuring outcomes. European Management Journal (2004), 22(5); 508-516.
[7] Lafferty BA, Goldsmith RE. Cause-brand alliances: does the cause help the brand or does the
brand help the cause. Journal of Business Research (2005), 58; 423-429.
[8] Werther WB, Chandler D. Strategic corporate social responsibility as global brand insurance.
Business Horizons (2005), 48; 317-324.
[9] Menguc B, Ozanne LK. Challenges of the ‘green imperative’: a natural resource-based approach
to environmental orientation-business performance relationship. Journal of Business Research
(2005), 58(4); 430-438.
[10] BBC. Green reports shun supply chain. BBC news, 14 December 2004 (www.bbc.co.uk)
(retrieved January 25, 2006).
[11] Fairmont Hotels & Resorts. Green Partnership Guide. Toronto: Fairmont Hotels & Resorts,
1990.
[12] International Hotel Environmental Initiative. Environmental management for hotels. Oxford:
Butterworth-Heinemann, 1993.
[13] EEO/BRE. Introduction to energy efficiency in hotels, Energy Efficiency - Best Practice
Programme. Watford: Department of the Environment, BRESCU, 1994.
[14] IH&RA, IHEI, UNEP. Environmental action pack for hotels: practical steps to benefit your
business and the environment. UNEP Industry and Environment technical report 31. Paris: IH&RA,
London: IHEI, Nairobi: UNEP, 1995.
[15] CADDET. Energy efficiency in hotels and motels, Maxi brochure 07. Sittaard: Centre for
Analysis and Dissemination of Demonstrated Energy Technologies, 1997.
[16] American Hotel and Lodging Association (AH&LA). Energy management and conservation
guide. Washington DC: American Hotel and Lodging Foundation, 2001.

Submitted to Building and Environment
17
[17] Genot H, Pogson N, François P, Carbone G. Sowing the seeds of change – An environmental
teaching pack for the hospitality industry. Paris: EUHOFA, IH&RA, UNEP, 2001.
[18] Scandic Hotels. Scandic environmental construction standard: sustainable construction and
renovations at Scandic Hotels. Version 0.9 published November 14, 2001. Stockholm: Scandic
Hotels AB, Hilton International Nordic Region, 2001.
[19] Stipanuk DM. Hospitality facilities management and design. Lansing: AH&LA Educational
Instititue, 2002.
[20] Accor Group. Understanding and managing water, energy and waste at your hotel. Paris: Accor
Group, 2003.
[21] Energy Innovators Initiative. Saving energy dollars in hotels, motels and restaurants. Ottawa:
Natural Resources Canada, 2003.
[22] Perera O, Hirsch S, Fries P. Switched on – Renewable energy opportunities in the tourism
industry. Washington DC: United Nations Environmental Program Publication, 2003.
[23] Conservation International & the Prince of Wales International Business Leaders Forum.
Sustainable hotel siting, design and construction. London: Nuffield Press, 2005.
[24] International Business Leaders’ Forum & WWF. Why environmental benchmarking will help
your hotel. London: IBLF & WWF, 2005.
[25] Bohdanowicz P. A study of environmental impacts, environmental awareness and pro-
ecological initiatives in the hotel industry. Stockholm: Royal Institute of Technology, 2003.
[26] Asia-Pacific Economic Cooperation. Institutionalisation of a benchmarking system for data on
the energy use in commercial and industrial buildings. Hawaii: APEC, 1999.
[27] Noren C. Load shape development for Swedish commercial and public buildings –
Methodologies and results. Lund: Lund Institute of Technology, 1999.
[28] Deng S-M, Burnett J. A study of energy performance of hotel buildings in Hong Kong. Energy
and Buildings (2000), 31; 7-12.
[29] Becken S, Frampton Ch, Simmons D. Energy consumption patterns in the accommodation
sector – the New Zealand case. Ecological Economics (2001), 39; 371-386.
[30] Despretz H. Green Flag for greener hotels. Valbonne: ADEME, ARCS, CRES, ICAEN, IER,
SOFTECH, European Community, 2001.

Submitted to Building and Environment
18
[31] Deng S-M, Burnett J. Water use in hotels in Hong Kong. Hospitality Management (2002), 21;
57-66.
[32] Deng S-M, Burnett J. Energy use and management in hotels in Hong Kong. Hospitality
Management (2002), 21; 371-380.
[33] Becken S, Cavanagh J-A. Energy efficiency trend analysis of the tourism sector. Lincoln:
Landcare Research, Energy Efficiency and Conservation Authority, 2003.
[34] Deng SM. Energy and water uses and their performance explanatory indicators in hotels in
Hong Kong. Energy and Buildings (2003), 35; 775-784.
[35] Bohdanowicz P, Martinac I. Determinants and benchmarking of resource consumption in hotels
– Case study of Hilton International and Scandic in Europe. Energy and Buildings (in press).
[36] CHOSE. Energy savings by combined heat cooling and power plants (CHCP) in the hotel
sector. Report of the Commission of the European Communities. Stockkholm: Directorate General
for Energy, 2001.
[37] Rezidor SAS. Responsible business progress report 2004. Brussels: Rezidor SAS, 2005.
[38] Bohdanowicz P, Simanic B, Martinac I. Environmental training and measures at Scandic
Hotels, Sweden. Tourism Review International (2005), 9(1); 7-19.
[39] Sånga Säby Kurs och Konference (SSCC). Environmental report 2002. Svårtsjö: Sånga Säby
Kurs och Konference, 2003 (in Swedish).
[40] Gustafsson M. Analysis of electricity consumption and possible savings at Grand Hotêl in
Stockholm. Stockholm: Royal Institute of Technology, 2005 (in Swedish).
[41] Nordic Ecolabelling. Nordic ecolabelling of hotels and youth hostels, Criteria document,
October 3rd 2002 – September 30th 2006, Version 2.0. Stockholm: Nordic Swan Ecolabel, SIS
Miljömärkning, 2002.
[42] Green Globe 21. Travel and tourism industry earthcheckTM baseline and best practice
indicators, 2004, (www.greenglobe21.com) (retrieved November 11, 2004).
[43] Chan WW. Predicting and saving the consumption of electricity in sub-tropical hotels.
International Journal of Contemporary Hospitality Management (2005), 17(3); 228-237.

Submitted to Building and Environment
19
[44] Bohdanowicz P, Simanic B, Martinac I. Environmental education at Scandic hotels – approach
and results. In: Proceedings of the Regional Central and Eastern European Conference on
Sustainable Building (SB04), Warszawa, 2004.
[45] Bohdanowicz P, Simanic B, Martinac I. Sustainable hotels - environmental reporting according
to Green Globe 21, Green Globes Canada / GEM UK, IHEI benchmarkhotel and Hilton
Environmental Reporting. In: Proceedings of Sustainable Building (SB05) Conference, Tokyo, 2005.
[46] Bohdanowicz P. Hilton Environmental Reporting as a tool of Corporate Social Responsibility.
In: Proceedings of the BEST Sustainable Tourism Think Tank VI: "Corporate Social Responsibility
for Sustainable Tourism", Girona, 2006.
[47] Rash A. Sveriges Hotell & Restaurangföretagare – SHR. E-mail communication January 13,
2006
[48] SPSS Inc. SPSS 13.0 Brief Guide. Chicago: SPSS Inc., 2004.
[49] Boverket. Building Regulations BFS 1993:57 with amendments up to BFS 2002:19. Karlskrona:
Swedish Board of Housing, Building and Planning, 2002.
[50] Barańska Z. Podstawy metod statystycznych dla psychologów – ćwiczenia. Gdańsk:
Wydawnictwo Uniwersytetu Gdańskiego, 2002.

Submitted to Building and Environment
20
Modelled and real monthly energy consumption for:Hotel 1 - highway location, 11300m2, AC in all areas, district heating and cooling,
lodging and conference services
100
150
200
250
300
350
400
450
0 1 2 3 4 5 6 7 8 9 10 11 12 13
Month
Mon
thly
ene
rgy
cons
umpt
ion,
MW
h
Hotel 1 - real data 2004 Hotel 1 - model data 2004
JanuaryFebruary
MarchApril
MayJune
JulyAugust
SeptemberOctober
NovemberDecember
a)
Modelled and real monthly energy consumption for:Hotel 2 - city/resort location, 11711 m2, AC in all areas, own gas-fired boiler, lodging,
conference and banquet services
100
150
200
250
300
350
400
450
500
0 1 2 3 4 5 6 7 8 9 10 11 12 13
Month
Mon
thly
ene
rgy
cons
umpt
ion,
MW
h
Hotel 2 - real data 2004 Hotel 2 - model data 2004
JanuaryFebruary
MarchApril
MayJune
JulyAugust
SeptemberOctober
NovemberDecember
b)
Modelled and real monthly energy consumption for: Hotel 3 - city location, 12344m2, AC in meeting rooms only, district heating and
cooling, lodging and catering services
100
200
300
400
500
600
700
0 1 2 3 4 5 6 7 8 9 10 11 12 13
Month
Mon
thly
ene
rgy
cons
umpt
ion,
MW
h
Hotel 3 - real data 2004 Hotel 3 - model data 2004
JanuaryFebruary
MarchApril
MayJune
JulyAugust
SeptemberOctober
NovemberDecember
c)
Figure 1. Difference between modelled and real monthly energy consumption for selected hotels.

Submitted to Building and Environment
21
Modelled and real monthly water consumption for selected facilities
500
1000
1500
2000
2500
3000
0 1 2 3 4 5 6 7 8 9 10 11 12 13
Month
Mon
thly
wat
er c
onsu
mpt
ion,
m3
Hotel 1 - real data 2004 Hotel 1 - model data 2004 Hotel 2 - real data 2004
Hotel 2 - model data 2004 Hotel 3 - real data 2004 Hotel 3 - model data 2004
JanuaryFebruary
MarchApril
MayJune
JulyAugust
SeptemberOctober
NovemberDecember
Where: Hotel 1: highway location, A=11300 m2, AC in all areas, district heating and cooling, lodging
and conference services, swimming pool; Hotel 2: city/resort location, A=11711 m2, AC in all areas,
own gas-fired boiler, lodging, conference and banquet services, large green area; Hotel 3: city
location, A=12344 m2, AC in meeting rooms only, district heating and cooling, lodging and catering
services.
Figure 2. Difference between modelled and real monthly water consumption for selected facilities.

Submitted to Building and Environment
22
Table 1.
Variations in reported and recommended consumption indicators in Swedish hotels.
Hotel company (year for which data was obtained)
Indicator value Source
Figures reported
Sweden (1999, 2001)
100 – 200 kWh/m2/year 198 – 379 kWh/m2/year
[27] [36]
Rezidor SAS (entire Europe) (2004)
281 kWh/m2/year – Radisson SAS Aver. 220 kWh/m2/year – Rezidor SAS 454 litres/guest-night – Radisson SAS
Aver. 262 litres/guest-night – Rezidor SAS
[37]
Scandic Sweden (1996 and 2003)
330.5 (1996) - 267.9 (2003) kWh/m2/year 57.1 (1996) – 48.7 (2003) kWh/guest-night 254 (1996) – 239 (2003) litres/guest-night
[38]
Sånga Säby Course & Conference Centre (2002)
164 kWh/m2/year 91 kWh/guest-night
314 litres/guest-night [39]
Grand Hotêl Stockholm (2003-2004) 282 – 300 kWh/m2/year [40]
Benchmarking recommendations
Nordic Swan (2002-2006) (entire Scandinavia)
280 – 420 kWh/m2/year – Class A hotela 250 – 390 kWh/m2/year – Class B hotela
250 – 300 litres/guest-night (depending on hotel classa) [41]
Green Globe 21 (2003) for vacation and business hotels in Sweden
133.3 kWh/guest-night – baseline 61.1 kWh/guest-night – best practice
700 litres/guest-night – baseline 500 litres/guest-night – best practice
[42]
a Nordic Ecolabelling categorizes the establishments as Class A or Class B depending on restaurant turnover, total turnover for restaurant and lodging, lodging occupancy rate, as well as the availability of pool facilities.

Submitted to Building and Environment
23
Table 2.
Statistical overview of resource use indices in 2004, number of hotels: N=15.
Mean Minimum Maximum
Std. Deviation (Std. Dev. as % of mean)
Range Sample variance
Energy use intensity (EUI), kWh/m2/yr a 277.23 190.65 353.27 53.16
(19.2%) 162.63 2826.24
Energy consumption per room, MWh/room/yr a 15.09 8.84 34.48 6.39
(42.3%) 25.64 40.83
Energy consumption per guest-night, kWh/guest-night a
43.52 25.09 83.52 14.13 (32.5%) 58.42 199.79
Water use intensity (WUI) per total area (A+landscaped), m3/m2
1.41 0.60 2.16 0.39 (27.7%)
1.56 0.16
Water consumption per room, m3/room 81.62 47.57 122.93 23.83
(29.2%) 75.36 567.66
Water consumption per guest-night, litre/guest-night
224.07 160.03 323.17 46.74 (20.9%) 163.13 2184.85
a all heating energy (district heating and natural gas used for heating) was corrected for heating degree days

Submitted to Building and Environment
24
Table 3.
Average annual performance indicators for the hotel sample.
Energy use intensity, kWh/m2/year b
Energy use intensity, kWh/guest-night b
Water use intensity, litre/guest-night Year
collected, sample sizea Average
Standard deviation (St. Dev. as % of mean)
Average
Standard deviation (St. Dev. as % of mean)
Average
Standard deviation (St. Dev. as % of mean)
2000, N=12 293.45 81.48
(27.8%) 41.51 19.54 (47.1%) 221.05 39.98
(18.1%)
2001, N=13 306.69 79.86
(26%) 44.92 19.07 (42.5%) 226.76 38.99
(17.2%)
2002, N=14 284.53 67.16
(23.6%) 44.35 15.81 (35.6%) 247.74 61.39
(24.8%)
2003, N=15 279.51 63.44
(22.7%) 49.17 18.57 (37.8%) 253.09 78.38
(30.9%)
2004, N=15 277.23 53.16
(19.2%) 43.52 14.13 (32.5%) 224.07 46.74
(20.9%) a not all hotels were included in the chain portfolio since 2000 b all heating energy data was corrected for heating degree days

Submitted to Building and Environment
25
Table 4.
Regression results for total monthly energy consumption, single-year (2004) model.
Model Unstandardized Coefficients
Standardized Coefficients
Dependent variable: Total monthly energy consumption E, MWh
B Std. Error Beta t Signifi
cance
R2=0.838, F=303.5 and Se=62.26
Temperature difference, Δt, oC, between design indoor temperature tdi = 18oC and average monthly outdoor temperature tmo
11.957 0.734 0.535 16.300 0.000
Total hotel floor area, A, m2 0.013 0.002 0.444 7.619 0.000
Total monthly water consumption w, m3 0.071 0.011 0.391 6.557 0.000
Constant -122.131 14.165 -8.622 0.000
Table 5.
Regression results for total monthly water consumption, single-year (2004) model.
Model Unstandardized Coefficients
Standardized Coefficients
Dependent variable: Total monthly water consumption W, m3
B Std. Error Beta
t Significance
R2=0.846, F=321.22 and Se=332.84
Number of guest-nights sold gn 0.115 0.009 0.520 13.003 0.000
Total hotel floor area A, m2 0.076 0.006 0.491 12.356 0.000
Presence of spa/pool facilities sp, yes-1, no-0 150.677 57.031 0.080 2.642 0.009
Constant -249.706 67.270 -3.712 0.000

Submitted to Building and Environment
26
Table 6.
(Regression-based) correlation coefficients for individual hotels, 2004- and 2005-data.
Coefficient of correlation, R2
2004 2005 Hotel ID Energy=
f(tmo, gn, fc, w)
Water = f(gn, fc)
Energy= f(tmo, gn, fc, w)
Water = f(gn, fc)
Hotel characteristics
1 0.992 0.780 0.958 0.730
2 0.980 0.415 0.980 0.081 Swimming pool, and large conference facility
3 0.966 0.888 0.935 0.894
4 0.965 0.101 0.945 0.300 Swimming pool, and large conference facility
5 0.961 0.787 0.865 0.943
6 0.953 0.831 0.984 0.902
7 0.946 0.455 0.969 0.260 Bi-monthly water reports
8 0.936 0.850 0.960 0.729
9 0.923 0.751 0.882 0.681
10 0.922 0.960 0.850 0.757
11 0.901 0.130 0.854 0.371 Swimming pool, and large conference facility, no FC reported
12 0.876 0.650 0.674 0.312
Highly dining- and conference-oriented, large landscaped grounds, no food covers reported
13 0.851 0.747 0.815 0.819
14 0.808 0.097 0.963 0.367
15 0.562 0.062 0.580 0.099 Highly dining- and day-activity-oriented
Where: tmo = monthly average outdoor temperature, gn = number of guest-nights sold per month, fc
= number of food covers sold per month, w = monthly quantity of water used (m3)

Paper X

Accepted for publication in Tourism Review International 2007 issue
A case study of Hilton Environmental Reporting
as a tool of Corporate Social Responsibility
Paulina Bohdanowicz
Sustainable Building Systems, Department of Energy Technology
Royal Institute of Technology
Brinellvägen 68, 100 44 Stockholm, Sweden
Phone: + 48 662 25 25 20, Fax: + 46 8 20 41 61
www.greenthehotels.com
E-mail: [email protected], [email protected]
Abstract
The concept of Corporate Social Responsibility (CSR) has recently reached the agenda of the tourism
businesses, and many of the hotel corporations are declaring their environmental and social
responsibilities. This paper presents a case study of the on-going CSR-related initiative at Hilton
International1 and Scandic2 - the Hilton Environmental Reporting system. In order to improve the
monitoring of performance of its facilities, the Hilton corporate management decided to create an
environmental reporting and benchmarking system for all its facilities – Hilton Environmental Reporting
(HER). This paper reports on the history, criteria and procedures within this computerized reporting tool
created by Addsystems. The development and implementation process of the upgraded version of the
system is also presented. This process brought to light a number of aspects that need to be addressed
while developing such systems, i.e. the need for proper technical and IT support, training and data
verification, as well as strong and continuous management support. This knowledge could be used to help
other tourism and hotel businesses develop their own reporting, monitoring and benchmarking schemes
within the CSR concept.
Key words: Hilton Environmental Reporting, Hilton International and Scandic, performance reporting,
performance benchmarking, hotels, computerized system development.
1 Hilton International operates 262 hotels worldwide (with the exception of the USA). On February 23, 2006 it was acquired by Hilton Hotels Corporation (NYSE:HLT), the leading global hospitality company, with nearly 2700 hotels and 475000 rooms in more than 80 countries, with 150000 team members worldwide. All activities described in this paper relate to Hilton International (i.e. all Hiltons and Scandics outside the US). 2 Scandic is a mid-market Scandinavian-based chain operating 131 hotels in Europe, it has been a part of Hilton International since 2001.
1

Accepted for publication in Tourism Review International 2007 issue
Introduction
The hotel industry and the environment
Lodging facilities, including hotels, are unique compared to most categories of commercial
buildings, with regard to operational schemes, the types of services offered and the resulting patterns of
natural resources use. Furthermore, environmental performance and the values and magnitudes of
consumption indicators vary greatly among regions and even individual hotels (Bohdanowicz & Martinac,
in press). Gössling (2002) estimated that 97.5 TWh (351.1 PJ) of energy was used in hotel facilities
worldwide in 2001, with resulting CO emissions at a level of 55.7 Mt.2 TT
he figures on water consumption
in the global hotel industry are assumed to be three times those for the American lodging industry3, i.e. in
the range of 450-700 million m3 of water per annum (estimates based on figures in Davies & Cahill, 2000).
Most of the water consumed is released in the form of sewage, unfortunately often without adequate
treatment. Waste generation is another (often highly visible) impact the hotel industry has on the
environment. This indicates that the sector’s contribution to global and local environmental problems,
including global warming, climate change and water depletion is not negligible, as summarized in Hunter
& Green (1995) and Bohdanowicz (2003).
These figures indicate an urgent need for more environmentally sound practices and products in
the hotel industry, an industry which, for many years, has neglected a number of aspects of environmental
compatibility in design, as well as responsible resource management and business practices. Recent
decades have brought an increased public awareness about the extent of environmental degradation
resulting from tourism operations. The growing criticism of existing hotel operational procedures has
resulted in more attention being given to the issue of environmental responsibility in the hospitality
industry. Although a certain level of activity in reducing resources use has been observed for quite some
time, the motivation for these actions has been related to cost-benefit aspects rather than the environment
(IHEI, 1993; Stipanuk, 1996; Stipanuk & Ninemeier, 1996; Kirk, 1998; Loehr, 2002; Bowe, 2005).
Recently, the possession of an environmental policy or, preferably, a statement and action plan
within the Corporate Social Responsibility (CSR), as well as transparent reporting of a business’
environmental performance have been increasingly expected from businesses worldwide (WTTC, 2002;
BBC, 2004; Green Hotelier 36, 2005). CSR is believed to be a way to reduce energy consumption and
waste generation, as well as to save costs related to high labour turnover (Knox & Maklan, 2004). While
discussing Social Corporate Responsibility a reference is frequently made to a triple bottom line concept
which covers economic, as well as social and environmental benefits (Zadek, 2002). Simultaneously, CSR
policy, benchmarking schemes and various sustainability indices, such as the Global Reporting Initiative
(GRI), Dow Jones Sustainability and FTSE4Good indexes, are considered as differentiating criteria among
hotel corporations competing for the same markets (Brady, 2004; Menguc & Ozanne, 2005, CSR Europe
3 These assumptions are based on one third of all hotel rooms being located in North America (Olsen et al., 2000), and all world regions having relatively similar industry profiles, eventual inequalities between regions leveling out on a global scale.
2

Accepted for publication in Tourism Review International 2007 issue
initiative, 2006; FTSE4Good, 2006). These issues are of interest mainly among large, multi-national
corporations that are more likely to focus attention on environmental and social issues to keep a positive
brand image (Kasim, 2004; Bohdanowicz, 2005). As a result, most of the hotel corporations and other
large tourism businesses are declaring their environmental and social responsibility. Many of the large
companies are also reporting their environmental management goals and indicators of environmental
performance (Green Hotelier 16, 1999).
Environmental performance reporting and benchmarking tools
All the above-mentioned requirements for the transparency of company performance related to
its CSR engagement demand the collection of a large quantity of data at the individual hotel level,
pertaining to resource use, emissions and waste, as well as sustainability-oriented initiatives. There is,
however, no system or methodology of data collection and monitoring that is universally acceptable or
applicable throughout the hotel sector. Thus, the practice of environmental and CSR-related performance
reporting brings several logistical, technical and attitudinal problems that need to be solved before deeper
market penetration is possible (i.e. the need for the standardization of the data collection methodology,
the lack of utility measuring equipment at individual facilities, limited personal interest in environment
protection, as well as the lack of an IT infrastructure). These issues are especially visible in the case of
large, multinational corporations operating among many cultures, and in varied political and economic
environments. To aid hotel managers in becoming more transparent in their operations and to benchmark
performance of individuals in the sector a number of environmental reporting/benchmarking tools for
hotels have recently been developed by international environmental organizations, branch associations
and even hotel corporations (Green Hotelier 16, 1999; Green Hotelier 19, 2000; Bohdanowicz et al.,
2005a; Matson & Piette, 2005).
Some of these tools rely on conventional methods of data collection and results communication
(Green Globe 21, Hong Kong Hotel Building Assessment Scheme, Nordic Swan), while others are web-
based interactive tools, such as IHEI benchmarkhotel (www.benchmarkhotel.com), Hospitable Climates
Hospitality Energy Analysis Tool – HEAT Online (www.hospitableclimates.org.uk), FHRAI Energy and
Environment E Benchmark for Hotels (2 www.fhrai.com/BenchMark/), US EPA/DOE Energy Star
Portfolio Manager (www.energystar.gov/index.cfm?c=evaluate_performance.bus_portfoliomanager), and
Green Globes Canada/GEM UK (in Canada upgraded to BOMA Go Green Comprehensive System and
BOMA Go Green Plus on May 24, 2005). In addition, major hotel corporations, including Accor
International, Fairmont Hotels & Resorts, InterContinental Hotels Group, Hilton International, Hyatt
International, Marco Polo Hotels, Rezidor SAS, Shangri-La Hotels & Resorts have developed their own
reporting schemes4. Most of these instruments are focused on environmental performance reporting, but
4 References to the existence of reporting schemes were found on company websites, in internal and/or environmental reports, Green Hotelier (16-1999; 19-2000), in best practice compilations and in Wilson (1999), Burke (2001), and WTO (2004). However, detailed information was rarely available.
3

Accepted for publication in Tourism Review International 2007 issue
4
can be adapted to serve as a framework for a more comprehensive reporting within the CSR concept. A
comparison of some of the commercially available schemes is presented in Table 1, while a detailed
description of three of the schemes can be found in Bohdanowicz et al. (2005a).
Although differing in scope, range and applicability, all these systems aim to assist the hotel
manager in evaluating the environmental performance of the facility and frequently offer an indication of
possible improvements. Some programs have been developed specifically for the purpose of pre-
refurbishment auditing (i.e. Xenios, http://env.meteo.noa.gr/xenios), or the planning of energy
investment and management strategies (Mavrotas et al., 2003). Most of these tools are for-profit
instruments or internal applications and, as a result, there is limited available information on the system
development process, its limitations, and data collection methods. The Energy Star Portfolio Manager is
the exception, with transparent methodology and free-of-charge access. This hinders the reliability of such
instruments and does not provide guidance on how to design and successfully incorporate similar systems
elsewhere.
The aim of this article is to fill in the existing gap of limited knowledge related to the
development and implementation of such systems. The study does not intend to compare or evaluate the
quality of the existing systems or to provide an ultimate solution on how to develop such tools. This paper
reports on the development, implementation, operation and upgrading/expansion process of a
computerized hotel environmental reporting system that is being applied to all Hilton and Scandic hotels.
This system covers the environment section within the corporate social responsibility framework applied
at the company.
This study focuses on the initiative of Hilton International and Scandic for a number of reasons.
First, Scandic with its environmental initiatives is among the pioneers of sustainability within the hotel
sector in Europe (Nattrass & Altomare, 1999; Goodman, 2000; Tag-Eldeen, 2003; Green Hotelier 32,
2004; Bohdanowicz et al., 2005b). As a result, Scandic is widely recognized for its eco-commitment and is
the first hotel chain eco-labeled with ISO Type I label (Green Hotelier 28, 2003). Second, these two
companies represent a rather rare but very positive phenomenon, where the strong environmental
commitment of a smaller business (Scandic) resulted in the enhanced and broadened sustainability-
oriented activities within the larger player (Hilton International) that already had a good basic
environmental focus and was one of the founders of the Tourism Partnership (Green Hotelier 36, 2005;
TP, 2006). Third, Hilton International is a worldwide known brand with a considerable position and
influence within the industry, and can thus serve as an example for other businesses. It is also among the
front line players of corporate social responsibility and leading activists in environmental initiatives (Green
Hotelier 29, 2003; Green Hotelier 30 & 33, 2004; case studies in Green Hotelier Know How sections and in
IBLF & WWF, 2005).

Accepted for publication in Tourism Review International 2007 issue
Table 1. Comparison of some of the benchmarking schemes (partially adapted from Bohdanowicz et al., 2005a; Matson & Piette, 2005; own experience with IHEI
benchmarkhotel software, 2005; HEAT Online, 2006; Green Globes Canada/BOMA Go Green software, 2005-2006; and Energy Star Portfolio Manager software,
2006)
Green Globe 21 IHEI benchmarkhotel HEAT Online US EPA/DOE Energy Star Portfolio Manager
Green Globes Canada / BOMA Go Green
Type of tool Traditional reports On-line (www.benchmarkhotel.com)
On-line (www.hospitableclimates. org.uk)
On-line (www.energystar.gov)
On-line (www.greenglobes.com)
Geographical coverage/ Climatic zones
Accounted for by temperature calculations
Temperate, Mediterranean, tropical
UK only, based on postal codes
USA, accounted for by degree day calculations (based on zip codes)
Canada
Different types of hotels
Yes, 5 types: business hotels, vacation hotels, motels, bed & breakfast, hostels
Yes, 3 types: luxury full-service, mid-range full-service, small & budget
Yes, 3 types: large luxury, medium, small
Yes, 5 types: upper upscale, upscale, mid-scale with food & beverage, mid-scale w/w F&B, economy & budget
Not really for hotels, but there is a module for hotels
Building characteristics, engineering systems
No Mostly included in hotel types, which are very specific
Included in hotel type and detailed additional questions
Mostly included in hotel types, additional information on on-site services and types of spaces required
Yes – detailed
Resource consumption
Building only Building only Building only Building only Building only
Periodical reporting/benchmarking
Annual Annual Annual (suggested), number of months can also be chosen
Monthly for 12 or 24 months
Monthly for 12 months
Type and level of input data
Seven core earthcheckTM indicators: presence of sustainability policy, social commitment, consumption of water, recycled materials, chemicals and energy (all types of fuels), solid waste generation
Hotel profile & operational characteristics, green purchasing, water and energy consumption and costs (all types of fuels), waste water quality, waste generation and minimization
Building information, energy systems and efficiency improvements, services provided, energy consumption and cost data
Location, building type, occupancy characteristics, energy consumption and cost data (a number of meters can be included, few options of fuels and units)
Building characteristics, indoor environment, environmental management systems, consumption of water and energy, generation of emissions and wastes
5

Accepted for publication in Tourism Review International 2007 issue
6
Data quality issues Data verification by an external organization: Earth Check Ply Ltd
No data verification for the user (development in progress)
No data verification for the user (note on accuracy)
Internal verification system used in weather normalization of data (based on E-Tracker tool), thus floor area & energy consumption data for individual observations may be estimated or rounded
No data verification for the user, data verification by system owner (before it is included in the database)
Level of detail Low Low Moderate Moderate/high High Level of expertise from person performing the analysis
Low Low Moderate (good knowledge of the hotel required)
Moderate High
Report type Graph Table Graph and description Table Graph and description Benchmarking Against country baseline
and best practice (developed from published statistics and normalized according to local/national conditions)
Against other hotels in the database and literature data
Against other hotels with similar characteristics in Energy Measures database
Against American building collected in CBECS database
Against other buildings in the database
Indication of possibilities of saving and suggestions for improvements
No Yes Yes, comprehensive Not in this program, information available under Energy Star framework; possibility of setting reduction targets
Yes, comprehensive and with links to relevant websites
Cost US$ 20 (guidelines only) US$ 210 Free of charge Free of charge US$ 200

Accepted for publication in Tourism Review International 2007 issue
Methods
Despite scientific contributions in the areas of environmental reporting and benchmarking,
the literature presenting tools available specifically for the hotel sector is still limited (APEC, 1999;
Green Hotelier 16, 1999; Despretz, 2001; Pyo, 2001; Wöber, 2001a&b & 2002; Bohdanowicz et al.,
2005a; IBLF & WWF, 2005; Matson & Piette, 2005). References to the existence of reporting
schemes are found on company websites, in internal or environmental reports and in best practice
compilations. However, more detailed information is scarce with only single case study
presentations (i.e. the system made by Accor in WTO, 2004; the Scandic Utility System and Hilton
Environmental Reporting presented in Bohdanowicz et al., 2004, 2005 a&b). The information
detailing the development and data quality assurance process, as well as benchmarking criteria used
in various schemes is frequently not available.
This paper is based on the study of the limited available literature on computerised
reporting systems developed specifically for the hotel industry, with a practical knowledge gained
through the use of the commercial instruments listed in Table 1, but with a focus on the Hilton
Environmental Reporting (HER) system and the experience resulting from the process of HER
data verification5 and system upgrade. Some of the information on the limitations of the HER
system and future requirements was gathered through the communication with the system’s
developers and users. No structured interviews were performed and most of the information
collected was voluntarily provided by the users during the data verification process (communication
with approximately 350 users from 260 hotels – at most hotels more than one team member uses
the HER system). Despite deficiencies in the methodology applied, the information gathered
conforms to the requirements of qualitative data collection in regards to credibility, transferability,
dependability and confirmability. Team members working with the system for at least 6 months
were the major source of information, and most of the problems identified were indicated by a
group of users from various locations. Some of the problematic issues were further confirmed by
external sources (waste contractors and suppliers).
Important inputs were also gathered when users/data issuers at individual hotels,
representatives of various managerial levels at Hilton International and Scandic, and experts from
external auditing companies were asked to comment on the suggested modifications to the system
5 During the months of March to August 2005 all the data contained in the HER database for ca. 260 Hilton and Scandic hotels from Europe and Africa was carefully reviewed in a search for possibly incorrect figures (Hilton International hotels from other regions were not included in the system at that time). All reporting hotels were then e-mailed the Excel file with their reported data and asked to verify the information. If the data for the years before 2004 was populated centrally by Hilton (meaning that the total annual figure was divided by 12 months and the same number was reported for each month for a given attribute) the team members at the hotel were asked to verify the correctness of the annual figure and, if possible, provide monthly numbers.
7

Accepted for publication in Tourism Review International 2007 issue
(a total of about 40 people). In these particular cases, the structure of comments followed the
proposed content of the forms and output reports (as briefly presented in the later sections). This
paper focuses on the problems identified within the system and at the hotel side and discusses the
modifications to the system that have been incorporated in the 2006 version of HER.
The history of environmental reporting at Hilton International
Within the concept of Corporate Social Responsibility Hilton International has developed
and implemented a comprehensive environmental program (the “smörgåsbord” of environmental
“musts”) comprising of Environmental Policy, environmental education (the eco-learning module
in the Hilton University, available in 6 language versions at www.hiltonecolearning.com), the
creation of sustainable facilities (according to the guidebook prepared by CI & IBLF, 2005),
environmental reporting, monitoring and management (performed through HER), and
performance communication (internal via company intranet – Hiway and Hilton Ideas Factory, and
external though CSR reporting and listing on sustainability index markets). Some of these initiatives
are based on 10 years of experience carrying out environmental work at Scandic (Nattrass &
Altomare, 1999; Goodman, 2000; Bohdanowicz et al., 2005b), while the new environmental action
plan for Hilton International – we care! – was launched in Europe and Africa in January 2006.
The history of HER dates back to the initiative undertaken by Scandic Hotels AB in 1997.
Within the “Resource Hunt” program aiming at energy and water conservation and waste
reduction, a measurement system called SUS (the Scandic Utility System) was developed
(Bohdanowicz et al., 2004). Following the acquisition of Scandic by Hilton International, efforts
were undertaken to develop a more sophisticated version of SUS applicable to all Hilton
International facilities - Hilton Environmental Reporting (HER). HER is a computerized tool that
provides a flexible and robust way of collating, recording and monitoring environmental
information. The development of the HER tool commenced in July 2003 and was formally
introduced to the business during the Hilton Environmental Action Month in September 2003. The
tool was launched in the European and African regions in February 2004. The system is now fully
operational, serves ca. 250 hotels and 700 users from Europe and Africa (including the United
Kingdom and Ireland), while brand hotels in other regions are preparing to implement it. The three
objectives for the HER tool are to provide clear feedback to members in individual hotels and
across the business; to provide a global mechanism for reporting operational, resource
consumption and cost data; and to collate data for the purpose of environmental management and
Corporate Social Responsibility reporting.
8

Accepted for publication in Tourism Review International 2007 issue
Hilton Environmental Reporting
HER is based on the Add platform developed by Addsystems (Acona Ltd., 2004;
Sundström & Herrgård 2005-2006). Add is a software platform for the management of
organizational processes that can be adapted for specific business requirements, particularly where
there is a large volume of information to be handled throughout a global organization. It is entirely
web-based, with a multi-language interface; configuration does not require complex programming,
and allows the information to be imported from external sources, while the system can be
developed according to the changing demands within the organization. The object architecture of
the Add platform allows the easy updating of forms and the implementation of the updates directly
in reports, the adding of new languages, as well as changing platform design and functionality like,
for example, additional workflows or output graphs.
HER is available on the Hilton intranet and on the Internet and accessible to authorized
team members only. Two levels of input and four levels of output are used (Figure 1). Hotel profile
(updated annually or whenever the hotel status changes, Figure 2) is used to classify hotels into sub-
categories with similar characteristics for the purpose of benchmarking. An automatically generated
e-mail message informs key team members when the forms are released for completion and later
reminds them of upcoming report deadlines. The message also contains a direct link to the
electronic report form.
9

Accepted for publication in Tourism Review International 2007 issue
CONVERSION TABLESSYSTEM MANUALSON-LINE TRAININGBEST PRACTICE CASE STUDIES FORUMSYSTEM INFORMATION
PROCESSING
DATA INPUT
HOTEL PROFILE(hotel characteristics,services offered,energy systems)
BASIC FORM (no. ofemployees, no. ofcustomers served, no.of meals prepared,amount of laundrygenerated)
ENVIRONMENTALFORM (environmentalinitiatives, awards,waste generated,vehicle fuels,refiregerants added tothe systems)
POMEC FORM(electricity, districtheating/cooling, fuelsand water consumed)
OCCASIONAL (ANNUAL)
REGULAR (MONTHLY)
OUTPUT REPORTS
LEVELS
HOTEL
COUNTRY/REGION
MANAGEMENTAREA
CORPORATION
TYPES
STANDARD REPORT (average year-to-date perguest-night performance of individual hotel,compared to country and corporate average;individual hotel's monthly absolute consumptionfor the past 3 years; energy - also per m2, water,unsorted waste and laundry)
COUNTRY REPORT (league table, and theaverage and absolute figures for all hotels in thecountry)
EXECUTIVE FEEDBACK REPORT (color-codedform reporting status, red - not reported, yellow -started not published, green - published)
MONITORING AND TARGETING (M&T)REPORTS (forecasting of resource consumptionand cost comparisons for individual hotels)
COUNTRY REPORT (league table, and theaverage and absolute figures for all hotels in thecountry)
LEAGUE TABLE (% change in year-to-dateconsumption of energy and water as compared toprevious year; normalised per m2 and perguestnight; energy corrected with degree daysand customers, water corrected with customers;available for each hotel in a region, and for allmanagement areas in a corporation)
EXECUTIVE FEEDBACK REPORT (color-codedform reporting status, red - not reported, yellow -started not published, green - published)
Figure 1. Flow chart of HER version 2006.
10

Accepted for publication in Tourism Review International 2007 issue
Figure 2. Section of a hotel profile developed in HER version 2006.
The types of reports available for the users depend on the particular interest of the
individual as well as his/her position in the company. While hotel managers are mainly interested in
following the performance of their own hotel, users with country or regional responsibilities require
more aggregated feedback reports that allow them to first see the overall performance of the
region, and second, indicate facilities that may require assistance or are eligible for awards. The
regional league tables are especially useful in this regard as these provide an overview of the
situation in the region at a glance. In the case of league tables the colour-coding is related to the
11

Accepted for publication in Tourism Review International 2007 issue
percentage energy/water reduction (normalised per square meter of area and guest-nights6), with
green being a reduction of above 5%, yellow 0-5% and red – no reduction.
Many of the reports were introduced as a result of the upgrading process, while at the
moment all of them can be downloaded as Microsoft Excel files for future reference and off-line
use. A typical report available for a standard user and general manager located in a hotel is
presented in Figure 3, while Figure 4 shows the respective graph available for a country or area
manager.
Total Energy / Guest Night (kWh)Monthly average 2003-2005, Year-To-Date (YTD)
Note that only fully reported months for every hotel are included in analysis
0
10
20
30
40
50
60
70
80
90
Hilton Stockholm Slussen Average Sweden Average Hilton
Sweden Average Hilton
EA Average Hilton
200320042005
Country
Figure 3. Standard report in HER showing total energy per guest night for an individual hotel,
compared with the average for the country and the Hilton average (year-to-date figures).
Total Energy / Guest Night (kWh)Monthly average 2004-2006, all years are calculated as Year to date (YTD)
0
50
100
150
200
250
300
Scan
dic
Upp
sala
Nor
d
Scan
dic
Upp
land
s Vä
sby
Scan
dic
Upl
andi
a
Scan
dic
Täby
Scan
dic
S tar
So l
lent
una
Scan
dic
Söde
rtälje
S can
dic
S jöf
arts
hote
llet
S can
dic
Serg
el P
laza
Scan
dic
Park
Scan
dic
Mal
men
Scan
dic
Kung
ens
Kur v
a
Scan
dic
Järv
a Kr
o g
Scan
dic
Infra
City
S can
dic
Hass
elba
cken
Scan
dic
Co n
t inen
tal
Scan
dic
Brom
ma
Scan
dic
A ria
dne
Scan
dic
Alvi
k
Hilt
on S
t ock
holm
Slu
ssen
Ave
rage
Swe
den
Ave
rage
Hilt
on
Sweden Average Hilton
EA Average Hilton
200420052006
Figure 4. Regional report showing total energy per guest night for individual hotels in the region for
the current year and past 2 years (year-to-date information).
6 The normalization was performed according to the equation:
sold)nights-guestofnumbertotal,guestroomsofnumbertotalarea,floortotal(i.e.factorgnormalisinhoteltheatconsumedresourcetotalnconsumptionormalised =
12

Accepted for publication in Tourism Review International 2007 issue
Similar reports are available at the corporate level, with league tables for each management
area, and an annual normalised performance comparison for the entire corporation over a particular
period of time. These output reports are used in preparing the annual CSR reports for the
company. In addition, with an increased availability of information and needs identified by the
users, new reports can be created. One of the directions for the future system development may
well be to expand the collection of information on initiatives related to improving the well-being of
the personnel and local communities, as well as charity involvement and risk management as
understood within the CSR concept.
The system is user-friendly and the graphical presentation of the data facilitates the
communication of the environmental message to hotel team members. More than 60 per cent of
environmental champions responsible for HER reporting in the UK and Ireland admitted that the
system is fairly easy to use (Gomez, 2005). The attitudes of users in other regions are also positive
and the system is viewed as a useful and valuable part of Hilton’s environmental and CSR
initiatives. As an example, in April 2006 some hotels from the Middle East Asia Pacific area (Japan
and Micronesia) requested to join the system and use it for their environmental program Mottainai!
– Don’t waste! This request was sent in before the system has been officially introduced in that area.
Data verification process
The process of data verification has identified a number of problems with and within the
system, as well as possible technical difficulties in obtaining and reporting the data from the hotel
perspective. A brief list of system limitations indicated by the users is provided below, while the
most important problems (from the user perspective) are explained in more detail:
• duplicated, missing or disconnected forms;
• not all monthly figures shown in reports;
• forgotten or lost system access passwords;
• personal difficulties in changing reporting habits from using MWh to kWh (electricity,
district heating/cooling) or to volumetric units (fuels),
• insufficient amount and frequency of training for new users;
• insufficient information about calculations performed within the system and conversion
factors used;
• a lack of procedure or system of keeping track of whether all registered users are still
working for Hilton, and hotels are still operated by Hilton.
Among the major problems identified by the users, the lack of instantaneous updates of the reports
with published data should be mentioned. The entire system is updated once a day, which is the
most efficient system solution considering the quantity of forms and reports contained in the
13

Accepted for publication in Tourism Review International 2007 issue
database (over 60000 forms and 20000 reports, as of August 2006). Nevertheless, the system would
benefit from an option of instantaneous updates in performance reports (a solution currently not
possible from the computer system perspective).
Another problem identified concerned the accuracy and reliability of the data, which is a
very important aspect of the benchmarking database. And despite the improvements made to the
system and more comprehensive training provided to the data issuers, there were and still are
occasions of typing errors or wrong units chosen from the drop-down options, which result in
individual too high/low numbers for certain performance indicators. These errors are frequently
detected by the users and reported to system administrators. Nevertheless, an automated data
accuracy check and warning system is being developed for the system.
To solve the problems with insufficient information and training related to the system, a
comprehensive manual for the HER system was developed, as well as this, many pop-ups with
additional explanations included in the forms and a short training course were also made available
on-line.
Important problems, that are difficult to envisage before the reporting system is actually in
place, relate to limited or no access to the data required, as faced by the individual users. These
problems are frequently site specific. Some of them will persist for individual hotels, some may be
solved with time and local initiatives, while others may be assisted by more detailed guidelines
presented within the reporting system. For example, collecting the information on the resources
use, such as electricity, district heating and cooling, various fuels and water, as well as their costs,
represented one of the commonly mentioned problems by some of the users. Hotels typically use
one of these sources of information (or both): meter reading and invoices. In the former case, the
most common problems include a lack of meters, one meter for the entire building which is
occupied by more than just the hotel, meter failure, no meters being read, or a different
measurement unit on the meter than in the HER system. In the second case, the invoices may
come to the hotel with a month or longer delay (postponing the publishing of forms), the invoices
may cover periods of more than one month at a time, or not include the actual consumption but
only costs. Reporting accurate quantities of generated laundry represents another important
problem, with many hotels having this service outsourced (and paid, based on the number of items
and not the weight). Obtaining exact and accurate information on waste generation is probably the
most difficult of the problems listed above, unless hotels weigh their own waste regularly. This was
also the problem most commonly commented on, however, the types of difficulties faced by
individual hotels were frequently related to location and municipal or national waste policies and
situation.
14

Accepted for publication in Tourism Review International 2007 issue
System upgrading process
Following the data verification process and communication with the users the decision was
taken to perform an upgrade of the system. The goal was to improve the user-friendliness and
usefulness of the system, as well as the accuracy of the data collected and benchmarks created. The
suggestions which emerged come from the comments provided by the HER users, discussions with
the corporate management at Hilton International and Addsystems, as well as the author’s
experience.
The tasks identified can be divided into those related to the type and the quality of
information collected, improved system user-friendliness, better benchmarking, results
communication, system interface and logistics, as well as training and information provided to the
users. As a result, a suggestion was made to expand the existing forms (to collect more relevant
figures), redistribute the attributes between forms (to avoid repeated reports of constant figures),
create a number of internal calculators (i.e. converting laundry items into weight, and waste
volumes and fractions into weight), centrally populate7 the information that is difficult to obtain by
individual users, and broaden the scope of the HER system to make it a central tool in all
environmental programs performed within the corporation.
The initial suggestions of the new HER forms and outputs were discussed with HER users
from various locations, as well as the corporate management, and an attempt was made to
accommodate all the recommendations. Furthermore, a general makeover of the website and
forms’ layout was proposed. A more comprehensive system manual and Frequently Asked
Questions list were developed together with a system introduction/interactive training for first-time
users. In addition, a number of technical system improvements were introduced (profile
archivization, a warning system).
The HER system was also adapted to serve as a logistic base for the we care! environmental
initiative in Hilton Europe and Africa. All hotels are asked to report into the HER, the
environmental initiatives that have been planned and implemented at their hotel (including costs
and expected savings) and monitor the results. A “best practice” section was developed where team
members can share experiences and the outcomes of initiatives performed at their facilities, both
those environment-related as well as more broadly CSR-related. Among the cases already published
one could mention the environmental declaration published and distributed at Hilton Stockholm
Slussen, pocket environmental guidebook developed at Hilton hotels in Paris, the Glass Björn
environmental award received by Scandic in Norway, the utilisation of solar energy in the Cyprus
hotels, the solar driven-battery vehicle at Hilton Zurich Airport, the use of free cooling (by night 7 By central population of the data, it is meant that the information for a group or all hotels is released by the provider at a secure website and then imported directly into the HER system, i.e. degree days and laundry generation can be obtained in this manner, or various digital utility meters can send their readings directly to the system. Such a solution reduces the probability of individual typing errors.
15

Accepted for publication in Tourism Review International 2007 issue
ventilation cooling in Nairobi, and the use of river water in Prague), waste sorting, recycling and
reusing practices from regions with limited municipal recycling services, as well as the
environmental education campaign for the local school children performed at Conrad Bali Resort &
Spa. There are also many examples of successful reduction of energy and water use by behavioural
changes and technical innovations.
To further encourage the global use of the HER system the corporate management applies
it as a tool for the evaluation of company performance at an individual hotel and regional level
using the various feedback reports available. In addition, at Scandic Nordic region the system has
already been used to identify the winners of annual resource efficiency awards, and since 2006 HER
serves the same purpose in the areas of Europe and Africa.
The system upgrade was finalized and introduced globally in mid-February 2006. Further
upgrades will follow as the data becomes available. The system works well and experiences a high
level of active participation among individual hotels (ca. 96% in the areas of Europe and Africa).
More information on the performance of the system will be available at the end of the year.
Lessons Learnt
This exercise has allowed the team members at Hilton International and Addsystems to
gain experience on how to develop and operate a large scale environmental reporting and
monitoring system. Some of the lessons learned will be discussed below while the concepts
presented could also be applied to the development of the tools for the CSR reporting.
The available literature on sustainability indicators provides significant guidance on the
choice of relevant performance parameters and the information required (such as the consumption
of water, electricity, fuels and chemicals, the generation of waste and laundry, and specific
information relevant to facility operation). Related performance monitoring and reporting systems
are widely expected to be user-friendly and universally applicable (e.g. throughout a hotel chain), at
the same time they need to be flexible enough to account for the unique features and conditions of
individual facilities. Difficulties typically arise when system users at individual hotels are not able to
collect the requested information due to its limited availability on-site.
One of the possible solutions is to involve future users in the design and development of
the system. First of all, staff members located in the hotel have access to real-life data and
information. Furthermore, they can help in assessing what outputs from the system are most useful
at department and hotel levels. Finally, when participating in the development of the system they
are more likely to embrace the concept and will probably be more willing to use it. Of course, in the
case of larger companies it is virtually impossible to involve all personnel in such a project.
Therefore, a representative sample of future users ought to be chosen, preferably having different
backgrounds, level of technical and environmental knowledge and skills, as well as functions within
16

Accepted for publication in Tourism Review International 2007 issue
the hotel structure. In addition, it would be beneficial if representatives of various levels of the
corporate management participated in the process, together with an external consultant experienced
in environmental management and reporting in the hotel businesses. If available, outsourced
providers of the services, and thus data, may also be invited to participate. The system may be
designed to serve not only as a tool for collecting resource consumption data but also as a
framework and monitoring instrument for a more comprehensive environmental as well as CSR
program.
When the system is being developed it is important to provide users with detailed
descriptions of what is required from them and where the information can be found. Calculators
helping in various conversions can be created. If the possibility exists, data which is difficult to
obtain by individual users, i.e. degree days, could be introduced into the database centrally from one
source. Frequently, central population of such a database may be a more efficient solution, which
would ensure the prompt reporting of high quality information. However, such an arrangement
could have a reduced educational purpose, and would not be likely to encourage individuals to be
concerned about the performance of their facility. A combination of centrally populated data with
information collected and reported by individual users may prove to be the optimal solution.
Another argument for centralised updating is that it may reduce the need for technical support.
Nevertheless, there will always be technical problems, some of which cannot be solved by the users.
Therefore, there must be constant and prompt support from a person with a good knowledge of
the system and high level authorization to modify it. A lack of support in solving the problems of
the users may reduce their willingness to use the system and thus lead to the failure of the initiative.
Central population of the database may also be a solution reducing the risk of incorrect data
(avoidance of typing errors or other mistakes made by individual users). Nevertheless, internal
(within the computer system itself) or external (by a corporate or regional environmental
coordinator or a specially appointed consultant) verification of data quality is necessary, at least
periodically.
The type of output provided by the system needs to be well defined, as different
information may be of interest at different levels within the company or for the CSR reporting. In
addition, there ought to be variation in rights and access areas within the system provided to users.
Typically, the higher the position within the corporate management the more areas can be accessed.
In the case of companies with a differing portfolio (a number of hotel standards represented) a
hotel sub-classification within the database may be a necessary development, in order to ensure
realistic comparisons and benchmarks within the brand. Climate differences among various
locations also need to be considered for the purpose of comparisons, and properly accounted for
(by hotel sub-classification based on climate zones, or heating/cooling energy data correction with
degree days or average monthly outdoor and indoor temperatures). Sometimes, the energy costs
17

Accepted for publication in Tourism Review International 2007 issue
can be conceptualised as partial productivity indicators and, as such, used in inter-regional
comparisons.
During the development of the system it is important to address the issue of data security,
especially with regard to sensitive proprietary data on cost and occupancy. One aspect is to ensure
the security of the server where the data is stored. The second aspect concerns the need to control
over system access and user rights. This is of particular concern in the hotel industry where staff
turnover is typically high, and where there is significant worker mobility between competing
businesses. A procedure ought to be designed and enforced to ensure that only company
employees have access to the database. Furthermore, the previously mentioned, differentiation of
user levels and related rights and access areas in the system may reduce the overall risk of data
exposure and ensure useful information provided to each user. Information on facility status, such
as renovations, sales and acquisitions, should always be up-to-date in the database in order to have
all of the operational hotels from the portfolio actually reporting to the system.
Another aspect, of a more technical character, is the availability of a proper IT
infrastructure at all locations at the time of the system’s introduction. This problem would need to
be addressed simultaneously to the system’s development to limit the delay of its incorporation.
The launch of the system ought to be proceeded by an intensive and wide ranging information
campaign among all staff members. Furthermore, training workshops could be arranged for the key
users, while interactive computer training programs and more conventional training materials made
available to all other users and staff. It would be important to have these aids available on-line on
the company intranet or web-site and in printed form in the personnel quarters at the facility. An
environmental board where the status reports can be displayed may be established at every facility
in the personnel access area, and the environmental champion required to post reports there
monthly. A reminder campaign may be organized periodically, in combination with other
environment or CSR-related initiatives.
It is important that all staff members are aware of the importance and convinced to the
usefulness of the system, as well as the reason for using it. Otherwise, there is a great possibility that
less committed individuals or individuals not really believing in the concept will slowly refrain from
using it. Alternatively, users may report the data because “it is in their job description”, but with
little care about the correctness of the reports. Finally, it may also happen that there will be just a
single individual involved in the system’s operation at the facility. Such a system ought to be treated
as a common tool for all the employees to monitor, improve and communicate the environmental
and CSR performance of their workplace.
It is thus of the utmost importance that once the system is operational it constantly
receives strong corporate support. Continuity of the system’s utilization may be achieved by
frequent reference being made to it by top management, while hotel managers or environmental
coordinators may be encouraged to report and discuss the hotel environmental status and CSR
18

Accepted for publication in Tourism Review International 2007 issue
engagement with all staff members on a monthly basis. It can also be used to evaluate the
commitment level of area and hotel managers. To encourage the use of the system and promote the
sustainability and efficiency concept through its framework, this tool can contain a forum where
users can exchange ideas and experiences or present their best practices, environmental initiatives
and involvement with local communities. Furthermore, this instrument may be used to provide
support and advice to individual managers on how to improve the performance of their facilities,
interact with local population, change their utility contracts to be more beneficial, or which awards
and eco-labels to apply for. An internal or external consultant may be contracted to provide such
services or a Frequently Asked Questions list may be developed.
It has been previously shown that environmentally and socially responsible behaviour,
including the implementation of environmental reporting, can be profitable in the long run both at
an individual as well as a corporate level (Enz & Siguaw 1999; Martinac et al., 2001; Bohdanowicz
et al., 2004 & 2005b). The benefits and usefulness of computerized monitoring tools, as
instruments helping reduce the wastage of valuable and costly resources, is increasingly appreciated
by academia (Isenmann, 2004) and the industry itself, as pointed out by a representative of Accor:
“Accor is currently planning the automation of its water and energy consumption data collection
systems throughout all its hotels. This will ensure a standardization of reporting which will improve
the consistency and efficiency of the Group’s sustainability indicators” (WTO, 2004).
A well designed and fully operational system allows the monitoring of overall brand
performance as well as identification of the most efficient/environmentally responsible hotels, or
facilities with the largest saving potential. It may also help promote cooperation, as well as
knowledge and experience transfer between teams. Such a database may further prove to be an
invaluable source of data in the case of hotel environmental labelling or CSR reporting. Such a tool
may also provide assistance in the monitoring and benchmarking of one’s own facilities, as well as
identifying best practices within the organization. The former issue is of particular importance
considering the significant heterogeneity among hotels, and thus the questionable accuracy and
applicability of generalized, sector-wide benchmarks and best practice standards (as discussed by de
Burgos-Jiménez et al., 2002; Becken & Cavanagh, 2003; Warnken et al., 2005; Bohdanowicz &
Martinac, in press).
Conclusions
This paper reports on the history, procedures and input/output information provided
within Hilton Environmental Reporting, a computerized reporting tool created at Hilton
International for the purpose of transparent data collection for the CSR reporting. The problems
identified during the data verification process are presented and include: insufficient information
19

Accepted for publication in Tourism Review International 2007 issue
and training about the tool, the technical limitations of the system, as well as difficulties in
obtaining necessary information at the hotel level.
The experience gained during the process of the Hilton Environmental Reporting system
upgrade allowed for the formulation of a set of rules of thumb that could be followed in the design
of similar schemes for the corporate social responsibility reporting. First, it is important to ensure
that the information required from individual departments or hotels is relevant, and relatively easily
available. The development process and the system itself need to be transparent and easily
understood by the users. The system could be designed to serve not only as a tool for collecting
resource consumption data but also as a framework and monitoring instrument for a more
comprehensive environmental and CSR program. Training and information related to the system
ought to be provided to all potential users, with additional self-study materials available at hand.
The quality of input data needs to be verified constantly or trustworthy external sources used for
collecting the information for central scripting. Continuous technical support is crucial to the
success of the initiative. All users need to be provided with feedback on their actions and hotel
performance, with due consideration given to the type of feedback and output reports required by
users at various levels in the company. The continuity of the system’s utilization requires strong
corporate support. This may be achieved by frequent reference being made to it by top
management, while hotel managers or environmental coordinators may be encouraged to report
and discuss the hotel’s environmental status and CSR involvement with all staff members on a
monthly basis. It can also be used to evaluate the commitment level of area and hotel managers, as
well as a means of identifying “best performers” and screening for ill-performing hotels.
It is the author’s belief that lessons learnt by Hilton International and Addsystems in the
process of development, incorporation and operation of the HER system are of value and can help
hospitality businesses improve their performance. The experience with the HER tool also shows
that large corporations are capable of the transparent reporting of their performance within the
corporate social responsibility framework.
Acknowledgements
The author wishes to acknowledge the financial support for this research project received from
Energimyndigheten (The Swedish Energy Agency), and Hilton International and Scandic. The
author is grateful to all Hilton and Scandic team members who have dedicated their time to provide
comments on the performance of HER, and participated in the upgrade process. The author would
also like to thank two anonymous reviewers for valuable comments and insights into the topic.
20

Accepted for publication in Tourism Review International 2007 issue
References
Acona Ltd. (2004). Hilton HER review – phase One, draft. London, UK: Acona Ltd.
APEC. (1999). Institutionalisation of a benchmarking system for data on the energy use in
commercial and industrial buildings. Honolulu, Hawaii: Asia-Pacific Economic Cooperation, East
West Centre.
BBC. (2004). Green reports shun supply chain, BBC News, 14 December 2004.
http://www.bbc.co.uk (retrieved January 25, 2006).
Becken, S., & Cavanagh, J.-A. (2003). Energy efficiency trend analysis of the tourism sector. Lincoln, New
Zealand: Landcare Research, Energy Efficiency and Conservation Authority.
Bohdanowicz, P. (2003). A study of environmental impacts, environmental awareness and pro-
ecological initiatives in the hotel industry. Stockholm: Royal Institute of Technology.
Bohdanowicz, P. (2005). European hoteliers’ environmental attitudes: Greening
the business. Cornell Hotel and Restaurant Administration Quarterly, 46, 188-204.
Bohdanowicz, P., & Martinac I. (in press). Determinants and benchmarking of resource
consumption in hotels – case study of Hilton International and Scandic in Europe. Energy and
Buildings.
Bohdanowicz, P., Simanic, B., & Martinac, I. (2004). Environmental education at Scandic hotels –
approach and results. Proceedings of the Regional Central and Eastern European Conference on Sustainable
Building (SB04), October 27-29, 2004, Warszawa, Poland.
Bohdanowicz, P., Simanic, B., & Martinac, I. (2005a). Sustainable hotels - environmental reporting
according to Green Globe 21, Green Globes Canada / GEM UK, IHEI benchmarkhotel and
Hilton Environmental Reporting. Proceedings of Sustainable Building (SB05) Conference (pp. 1642-
1649), September 27-29, 2005, Tokyo, Japan.
Bohdanowicz, P., Simanic, B., & Martinac, I. (2005b). Environmental training and measures at
Scandic Hotels, Sweden. Tourism Review International, 9 (1), 7-19.
Bowe, R. (2005). Going green: red stripe, yellow curry and green hotels – sustainable tourism in
Jamaica. E! – The Environmental Magazine, 16 (1).
Brady, A. K. O. (2004). Forecasting the impact of sustainability issues on the reputation of large multinational
corporations. Cambridge, UK: University of Cambridge.
Burke, B. (2001). Utility monitoring system overview (Hyatt International). In: Proceedings of
AH&MA Annual Conference and Lodging Expo, 5 April 2001, Chicago, USA.
CI & IBLF. (2005). Sustainable hotel siting, design and construction. Conservation International & the
Prince of Wales International Business Leaders Forum. London, UK: Nuffield Press.
CSR Europe initiative. (2006). Organisation web page. http://www.csreurope.org (retrieved
February 15, 2006).
21

Accepted for publication in Tourism Review International 2007 issue
Davies, T., & Cahill, S. (2000). Environmental implications of the tourism industry. Washington: Resources
for the Future.
de Burgos-Jiménez, J., Cano-Guillén, C. J., & Céspedes-Lorente, J. J. (2002). Planning and control
of environmental performance in hotels. Journal of Sustainable Tourism, 10(3), 207-221.
Despretz, H. (2001). Green Flag for Greener Hotels, final report. Valbonne, France: European
Community.
Enz, C. A., & Siguaw, J. A. (1999). Best hotel environmental practices. The Cornell Hotel and
Restaurant Administration Quarterly, 40(5), 72–77.
FTSE4Good. (2006). Organisation web page. http://www.ftse4good.com (retrieved February 15,
2006).
Gomez, D. (2005). Hilton International’s recent environmental initiatives in the UK/Ireland, report. Yale,
USA: The Cyrus Vance Fellowship in Politics and Foreign Affairs, The Kingsley Trust Association
Summer Travel Fellowship, Yale University.
Goodman, A. (2000). Implementing sustainability in service operations at Scandic Hotels. Interfaces,
30, 202-214.
Gössling, S. (2002). Global environmental consequences of tourism. Global Environmental Change, 12,
283-302.
Green Globes Canada. (2005). Green Globes Canada/BOMA Go Green software.
http://www.greenglobes.com (retrieved January 6, 2005).
Green Hotelier, 16. (1999). Measurement, benchmarking and environmental reporting, 12-16.
Green Hotelier, 19. (2000). Performance benchmarking, 7.
Green Hotelier, 28. (2003). Hotels Pursue Nordic Swan, 6.
Green Hotelier, 29. (2003). Going Organic, 16-19.
Green Hotelier, 30. (2004). Hotels Environmental Action Month (HEAM), 13-15.
Green Hotelier, 32. (2004). Green Purchasing and Sustainable Supply Chains, 12-18.
Green Hotelier, 33. (2004). Hilton’s Environmental Training Campaign, 11.
Green Hotelier, 36. (2005). Tourism today – how the agenda has evolved, 6-15; and Helping to Turn
Vision into Reality, 22-25.
HEAT Online. (2006). Hospitable Climates Hospitality Energy Analysis Tool – HEAT Online.
http://www.hospitableclimates.co.uk (retrieved April 2006).
Hunter, C. & Green, H. (1995). Tourism and the environment: a sustainable relationship?. London:
Routledge.
IBLF & WWF. (2005). Why Environmental Benchmarking Will Help Your Hotel. London, UK:
International Business Leaders’ Forum & WWF.
IBLF. (2005). IHEI benchmarkhotel software. http://www.benchmarkhotel.com (retrieved January
7, 2005).
22

Accepted for publication in Tourism Review International 2007 issue
IHEI. (1993). Environmental management for hotels. International Hotel Environmental Initiative.
Oxford: Butterworth-Heinemann.
Isenmann, R. (2004). Internet-based sustainability reporting. International Journal of Environment and
Sustainable Development, 3(2), 145-167.
Kasim, A. (2004), BESR in the hotel sector: a look at tourists’ propensity towards environmentally
and socially friendly hotel attributes in Pulau Pinang, Malaysia. International Journal of Hospitality and
Tourism Administration, 5(2), 61-83.
Kirk, D. (1998). Attitudes to environmental management held by a group of hotel managers in
Edinburgh. International Journal of Hospitality Management, 17 (1), 33-47.
Knox S., & Maklan S. (2004). Corporate Social Responsibility: moving beyond investment towards
measuring outcomes. European Management Journal, 22 (5), 508-516
Loehr, B. C. (2002). Green hotels become mainstream as operators realize dual benefits. Hotel
Business, 11 (9), 32.
Martinac, I., Murman, H., & Lind af Hageby, A. (2001). Energy-efficiency and environmental
management in a Swedish conference facility – case study: Sånga-Säby Courses & Conferences.
Proceedings of the 18th Conference on Passive and Low Energy Architecture (PLEA2001) (pp. 325–329),
Florianópolis, Brazil.
Matson, N. E., & Piette, M. A. (2005). High performance commercial building systems – review of California
and national benchmarking methods, working draft. Berkeley, USA: Ernest Orlando Lawrence Berkeley
National Laboratory.
Mavrotas, G., Demertzis, H., Meintani, A. & Diakoulaki D. (2003). Energy planning in buildings
under uncertainty in fuel costs: the case of a hotel unit in Greece. Energy Conversion and Management,
44 (8), 1303-1321.
Menguc, B., & Ozanne, L. K. (2005). Challenges of the ‘green imperative’: a natural resource-based
approach to environmental orientation-business performance relationship. Journal of Business
Research, 58, 430-438.
Nattrass, B., Altomare, A. (1999). The Natural Step for businesses: wealth, ecology and the evolutionary
corporation. Gabriola Island, BC: New Society Publishers, 75–100.
Olsen, M. D., Zhao, J., Sharma, A., & Choi, J.-G. (2000). Leading hospitality into the age of excellence:
Expansion, competition and vision in the multinational hotel industry 1995-2005. Paris: International Hotel
and Restaurant Association.
Pyo, S. (ed.). (2001). Benchmarks in Hospitality and Tourism. Binghampton, USA: Haworth Hospitality
Press.
Stipanuk, D. M. (1996). The U.S. lodging industry and the environment – an historical view. The
Cornell Hotel and Restaurant Administration Quarterly, 37 (5), 39-45.
Stipanuk, D. M., & Ninemeier, J. D. (1996). The future of the U.S. lodging industry and the
environment. The Cornell Hotel and Restaurant Administration Quarterly, 37 (4), 74-83.
23

Accepted for publication in Tourism Review International 2007 issue
Sundström, F., & Herrgård, J. (2005-2006). Personal communication with Fredrik Sundström and
John Herrgård from Addsystems, throughout 2005 and 2006, http://www.addsystems.com.
Tag-Eldeen, A. (2003). Sustainable Development in Practice - a Case Study Report about Hilton-Scandic Hotel
Chain. Oxford, UK: Oxford Brookes University, School of Hotel & Restaurant Management.
TP. (2006). Tourism Partnership web page. http://tourismpartnership.org (retrieved June 21,
2006).
US EPA/DOE. (2006). Energy Star Portfolio Manager software.
http://www.energystar.gov/index.cfm?c=evaluate_performance.bus_portfoliomanager (retrieved
April-May 2006).
Warnken, J., Bradley, M., & Guilding, Ch. (2005). Eco-resorts vs. mainstream accommodation
providers. An investigation of the viability of benchmarking environmental performance. Tourism
Management, 26, 367-379.
Wilson, B. (1999). Monitoring and targeting (at Accor). Green Hotelier, 13, 23.
Wöber, K. W. (2001a). A heuristic model for benchmarking SME hotel and restaurant businesses
on the Internet. In: Sungsoo Pyo (ed.), Benchmarks in Hospitality and Tourism, 49-70.
Wöber, K. W. (2001b). Benchmarking for Tourism Organizations - an eGuide for Tourism Managers. Vienna,
Austria: National Laboratory for Tourism and eCommerce.
Wöber, K. W. (2002). Benchmarking in Tourism and Hospitality Industries. Vienna, Austria: CABI
International.
WTO. (2004). Indicators of sustainable development for tourism destinations – a guidebook. Madrid: World
Tourism Organization.
WTTC. (2002). Corporate Social Responsibility in travel and tourism. London, UK: World Travel and
Tourism Council.
Zadek, S. (2002). Third generation corporate citizenship. AccountAblity website.
http://www.accountability.org.uk (retrieved December 1, 2005).
24