
Responses to Natural Scenes in Cat V1 - Montana State ... to Natural Scenes in Cat V1 You might find...
12
doi:10.1152/jn.00195.2003 90:1910-1920, 2003. First published 15 May 2003; J Neurophysiol Christoph Kayser, Rodrigo F. Salazar and Peter König Responses to Natural Scenes in Cat V1 You might find this additional info useful... 41 articles, 13 of which can be accessed free at: This article cites http://jn.physiology.org/content/90/3/1910.full.html#ref-list-1 12 other HighWire hosted articles, the first 5 are: This article has been cited by [PDF] [Full Text] [Abstract] , March, 2008; 18 (3): 610-625. Cereb. Cortex Mitchell Steinschneider, Yonatan I. Fishman and Joseph C. Arezzo Primary Auditory Cortex (A1) of the Awake Monkey Spectrotemporal Analysis of Evoked and Induced Electroencephalographic Responses in [PDF] [Full Text] [Abstract] , May, 19 2009; 106 (20): 8356-8361. PNAS and Krish D. Singh Suresh D. Muthukumaraswamy, Richard A.E. Edden, Derek K. Jones, Jennifer B. Swettenham response to visual stimulation in humans Resting GABA concentration predicts peak gamma frequency and fMRI amplitude in [PDF] [Full Text] [Abstract] , UNKNOWN, 2009; 102 (2): 1241-1253. J Neurophysiol J. B. Swettenham, S. D. Muthukumaraswamy and K. D. Singh Cortex to Moving and Stationary Stimuli Spectral Properties of Induced and Evoked Gamma Oscillations in Human Early Visual [PDF] [Full Text] [Abstract] , UNKNOWN, 2009; (): . Cereb. Cortex Bruss Lima, Wolf Singer, Nan-Hui Chen and Sergio Neuenschwander Synchronization Dynamics in Response to Plaid Stimuli in Monkey V1 [PDF] [Full Text] [Abstract] , July, 2010; 20 (7): 1556-1573. Cereb. Cortex Bruss Lima, Wolf Singer, Nan-Hui Chen and Sergio Neuenschwander Synchronization Dynamics in Response to Plaid Stimuli in Monkey V1 including high resolution figures, can be found at: Updated information and services http://jn.physiology.org/content/90/3/1910.full.html can be found at: Journal of Neurophysiology about Additional material and information http://www.the-aps.org/publications/jn This infomation is current as of March 8, 2011. American Physiological Society. ISSN: 0022-3077, ESSN: 1522-1598. Visit our website at http://www.the-aps.org/. (monthly) by the American Physiological Society, 9650 Rockville Pike, Bethesda MD 20814-3991. Copyright © 2003 by the publishes original articles on the function of the nervous system. It is published 12 times a year Journal of Neurophysiology on March 8, 2011 jn.physiology.org Downloaded from
-
Upload
doannguyet -
Category
Documents
-
view
216 -
download
1
Transcript of Responses to Natural Scenes in Cat V1 - Montana State ... to Natural Scenes in Cat V1 You might find...
doi:10.1152/jn.00195.2003 90:1910-1920, 2003. First published 15 May 2003;J NeurophysiolChristoph Kayser, Rodrigo F. Salazar and Peter KönigResponses to Natural Scenes in Cat V1
You might find this additional info useful...
41 articles, 13 of which can be accessed free at:This article cites http://jn.physiology.org/content/90/3/1910.full.html#ref-list-1
12 other HighWire hosted articles, the first 5 are:This article has been cited by
[PDF] [Full Text] [Abstract]
, March, 2008; 18 (3): 610-625.Cereb. CortexMitchell Steinschneider, Yonatan I. Fishman and Joseph C. ArezzoPrimary Auditory Cortex (A1) of the Awake MonkeySpectrotemporal Analysis of Evoked and Induced Electroencephalographic Responses in
[PDF] [Full Text] [Abstract], May, 19 2009; 106 (20): 8356-8361.PNAS
and Krish D. SinghSuresh D. Muthukumaraswamy, Richard A.E. Edden, Derek K. Jones, Jennifer B. Swettenhamresponse to visual stimulation in humansResting GABA concentration predicts peak gamma frequency and fMRI amplitude in
[PDF] [Full Text] [Abstract], UNKNOWN, 2009; 102 (2): 1241-1253.J Neurophysiol
J. B. Swettenham, S. D. Muthukumaraswamy and K. D. SinghCortex to Moving and Stationary StimuliSpectral Properties of Induced and Evoked Gamma Oscillations in Human Early Visual
[PDF] [Full Text] [Abstract], UNKNOWN, 2009; (): .Cereb. Cortex
Bruss Lima, Wolf Singer, Nan-Hui Chen and Sergio NeuenschwanderSynchronization Dynamics in Response to Plaid Stimuli in Monkey V1
[PDF] [Full Text] [Abstract], July, 2010; 20 (7): 1556-1573.Cereb. Cortex
Bruss Lima, Wolf Singer, Nan-Hui Chen and Sergio NeuenschwanderSynchronization Dynamics in Response to Plaid Stimuli in Monkey V1
including high resolution figures, can be found at:Updated information and services http://jn.physiology.org/content/90/3/1910.full.html
can be found at:Journal of Neurophysiologyabout Additional material and information http://www.the-aps.org/publications/jn
This infomation is current as of March 8, 2011.
American Physiological Society. ISSN: 0022-3077, ESSN: 1522-1598. Visit our website at http://www.the-aps.org/.(monthly) by the American Physiological Society, 9650 Rockville Pike, Bethesda MD 20814-3991. Copyright © 2003 by the
publishes original articles on the function of the nervous system. It is published 12 times a yearJournal of Neurophysiology
on March 8, 2011
jn.physiology.orgD
ownloaded from
Responses to Natural Scenes in Cat V1
Christoph Kayser, Rodrigo F. Salazar, and Peter KonigInstitute of Neuroinformatics, University and Federal Institute of Technology Zurich, 8057 Zurich, Switzerland
Submitted 28 February 2003; accepted in final form 13 May 2003
Kayser, Christoph, Rodrigo F. Salazar, and Peter Konig. Respons-es to natural scenes in cat V1. J Neurophysiol 90: 1910–1920, 2003.First published May 15, 2003; 10.1152/jn.00195.2003. Studies onprocessing in primary visual areas often use artificial stimuli such asbars or gratings. As a result, little is known about the properties ofactivity patterns for the natural stimuli processed by the visual systemon a daily basis. Furthermore, in the cat, a well-studied model systemfor visual processing, most results are obtained from anesthetizedsubjects and little is known about neuronal activations in the alertanimal. Addressing these issues, we measure local field potentials(lfp) and multiunit spikes in the primary visual cortex of awake cats.We compare changes in the lfp power spectra and multiunit firingrates for natural movies, movies with modified spatio-temporal cor-relations as well as gratings. The activity patterns elicited by driftinggratings are qualitatively and quantitatively different from those elic-ited by natural stimuli and this difference arises from both spatial aswell as temporal properties of the stimuli. Furthermore, both localfield potentials and multiunit firing rates are most sensitive to thesecond-order statistics of the stimuli and not to their higher-orderproperties. Finally, responses to natural movies show a large variabil-ity over time because of activity fluctuations induced by rapid stim-ulus motion. We show that these fluctuations are not dependent on thedetailed spatial properties of the stimuli but depend on their temporaljitter. These fluctuations are important characteristics of visual activityunder natural conditions and impose limitations on the readout ofpossible differences in mean activity levels.
I N T R O D U C T I O N
How are sensory stimuli represented and processed in cor-tical networks? Which stimulus properties determine the neuralactivity at a given processing stage and which properties of anactivity pattern are relevant for the representation of the stim-ulus? These questions have been central to neuroscience re-search for a long time. However, we do not have a conclusiveanswer at hand. In cat visual cortex, one of the best-studiedsensory systems, most of our knowledge is based on theactivity of single neurons recorded in anesthetized subjectsstimulated with artificial stimuli. This experimental paradigm,however, has several limitations.
First, most experiments recording in cat primary visualcortex (V1) use artificial stimuli such as bars, gratings, ortexture fields. Although these are mathematically well definedand easy to generate, they contrast with the natural scenesencountered by a mammalian visual system on a daily basis.Natural stimuli are very complex and their statistical structurediffers markedly from that of the stimuli used in most exper-iments. It is presently unclear whether results obtained using
artificial stimuli can be extrapolated to the processing of nat-ural scenes. Often, the stimuli are stationary or smoothly vary-ing and their parameters, such as the orientation of a grating,are matched to the preferred properties of the neuron recorded.The response properties are then inferred from the steady-stateresponses to these stimuli. Under natural conditions, however,stimuli are not optimal for most neurons and the visual systemcannot wait for a steady-state response, but must use whateveractivity pattern the stimuli elicit to build a representation of thevisual scene.
Second, the anesthesia used in many experiments allowsconvenient electrophysiological experiments and prolongs thetime available for recording. However, anesthetics can haveprofound influences on the response properties (Lamme et al.1998; Lee 1970; Roberston 1965) and especially in the catvisual system little is known about activities in awake animals.
Third, most experiments record spikes from isolated singlecells, usually one or a few cells at a time. For statisticalanalysis, data are not averaged across a large population ofneurons, but over repeated trials with identical stimulation.This is in contrast to the situation of a single neuron: it receivesinput from a large population and does not average overrepeated trials, but enacts its input– output transformationcontinuously. The statistical properties of the activity in apopulation of neurons might, however, differ from those of theparticular single unit under investigation.
The goal of the present study is to advance our understand-ing of the processing of natural scenes in awake animals. To doso we record population activities in the primary visual cortexof alert cats to natural movies. More specific, we measurestimulus-induced changes in the power spectrum of local fieldpotentials and firing rates of multiunit spikes. Whereas themultiunit spikes reflect the activity of a small number of nearbyneurons, the local field potential includes both pre- andpostsynaptic potentials around the electrode tip. The naturalmovies used as stimuli were captured by a camera mounted onthe head of a freely moving cat exploring different environ-ments. These movies resemble the world as seen from a cat’sperspective and are a good approximation to the animal’snatural visual input during every day vision. To quantify theimpact of different stimulus properties on the activity wecompare responses to modified stimuli with altered statisticalproperties and altered motion. Finally, we quantify the tempo-ral fluctuations imposed by the natural movies onto the activitypattern.
Address for reprint requests and other correspondence: C. Kayser (E-mail:[email protected]).
The costs of publication of this article were defrayed in part by the paymentof page charges. The article must therefore be hereby marked ‘‘advertisement’’in accordance with 18 U.S.C. Section 1734 solely to indicate this fact.
J Neurophysiol 90: 1910–1920, 2003.First published May 15, 2003; 10.1152/jn.00195.2003.
1910 0022-3077/03 $5.00 Copyright © 2003 The American Physiological Society www.jn.org
on March 8, 2011
jn.physiology.orgD
ownloaded from

M E T H O D S
Surgical and recording procedures
Recordings were performed in 4 adult female cats. In each animala microdrive was implanted under aseptic conditions. The animalswere initially anesthetized using ketamine hydrochloride (20 mg/kg;Narketan, Chassot, Bern, Switzerland) and xylazine hydrochloride(1.1 mg/kg; Rompun, Bayer, Leverkusen, Germany). They were in-tubated, ventilated (30% O2 - 70% NO2), and continuously anesthe-tized with isoflurane (0.4–1.5%). Body temperature, end-expiratoryCO2, and blood oxygenation were continuously monitored and kept inthe desired physiological range (37–38°C, 3–4%, 90–100%, respec-tively). The animals were infused with Ringer’s lactate solution (40ml/h) and received intramuscular injections of steroids and analgesics.Titanium screws (7–8) were fixed in the skull to later hold theimplant. Two small holes were drilled and reference and groundelectrodes were placed between dura and bone. Two small cranioto-mies (roughly 4 mm diameter) were made over areas 17/18 and 21 ofone hemisphere according to stereotaxic coordinates (AP: �3, L: �2and �8, respectively). After removing the dura the microdrive waspositioned and fixed to the skull and the screws using dental acrylic(Stoelting Physiology). The cavity was filled with silicon oil. Nuts,later used to restrain the animal in the recording setup, were insertedinto the implant and fixed in the acrylic. Recording sessions beganonly after the animal had fully recovered, usually after 4 days.
Each microdrive contained 4 movable electrodes (500–1,000 k�impedance), 2 of which were placed over the primary visual area 18and 2 over area 21. The present project concentrates on the analysis ofneuronal activity in primary visual cortex only. Signals were firstpassed through a 24-channel preamplifier (Neurotrack, 10� amplifi-cation) and finally amplified and digitized using a Synamps system(Neuroscan, El Paso, TX) at a resolution of 20 kHz.
Recordings were made at sites of different depths. The depth wasestimated from the reading of the micromanipulator and the first andlast site of a penetration where any visual stimulus evoked significantactivity. The activity measures used in this project (i.e., spectrogramsof local field potential power) yielded qualitatively similar results atrecording sites of different depths. Furthermore, there was no quali-tative change in the power spectrum of the local field potentialbetween supra and infra granular sites (see also RESULTS). Thereforemost results were averaged across all recording sites within onesubject.
For recordings the animals were placed in a sleeve equipped withadjustable Velcro fasteners. This served the purpose to restrain theanimal and to provide a comfortable position. This sleeve was placedin an acrylic tube, allowing stable and accurate positioning of theanimal in front of the monitor and within a Faraday cage. To ensurea stable visual stimulation the head of the animal was fixed usingscrews inserted into the chronic implant holding the microdrive. Eachrecording session lasted roughly 15 min and each animal performedone or two sessions a day. We regularly checked the state of alertnessof the subject either by direct visual inspection or using an infraredcamera system. All procedures were in accordance with the nationalguidelines for use of experimental animals and conformed to theNational Institutes of Health and Society for Neuroscience (U.S.)regulations.
Visual stimuli
To investigate activity pattern for natural time-varying stimuli weused a set of movies closely resembling the visual input to the cat’seye under natural conditions. To further determine the effect ofspecific properties of natural movies such as motion or higher-orderstatistics on the activity, we used a set of modified movies.
Natural scenes differ from classical lab stimuli in both their spatialas well as temporal properties. A uniformly drifting sine wave grating,for example, is characterized by a single spatial as well as a single
temporal frequency. Time-varying natural scenes on the other handcontain a wide range of spatial and temporal frequencies. The contrastof the different frequencies can be computed from the amplitudes ofthe Fourier spectrum of the stimulus. Natural scenes have a charac-teristic amplitude distribution of both spatial and temporal frequen-cies. The properties determined by the amplitudes of the Fourierspectrum are also know as the second-order structure, or second-ordercorrelations. The phases of the Fourier spectrum characterize thealignment of the different frequencies, and determine the higher-orderstructure inherent to natural scenes. Artificial images constructed fromthe amplitude spectrum of a natural image but with random phases ofthe different frequencies have a quite different appearance comparedwith the original image from which the amplitude spectrum was taken.Such images, known as pink noise, have a foggylike appearancelacking any visible object because of their random higher-order sta-tistics.
We applied phase randomizations to natural movies in both thespatial and temporal domain simultaneously. The obtained stimulihave the same spatiotemporal power spectrum and thus the samespatial and temporal frequency distribution but lack the higher-orderstructure of the original natural movies.
The same principle, using an original stimulus and one with alteredhigher-order structure, was also applied to natural movies filtered withGabor wavelets. These stimuli, which are based on a reconstruction ofa natural movie from a wavelet representation, have a reduced contentof spatial frequencies. The corresponding manipulated movies havethe property that the alignment of different wavelets defining the
FIG. 1. Example of activity in the local field potential. A: raw data from oneelectrode after low-pass filtering (500 Hz). Dashed line: stimulus presentation(2,000-ms duration). B: spectrogram obtained from data in A. Parameters forFourier analysis are: 160-ms data window; zero padded to 265 ms; 152-mswindow overlap. Overall the power in the local field potential decays as1/frequency. To allow better visualization each row of the spectrogram wasmultiplied by the corresponding frequency. To emphasize activity patternsinduced by stimulus a normalized spectrogram was computed: each frequencyrow is divided by its SD during blank computed in a 600-ms window beforestimulus onset (see gray box in B). C: normalized spectrogram obtained fromB. Value of one indicates no modulation by the stimulus, whereas values aboveone indicate strong modulation by the stimulus.
1911PROCESSING OF NATURAL SCENES IN V1
J Neurophysiol • VOL 90 • SEPTEMBER 2003 • www.jn.org
on March 8, 2011
jn.physiology.orgD
ownloaded from
stimuli is changed. In this way the local contrast edges defined by theGabor wavelets are left unchanged but their global alignment israndomized.
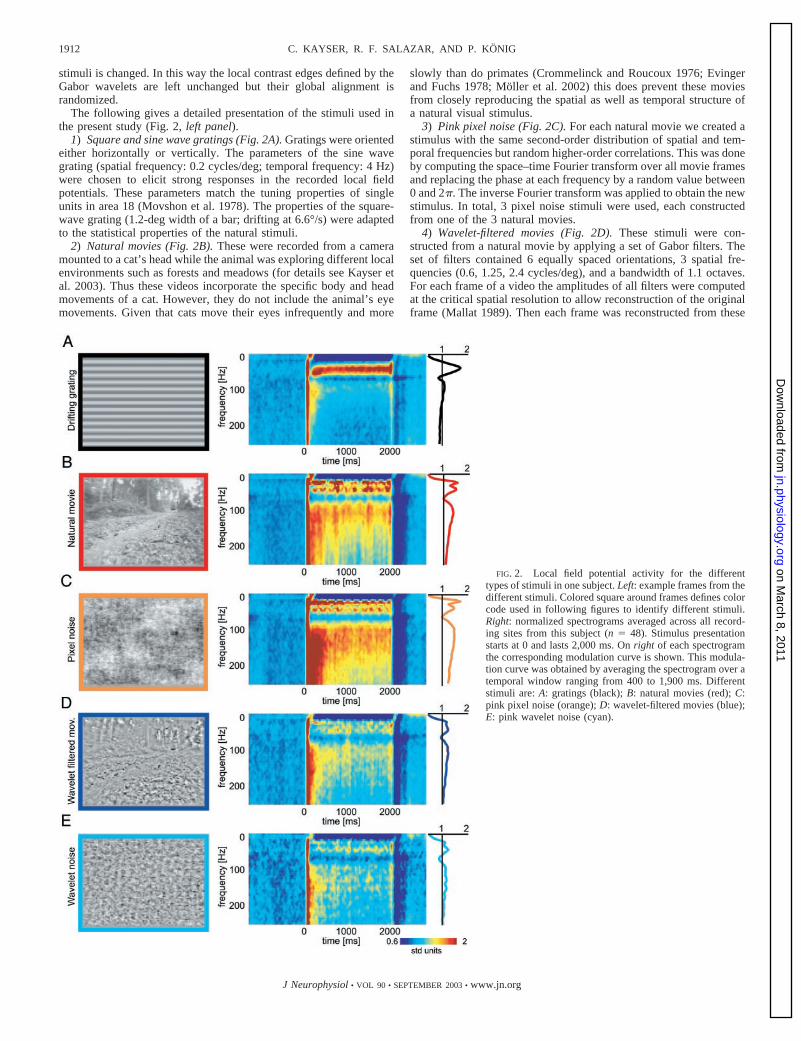
The following gives a detailed presentation of the stimuli used inthe present study (Fig. 2, left panel).
1) Square and sine wave gratings (Fig. 2A). Gratings were orientedeither horizontally or vertically. The parameters of the sine wavegrating (spatial frequency: 0.2 cycles/deg; temporal frequency: 4 Hz)were chosen to elicit strong responses in the recorded local fieldpotentials. These parameters match the tuning properties of singleunits in area 18 (Movshon et al. 1978). The properties of the square-wave grating (1.2-deg width of a bar; drifting at 6.6°/s) were adaptedto the statistical properties of the natural stimuli.
2) Natural movies (Fig. 2B). These were recorded from a cameramounted to a cat’s head while the animal was exploring different localenvironments such as forests and meadows (for details see Kayser etal. 2003). Thus these videos incorporate the specific body and headmovements of a cat. However, they do not include the animal’s eyemovements. Given that cats move their eyes infrequently and more
slowly than do primates (Crommelinck and Roucoux 1976; Evingerand Fuchs 1978; Moller et al. 2002) this does prevent these moviesfrom closely reproducing the spatial as well as temporal structure ofa natural visual stimulus.
3) Pink pixel noise (Fig. 2C). For each natural movie we created astimulus with the same second-order distribution of spatial and tem-poral frequencies but random higher-order correlations. This was doneby computing the space–time Fourier transform over all movie framesand replacing the phase at each frequency by a random value between0 and 2�. The inverse Fourier transform was applied to obtain the newstimulus. In total, 3 pixel noise stimuli were used, each constructedfrom one of the 3 natural movies.
4) Wavelet-filtered movies (Fig. 2D). These stimuli were con-structed from a natural movie by applying a set of Gabor filters. Theset of filters contained 6 equally spaced orientations, 3 spatial fre-quencies (0.6, 1.25, 2.4 cycles/deg), and a bandwidth of 1.1 octaves.For each frame of a video the amplitudes of all filters were computedat the critical spatial resolution to allow reconstruction of the originalframe (Mallat 1989). Then each frame was reconstructed from these
FIG. 2. Local field potential activity for the differenttypes of stimuli in one subject. Left: example frames from thedifferent stimuli. Colored square around frames defines colorcode used in following figures to identify different stimuli.Right: normalized spectrograms averaged across all record-ing sites from this subject (n � 48). Stimulus presentationstarts at 0 and lasts 2,000 ms. On right of each spectrogramthe corresponding modulation curve is shown. This modula-tion curve was obtained by averaging the spectrogram over atemporal window ranging from 400 to 1,900 ms. Differentstimuli are: A: gratings (black); B: natural movies (red); C:pink pixel noise (orange); D: wavelet-filtered movies (blue);E: pink wavelet noise (cyan).
1912 C. KAYSER, R. F. SALAZAR, AND P. KONIG
J Neurophysiol • VOL 90 • SEPTEMBER 2003 • www.jn.org
on March 8, 2011
jn.physiology.orgD
ownloaded from

amplitudes. Applying these Gabor filters effectively corresponds to aband-pass filter in the spatial domain. As before, our stimulus setconsisted of 3 wavelet-filtered movies, each obtained from one of thenatural movies.
5) Pink wavelet noise (Fig. 2E). Similarly to the wavelet-filteredmovie, this stimulus was reconstructed from the wavelet amplitudesobtained from the natural movies. However, before reconstruction, therelative alignment of different wavelets in space and time was alteredby eliminating their higher-order correlations. The wavelet amplitudescomputed from a natural movie form a 3D (two spatial and onetemporal) matrix. In total there are 6 (orientations) � 3 (frequencies)wavelets and thus 18 such matrices for a movie. For each of thesematrices the space– time Fourier transform was computed and thephases at each frequency were replaced by random numbers equallydistributed between 0 and 2�. The matrices were then transformedback. The wavelet noise stimulus was obtained by reconstruction fromthese manipulated wavelet amplitudes.
Stimuli were presented in a block design. In each sessionone of 3 possible blocks was chosen randomly. Each blockcontained all 5 stimulus types listed above. The sinusoidal andthe square-wave grating of either horizontal or vertical orien-tation (chosen randomly), i.e., 2 stimuli of type 1; all 3 clips ofnatural movies, i.e., 3 stimuli of type 2; each modificationbased on one natural movie, i.e., one stimulus of types 3, 4, and5 each. This resulted in a total of 8 stimuli within a block. Eachstimulus lasted 2 s. The stimuli were separated by a uniformscreen (blank) having the same mean luminance as the stimuli,and also lasting 2 s. Each block was repeated 30 times withinone recording session. Stimuli were presented full screen on a19-in. Hitachi CRT monitor (120 Hz refresh rate) 50 cm infront of the animal, thus covering 40 � 30° of visual angle. Theroom was otherwise darkened. The color lookup table wasmanipulated to obtain a linear transformation between pixelintensity and luminance on the monitor. This was verified witha photometer (J1800 Luma Color; Tektronix, Wilsonville, OR)under monitor settings with 30 cd/m2 mean luminance. Forrecordings, we used a somewhat lower mean luminance valueand a monitor radiation shield (3M, Switzerland) resulting in amean luminance of 8 cd/m2. However, we would point out thatthe effective gamma value is of no great importance, given thatthe different stimuli have a similar distribution of pixel inten-sities. The stimulus presentation was controlled by a Macintoshcomputer (Apple, Cupertino, CA) running custom-writtenMATLAB (Mathworks, Natick, MA) code based on the psy-chophysics toolbox extensions (Brainard 1997; Pelli 1997).
MOTION ALTERED STIMULI. In a second series of recordings weused stimuli with altered motion properties. The flow fielddescribing the motion in a stimulus movie was estimated asdescribed below. This flow field was decomposed into 2 com-ponents. First, a linear drift obtained as the linear component ofthe flow field. Second, the residual, after the linear drift wasremoved from the flow field, was termed jitter. These twocomponents of the flow field were used to generate a set ofstimuli. A single frame taken from a natural movie and agrating patch were used as the base images. The motion patternimposed on the two base images matched either the linear driftor the jitter component of the flow field, thus giving a total of4 motion-altered stimuli.
All stimuli were encoded as a series of 8-bit gray-scaleframes at a resolution of 640 � 480 pixels. The pixel values ineach frame were additively scaled so that each frame had the
same mean intensity and multiplicatively scaled so that eachframe had the same root mean square contrast.
Estimation of flow fields
The flow field characterizing the motion was measured on a frameby frame basis using standard techniques (see e.g., Beauchemin andBarron 1995). The optical flow was measured at each point of a gridcovering the central 20° of the visual field. A patch of 30 � 30 pixelscentered on the grid point was compared with patches at differentpositions in a range of 70 pixels in each direction in the next videoframe. The comparison was based on the mean square difference afterremoval of the overall mean luminance of each patch. The best matchdefined the local optical flow. The global motion vector of the videowas computed from this locally defined flow field as the arithmeticaverage.
Data analysis
Separate analysis was carried out for the local field potentials andmultiunit activity, both implemented in MATLAB. The local fieldpotential was extracted by low-pass filtering the recorded signalsbelow 500 Hz. Each recording session was cut into single trials, witha trial consisting of one stimulus plus a part of the blank before andafter it. Sometimes the signals were contaminated by movementartifacts. If in any channel the maximal amplitude of the recordedsignals exceeded 5 times the SD of the signal, taken over the entiresession, the trial was discarded. Usually �5% of the trials had to bediscarded. The activity in the local field potential was quantified bycomputing the time-localized Fourier spectrum (spectrogram) usingwindows of 160-ms length, overlaid with a Hanning window andzero-padded to 256 ms. The overlap of neighboring windows was 152ms, leading to a nominal temporal resolution of 8 ms.
To determine the activity induced by the visual stimulus, changes inthe power spectrum locked to the stimulus onset were computed. Thepower at each frequency was normalized by the SD of the powerduring 600 ms of the leading blank. This emphasizes changes in thepower compared with the blank at each frequency separately. Theresulting measure corresponds to a z-score and is a measure of thereliability of neuronal activation by the respective stimulus (deOliviera et al. 1997; Logothetis et al. 2001). Qualitatively similarresults were obtained by computing the percentage change of thesignal amplitude at each frequency before the stimulus to during thestimulus (data not shown).
For the analysis of the multiunit activity, the signals were high-passfiltered at 500 Hz. Spikes were identified by applying a threshold of3 SDs of the signal and stored at a resolution of 1 ms. Visualinspection showed the reliability of this automated measure. Units thatdid not show a modulation for any stimulus of at least a factor of 2compared with the blank (i.e., spontaneous activity) were discarded.
R E S U L T S
The effectiveness of different types of stimuli
A total of 165 sessions were recorded in 4 animals (cat L:55; cat S: 49; cat F: 42; cat M: 19 sessions). An example of rawdata from the local field potential during presentation of anatural movie is shown in Fig. 1A. Evidently, the recordedsignal was modulated by the stimulus. The spectrogram result-ing from these data is shown in Fig. 1B. After stimulus onsetan increase in power at most frequencies is observed. Toemphasize the activity elicited by the stimulus compared withthe leading blank, each frequency axis was normalized by itsSD during the blank (Fig. 1C; see METHODS). This normalizedspectrogram reveals that the strongest increase of power does
1913PROCESSING OF NATURAL SCENES IN V1
J Neurophysiol • VOL 90 • SEPTEMBER 2003 • www.jn.org
on March 8, 2011
jn.physiology.orgD
ownloaded from
not occur in the gamma range (30–80 Hz) but at frequenciesabove 80 Hz. A decrease is observed below frequencies of 20Hz.
Local field potential activity for different stimuli
The following section compares the activity elicited by thedifferent stimuli in one subject in detail.
Figure 2 summarizes the local field potential activity aver-aged across recording sites (n � 48) at different depths. Com-mon to all stimuli is evoked activity, characterized by anincrease in power at all frequencies, just after the stimulusonset. In the following this evoked activity is ignored and theanalysis concentrates on the “steady-state” activity after theonset response. Figure 2A shows the activity elicited by thegratings. It reaches a steady state after about 150 ms charac-terized by an increase in power in the range of 30–60 Hz, amoderate increase in the range of 80–130 Hz, and decreasebelow 20 Hz. The response is stationary and can be wellsummarized by averaging the 2D spectrogram over time. Wedefine a modulation curve by averaging the spectrogram overthe interval of 400–1,900 ms. This modulation curve shown onthe right of the spectrogram quantifies the relative contributionof different frequencies to the response. For gratings it revealsa prominent increase around 40 Hz and a decrease at lowfrequencies.
We now compare this response pattern to that elicited bynatural movies. Figure 2B shows the spectrogram averagedacross all presentations of the different natural movies. Theresponse shows a phasic pattern, with large variations of ac-tivity over the time course of the stimulus. Again, by averagingover time a modulation curve is obtained showing a decreasefor frequencies below 20 Hz, a strong increase in the gammarange, and an increase in activity at frequencies well beyond 80Hz. Thus the activity pattern for natural movies differs fromthat for gratings: strong activation at frequencies above 80 Hzand large fluctuations during the “steady-state” response.
The response to the pink pixel noise stimuli includes a largerange of frequencies similar to the response to natural movies(Fig. 2C). Furthermore, pink noise also elicits an irregularactivity pattern over time. For this stimulus the modulationcurve is similar to that for natural movies (6.8% deviation overthe whole frequency range). The pink pixel noise activates thesame frequencies with similar amplitudes despite the differenthigher-order statistics and the resulting very different appear-ances of the two stimuli. Thus the local field potential is mostsensitive to the second-order statistics of the pixel intensities,but not to their higher-order correlations.
In contrast to natural movies and the pixel noise, the waveletmanipulations show a much weaker stimulus-induced changein the local field potential (Fig. 2, D and E). However, theirmodulation curves reveal a similar pattern as for natural mov-ies: a decrease below 20 Hz, an increase in the gamma range,and a second peak of activity above 80 Hz. Comparing thewavelet-filtered movie with the wavelet noise, the differencebetween the modulation curves is small (4.7% deviation overthe whole frequency range). Thus the response of the local fieldpotential seems influenced only by the local contrast edges ofthe filters, but not by their global alignment.
Magnitude of the response for the different stimuli
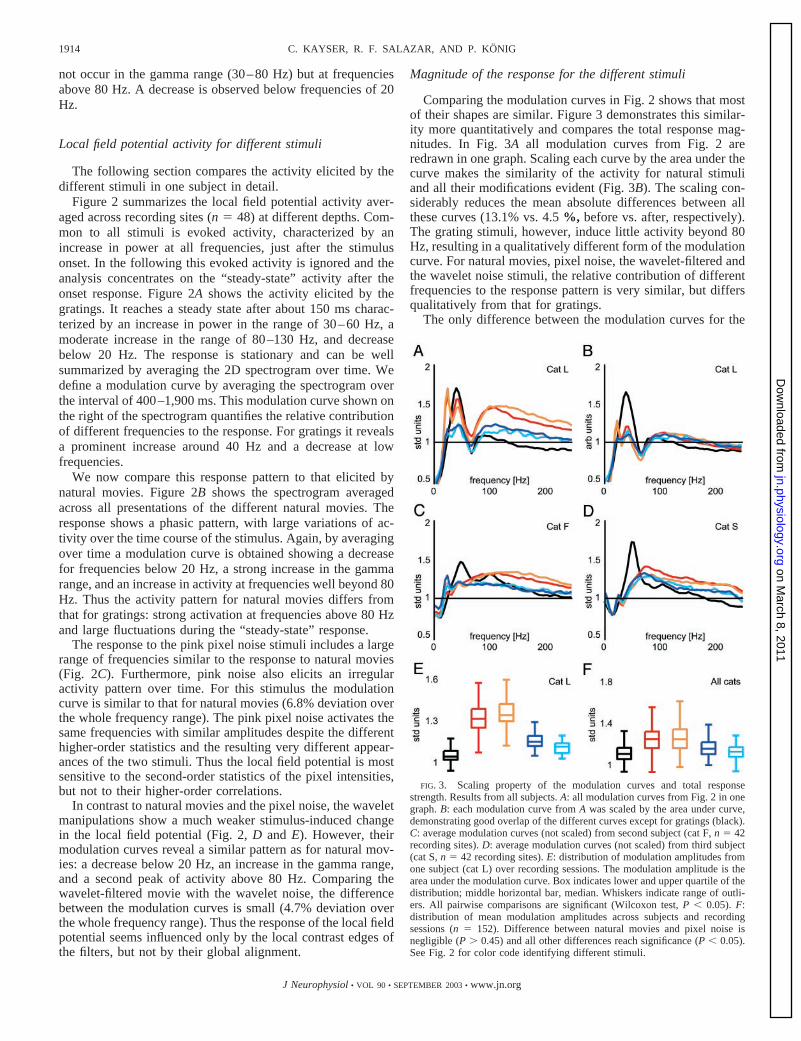
Comparing the modulation curves in Fig. 2 shows that mostof their shapes are similar. Figure 3 demonstrates this similar-ity more quantitatively and compares the total response mag-nitudes. In Fig. 3A all modulation curves from Fig. 2 areredrawn in one graph. Scaling each curve by the area under thecurve makes the similarity of the activity for natural stimuliand all their modifications evident (Fig. 3B). The scaling con-siderably reduces the mean absolute differences between allthese curves (13.1% vs. 4.5 %, before vs. after, respectively).The grating stimuli, however, induce little activity beyond 80Hz, resulting in a qualitatively different form of the modulationcurve. For natural movies, pixel noise, the wavelet-filtered andthe wavelet noise stimuli, the relative contribution of differentfrequencies to the response pattern is very similar, but differsqualitatively from that for gratings.
The only difference between the modulation curves for the
FIG. 3. Scaling property of the modulation curves and total responsestrength. Results from all subjects. A: all modulation curves from Fig. 2 in onegraph. B: each modulation curve from A was scaled by the area under curve,demonstrating good overlap of the different curves except for gratings (black).C: average modulation curves (not scaled) from second subject (cat F, n � 42recording sites). D: average modulation curves (not scaled) from third subject(cat S, n � 42 recording sites). E: distribution of modulation amplitudes fromone subject (cat L) over recording sessions. The modulation amplitude is thearea under the modulation curve. Box indicates lower and upper quartile of thedistribution; middle horizontal bar, median. Whiskers indicate range of outli-ers. All pairwise comparisons are significant (Wilcoxon test, P � 0.05). F:distribution of mean modulation amplitudes across subjects and recordingsessions (n � 152). Difference between natural movies and pixel noise isnegligible (P � 0.45) and all other differences reach significance (P � 0.05).See Fig. 2 for color code identifying different stimuli.
1914 C. KAYSER, R. F. SALAZAR, AND P. KONIG
J Neurophysiol • VOL 90 • SEPTEMBER 2003 • www.jn.org
on March 8, 2011
jn.physiology.orgD
ownloaded from

natural stimuli and all their modifications relates to the meanamplitudes. These are a measure of the total response ampli-tude induced by the stimulus. The distribution of these ampli-tudes for the same subject is shown in Fig. 3E. The amplitudesfor pixel noise and the natural movies are largest. In particular,the pixel noise lacking higher-order structure is at least asefficient as the natural stimuli. A similar observation holds forthe wavelet-filtered and the wavelet noise stimuli.
Comparison of different subjects
Similar results as those described above were found in allsubjects (n � 4). For two additional subjects the averagedmodulation curves are shown in Fig. 3, C and D. The overallshape of the modulation curves differs between animals, anissue discussed further below. However, the activity patternsfor natural movies and pink pixel noise are similar within allsubjects. The same result holds for the comparison of thewavelet-filtered stimulus and wavelet noise. The scaling be-havior described in the previous section holds for all subjectsas well. Figure 3F summarizes the distribution of modulationamplitudes across all 4 subjects. The natural movies and thepixel noise lead to modulations of the same strength (P � 0.45,Wilcoxon test). The difference between the wavelet-filteredstimulus and the wavelet noise is significant (P � 0.05, Wil-coxon test). Also consistently across all subjects, the activitypattern for gratings differs in every respect from that for allother stimuli. Gratings elicit a steady-state response and mostlyactivate frequencies in the gamma range with a similar peak ofactivity in different subjects (cat L: 43 Hz; F: 51 Hz; S: 51 Hz;M: 45 Hz). Thus although the local field potential activityelicited by one particular stimulus can differ between subjects,the relative activity of different stimuli is similar across sub-jects and the results described above for one subject hold ingeneral.
In each subject we recorded at sites of different depths (seeMETHODS). The modulation curves for each subject were aver-aged across all recording sites from this subject. It is knownthat the shape of the evoked potential in the local field potentialchanges shape, amplitude, and sign depending on the depth ofthe recording site (Freeman 1975). However, the spectrogramsand the modulation curves are derived from the power spec-trum of the signal. Therefore these measures are invariant withrespect to a change in sign of the local field potential. Thenormalization of the spectrogram further eliminates an overallscaling affecting the stimulus as well as the blank period. Weseparately analyzed recording sites that clearly were in supraand infra granular layers (data not shown). Within all subjects,the shapes of the averaged supra and infra granular modulationcurves for a given stimulus were quite similar. Thus the rela-tive activity induced by different stimuli at supra and infragranular sites is similar. Additionally, for 3 subjects of whichwe had data from �5 supra and 5 infra granular sites, wecompared these quantitatively: averaged across all frequenciesand stimuli, the modulation was stronger at the infra granularsites (4.2, 5.2, and 5.8%; subjects L, F, and S, respectively).For comparison, the difference of the modulation curves be-tween subjects, averaged across stimuli and frequencies, is13.6%. Although we do not have an explanation for the dif-ference in shape of the modulation curves between subjects, we
can confidently exclude that this difference is the result of asampling bias in the recording sites.
Multiunit activity
As a complement to the local field potential, which measuresthe activity in a region around the electrode tip and emphasizessynchronous signals (Abeles 1982), we recorded the spikingactivity of multiunit sites. The example shown in Fig. 4Aillustrates the responses of one recording site to a naturalmovie. The response is clearly modulated by the presentationof the stimulus and varies over time. Figure 4B shows theaveraged firing rates during the tonic part (300 ms after stim-ulus onset until stimulus offset) for the different stimuli andthis recording site. Natural stimuli are clearly effective indriving neurons in primary visual cortex. Comparing the stim-uli with different higher-order statistics shows that naturalmovies and the pixel noise elicit similar firing rates. The sameholds for the comparison of wavelet-filtered movie versuswavelet noise. To average across different recording sites onehas to account for the differences in mean firing rate betweensites. To do so, the mean rate over all stimuli was computed foreach site and the rates for the individual stimuli were dividedby this mean. The average across all sites (n � 33, 2 subjects)is shown in Fig. 4C. The natural movies elicit slightly butsignificantly stronger firing rates than the pixel noise (1.28 and1.20 times the mean rate, respectively; P � 0.05, Wilcoxontest). This quantitative difference (6.6%) roughly matches theresult from the local field potential amplitudes (0.1%, Fig. 3F)and is much smaller than the difference from the amount ofactivity induced by the other stimuli. Thus both the firing rate
FIG. 4. Multiunit activity. A: spiking activity for a natural movie recordedin subject S. Peristimulus histogram (PSTH) (50-ms bins) is shown togetherwith spike trains from 19 repeats of the natural movie. B: average firing rate ofthis unit for different stimuli. For each stimulus repeat average firing rate wascomputed as mean rate in window starting 400 ms after stimulus onset untilstimulus offset. Error bars: SD. C: distribution of relative firing rates fordifferent stimuli for all units recorded (n � 33). The relative firing rate for agiven unit and stimulus is defined as the firing rate for this particular stimulusdivided by the mean firing rate of this unit across all stimuli. Error bars: SD.All pairwise differences are significant (Wilcoxon test, P � 0.05). See Fig. 2for color code identifying different stimuli.
1915PROCESSING OF NATURAL SCENES IN V1
J Neurophysiol • VOL 90 • SEPTEMBER 2003 • www.jn.org
on March 8, 2011
jn.physiology.orgD
ownloaded from

of multiunits and the local field potential amplitudes are onlyweakly sensitive to the higher-order statistical properties of thestimuli.
Temporal structure of the activity pattern
The above results show that natural movies elicit a variableand irregular temporal activity pattern (Fig. 2A, Fig. 4A). Thefollowing section investigates the cause of this temporal struc-ture and compares it quantitatively to proposed modulations ofthe activity reported in previous studies on visual representa-tions.
The natural movies used for stimulation contain many irreg-ularities in their temporal structure such as short and rapidtranslations. To quantify their impact on cortical activity,cross-correlations between the amplitude of the stimulus mo-tion and the activity at different frequencies of the local fieldpotential were computed. An approximation for the globalstimulus motion was obtained from the average amplitude ofthe flow field (see METHODS). An example is shown in Fig. 5Atogether with the spectrogram of the local field potential.Visual inspection indicates a close correlation of neuronalactivity and stimulus motion. The correlogram averaged overall recording sites in one subject is shown in Fig. 5B. As can beseen, the activity in the local field potential is correlated withthe motion in the stimulus. This correlation is particularlyprominent at frequencies beyond 80 Hz. The correlations arestrongest at a time lag where the stimulus leads the activity by50–100 ms, which is in agreement with known latencies ofvisual responses. This finding is consistent across subjects andstimulus movies (Fig. 5C).
The strength of the temporal variations can be quantified bythe coefficient of variation (CV) of the power in the local fieldpotential computed over time. The coefficients averaged acrossfrequencies lie between 0.23 and 0.25 for the different subjects.Given that our stimuli closely match the visual input to a cat’seye under natural conditions these results highlight an impor-tant characteristic of activity patterns under natural conditions.Body and head motion lead to temporal changes in the stimu-lus, bringing repeatedly new stimuli onto the retina. Thesecontinuous changes in the retinal image evoke a series of visualtransients. Therefore under real-world conditions, we do notobserve what classically would be called a steady-state re-sponse, but response strengths are continuously changing.
In the following we analyze the magnitude of the evokedtransients in the local field potential and the multiunit activityin a more quantitative way. A number of studies report mod-ulations of the mean activity in the tonic part of neural re-sponses. Examples of such modulations in primary visualcortex are, for example, contextual effects (Nothdurft et al.2000) and figure ground modulations (Lamme 1995; Roelf-sema et al. 1998), both of which are especially relevant for theprocessing of natural scenes. These studies report an averagemodulation of single-unit firing rates of the order of 25%. Toquantify the impact of the fluctuations in our population re-sponses we measure the length of the interval necessary toreliably detect a 25% modulation of the recorded mean activ-ity.
Taking a limited sample of the response gives an estimate ofthe average activity with a certain precision. Using extendedwindows can increase this precision. The following analysis
seeks for the length of the interval necessary to reliably (e.g.,on the 5% level) detect a 25% modulation of the mean activity.This implies that our method should give a positive result inonly 5% of the cases when no modulation is present. Simul-taneously, the detection threshold should be that low that a25% modulation is detected in half the cases. Spectrograms oflocal field potentials were computed as described above. Fromthese the mean and the variance of the total energy in a windowwere determined as a function of the length of the window andthe width of the frequency band. Using t-statistics we deter-mined the minimum window length, where one sample isenough to satisfy the requirements for detection (i.e., P � 0.05)as explained above. Averaging over subjects and stimuli, theminimum window length in the gamma frequency domain(30–80 Hz) was 380 ms. At higher frequencies (80–250 Hz)the necessary window length resulted in roughly 380 ms aswell. By pooling different frequency bands the sensitivitycould not be increased because the variations in power were
FIG. 5. Correlation of stimulus motion and local field potential activity. A:top part: spectrogram of one recording site for a natural movie. Bottom graph:amplitude of motion in this natural movie in units of deg/s. B: cross-correlationbetween local field potential activity and motion amplitude for one subject andone stimulus movie. For each frequency of the spectrogram a cross-correlationof power with the motion amplitude of the stimulus was computed in a rangeof �300ms (at negative time lags stimulus leads response). First 300 ms ofstimulus presentation were excluded to avoid artifacts induced by evoked onsetresponse. Result was then averaged across sessions. To filter out insignificantcorrelations a baseline was computed by averaging cross correlations of thesame spectrogram with motion amplitudes of other stimuli than that shown toobtain the spectrogram. Correlations �1 SD away from this baseline weretaken as insignificant and set to zero. C: cross-correlations averaged across all4 subjects and 3 stimulus movies.
1916 C. KAYSER, R. F. SALAZAR, AND P. KONIG
J Neurophysiol • VOL 90 • SEPTEMBER 2003 • www.jn.org
on March 8, 2011
jn.physiology.orgD
ownloaded from
correlated across different frequencies. Obviously, higher mod-ulations (40%) are quicker to detect (230 ms, gamma fre-quency range) and lower degrees of modulation (12%) requiremore time for significant detection (590 ms, gamma frequencyrange).
The temporal structure of natural movies elicits not only ahighly variable activity in the local field potential, but alsoinduces fluctuations in the spiking response of units (Fig. 4A).For these we performed a similar analysis searching for theshortest window allowing the discrimination of a given meanfiring rate and an increased or decreased mean firing rate. Thedifferent percentages of offsets in mean firing rate resulted insimilar window lengths as for the local field potential (12%:460 ms; 25%: 420 ms; 40%: 400 ms).
The above analysis investigates the minimal temporal inter-val needed to reliably detect a modulation of the local fieldpotential and multiunit activity. These signals do not necessar-ily match the input to a decoding neuron. Whereas the multi-unit activity constitutes the activity of a local group of neuronsand the local field potential reflects the neuronal activity in aregion of a few hundreds of micrometers, neurons in the cortexmay integrate signals from a larger domain. However, thefluctuations in the neuronal activity observed are correlatedover large distances, thus making it unlikely that these fluctu-ations average out in the input to a decoding neuron. Recentresults, furthermore, strengthen the link between populationactivity and behavior (Super et al. 2003). Thus fluctuations inpopulation the activity are likely to affect the processing ofincoming stimuli as well as behavioral responses. The intervalsnecessary to detect changes in the average activity reportedabove are long compared with visual latencies of cells in highervisual areas (Oram and Perret 1992; Perrett et al. 1982) andreaction times of experimental subjects (Thorpe et al. 1996;van Rullen and Thorpe 2001). Thus the transient fluctuations ofthe activity evoked by the motion the natural stimuli imposeconstraints on theories of cortical representations relying ondifferences in mean activations.
Stimuli with altered motion patterns
The difference in local field potential activity between grat-ings and natural movies could have several reasons. On the onehand, the stimuli contain different motion patterns, uniformand irregular, respectively. On the other hand, the stimuli have
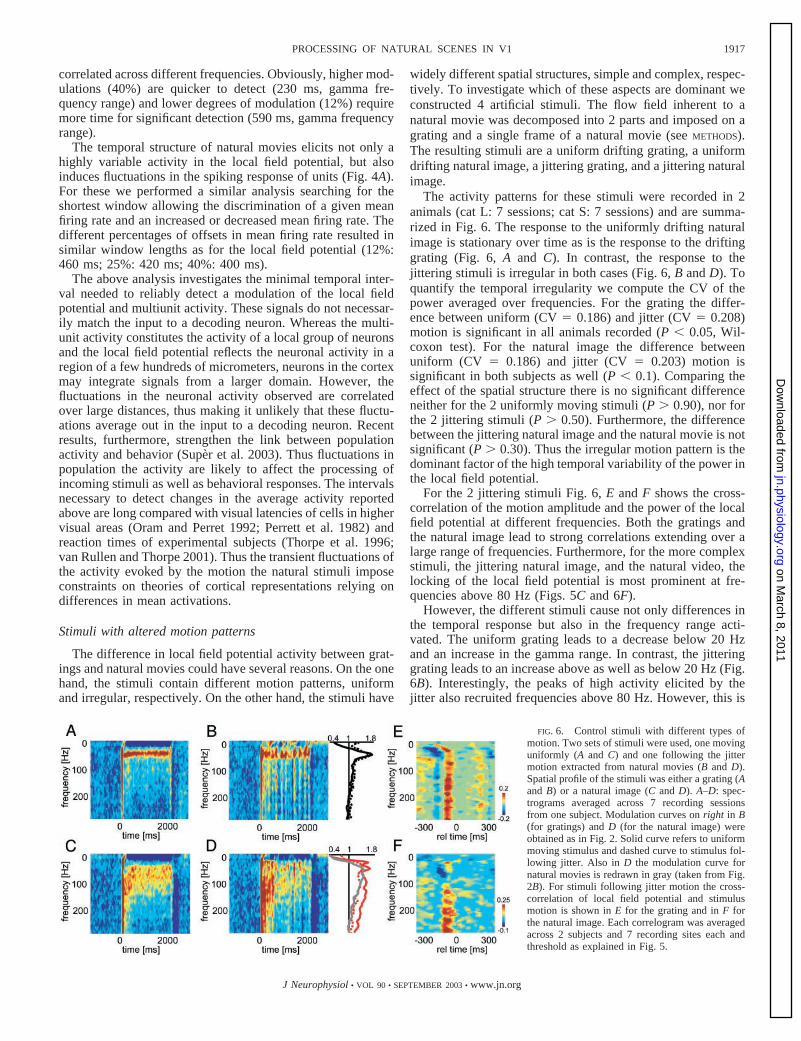
widely different spatial structures, simple and complex, respec-tively. To investigate which of these aspects are dominant weconstructed 4 artificial stimuli. The flow field inherent to anatural movie was decomposed into 2 parts and imposed on agrating and a single frame of a natural movie (see METHODS).The resulting stimuli are a uniform drifting grating, a uniformdrifting natural image, a jittering grating, and a jittering naturalimage.
The activity patterns for these stimuli were recorded in 2animals (cat L: 7 sessions; cat S: 7 sessions) and are summa-rized in Fig. 6. The response to the uniformly drifting naturalimage is stationary over time as is the response to the driftinggrating (Fig. 6, A and C). In contrast, the response to thejittering stimuli is irregular in both cases (Fig. 6, B and D). Toquantify the temporal irregularity we compute the CV of thepower averaged over frequencies. For the grating the differ-ence between uniform (CV � 0.186) and jitter (CV � 0.208)motion is significant in all animals recorded (P � 0.05, Wil-coxon test). For the natural image the difference betweenuniform (CV � 0.186) and jitter (CV � 0.203) motion issignificant in both subjects as well (P � 0.1). Comparing theeffect of the spatial structure there is no significant differenceneither for the 2 uniformly moving stimuli (P � 0.90), nor forthe 2 jittering stimuli (P � 0.50). Furthermore, the differencebetween the jittering natural image and the natural movie is notsignificant (P � 0.30). Thus the irregular motion pattern is thedominant factor of the high temporal variability of the power inthe local field potential.
For the 2 jittering stimuli Fig. 6, E and F shows the cross-correlation of the motion amplitude and the power of the localfield potential at different frequencies. Both the gratings andthe natural image lead to strong correlations extending over alarge range of frequencies. Furthermore, for the more complexstimuli, the jittering natural image, and the natural video, thelocking of the local field potential is most prominent at fre-quencies above 80 Hz (Figs. 5C and 6F).
However, the different stimuli cause not only differences inthe temporal response but also in the frequency range acti-vated. The uniform grating leads to a decrease below 20 Hzand an increase in the gamma range. In contrast, the jitteringgrating leads to an increase above as well as below 20 Hz (Fig.6B). Interestingly, the peaks of high activity elicited by thejitter also recruited frequencies above 80 Hz. However, this is
FIG. 6. Control stimuli with different types ofmotion. Two sets of stimuli were used, one movinguniformly (A and C) and one following the jittermotion extracted from natural movies (B and D).Spatial profile of the stimuli was either a grating (Aand B) or a natural image (C and D). A–D: spec-trograms averaged across 7 recording sessionsfrom one subject. Modulation curves on right in B(for gratings) and D (for the natural image) wereobtained as in Fig. 2. Solid curve refers to uniformmoving stimulus and dashed curve to stimulus fol-lowing jitter. Also in D the modulation curve fornatural movies is redrawn in gray (taken from Fig.2B). For stimuli following jitter motion the cross-correlation of local field potential and stimulusmotion is shown in E for the grating and in F forthe natural image. Each correlogram was averagedacross 2 subjects and 7 recording sites each andthreshold as explained in Fig. 5.
1917PROCESSING OF NATURAL SCENES IN V1
J Neurophysiol • VOL 90 • SEPTEMBER 2003 • www.jn.org
on March 8, 2011
jn.physiology.orgD
ownloaded from
not obvious in the modulation curve because of temporalaveraging. In fact, the two modulation curves are significantlydifferent at frequencies below 31 Hz, but not above (2-wayANOVA, P � 0.05). The jittering natural image leads to asimilar shape of the modulation curve as the real movie (Fig.6D). The uniformly drifting natural image in contrast causes astronger increase in power than the natural movie. The differ-ence between the two modulation curves is significant at allfrequencies above 70 Hz and most frequencies below 70 Hz.However, the basic shape of the modulation curve is the same.
Concluding, the above results show that temporally irregularstimuli induce locking of the local field potential to the stim-ulus motion independent of the detailed spatial structure of thestimulus. Thus temporal properties and irregularities of theresponses reported above for the natural movies are not boundthe spatial characteristics of natural images but occur for otherreasonably complex stimuli. The detailed pattern of the re-sponse, like the frequencies of the induced local field potential,depends on both the spatial and the temporal properties of thestimulus in a complex way.
D I S C U S S I O N
In this study we investigate processing of global structure ofnatural scenes in the primary visual cortex of alert cats. Wemeasured local field potentials as well as multiunit firing ratesfor natural movies and modified movies with different statis-tical properties as well as gratings. The activity pattern fordrifting gratings differs strongly from that for natural moviesand this difference is contingent on both the spatial and thetemporal properties of the natural movies. Furthermore, theactivity elicited by pink noise stimuli and the activity elicitedby natural stimuli does not differ significantly, indicating onlya weak impact of the higher-order stimulus statistics on theresponses. Natural movies elicit a very irregular temporalactivity pattern. We show that the temporal structure is dom-inated by the motion in the visual input and quantify thisirregularity that strongly limits the concept of a steady-stateresponse.
Limitations of the present study
We recorded from awake animals that, although their headwas fixed, were freely watching the stimuli and moving theireyes. However, instead of excluding some eye movements(e.g., saccades) from analysis or performing separate analysisduring fixations and eye movements we averaged across all eyepositions. Thus we cannot directly exclude whether eye move-ments as such, independent of the stimulus, are the cause ofsome of the response properties described. However, fromother studies in the same recording setup it is known that catsmove their eyes much more infrequently up on stimulationwith natural movies than, say, humans do (Moller et al. 2002).The average intersaccade interval (�3 s) is much longer thanthe window used for analysis in the present study. Furthermorewe measured eye movements in a few of our recording sessionsand found no relation of eye movements to the timing of thestimulus presentation.
A second potential shortcoming is our limited knowledgeabout the nature of the local field potential and its relation tothe activity of single neurons. Supposedly the local field po-
tential is determined by electrical activity approximately 500�m around the electrode tip and is influenced not only byspiking response of neurons but also by somatic and dendriticpotentials, especially emphasizing synchronous components(Abeles 1982). However, because it is a population measure itis not susceptible to noise in the firing of single neurons andmight give a better approximation to the relevant activity in apatch of cortex. Recently evidence was put forward showing aclose relationship between the local field potential and mea-sures from magnetic resonance imaging, especially the bloodoxygen level dependant BOLD signal (Lauritzen 2001; Logo-thetis et al. 2001; Mathiesen et al. 2000). In view of thegrowing body of studies using functional MRI, especially withprimate subjects, one can expect a larger number of studieswith results comparable to those presented here. Thus althoughthe sources of the local field potential are not known in detailit seems a well-suited measure for the study of populationactivity.
Are the results compatible with previous studies?
Several properties of the local field potential activity re-ported in this study are in agreement with results previouslypublished. We find that stimulation with drifting gratings leadsto strong activation in the classical gamma range. Using naturalstimuli, however, we find a strong increase of activity at higherfrequencies above 100 Hz as well. In a previous study, alsorecording from awake cats, the strongest increase in power onstimulation with flashed gratings was also found in the gammarange (Siegel and Konig 2003). However, the optimally orien-tation tuned frequency band determined in the latter studyextended beyond 100 Hz. Together, these results consistentlypoint to the relevance of high-frequency activity in the localfield potential.
Recently a study recording in V1 of anesthetized cats re-ported locking of the local field potential activity to the timecourse of uniform moving and randomly accelerated gratings(Kruse and Eckhorn 1996). The present study extends thisfinding to awake animals and stimuli of different spatial struc-ture. In particular we show that natural movies induce activityfluctuations locked to the stimulus motion. The study by Kruseand Eckhorn further reports a decrease of induced oscillationswith increasing irregularity of the stimulus motion. The in-duced oscillations, as measured with the power spectrum of thelocal field potential, were most prominent for the uniformdrifting grating. In the present study we do find this effect aswell, albeit only on stimulation with natural stimuli.
Little is known about how activity patterns in the visualcortex depend on the global structure of the stimuli. So far onlya small number of studies compared stimuli with differentstatistical properties. Lehky et al. (1992) compared firing ratesin the primary visual cortex of anesthetized monkeys to imagepatches of different complexity. They found that complexstimuli such as random textures or 3D surfaces elicit largerfiring rates than simple stimuli such as gratings. This result isin good agreement with our data showing stronger activity fornatural movies and pink noise than for gratings.
Baddeley et al. (1997) measured responses in V1 of anes-thetized cats to different natural movies and white noise stim-uli. They reported larger firing rates for natural movies than forthe white noise, although the differences were small (4 Hz vs.
1918 C. KAYSER, R. F. SALAZAR, AND P. KONIG
J Neurophysiol • VOL 90 • SEPTEMBER 2003 • www.jn.org
on March 8, 2011
jn.physiology.orgD
ownloaded from
2.5 Hz). Given these small differences in activity and the factthat they used a different type of noise, this difference is not acontradiction to the results reported here.
A further comparison of cortical activity to natural stimuliand pixel noise comes from functional imaging. MeasuringBOLD responses in anesthetized monkeys, Rainer et al. (2001)reported significantly stronger V1 activation for natural imagesthan for pink pixel noise.
Despite the relevance of natural stimuli to every day life,most studies use highly simplified stimuli and it is presentlyunclear which results generalize to processing of naturalscenes. However, it seems clear that neurons in the primaryvisual cortex are well adapted to processing of natural scenes.In a seminal study Vinje and Gallant (2000, 2002) showed thatV1 neurons in awake monkeys are well driven by naturalmovies, that information rate and transmission increase withincreasing stimulus size and that response sparseness is in-creased by stimulation of the receptive field surround. Anotherstudy reporting efficient coding of natural scenes in V1 comesfrom recordings in anesthetized ferrets. Weliky and coworkers(2003) report high population and lifetime sparseness on stim-ulation with natural images. Interestingly this study reports thatsingle cells responses are not enough to provide a reliableestimate of the local contrast in natural images but shows howa population encodes this information efficiently. Although adirect comparison of the results reported in these and thepresent study is impossible, the above studies provide supportfor the paradigm used here: First, to obtain response propertiesmatching those under natural conditions large field stimulationwith complex scenes is required. Second, a population measuremight be more relevant than single-unit activity.
Implications for theories of object binding
Natural scenes contain many structures a human observerwould classify as objects. The question how the visual systemachieves this segmentation of an image into distinct objects andwhat the underlying neuronal mechanisms are lead to a numberof theories. Two prevailing mechanisms have been proposed toexplain how the responses of neurons responding to differentfeatures of the same object are bound together. The first,binding by synchrony, proposes that the spikes of two suchneurons have a fixed temporal relationship (Eckhorn 1994;Singer and Gray 1995). Such response properties have beendemonstrated using artificial bars (Gray et al. 1989) and figuresdefined by textural differences (Castelo-Branco et al. 2000;Gail et al. 2000; Woelbern et al. 2002). Following the secondmechanism, a global visual structure is represented by themodulation of firing rates. Two neurons falling on parts of thesame object show similar increases or decreases of activity.Evidence for this hypothesis comes from studies reportingdifferences in the tonic part of the response depending onwhether the receptive field lies on an object or the background(Lamme 1995; Nothdurft et al. 2000; Roelfsema et al. 2002;Zipser et al. 1996). However, both mechanisms are hotlydebated and no final conclusion has been reached so far(Lamme and Spekreijse 1998; Shadlen and Movshon 1999;Singer 1999).
What are the predictions of these mechanisms for the re-sponses to the stimuli used in this study? The noise stimulihave a random phase spectrum and do not contain structures a
human observer would classify as an object whereas the naturalmovies do. Thus following either binding mechanism thereshould be a significant difference in the response properties forthese two stimuli. Following the binding by synchrony hypoth-esis we should see an increased level of synchronization for thenatural movies compared with the noise. Assuming that thissynchronization affects nearby neurons within a few hundredmicrometers, such an increase in synchronization should affectthe power of the local field potential. However, this is not whatwe observe. The modulation curves for pink pixel noise andnatural movies are very similar. Following the binding bymodulation hypothesis, one could expect a change in the over-all level of activity between noise and natural stimulus. In thelocal field potential we do not see this, and the firing rates ofthe multiple units show an increase for natural movies by onlya small amount. Furthermore, the variance of the activity overtime during the “steady state” is large and severely limits areadout of changes in the mean activity. Our estimates of thenecessary readout times to detect such differences are on theorder of several hundreds of milliseconds. This questionswhether such a mechanism can operate fast enough underreal-world conditions. These considerations, however, have tobe taken with a grain of salt. Whereas previous key experi-ments supporting either hypothesis (Gray et al. 1989; Lamme1995) have been conducted using artificial stimuli, neitherhypothesis has been elaborated in sufficient detail to allow aquantitative prediction and a hard experimental test undernatural stimulus conditions. For example, we do not knowenough about the statistics of “objects” in natural stimuli, abouttheir spatial and temporal scale, to be certain that the methodsapplied are actually sensitive enough to elucidate the respon-sible mechanisms in the brain.
We thank G. Moller for help during the experiments, M. Siegel for inspiringdiscussions, and the referees for prompt and helpful comments on the manu-script.
D I S C L O S U R E S
This work was supported by the Center of Neuroscience Zurich (C. Kayser),the Swiss National Foundation (Grant 31-65415.01 to P. Konig and R.Salazar), and the EU/BBW (IST-2000-28127, 01.0208-1 to P. Konig).
REFERENCES
Abeles M. Local Cortical Circuits. An Electrophysiological Study. Berlin:Springer, 1982.
Baddeley R, Abbott LF, Booth MCA, Sengpiel F, Freeman T, WakemanEA, and Rolls E. Responses of neurons in primary and inferior temporalvisual cortices to natural scenes. Proc R Soc Lond B Biol Sci 264: 1775–1783, 1997.
Beachemin SS and Barron JL. The computation of optical flow. ACMComput Surv 27: 433–467, 1995.
Blakemore C and Tobin EA. Lateral inhibition between orientation detectorsin the cat’s visual cortex. Exp Brain Res 15: 439–440, 1972.
Brainard DH. The psychophysics toolbox. Spat Vis 10: 433–436, 1997.Castelo-Branco M, Goebel R, Neuenschwander S, and Singer W. Neural
synchrony correlates with surface segregation rules. Nature 405: 685–689,2000.
Crommelinck M and Roucoux A. Characteristics of cat’s eye saccades indifferent states of alertness. Brain Res 103: 574–578, 1976.
de Oliveira SC, Thiele A, and Hoffmann KP. Synchronization of neuronalactivity during stimulus expectation in a direction discrimination task.J Neurosci 17: 9248–9260, 1997.
Eckhorn R. Oscillatory and non-oscillatory synchronizations in the visualcortex and their possible roles in associations of visual features. Prog BrainRes 102: 405–426, 1994.
1919PROCESSING OF NATURAL SCENES IN V1
J Neurophysiol • VOL 90 • SEPTEMBER 2003 • www.jn.org
on March 8, 2011
jn.physiology.orgD
ownloaded from

Evinger C and Fuchs AF. Saccadic, smooth pursuit and optokinetic eyemovements of the trained cat. J Physiol 285: 209–229, 1978.
Freeman W. Mass Action in the Nervous System. New York: Academic Press,1975.
Gail A, Brinksmeyer HJ, and Eckhorn R. Contour decouples gammaactivity across texture representation in monkey striate cortex. Cereb Cortex10: 840–850, 2000.
Gerster W. Spiking neurons. In: Pulsed Neural Networks, edited by Maas Wand Bishop CM. Cambridge, MA: MIT Press, 1999.
Gray CM, Konig P, Engel AK, and Singer W. Oscillatory responses in catvisual cortex exhibit inter-columnar synchronization, which reflects globalstimulus properties. Nature 338: 334–337, 1989.
Gray CM and Singer W. Stimulus-specific neuronal oscillations in orienta-tion columns of cat visual cortex. Proc Natl Acad Sci USA 86: 1698–1702,1989.
Kayser C, Einhauser W, and Konig P. Correlations of orientations in naturalscenes. Neurocomputing 52: 117–123, 2003.
Kruse W and Eckhorn R. Inhibition of sustained gamma oscillations (35–80Hz) by fast transient responses in cat visual cortex. Proc Natl Acad SciUSA 93: 6112–6117, 1996.
Lamme VAF. The neurophysiology of figure-ground segregation in primaryvisual cortex. J Neurosci 15: 1605–1615, 1995.
Lamme VAF and Spekreijse H. Neuronal synchrony does not representtexture segregation. Nature 396: 362–366, 1998.
Lamme VAF, Zipser K, and Spekreijse H. Figure ground activity in primaryvisual cortex is suppressed by anesthesia. Proc Natl Acad Sci USA 35:3263–3268, 1998.
Lauritzen M. Relationship of spikes, synaptic activity and local changes ofcerebral blood flow. J Cereb Blood Flow Metab 21: 1367–1383, 2001.
Lee BB. Effect of anesthetics upon visual responses in the cats’ striate cortex.J Physiol 207: 74–75, 1970.
Lehky SR, Sejnowski TJ, and Desimone R. Predicting responses of nonlin-ear neurons in monkey striate cortex to complex patterns. J Neurosci 12:3568–3581, 1998.
Logothetis NK, Pauls J, Augath M, Trinath T, and Oeltermann A. Neu-rophysiological investigation of the basis of the fMRI signal. Nature 412:150–157, 2001.
Mallat SG. A theory for multiresolution signal decomposition: The waveletrepresentation. IEEE Trans Pattern Anal Mach Intell 11: 674–693, 1989.
Mathiesen C, Caesar K, and Lauritzen M. Temporal coupling betweenneuronal activity and blood flow in rat cerebellar cortex as indicated by fieldpotential analysis. J Physiol 523: 235–246, 2000.
Moller G, Kayser C, Hornberger M, and Konig P. Saccades and pursuit eyemovements of cats induced with natural and artificial stimuli. In: Proceed-ings of the Annual Meeting of the German Physiological Society. Tubingen,Germany, 2002.
Movshon JA, Thompson ID, and Tolhurst DJ. Spatial and temporal contrastsensitivity of neurons in areas 17 and 18 of the cat’s visual cortex. J Physiol283: 101–120, 1978.
Nothdurft H, Gallant JL, and Van Essen DC. Response profiles to textureborder patterns in area V1. Vis Neurosci 17: 421–436, 2000.
Oram MW and Perrett DI. Time course of neural responses discriminatingdifferent views of the face and head. J Neurophysiol 68: 70–84, 1992.
Pelli DG. The VideoToolbox software for visual psychophysics: transformingnumbers into movies. Spat Vis 10: 437–442, 1997.
Perrett DI, Rolls ET, and Caan W. Visual neurones responsive to faces in themonkey temporal cortex. Exp Brain Res 47: 329–342, 1982.
Rainer G, Augath M, Trinath T, and Logothetis NK. Non-monotonic noisetuning of BOLD fMRI signal to natural images in the visual cortex of theanesthetized monkey. Curr Biol 11: 846–854, 2001.
Robertson ADJ. Anesthesia and receptive fields. Nature 205: 80–83, 1965.Roelfsema PR, Lamme VAF, and Spekreijse H. Object-based attention in
the primary visual cortex of the macaque monkey. Nature 395: 376–381,1998.
Roelfsema PR, Lamme VA, Spekreijse H, and Bosch H. Figure-groundsegregation in a recurrent network architecture. J Cogn Neurosci 14: 525–537, 2002.
Rolls ET, Aggelopoulos NC, and Zheng F. The receptive fields of inferiortemporal cortex neurons in natural scenes. J Neurosci 23: 339–348, 2003.
Shadlen MN and Movshon JA. Synchrony unbound: a critical evaluation ofthe temporal binding hypothesis. Neuron 24: 67–77, 111–125, 1999.
Siegel M and Konig P. A functional gamma-band defined by stimulusdependent synchronization in area 18 of awake behaving cats. J Neurosci23: 4251–4260, 2003.
Singer W. Neuronal synchrony: a versatile code for the definition of relations?Neuron 24: 49–65, 111–125, 1999.
Singer W and Gray CM. Visual feature integration and the temporal corre-lation hypothesis. Annu Rev Neurosci 18: 555–586, 1995.
Super H, van der Togt C, Spekreijse H, and Lamme VAF. Internal state ofmonkey primary visual cortex (V1) predicts figure-ground perception.J Neurosci 22: 3407–3414, 2003.
Thorpe S, Fize D, and Marlot C. Speed of processing in the human visualsystem. Nature 381: 520–522, 1996.
VanRullen R and Thorpe SJ. Is it a bird? Is it a plane? Ultra-rapid visualcategorisation of natural and artifactual objects. Perception 30: 655–668,2001.
Vinje WE and Gallant JL. Sparse coding and decorrelation in primary visualcortex during natural vision. Science 287: 1273–1276, 2001.
Vinje WE and Gallant JL. Natural stimulation of the nonclassical receptivefield increases information transmission efficiency in V1. J Neurosci 22:2904–15, 2002.
Weliky M, Fiser J, Hunt RH, and Wagner DN. Coding of natural scenes inprimary visual cortex. Neuron 37: 703–718, 2003.
Woelbern T, Eckhorn R, Frien A, and Bauer R. Perceptual groupingcorrelates with short synchronization in monkey prestriate cortex. Neurore-port 13: 1881–1886, 2002.
Zipser K, Lamme VA, and Schiller PH. Contextual modulation in primaryvisual cortex. J Neurosci 16: 7376–7389, 1996.
1920 C. KAYSER, R. F. SALAZAR, AND P. KONIG
J Neurophysiol • VOL 90 • SEPTEMBER 2003 • www.jn.org
on March 8, 2011
jn.physiology.orgD
ownloaded from