
Los Gráficos en Radiestesia - Traducción - Antonio Rodrigues
Physics & Astronomy Faculty Publications Physics and Astronomy
11-23-2020
Response of the Mode Grüneisen Parameters With Anisotropic Response of the Mode Grüneisen Parameters With Anisotropic
Compression: A Pressure and Temperature Dependent Raman Compression: A Pressure and Temperature Dependent Raman
Study of β-Sn Study of -Sn
Jasmine K. Hinton University of Nevada, Las Vegas
Christian Childs University of Nevada, Las Vegas
Dean Smith University of Nevada, Las Vegas
Paul B. Ellison University of Nevada, Las Vegas, [email protected]
Keith V. Lawler Argonne National Laboratory
See next page for additional authors
Follow this and additional works at: https://digitalscholarship.unlv.edu/physastr_fac_articles
Part of the Atomic, Molecular and Optical Physics Commons
Repository Citation Repository Citation Hinton, J. K., Childs, C., Smith, D., Ellison, P. B., Lawler, K. V., Salamat, A. (2020). Response of the Mode Grüneisen Parameters With Anisotropic Compression: A Pressure and Temperature Dependent Raman Study of β-Sn. Physical Review, 102 1-10. http://dx.doi.org/10.1103/PhysRevB.102.184112
This Article is protected by copyright and/or related rights. It has been brought to you by Digital Scholarship@UNLV with permission from the rights-holder(s). You are free to use this Article in any way that is permitted by the copyright and related rights legislation that applies to your use. For other uses you need to obtain permission from the rights-holder(s) directly, unless additional rights are indicated by a Creative Commons license in the record and/or on the work itself. This Article has been accepted for inclusion in Physics & Astronomy Faculty Publications by an authorized administrator of Digital Scholarship@UNLV. For more information, please contact [email protected].

Authors Authors Jasmine K. Hinton, Christian Childs, Dean Smith, Paul B. Ellison, Keith V. Lawler, and Ashkan Salamat
This article is available at Digital Scholarship@UNLV: https://digitalscholarship.unlv.edu/physastr_fac_articles/569
PHYSICAL REVIEW B 102, 184112 (2020)
Response of the mode Grüneisen parameters with anisotropic compression: A pressureand temperature dependent Raman study of β-Sn
Jasmine K. Hinton ,1 Christian Childs,1,2 Dean Smith ,1,3 Paul B. Ellison ,1 Keith V. Lawler ,4 and Ashkan Salamat 1,*
1Department of Physics and Astronomy, University of Nevada, Las Vegas, Nevada 89154, USA2Physical Life Sciences Directorate, Lawrence Livermore National Laboratory, P.O. Box 808, Livermore, California 94550, USA
3HPCAT, X-Ray Science Division, Argonne National Laboratory, Lemont, Illinois 60439, USA4Department of Chemistry and Biochemistry, University of Nevada, Las Vegas, Nevada 89154, USA
(Received 28 August 2020; revised 26 September 2020; accepted 2 November 2020; published 23 November 2020)
The lattice dynamic response of body-centered tetragonal β-Sn (I41/amd) under high-pressure and -temperature conditions is determined using experimental optical vibration modes. Raman scattering is usedto map the phase stability region of β-Sn to perform mode Grüneisen analysis, and we demonstrate thenecessity of an optical intensity calibration for Raman thermometry. The Grüneisen tensor is evaluated alonga set of isotherms to address shortcomings of single-mode Grüneisen parameters with respect to anisotropicdeformations of this tetragonal structured soft metal. The changes observed here in the Grüneisen tensor as afunction of temperature are related to anharmonicity and denote potential criteria for the onset of premelting.
DOI: 10.1103/PhysRevB.102.184112
I. INTRODUCTION
Direct measurement of warm, dense metals to probe theirlattice dynamical properties has only recently been possible[1–6]. Main group metals straddle the boundary with non-metals and exhibit a large variation in orbital hybridizationunder high-pressure and -temperature conditions. This di-versity in metallic bonding permits structural motifs morecomplicated than the simple metals [7]. As a result, discon-tinuous responses are to be expected for these soft metals asthe melt is approached and their elastic properties respond toincreases in bond anharmonicity. In elemental Sn, the brittle,low-temperature α-Sn phase (gray Sn) transitions into β-Sn(white Sn) via a colossal 20% volume collapse at 286 K [8].The sp3 hybridization of α-Sn is similar to lighter group 14elements that adopt the diamond structure, whereas the sphybridization of β-Sn behaves more like heavier, metallic Pbdue to relativistic effects.
Tetragonal β-Sn (I41/amd) transforms into body-centeredtetragonal (bct) γ -Sn (I4/mmm) above 10.8 GPa at 300 K[9]. The nature of this structural phase transition is first or-der and highly stress dependent, going to completion in aquasihydrostatic environment at 15.7 GPa. Upon further com-pression, a number of polymorphs with a body-centered andclosed-packed lattice are revealed [9–11]. The melt line of Snplateaus above 40 GPa, matching a discontinuous increasein the coordination number of liquid Sn [12,13]. Around10–30 GPa and up to 1800 K, dynamic shock experimentsacross the β-Sn to γ -Sn transition have traversed the phaseboundary with increases in reflectivity from 5% to 15% [14]and using time-resolved x-ray diffraction [15].
Raman spectroscopy provides a laboratory-bench methodto optically probe the lattice dynamics of a material by thescattering of the phonon modes of the system. The main groupsoft metals, unlike many of the refractory transition metals,have Raman active phases; however, collecting Raman scat-tering from a metallic system such as β-Sn is still challengingowing to a low Raman scattering cross section [19,20] anda screening of low-energy excitations up to the plasma fre-quency of the metal. Ab initio simulations have estimated aplasma frequency of 8.3–9.2 eV for β-Sn [21], which has apolarization dependence from the anisotropy of the systemand the Fermi level in a nonparabolic portion of the bandstructure [21–23]. Raman scattering is sensitive to electron-ically excited states as well as vibrational modes. Metals haveseveral low-lying (visible, near-IR) electronic states that tendto be broader than their vibrational counterparts [20,24,25].
Despite the spectroscopic challenges discussed for work-ing with metals, herein we present a detailed study of the P-T(Pressure-Temperature) stability region of β-Sn by Ramanscattering, summarized in Fig. 1. The phase space is accessedusing Ohmic heating in the diamond anvil cell (DAC) withthe temperatures shown recorded from the thermocouple. Acomparison of this temperature to Raman thermometry calcu-lations can be found in Appendix B. Using the same Ramanscattering data, we explore the effects of anisotropy in thecalculation of the Grüneisen parameter and discuss the im-portance of reframing this parameter as a tensor.
II. METHODS
Sn (99.5% purity) metal shots from Spectrum Chemicalwith KBr as the pressure-transmitting medium were usedin the high-pressure and -temperature experiments. CaCO3
(99.9%) and SrB4O7 : Sm2+ were used as temperature andpressure markers, respectively. [26]. Custom-designed DACs
2469-9950/2020/102(18)/184112(10) 184112-1 ©2020 American Physical Society
JASMINE K. HINTON et al. PHYSICAL REVIEW B 102, 184112 (2020)
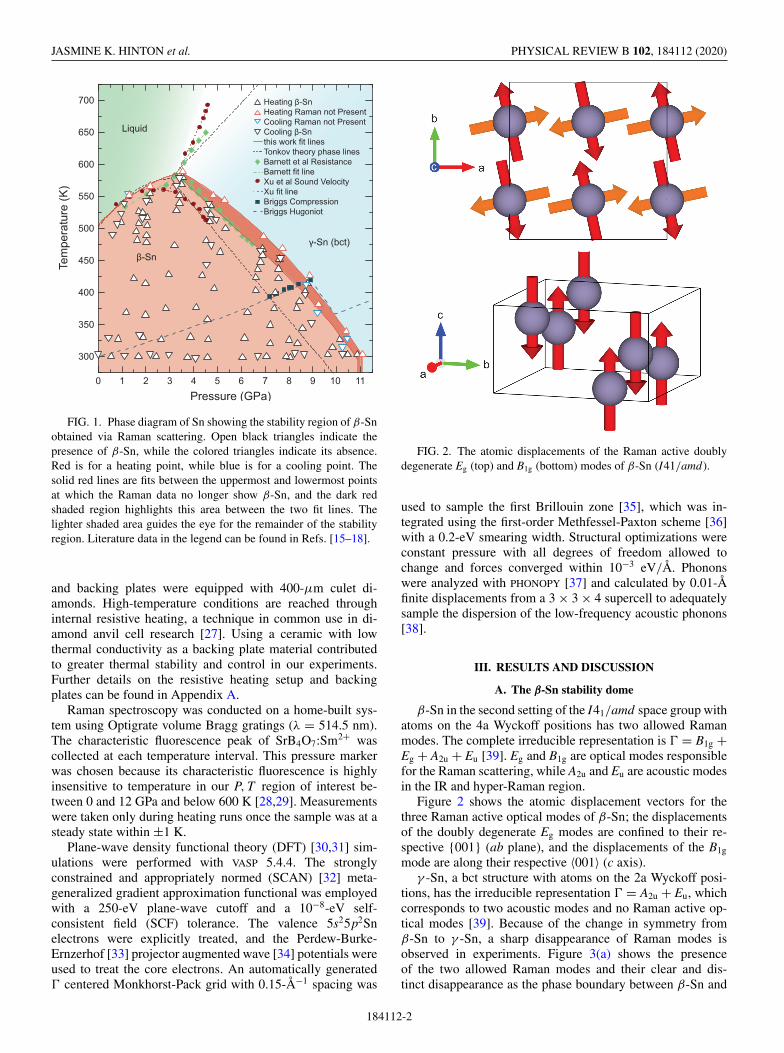
FIG. 1. Phase diagram of Sn showing the stability region of β-Snobtained via Raman scattering. Open black triangles indicate thepresence of β-Sn, while the colored triangles indicate its absence.Red is for a heating point, while blue is for a cooling point. Thesolid red lines are fits between the uppermost and lowermost pointsat which the Raman data no longer show β-Sn, and the dark redshaded region highlights this area between the two fit lines. Thelighter shaded area guides the eye for the remainder of the stabilityregion. Literature data in the legend can be found in Refs. [15–18].
and backing plates were equipped with 400-μm culet di-amonds. High-temperature conditions are reached throughinternal resistive heating, a technique in common use in di-amond anvil cell research [27]. Using a ceramic with lowthermal conductivity as a backing plate material contributedto greater thermal stability and control in our experiments.Further details on the resistive heating setup and backingplates can be found in Appendix A.
Raman spectroscopy was conducted on a home-built sys-tem using Optigrate volume Bragg gratings (λ = 514.5 nm).The characteristic fluorescence peak of SrB4O7:Sm2+ wascollected at each temperature interval. This pressure markerwas chosen because its characteristic fluorescence is highlyinsensitive to temperature in our P, T region of interest be-tween 0 and 12 GPa and below 600 K [28,29]. Measurementswere taken only during heating runs once the sample was at asteady state within ±1 K.
Plane-wave density functional theory (DFT) [30,31] sim-ulations were performed with VASP 5.4.4. The stronglyconstrained and appropriately normed (SCAN) [32] meta-generalized gradient approximation functional was employedwith a 250-eV plane-wave cutoff and a 10−8-eV self-consistent field (SCF) tolerance. The valence 5s25p2Snelectrons were explicitly treated, and the Perdew-Burke-Ernzerhof [33] projector augmented wave [34] potentials wereused to treat the core electrons. An automatically generated� centered Monkhorst-Pack grid with 0.15-Å−1 spacing was
FIG. 2. The atomic displacements of the Raman active doublydegenerate Eg (top) and B1g (bottom) modes of β-Sn (I41/amd).
used to sample the first Brillouin zone [35], which was in-tegrated using the first-order Methfessel-Paxton scheme [36]with a 0.2-eV smearing width. Structural optimizations wereconstant pressure with all degrees of freedom allowed tochange and forces converged within 10−3 eV/Å. Phononswere analyzed with PHONOPY [37] and calculated by 0.01-Åfinite displacements from a 3 × 3 × 4 supercell to adequatelysample the dispersion of the low-frequency acoustic phonons[38].
III. RESULTS AND DISCUSSION
A. The β-Sn stability dome
β-Sn in the second setting of the I41/amd space group withatoms on the 4a Wyckoff positions has two allowed Ramanmodes. The complete irreducible representation is � = B1g +Eg + A2u + Eu [39]. Eg and B1g are optical modes responsiblefor the Raman scattering, while A2u and Eu are acoustic modesin the IR and hyper-Raman region.
Figure 2 shows the atomic displacement vectors for thethree Raman active optical modes of β-Sn; the displacementsof the doubly degenerate Eg modes are confined to their re-spective {001} (ab plane), and the displacements of the B1g
mode are along their respective 〈001〉 (c axis).γ -Sn, a bct structure with atoms on the 2a Wyckoff posi-
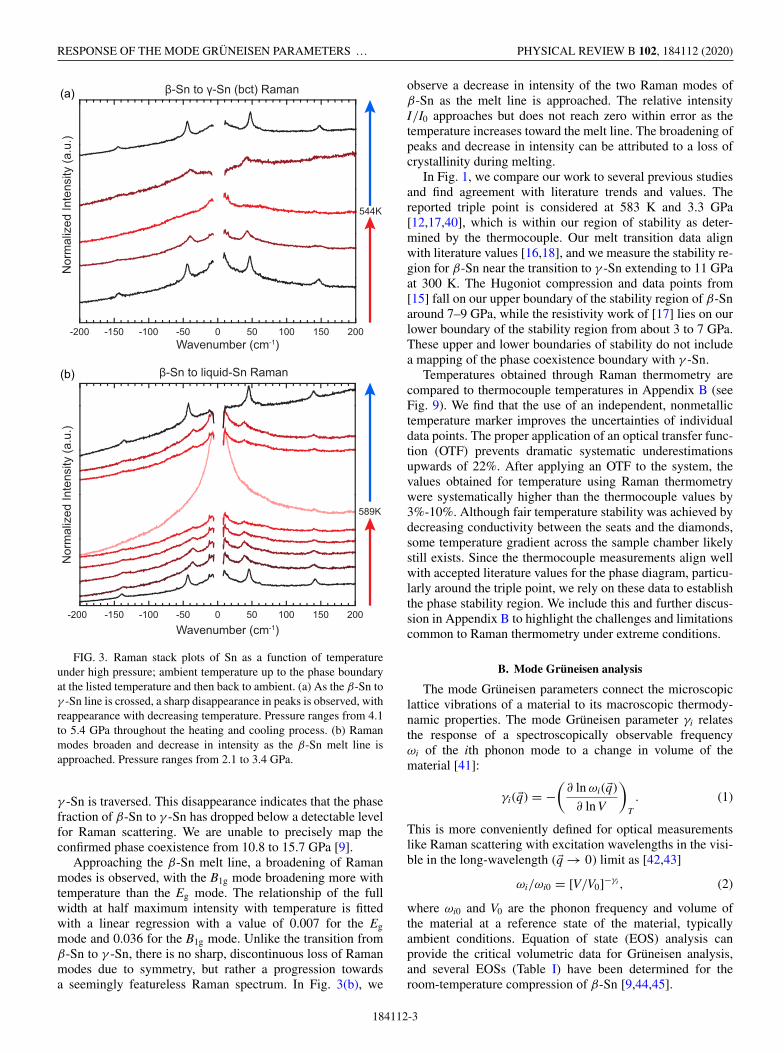
tions, has the irreducible representation � = A2u + Eu, whichcorresponds to two acoustic modes and no Raman active op-tical modes [39]. Because of the change in symmetry fromβ-Sn to γ -Sn, a sharp disappearance of Raman modes isobserved in experiments. Figure 3(a) shows the presenceof the two allowed Raman modes and their clear and dis-tinct disappearance as the phase boundary between β-Sn and
184112-2
RESPONSE OF THE MODE GRÜNEISEN PARAMETERS … PHYSICAL REVIEW B 102, 184112 (2020)
-200 -150 -100 -50 0 50 100 150 200
589K
-Sn to liquid-Sn Raman
).u.a( ytisnetnI dezilamro
N
-200 -150 -100 -50 0 50 100 150 200
-Sn to -Sn (bct) Raman
544K
).u.a( ytisnetnI dezilamro
N
Wavenumber (cm-1)
Wavenumber (cm-1)
(a)
(b)
FIG. 3. Raman stack plots of Sn as a function of temperatureunder high pressure; ambient temperature up to the phase boundaryat the listed temperature and then back to ambient. (a) As the β-Sn toγ -Sn line is crossed, a sharp disappearance in peaks is observed, withreappearance with decreasing temperature. Pressure ranges from 4.1to 5.4 GPa throughout the heating and cooling process. (b) Ramanmodes broaden and decrease in intensity as the β-Sn melt line isapproached. Pressure ranges from 2.1 to 3.4 GPa.
γ -Sn is traversed. This disappearance indicates that the phasefraction of β-Sn to γ -Sn has dropped below a detectable levelfor Raman scattering. We are unable to precisely map theconfirmed phase coexistence from 10.8 to 15.7 GPa [9].
Approaching the β-Sn melt line, a broadening of Ramanmodes is observed, with the B1g mode broadening more withtemperature than the Eg mode. The relationship of the fullwidth at half maximum intensity with temperature is fittedwith a linear regression with a value of 0.007 for the Eg
mode and 0.036 for the B1g mode. Unlike the transition fromβ-Sn to γ -Sn, there is no sharp, discontinuous loss of Ramanmodes due to symmetry, but rather a progression towardsa seemingly featureless Raman spectrum. In Fig. 3(b), we
observe a decrease in intensity of the two Raman modes ofβ-Sn as the melt line is approached. The relative intensityI/I0 approaches but does not reach zero within error as thetemperature increases toward the melt line. The broadening ofpeaks and decrease in intensity can be attributed to a loss ofcrystallinity during melting.
In Fig. 1, we compare our work to several previous studiesand find agreement with literature trends and values. Thereported triple point is considered at 583 K and 3.3 GPa[12,17,40], which is within our region of stability as deter-mined by the thermocouple. Our melt transition data alignwith literature values [16,18], and we measure the stability re-gion for β-Sn near the transition to γ -Sn extending to 11 GPaat 300 K. The Hugoniot compression and data points from[15] fall on our upper boundary of the stability region of β-Snaround 7–9 GPa, while the resistivity work of [17] lies on ourlower boundary of the stability region from about 3 to 7 GPa.These upper and lower boundaries of stability do not includea mapping of the phase coexistence boundary with γ -Sn.
Temperatures obtained through Raman thermometry arecompared to thermocouple temperatures in Appendix B (seeFig. 9). We find that the use of an independent, nonmetallictemperature marker improves the uncertainties of individualdata points. The proper application of an optical transfer func-tion (OTF) prevents dramatic systematic underestimationsupwards of 22%. After applying an OTF to the system, thevalues obtained for temperature using Raman thermometrywere systematically higher than the thermocouple values by3%-10%. Although fair temperature stability was achieved bydecreasing conductivity between the seats and the diamonds,some temperature gradient across the sample chamber likelystill exists. Since the thermocouple measurements align wellwith accepted literature values for the phase diagram, particu-larly around the triple point, we rely on these data to establishthe phase stability region. We include this and further discus-sion in Appendix B to highlight the challenges and limitationscommon to Raman thermometry under extreme conditions.
B. Mode Grüneisen analysis
The mode Grüneisen parameters connect the microscopiclattice vibrations of a material to its macroscopic thermody-namic properties. The mode Grüneisen parameter γi relatesthe response of a spectroscopically observable frequencyωi of the ith phonon mode to a change in volume of thematerial [41]:
γi(�q) = −(
∂ ln ωi(�q)
∂ ln V
)T
. (1)
This is more conveniently defined for optical measurementslike Raman scattering with excitation wavelengths in the visi-ble in the long-wavelength ( �q → 0) limit as [42,43]
ωi/ωi0 = [V/V0]−γi , (2)
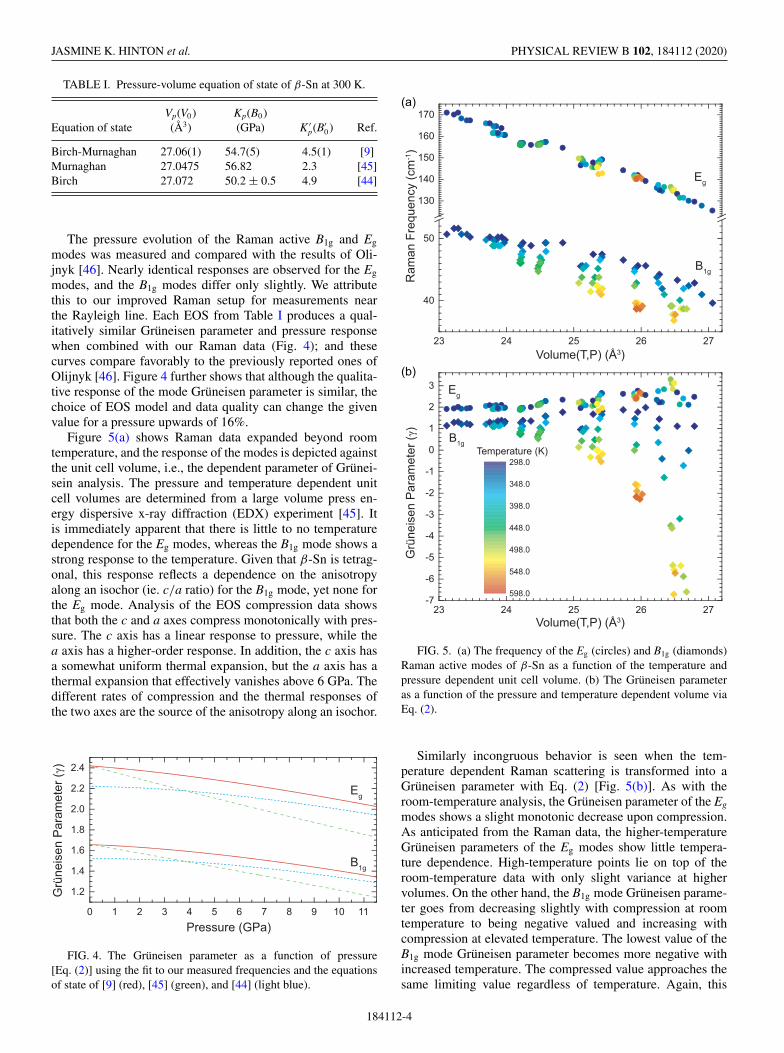
where ωi0 and V0 are the phonon frequency and volume ofthe material at a reference state of the material, typicallyambient conditions. Equation of state (EOS) analysis canprovide the critical volumetric data for Grüneisen analysis,and several EOSs (Table I) have been determined for theroom-temperature compression of β-Sn [9,44,45].
184112-3
JASMINE K. HINTON et al. PHYSICAL REVIEW B 102, 184112 (2020)
TABLE I. Pressure-volume equation of state of β-Sn at 300 K.
Vp(V0) Kp(B0)Equation of state (Å3) (GPa) K ′
p(B′0) Ref.
Birch-Murnaghan 27.06(1) 54.7(5) 4.5(1) [9]Murnaghan 27.0475 56.82 2.3 [45]Birch 27.072 50.2 ± 0.5 4.9 [44]
The pressure evolution of the Raman active B1g and Eg
modes was measured and compared with the results of Oli-jnyk [46]. Nearly identical responses are observed for the Eg
modes, and the B1g modes differ only slightly. We attributethis to our improved Raman setup for measurements nearthe Rayleigh line. Each EOS from Table I produces a qual-itatively similar Grüneisen parameter and pressure responsewhen combined with our Raman data (Fig. 4); and thesecurves compare favorably to the previously reported ones ofOlijnyk [46]. Figure 4 further shows that although the qualita-tive response of the mode Grüneisen parameter is similar, thechoice of EOS model and data quality can change the givenvalue for a pressure upwards of 16%.
Figure 5(a) shows Raman data expanded beyond roomtemperature, and the response of the modes is depicted againstthe unit cell volume, i.e., the dependent parameter of Grünei-sein analysis. The pressure and temperature dependent unitcell volumes are determined from a large volume press en-ergy dispersive x-ray diffraction (EDX) experiment [45]. Itis immediately apparent that there is little to no temperaturedependence for the Eg modes, whereas the B1g mode shows astrong response to the temperature. Given that β-Sn is tetrag-onal, this response reflects a dependence on the anisotropyalong an isochor (ie. c/a ratio) for the B1g mode, yet none forthe Eg mode. Analysis of the EOS compression data showsthat both the c and a axes compress monotonically with pres-sure. The c axis has a linear response to pressure, while thea axis has a higher-order response. In addition, the c axis hasa somewhat uniform thermal expansion, but the a axis has athermal expansion that effectively vanishes above 6 GPa. Thedifferent rates of compression and the thermal responses ofthe two axes are the source of the anisotropy along an isochor.
0 1 2 3 4 5 6 7 8 9 10 11
1.2
1.4
1.6
1.8
2.0
2.2
2.4
rG
ü( rete
maraP nesien
)
Pressure (GPa)
Eg
B1g
FIG. 4. The Grüneisen parameter as a function of pressure[Eq. (2)] using the fit to our measured frequencies and the equationsof state of [9] (red), [45] (green), and [44] (light blue).
23 24 25 26 27
40
50
130
140
150
160
170
B1g
Eg
mc( ycneuqerF nama
R1-)
Volume(T,P) (Å3)
23 24 25 26 27-7
-6
-5
-4
-3
-2
-1
0
1
2
3
Temperature (K)
rG
ü( rete
maraP nesien
)
Volume(T,P) (Å3)
298.0
348.0
398.0
448.0
498.0
548.0
598.0
Eg
B1g
(a)
(b)
FIG. 5. (a) The frequency of the Eg (circles) and B1g (diamonds)Raman active modes of β-Sn as a function of the temperature andpressure dependent unit cell volume. (b) The Grüneisen parameteras a function of the pressure and temperature dependent volume viaEq. (2).
Similarly incongruous behavior is seen when the tem-perature dependent Raman scattering is transformed into aGrüneisen parameter with Eq. (2) [Fig. 5(b)]. As with theroom-temperature analysis, the Grüneisen parameter of the Eg
modes shows a slight monotonic decrease upon compression.As anticipated from the Raman data, the higher-temperatureGrüneisen parameters of the Eg modes show little tempera-ture dependence. High-temperature points lie on top of theroom-temperature data with only slight variance at highervolumes. On the other hand, the B1g mode Grüneisen parame-ter goes from decreasing slightly with compression at roomtemperature to being negative valued and increasing withcompression at elevated temperature. The lowest value of theB1g mode Grüneisen parameter becomes more negative withincreased temperature. The compressed value approaches thesame limiting value regardless of temperature. Again, this
184112-4
RESPONSE OF THE MODE GRÜNEISEN PARAMETERS … PHYSICAL REVIEW B 102, 184112 (2020)
-8
-6
-4
-2
0
2
4
6
8
300 325 350 375 400 425 450 475 500 525 550
-8
-4
0
4
8
12
16
Temperature (K)
rG
ü( rete
maraP rosneT nesien
i)
B1g 1
3
Eg 1
3
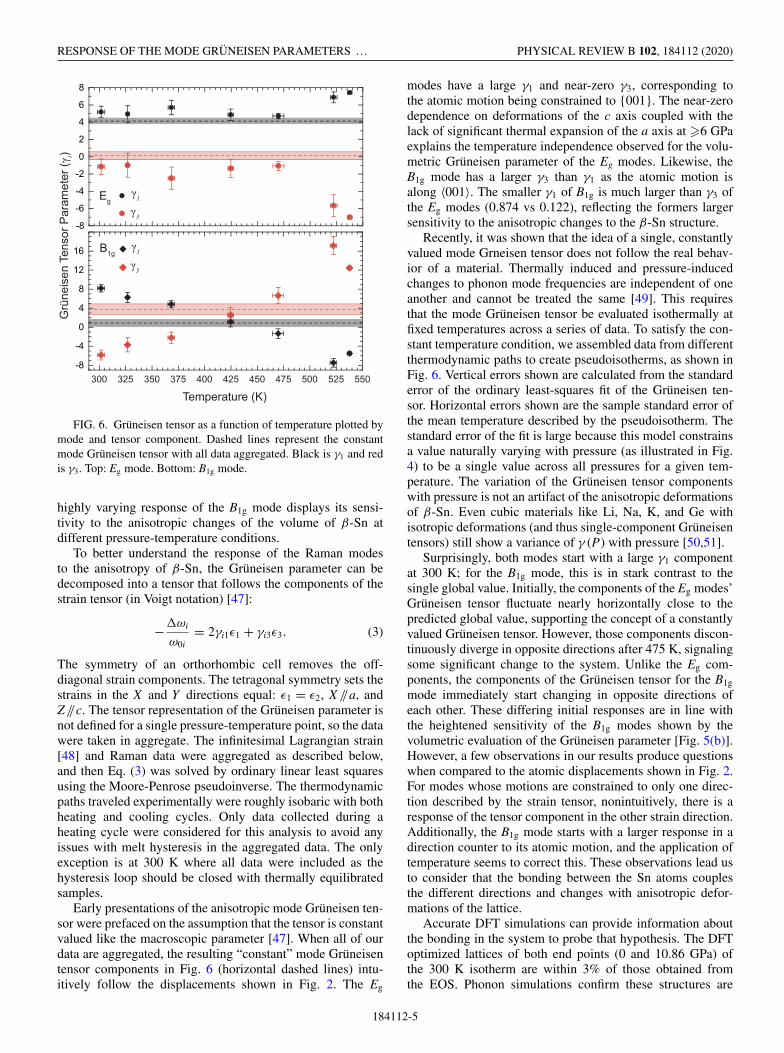
FIG. 6. Grüneisen tensor as a function of temperature plotted bymode and tensor component. Dashed lines represent the constantmode Grüneisen tensor with all data aggregated. Black is γ1 and redis γ3. Top: Eg mode. Bottom: B1g mode.
highly varying response of the B1g mode displays its sensi-tivity to the anisotropic changes of the volume of β-Sn atdifferent pressure-temperature conditions.
To better understand the response of the Raman modesto the anisotropy of β-Sn, the Grüneisen parameter can bedecomposed into a tensor that follows the components of thestrain tensor (in Voigt notation) [47]:
−ωi
ω0i= 2γi1ε1 + γi3ε3. (3)
The symmetry of an orthorhombic cell removes the off-diagonal strain components. The tetragonal symmetry sets thestrains in the X and Y directions equal: ε1 = ε2, X //a, andZ//c. The tensor representation of the Grüneisen parameter isnot defined for a single pressure-temperature point, so the datawere taken in aggregate. The infinitesimal Lagrangian strain[48] and Raman data were aggregated as described below,and then Eq. (3) was solved by ordinary linear least squaresusing the Moore-Penrose pseudoinverse. The thermodynamicpaths traveled experimentally were roughly isobaric with bothheating and cooling cycles. Only data collected during aheating cycle were considered for this analysis to avoid anyissues with melt hysteresis in the aggregated data. The onlyexception is at 300 K where all data were included as thehysteresis loop should be closed with thermally equilibratedsamples.
Early presentations of the anisotropic mode Grüneisen ten-sor were prefaced on the assumption that the tensor is constantvalued like the macroscopic parameter [47]. When all of ourdata are aggregated, the resulting “constant” mode Grüneisentensor components in Fig. 6 (horizontal dashed lines) intu-itively follow the displacements shown in Fig. 2. The Eg
modes have a large γ1 and near-zero γ3, corresponding tothe atomic motion being constrained to {001}. The near-zerodependence on deformations of the c axis coupled with thelack of significant thermal expansion of the a axis at �6 GPaexplains the temperature independence observed for the volu-metric Grüneisen parameter of the Eg modes. Likewise, theB1g mode has a larger γ3 than γ1 as the atomic motion isalong 〈001〉. The smaller γ1 of B1g is much larger than γ3 ofthe Eg modes (0.874 vs 0.122), reflecting the formers largersensitivity to the anisotropic changes to the β-Sn structure.
Recently, it was shown that the idea of a single, constantlyvalued mode Grneisen tensor does not follow the real behav-ior of a material. Thermally induced and pressure-inducedchanges to phonon mode frequencies are independent of oneanother and cannot be treated the same [49]. This requiresthat the mode Grüneisen tensor be evaluated isothermally atfixed temperatures across a series of data. To satisfy the con-stant temperature condition, we assembled data from differentthermodynamic paths to create pseudoisotherms, as shown inFig. 6. Vertical errors shown are calculated from the standarderror of the ordinary least-squares fit of the Grüneisen ten-sor. Horizontal errors shown are the sample standard error ofthe mean temperature described by the pseudoisotherm. Thestandard error of the fit is large because this model constrainsa value naturally varying with pressure (as illustrated in Fig.4) to be a single value across all pressures for a given tem-perature. The variation of the Grüneisen tensor componentswith pressure is not an artifact of the anisotropic deformationsof β-Sn. Even cubic materials like Li, Na, K, and Ge withisotropic deformations (and thus single-component Grüneisentensors) still show a variance of γ (P) with pressure [50,51].
Surprisingly, both modes start with a large γ1 componentat 300 K; for the B1g mode, this is in stark contrast to thesingle global value. Initially, the components of the Eg modes’Grüneisen tensor fluctuate nearly horizontally close to thepredicted global value, supporting the concept of a constantlyvalued Grüneisen tensor. However, those components discon-tinuously diverge in opposite directions after 475 K, signalingsome significant change to the system. Unlike the Eg com-ponents, the components of the Grüneisen tensor for the B1g
mode immediately start changing in opposite directions ofeach other. These differing initial responses are in line withthe heightened sensitivity of the B1g modes shown by thevolumetric evaluation of the Grüneisen parameter [Fig. 5(b)].However, a few observations in our results produce questionswhen compared to the atomic displacements shown in Fig. 2.For modes whose motions are constrained to only one direc-tion described by the strain tensor, nonintuitively, there is aresponse of the tensor component in the other strain direction.Additionally, the B1g mode starts with a larger response in adirection counter to its atomic motion, and the application oftemperature seems to correct this. These observations lead usto consider that the bonding between the Sn atoms couplesthe different directions and changes with anisotropic defor-mations of the lattice.
Accurate DFT simulations can provide information aboutthe bonding in the system to probe that hypothesis. The DFToptimized lattices of both end points (0 and 10.86 GPa) ofthe 300 K isotherm are within 3% of those obtained fromthe EOS. Phonon simulations confirm these structures are
184112-5
JASMINE K. HINTON et al. PHYSICAL REVIEW B 102, 184112 (2020)
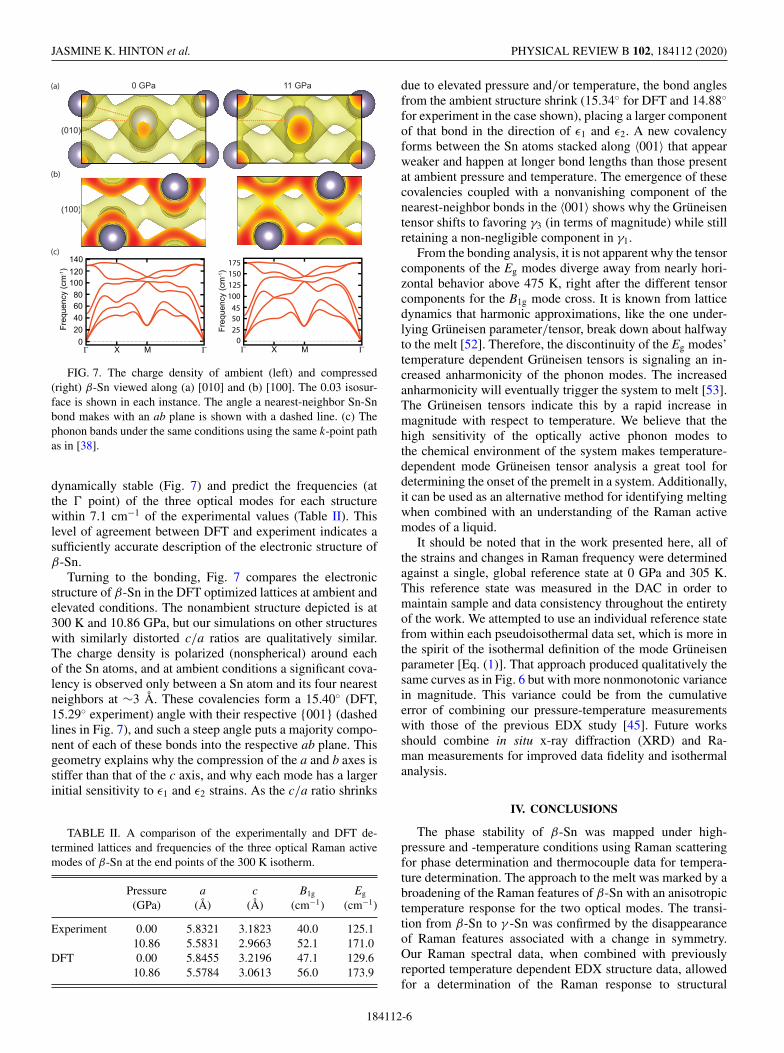
FIG. 7. The charge density of ambient (left) and compressed(right) β-Sn viewed along (a) [010] and (b) [100]. The 0.03 isosur-face is shown in each instance. The angle a nearest-neighbor Sn-Snbond makes with an ab plane is shown with a dashed line. (c) Thephonon bands under the same conditions using the same k-point pathas in [38].
dynamically stable (Fig. 7) and predict the frequencies (atthe � point) of the three optical modes for each structurewithin 7.1 cm−1 of the experimental values (Table II). Thislevel of agreement between DFT and experiment indicates asufficiently accurate description of the electronic structure ofβ-Sn.
Turning to the bonding, Fig. 7 compares the electronicstructure of β-Sn in the DFT optimized lattices at ambient andelevated conditions. The nonambient structure depicted is at300 K and 10.86 GPa, but our simulations on other structureswith similarly distorted c/a ratios are qualitatively similar.The charge density is polarized (nonspherical) around eachof the Sn atoms, and at ambient conditions a significant cova-lency is observed only between a Sn atom and its four nearestneighbors at ∼3 Å. These covalencies form a 15.40◦ (DFT,15.29◦ experiment) angle with their respective {001} (dashedlines in Fig. 7), and such a steep angle puts a majority compo-nent of each of these bonds into the respective ab plane. Thisgeometry explains why the compression of the a and b axes isstiffer than that of the c axis, and why each mode has a largerinitial sensitivity to ε1 and ε2 strains. As the c/a ratio shrinks
TABLE II. A comparison of the experimentally and DFT de-termined lattices and frequencies of the three optical Raman activemodes of β-Sn at the end points of the 300 K isotherm.
Pressure a c B1g Eg
(GPa) (Å) (Å) (cm−1) (cm−1)
Experiment 0.00 5.8321 3.1823 40.0 125.110.86 5.5831 2.9663 52.1 171.0
DFT 0.00 5.8455 3.2196 47.1 129.610.86 5.5784 3.0613 56.0 173.9
due to elevated pressure and/or temperature, the bond anglesfrom the ambient structure shrink (15.34◦ for DFT and 14.88◦for experiment in the case shown), placing a larger componentof that bond in the direction of ε1 and ε2. A new covalencyforms between the Sn atoms stacked along 〈001〉 that appearweaker and happen at longer bond lengths than those presentat ambient pressure and temperature. The emergence of thesecovalencies coupled with a nonvanishing component of thenearest-neighbor bonds in the 〈001〉 shows why the Grüneisentensor shifts to favoring γ3 (in terms of magnitude) while stillretaining a non-negligible component in γ1.
From the bonding analysis, it is not apparent why the tensorcomponents of the Eg modes diverge away from nearly hori-zontal behavior above 475 K, right after the different tensorcomponents for the B1g mode cross. It is known from latticedynamics that harmonic approximations, like the one under-lying Grüneisen parameter/tensor, break down about halfwayto the melt [52]. Therefore, the discontinuity of the Eg modes’temperature dependent Grüneisen tensors is signaling an in-creased anharmonicity of the phonon modes. The increasedanharmonicity will eventually trigger the system to melt [53].The Grüneisen tensors indicate this by a rapid increase inmagnitude with respect to temperature. We believe that thehigh sensitivity of the optically active phonon modes tothe chemical environment of the system makes temperature-dependent mode Grüneisen tensor analysis a great tool fordetermining the onset of the premelt in a system. Additionally,it can be used as an alternative method for identifying meltingwhen combined with an understanding of the Raman activemodes of a liquid.
It should be noted that in the work presented here, all ofthe strains and changes in Raman frequency were determinedagainst a single, global reference state at 0 GPa and 305 K.This reference state was measured in the DAC in order tomaintain sample and data consistency throughout the entiretyof the work. We attempted to use an individual reference statefrom within each pseudoisothermal data set, which is more inthe spirit of the isothermal definition of the mode Grüneisenparameter [Eq. (1)]. That approach produced qualitatively thesame curves as in Fig. 6 but with more nonmonotonic variancein magnitude. This variance could be from the cumulativeerror of combining our pressure-temperature measurementswith those of the previous EDX study [45]. Future worksshould combine in situ x-ray diffraction (XRD) and Ra-man measurements for improved data fidelity and isothermalanalysis.
IV. CONCLUSIONS
The phase stability of β-Sn was mapped under high-pressure and -temperature conditions using Raman scatteringfor phase determination and thermocouple data for tempera-ture determination. The approach to the melt was marked by abroadening of the Raman features of β-Sn with an anisotropictemperature response for the two optical modes. The transi-tion from β-Sn to γ -Sn was confirmed by the disappearanceof Raman features associated with a change in symmetry.Our Raman spectral data, when combined with previouslyreported temperature dependent EDX structure data, allowedfor a determination of the Raman response to structural
184112-6
RESPONSE OF THE MODE GRÜNEISEN PARAMETERS … PHYSICAL REVIEW B 102, 184112 (2020)
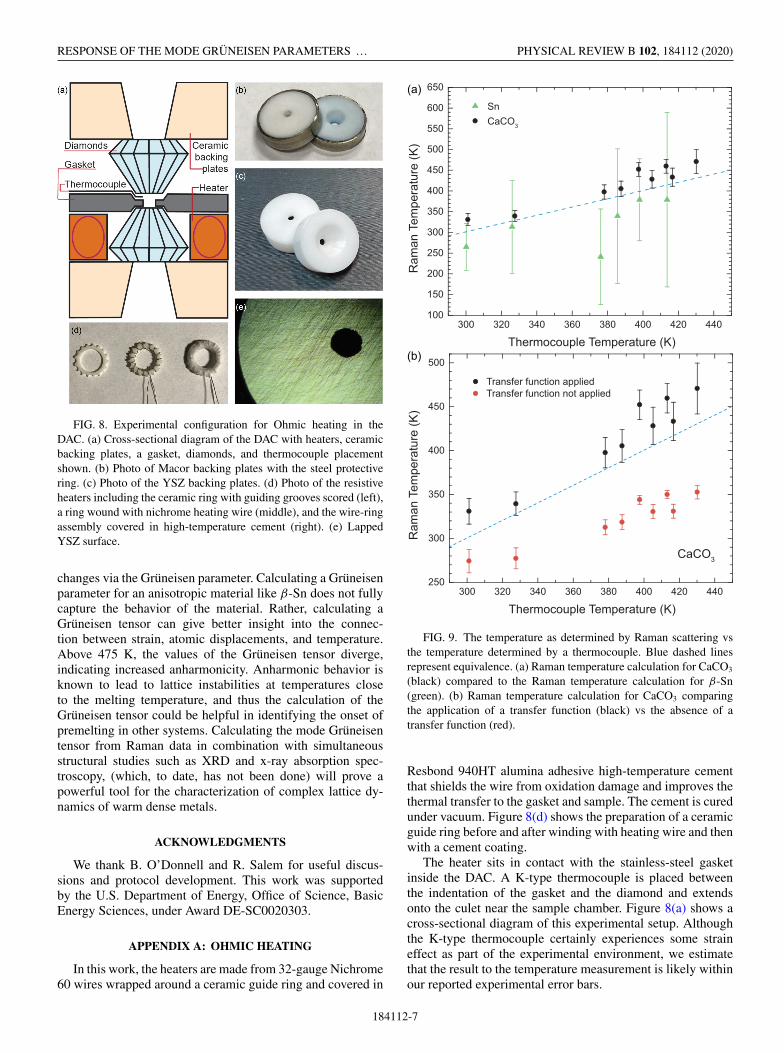
FIG. 8. Experimental configuration for Ohmic heating in theDAC. (a) Cross-sectional diagram of the DAC with heaters, ceramicbacking plates, a gasket, diamonds, and thermocouple placementshown. (b) Photo of Macor backing plates with the steel protectivering. (c) Photo of the YSZ backing plates. (d) Photo of the resistiveheaters including the ceramic ring with guiding grooves scored (left),a ring wound with nichrome heating wire (middle), and the wire-ringassembly covered in high-temperature cement (right). (e) LappedYSZ surface.
changes via the Grüneisen parameter. Calculating a Grüneisenparameter for an anisotropic material like β-Sn does not fullycapture the behavior of the material. Rather, calculating aGrüneisen tensor can give better insight into the connec-tion between strain, atomic displacements, and temperature.Above 475 K, the values of the Grüneisen tensor diverge,indicating increased anharmonicity. Anharmonic behavior isknown to lead to lattice instabilities at temperatures closeto the melting temperature, and thus the calculation of theGrüneisen tensor could be helpful in identifying the onset ofpremelting in other systems. Calculating the mode Grüneisentensor from Raman data in combination with simultaneousstructural studies such as XRD and x-ray absorption spec-troscopy, (which, to date, has not been done) will prove apowerful tool for the characterization of complex lattice dy-namics of warm dense metals.
ACKNOWLEDGMENTS
We thank B. O’Donnell and R. Salem for useful discus-sions and protocol development. This work was supportedby the U.S. Department of Energy, Office of Science, BasicEnergy Sciences, under Award DE-SC0020303.
APPENDIX A: OHMIC HEATING
In this work, the heaters are made from 32-gauge Nichrome60 wires wrapped around a ceramic guide ring and covered in
300 320 340 360 380 400 420 440100
150
200
250
300
350
400
450
500
550
600
650
SnCaCO3
)K( erutarep
meT nama
R
Thermocouple Temperature (K)
300 320 340 360 380 400 420 440250
300
350
400
450
500
CaCO3
Transfer function applied Transfer function not applied
)K( erutarep
meT nama
R
Thermocouple Temperature (K)
(a)
(b)
FIG. 9. The temperature as determined by Raman scattering vsthe temperature determined by a thermocouple. Blue dashed linesrepresent equivalence. (a) Raman temperature calculation for CaCO3
(black) compared to the Raman temperature calculation for β-Sn(green). (b) Raman temperature calculation for CaCO3 comparingthe application of a transfer function (black) vs the absence of atransfer function (red).
Resbond 940HT alumina adhesive high-temperature cementthat shields the wire from oxidation damage and improves thethermal transfer to the gasket and sample. The cement is curedunder vacuum. Figure 8(d) shows the preparation of a ceramicguide ring before and after winding with heating wire and thenwith a cement coating.
The heater sits in contact with the stainless-steel gasketinside the DAC. A K-type thermocouple is placed betweenthe indentation of the gasket and the diamond and extendsonto the culet near the sample chamber. Figure 8(a) shows across-sectional diagram of this experimental setup. Althoughthe K-type thermocouple certainly experiences some straineffect as part of the experimental environment, we estimatethat the result to the temperature measurement is likely withinour reported experimental error bars.
184112-7
JASMINE K. HINTON et al. PHYSICAL REVIEW B 102, 184112 (2020)
Ceramic backing plates, machined in house from Macor,were used in these experiments. The thermal conductivity ofMacor is much less than the commonly used backing platematerial, tungsten carbide: 1.46 W/m K [54] compared to110 W/m K [55], respectively. Using a lower thermally-conducting material as a backing plate works to lower heattransfer to the rest of the DAC and create a smaller, more iso-lated system between the heater, gasket, sample, and diamondin an effort to reach a thermal steady state [56]. Various re-sistive heating methods work to achieve this, including usingone or more heaters of varying sizes, placements, and the useof vacuum chambers [57–59].
The use of thermally insulating ceramic materials as back-ing plates comes at the cost of tensile strength. Macor issusceptible to cracking during the alignment process, a prob-lem easily fixed by machining a protective steel ring for theperimeter of the backing plate [shown in Fig. 8(b)]. While theMacor backing plates survive under loads required for pres-sure between 0 and 12 GPa with 400-μm culets, they do notperform well under the load required for gasket indentations.Using yttria-strengthened zirconia (YSZ) as a backing platematerial overcomes the problems of cracking on alignmentwithout a metal protection ring and surviving higher inden-tation loads. A photo of our machined in-house YSZ backingplates is shown in Fig. 8(c). With a thermal conductivity ofabout 2–3 W/m K [60–62], comparably around a factor of 2higher than Macor, YSZ serves as a thermal insulator in thesame way Macor does; both materials’ thermal conductivi-ties are two orders of magnitude lower than that of tungstencarbide. Standard lapping techniques were used on both ourMacor and YSZ backing plates in an effort to reduce surfaceroughness and improve surface embrittlement [63]; the lappedYSZ surface is shown in Fig. 8(e).
APPENDIX B: RAMAN THERMOMETRY
Temperature can be calculated from the frequencies andratio of intensities of the Stokes vs anti-Stokes shifts of Ramanactive phonon modes [64,65]. From the Boltzmann distribu-tion, the ratio of the intensity of the Stokes (S) and anti-Stokes(AS) shifts for phonon mode (i) is
IS
IAS= (ω0 − ωi )4
(ω0 + ωi )4exp
(h̄ωi
kBT
). (B1)
ω0 and ωi represent the frequency of the Rayleigh line andfrequency of mode i, respectively. kB is Boltzmann’s constant,and h̄ is Planck’s reduced constant [66,67]. The intensitiesreferred to in Eq. (B1) are measured in power (irradiance),which can be obtained from the CCD through a proper OTFconverting photon counting to energy intensity. Without anOTF and considering only photon counts, the expressionwould be the same but with the prefactor raised to the third
power rather than the fourth [68]. The Boltzmann occupationincreases for a mode with increased temperature, leading toIS/IAS approaching the limit of 1 as temperature goes to infin-ity. Due to the exponential dependence of IS/IAS on the modefrequency ωi, the uncertainty in Eq. (B1) will approach unityfaster for modes with low frequencies. Sn has Raman modesbelow 200 cm−1 which, because of the higher uncertainties,makes it a poor temperature marker. Additionally, since γ -Snis not Raman active, it could not be used to calculate temper-ature beyond the transition to this phase.
To overcome this, a nonmetallic sample with a muchgreater Raman matrix element and a resulting larger scatter-ing cross section can be used as an independent temperaturemarker. CaCO3 fulfills this role with several intense modeswell spaced in frequency, helping to maximize the sensitiv-ity across the temperature range. Calcite and aragonite, twophases of CaCO3 between 0 and 12 GPa, have extremelysimilar Raman spectra with modes at similar frequenciesand intensities [69]. For this experiment three modes wereused: two between 0-300 cm−1, and one close to 1100 cm−1.These modes were chosen for their frequency, spacing, andfor their continued prominence throughout the experiment.Although prominent modes exist above 1100 cm−1, this wasa convenient wave number window to use experimentally inorder to avoid the first-order Raman phonon line of diamond.Additionally, such high-energy anti-Stokes peaks would notbe prominent enough to be useful until significantly highertemperature. Figure 9(a) compares the weighted average ofthe mode temperature calculation for Sn vs CaCO3; larger un-certainties are present for Sn than for CaCO3, illustrating thisinherent issue. Data were collected successively for Sn andCaCO3, hence the slight offset in temperature between them.
The basic error propagation used to calculate error bars inFig. 9 revealed the uncertainties holding the highest weightwere the intensities of the Stokes and anti-Stokes modes. Inorder to obtain meaningful absolute intensities, it is critical toperform an OTF to account for the quantum efficiency acrossthe CCD detector as well as the response of the entire opticalsystem. A NIST traceable tungsten bulb purchased from Orielwas used for the OTF in these experiments. Figure 9(b) showsthe results of the comparison between a selection of CaCO3
data with the application of an OTF and the same data setwithout the application of an OTF.
We emphasize that the use of an OTF is critical whenusing absolute intensities in cascading calculations. Since theOTF defines an efficiency offset for individual pixels acrossthe detector, neglecting it will produce a nonsystematic erroracross the spectra and, by extension, the temperature calcula-tion. Comparison of data at two temperatures from the samepixel does not negate the need for an OTF since this will notcorrectly assess the intensity and will produce an error in thetemperature calculation for that pixel [64].
[1] G. Aquilanti, A. Trapananti, A. Karandikar, I. Kantor, C.Marini, O. Mathon, S. Pascarelli, R. Boehler, and E. Tosatti,Proc. Natl. Acad. Sci. USA 112, 12042 (2015).
[2] Y. Ping, F. Coppari, D. G. Hicks, B. Yaakobi, D. E.Fratanduono, S. Hamel, J. H. Eggert, J. R. Rygg, R. F. Smith,
D. C. Swift, D. G. Braun, T. R. Boehly, and G. W. Collins, Phys.Rev. Lett. 111, 065501 (2013).
[3] J. W. E. Drewitt, F. Turci, B. J. Heinen, S. G. Macleod, F. Qin,A. K. Kleppe, and O. T. Lord, Phys. Rev. Lett. 124, 145501(2020).
184112-8
RESPONSE OF THE MODE GRÜNEISEN PARAMETERS … PHYSICAL REVIEW B 102, 184112 (2020)
[4] M. Frost, J. B. Kim, E. E. McBride, J. R. Peterson, J. S. Smith,P. Sun, and S. H. Glenzer, Phys. Rev. Lett. 123, 065701 (2019).
[5] R. Briggs, F. Coppari, M. G. Gorman, R. F. Smith, S. J.Tracy, A. L. Coleman, A. Fernandez-Pañella, M. Millot, J. H.Eggert, and D. E. Fratanduono, Phys. Rev. Lett. 123, 045701(2019).
[6] F. Iesari, A. Trapananti, M. Minicucci, A. Filipponi, and A.Di Cicco, Nucl. Instrum. Methods Phys. Res., Sect. B 411, 68(2017).
[7] S. I. Simak, U. Häussermann, R. Ahuja, S. Lidin, and B.Johansson, Phys. Rev. Lett. 85, 142 (2000).
[8] N. E. Christensen and M. Methfessel, Phys. Rev. B 48, 5797(1993).
[9] A. Salamat, R. Briggs, P. Bouvier, S. Petitgirard, A. Dewaele,M. E. Cutler, F. Corà, D. Daisenberger, G. Garbarino, and P. F.McMillan, Phys. Rev. B 88, 104104 (2013).
[10] A. Salamat, G. Garbarino, A. Dewaele, P. Bouvier, S.Petitgirard, C. J. Pickard, P. F. McMillan, and M. Mezouar,Phys. Rev. B 84, 140104 (2011).
[11] A. Lazicki, J. R. Rygg, F. Coppari, R. Smith, D. Fratanduono,R. G. Kraus, G. W. Collins, R. Briggs, D. G. Braun, D. C. Swift,and J. H. Eggert, Phys. Rev. Lett. 115, 075502 (2015).
[12] R. Briggs, D. Daisenberger, O. T. Lord, A. Salamat, E. Bailey,M. J. Walter, and P. F. McMillan, Phys. Rev. B 95, 054102(2017).
[13] R. Briggs, M. G. Gorman, S. Zhang, D. McGonegle, A. L.Coleman, F. Coppari, M. A. Morales-Silva, R. F. Smith, J. K.Wicks, C. A. Bolme, A. E. Gleason, E. Cunningham, H. J. Lee,B. Nagler, M. I. McMahon, J. H. Eggert, and D. E. Fratanduono,Appl. Phys. Lett. 115, 264101 (2019).
[14] B. La Lone, P. Asimow, O. Fat’yanov, R. Hixson, G. Stevens,W. Turley, and L. Veeser, J. Appl. Phys. 126, 225103 (2019).
[15] R. Briggs, R. Torchio, A. Sollier, F. Occelli, L. Videau, N.Kretzschmar, and M. Wulff, J. Synchrotron Radiat. 26, 96(2019).
[16] L. Xu, Y. Bi, X. Li, Y. Wang, X. Cao, L. Cai, Z. Wang, and C.Meng, J. Appl. Phys. 115, 164903 (2014).
[17] J. D. Barnett, R. B. Bennion, and H. T. Hall, Science 141, 1041(1963).
[18] E. Y. Tonkov and E. G. Ponyatovsky, Phase Transformations ofElements Under High Pressure (CRC Press, Boca Raton, 2004),pp. 116–121.
[19] Y. S. Ponosov and S. V. Streltsov, Phys. Rev. B 86, 045138(2012).
[20] R. Carles, M. Bayle, P. Benzo, G. Benassayag, C. Bonafos, G.Cacciato, and V. Privitera, Phys. Rev. B 92, 174302 (2015).
[21] T. G. Pedersen, P. Modak, K. Pedersen, N. E. Christensen,M. M. Kjeldsen, and A. N. Larsen, J. Phys.: Condens. Matter21, 115502 (2009).
[22] A. Svane and E. Antoncik, Solid State Commun. 58, 541(1986).
[23] N. Christensen, Solid State Commun. 85, 151 (1993).[24] M. Cazzaniga, L. Caramella, N. Manini, and G. Onida, Phys.
Rev. B 82, 035104 (2010).[25] G. V. Hartland, Chem. Rev. 111, 3858 (2011).[26] SrB4O7 : Sm2+ was provided by Dan Frost at the University of
Bayreuth.[27] L.-G. Liu and W. A. Bassett, J. Geophys. Res. 80, 3777
(1975).
[28] S. V. Rashchenko, A. Kurnosov, L. Dubrovinsky, and K. D.Litasov, J. Appl. Phys. 117, 145902 (2015).
[29] Q. Jing, Q. Wu, L. Liu, J. A. Xu, Y. Bi, Y. Liu, H. Chen, S.Liu, Y. Zhang, L. Xiong, Y. Li, and J. Liu, J. Appl. Phys. 113,023507 (2013).
[30] P. Hohenberg and W. Kohn, Phys. Rev. 136, B864 (1964).[31] W. Kohn and L. J. Sham, Phys. Rev. 140, A1133 (1965).[32] J. Sun, A. Ruzsinszky, and J. P. Perdew, Phys. Rev. Lett. 115,
036402 (2015).[33] J. P. Perdew, K. Burke, and M. Ernzerhof, Phys. Rev. Lett. 77,
3865 (1996).[34] P. E. Blöchl, Phys. Rev. B 50, 17953 (1994).[35] H. J. Monkhorst and J. D. Pack, Phys. Rev. B 13, 5188 (1976).[36] M. Methfessel and A. T. Paxton, Phys. Rev. B 40, 3616 (1989).[37] A. Togo and I. Tanaka, Scr. Mater. 108, 1 (2015).[38] S.-H. Na, J. Korean Phys. Soc. 56, 494 (2010).[39] E. Kroumova, M. L. Aroyo, J. M. Perez-Mato, A. Kirov, C.
Capillas, S. Ivantchev, and H. Wondratschek, Phase Transitions76, 155 (2003).
[40] J. D. Dudley and H. T. Hall, Phys. Rev. 118, 1211 (1960).[41] F. D. Stacey and J. H. Hodgkinson, Phys. Earth Planet. Inter.
286, 42 (2019).[42] B. Weinstein and R. Zallen, Light Scattering in Solids, edited by
M. Cardona and G. Guntherodt (Springer, Berlin, 1984), Vol. 4.[43] J. E. Proctor, E. Gregoryanz, K. S. Novoselov, M. Lotya, J. N.
Coleman, and M. P. Halsall, Phys. Rev. B 80, 073408 (2009).[44] M. Liu and L.-g. Liu, High Temp. High Press. 18, 79 (1986).[45] M. E. Cavaleri, T. G. Plymate, and J. H. Stout, J. Phys. Chem.
Solids 49, 945 (1988).[46] H. Olijnyk, Phys. Rev. B 46, 6589 (1992).[47] R. J. Angel, M. Murri, B. Mihailova, and M. Alvaro, Z.
Kristallogr. - Cryst. Mater. 234, 129 (2019).[48] J. L. Schlenker, G. V. Gibbs, and M. B. Boisen Jr., Acta
Crystallogr., Sect. A 34, 52 (1978).[49] C. Stangarone, R. J. Angel, M. Prencipe, N. Campomenosi, B.
Mihailova, and M. Alvaro, Eur. J. Mineral. 31, 685 (2019).[50] R. Boehler, Phys. Rev. B 27, 6754 (1983).[51] B. K. Pande, A. K. Pandey, and C. K. Singh, in DAE Solid State
Physics Symposium 2017, AIP Conf. Proc. No. 1942 (AIP, NewYork, 2018), p. 120004.
[52] J. D. Gale, J. Phys. Chem. B 102, 5423 (1998).[53] Y. Ida, Phys. Rev. 187, 951 (1969).[54] Corning, “Macor machinable glass”, https://www.corning.com/
media/worldwide/csm/documents/71759a443535431395eb34ebead091cb.pdf.
[55] K. Liu, X. P. Li, M. Rahman, and X. D. Liu, Wear 255, 1344(2003).
[56] K. Yamamoto, S. Endo, A. Yamagishi, H. Mikami, H. Hori, andM. Date, Rev. Sci. Instrum. 62, 2988 (1991).
[57] N. Dubrovinskaia and L. Dubrovinsky, Rev. Sci. Instrum. 74,3433 (2003).
[58] Z. Jenei, H. Cynn, K. Visbeck, and W. J. Evans, Rev. Sci.Instrum. 84, 095114 (2013).
[59] M. Santoro, A. Hajeb, and F. A. Gorelli, High Pressure Res. 40,379 (2020).
[60] T. Shimonosono, T. Ueno, and Y. Hirata, J. Asian Ceram. Soc.7, 20 (2019).
[61] K. W. Schlichting, N. P. Padture, and P. G. Klemens, J. Mater.Sci. 36, 3003 (2001).
184112-9

JASMINE K. HINTON et al. PHYSICAL REVIEW B 102, 184112 (2020)
[62] MSESupplies, “ Description for yttrium stabilizedzirconium oxide grinding/milling media”, https://www.msesupplies.com/products/12-7-mm-cylindrical-premium-yttria-stabilized-zirconia-ysz-milling-media?_vsrefdom=adwords&gclid=EAIaIQobChMIn&variant=23685768904762.
[63] C. J. Evans, P. D. Dornfeld, D. Lucca, G. Byrne, M. Tricard,F. Klocke, O. Dambon, and B. A. Mullany, CIRP Ann. 52, 611(2003).
[64] M. Peña-Alvarez, P. Dalladay-Simpson, X. D. Liu, V. Afonina,H. C. Zhang, R. T. Howie, and E. Gregoryanz, J. Appl. Phys.125, 025901 (2018).
[65] M. Oron-Carl and R. Krupke, Phys. Rev. Lett. 100, 127401(2008).
[66] D. A. Long, Raman Spectroscopy (McGraw-Hill, New York,1977).
[67] D. A. Long, The Raman Effect: A Unified Treatment of theTheory of Raman Scattering by Molecules (Wiley, New York,2002), Vol. 8, pp. 116–120.
[68] J. J. Gallardo, J. Navas, D. Zorrilla, R. Alcantara, D. Valor, C.Fernandez-Lorenzo, and J. Martin-Calleja, Appl. Spectrosc. 70,1128 (2016).
[69] P. Gillet, C. Biellmann, B. Reynard, and P. McMillan, Phys.Chem. Miner. 20, 1 (1993).
184112-10


![Carta à senhora Cristina de Lorena, Grã-Duquesa Mãe de Toscana [1615]](https://static.fdocuments.net/doc/165x107/55721243497959fc0b905409/carta-a-senhora-cristina-de-lorena-gra-duquesa-mae-de-toscana-1615.jpg)


