Resources, Conservation and Recycling...supply chain management is “integrating environmental...
44
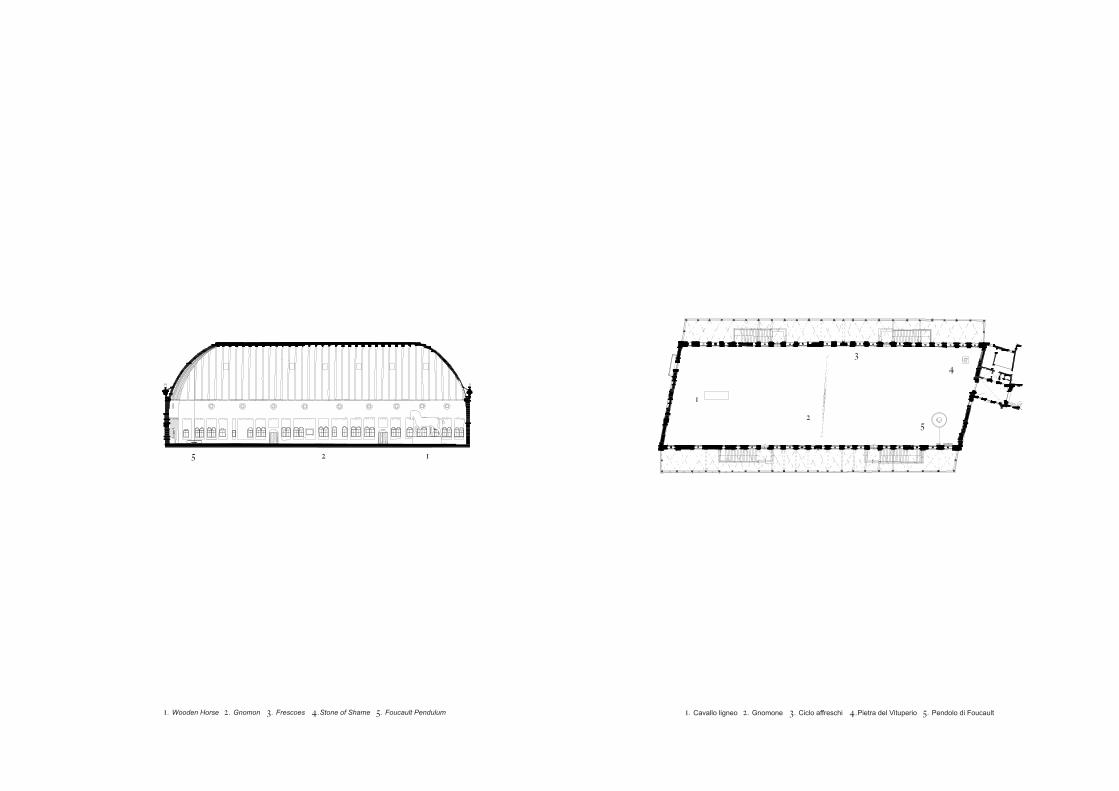
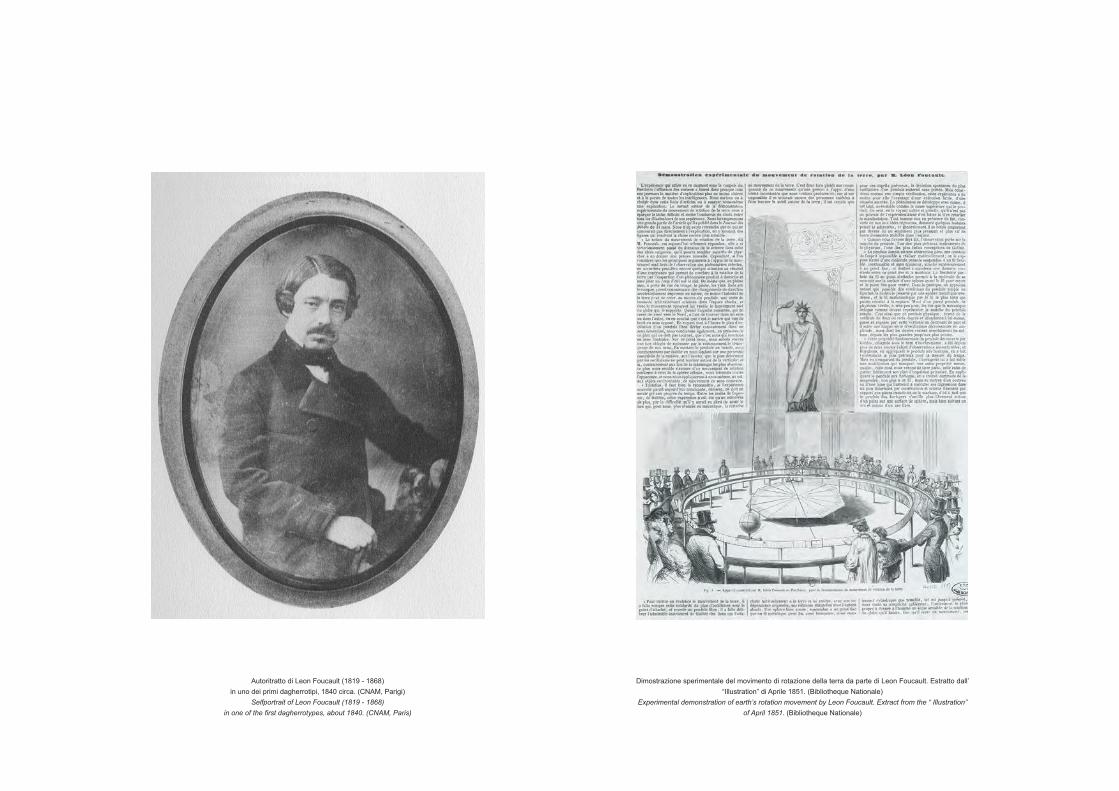
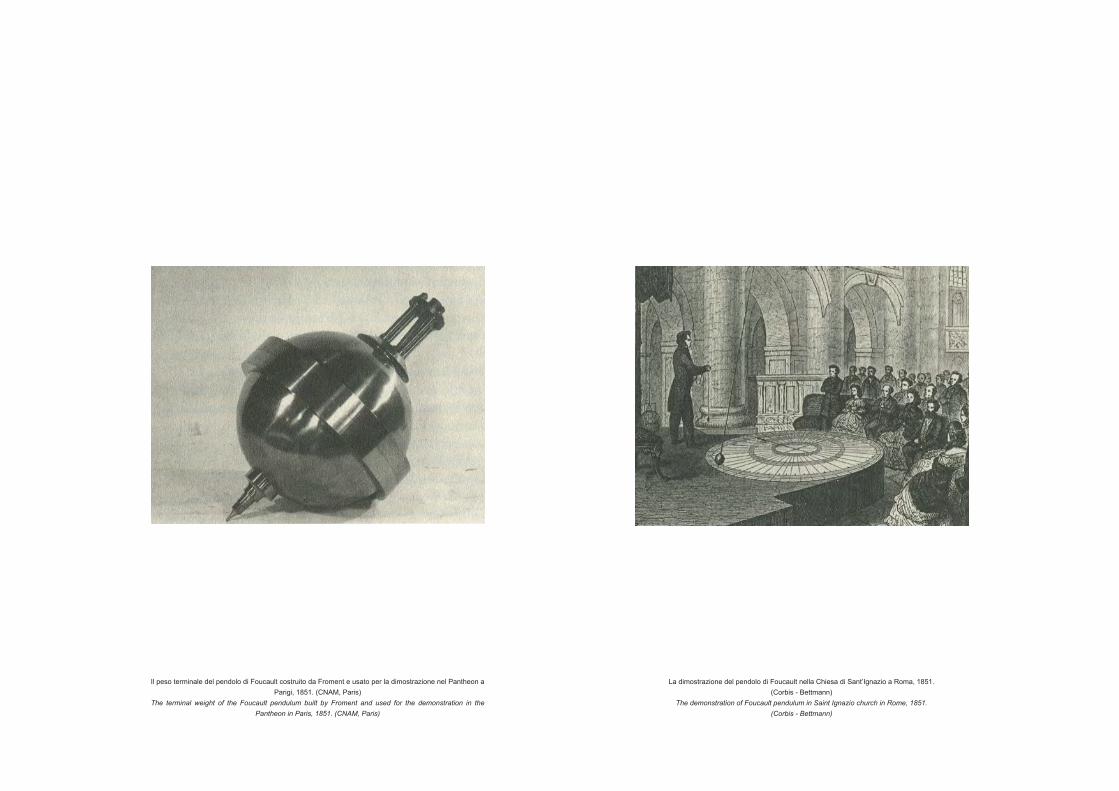
comune di padova Il Pendolo di Foucault a Palazzo della Ragione The Foucault Pendulum in the “Salone”
Transcript of Resources, Conservation and Recycling...supply chain management is “integrating environmental...

F
Si
Da
b
a
ARRAA
KSAESpI
1
attafsaW
h0
Resources, Conservation and Recycling 128 (2018) 284–305
Contents lists available at ScienceDirect
Resources, Conservation and Recycling
jo u r n al homep age: www.elsev ier .com/ locate / resconrec
ull length article
ustainable supply chain management practices in Indian automotivendustry: A multi-stakeholder view
eepak Mathivathanana,b, Devika Kannana,∗, A. Noorul Haqb
Center for Engineering Operations Management, Department of Technology and Innovation, University of Southern Denmark, Odense M , DenmarkDepartment of Production Engineering, National Institute of Technology, Tiruchirappalli, India
r t i c l e i n f o
rticle history:eceived 28 June 2016eceived in revised form 5 January 2017ccepted 5 January 2017vailable online 24 February 2017
eywords:ustainable supply chain managementutomotive industriesmerging economiesustainable supply chain managementractices
nter influences
a b s t r a c t
As one of the largest manufacturing sectors, the automotive industry has a deep impact on the society andenvironment. Automotive products provide mobility to millions and create jobs, but also threaten theenvironment. Consumer pressure, government regulations, and stakeholder demands for a competitiveedge have forced the automotive industry to consider their environmental and social impacts in addi-tion to their economic status. These pressures have led many automotive industry businesses to adoptSustainable Supply Chain Management (SSCM) practices. Specific practices that are adopted into the tra-ditional supply chain and that help an industry shift towards a sustainable supply chain are called SSCMpractices. Firms have difficulty identifying the most useful practices and learning how these practicesimpact each other. Unfortunately, no existing research has studied the interrelated influences amongthese practices in the automotive industry, nor from an Indian perspective. The current study aims togive a better understanding of the interrelated influences among SSCM practices with a particular lookat the automotive industry. Our research presents views from multiple stakeholders, including manage-rial, environmental, societal, and governmental associations. We propose a framework model, using theDecision Making Trial and Evaluation Laboratory method, to evaluate automotive industry SSCM prac-tices specifically situated in the emerging economy of India. Through a questionnaire survey with theabove-mentioned stakeholders, we find interinfluences and the prominence of the identified practices. Aprominence causal relationship diagram is obtained depicting the cause groups and the effect groups ofthe practices. The differences and similarities between individual perspectives and combined stakeholder
perspectives are identified. The results reveal that management commitment towards sustainability andincorporating the triple bottom line approach in strategic decision making are the most influential prac-tices for implementing the sustainable supply chain management. This study provides a foundation forindustrial managers to understand the inter influences among the practices and increases the probabilityof successful implementation of SSCM practices within the automotive industry.© 2017 Elsevier B.V. All rights reserved.
. Introduction
The automotive industry plays a key role in the day to dayctivity of human life, not only by providing mobility but also byhe enormous impact of the industry on economic, environmen-al, and social activities throughout the globe (Xia et al., 2015). Asrguably the largest manufacturing sector worldwide, the industryaces high profile environmental challenges; they are held respon-
ible for deteriorating air quality, contributing to global warming,nd for ineffectively handling end of life automobiles (Orsato andells, 2007). These environmental challenges and governmen-∗ Corresponding author (Authorship listing follows an alphabetical order).E-mail address: [email protected] (D. Kannan).
ttp://dx.doi.org/10.1016/j.resconrec.2017.01.003921-3449/© 2017 Elsevier B.V. All rights reserved.
tal globalization policies have forced many automotive firms toshift towards using specific practices to help incorporate sustain-ability (Govindan et al., 2015a; Zhu et al., 2007). These practices,termed SSCM practices (Jayaraman et al., 2007; Linton et al., 2007;Carter and Rogers, 2008), help to reverse the well-known adverseeffects of the industry, and the use of environmentally-friendly andsocially beneficial practices may help to improve the profitabilityof the business. According to a report by the World Commissionon Environment and Development (WCED) by Brundtland (1987),sustainability is defined as “development that meets the needs ofthe present without compromising the ability of future generations
to meet their own needs.” Sustainability creates balance betweenthe economic, social, and environmental aims of organizations(Székely and Knirsch, 2005). Evidence indicates that to achievesustainable performance, some practices in the traditional sup-
servation and Recycling 128 (2018) 284–305 285
paSwi2
tR2taeIppfImitfitsagott(bttiaiPapftaOtoiih((cntaftta
pfitnptt
Identification of existing SSCM practices through literature survey
Questionnaire to identify the prominence and inter influences of SSCM practices
Management Perspective
SocietalPerspective
Government Perspective
Applying DEMATEL Method to the analyze SSCM practices on three different perspectives and combined perspectives
Comparison of results obtained on three different perspectives and combined perspectives
Conclusion on prominent SSCM practices and the relationship among the SSCM practices in the Indian automotive industries
D. Mathivathanan et al. / Resources, Con
ly chain must be incorporated (Govindan et al., 2016d; Gimeneznd Tachizawa, 2012; Taticchi et al., 2013). Thus, the benefits ofSCM practices are well understood, but the challenges associatedith their implementation and understandings are not as clearly
dentified especially in developing nations such as India (Epstein,008).
Since inception, the automotive industry has been a major con-ributor to the Indian economy. The AMP 2026 report by Auto Techeview (Automotive Mission Plan 2016–2026 − A Curtain Raiser,015) estimated that automotive sectors will contribute morehan 12% of the overall GDP of the country. Automotive industrieslso face environmental and societal pressures from customers,mployees, and partners due to globalization (Zhu et al., 2007).n the present scenario, Indian automotive industries are at peakressure to shift towards SSCM, due to continuous globalizationressures, rules and regulations framed by the government, androm daily increases in societal awareness and standards. Hence,ndian industries now consider the social and environmental issues
ore vital than ever (Kannan et al., 2016), and they face difficulty indentifying the prominent SSCM practices for improving their sus-ainable performance (Thanki et al., 2016). The increasing need forrms to adopt sustainability practices in order to achieve competi-ive advantages and, at the same time, not to compromise aspects ofustainability is the need of the hour (Smith and Ball, 2012). Indianutomotive industries are also experiencing challenges in terms oflobal competition; well-known global giants seek to claim somef the local market. Indian industries understand that followinghe concepts of sustainability will not only help them to thrive inhis healthy competition, but also may provide a competitive edgeBouzon et al., 2016). Although the implementation of practices haseen studied from different perspectives, no work has been doneo find the prominent practices and the inter influences amonghe practices in a leading sector such as the automotive industryn an emerging economy like India. Once the prominent practicesnd their mutual influences with the other common practices aredentified, the shift to SSCM is made easier and much effective. Byareto 80/20 principle, it is believed that roughly 80% of the effectsre only based on 20% of causes. Concentrating on the prominentractices first will automatically increase the chances for success-ul adoption of SSCM (Diabat and Govindan 2011). By identifyinghe inter influences between the practices one can develop a suit-ble mapping for thorough implementation of all the practices.f late the multi-stake holder strategy has gained much impor-
ance in the field of sustainability since the strategy is cohesionf resources, market-based perspectives and ethical values, whichn concurrence with the SSCM strategy. Hence, there is a need tonvestigate SSCM practices in these industries from a multi stake-older perspective. For any firm, the three main stakeholders are1) the government who pose the standards, rules and regulations,2) the society on whose demand the goods are produced and whoomprise the end consumers of the products, and (3) the inter-al stakeholders and managers who decide what is done withinhe organization. The views of all three categories of stakeholdersre considered in the current study. Although their views may dif-er, the main motto of sustainability is a common function amonghem for assessing the real situation. Hence, the prominent prac-ices based on their views are to be found for better understandingnd easier implementation of SSCM.
The research questions we pursue include what are the SSCMractices that can be identified and incorporated in automotiverms to achieve sustainable performance?, what are the categorieso which they belong?, and what are the inter influences and promi-
ence among these practices? Identifying and categorizing theseractices to build a framework model is just like building a theoryowards sustainable supply chain management; proper evalua-ion of the model is necessary (Wacker, 2004). This work intends,Fig. 1. Proposed research framework for identifying the prominent SSCM practicesin Indian automotive industries.
first, to identify the various SSCM practices followed in automotivesectors by review of previous literatures from peer reviewed arti-cles. We analyze practices from multiple stakeholder perspectives.Next we apply DEMATEL, a Multi Criteria Decision Making (MCDM)tool to evaluate the inter influences and prominences between theidentified practices, and we include responses from governmental,management, and socially conscious staff. Fig. 1 shows the pro-posed framework for analyzing the SSCM practices in an Indianautomotive industry.
The remaining paper is structured as follows. Section 2 sum-marizes the literature study. It also establishes the research gapaddressed in the current study, followed by the problem descrip-tion. An application of the proposed DEMATEL-based frameworkis described in Section 3, and we discuss the results obtained frommultiple stakeholder perspectives in Section 4. Our conclusions andthe managerial implications, along with limitations of the presentstudy and future scope, are presented in Section 5 and Section 6respectively.
2. Literature review
This literature review section is divided into three subsections.In the first sub section, we provide a brief understanding of what aSSCM is by trying to point out some of its various widely accepteddefinitions from previous publications. This will provide a briefintroduction to what SSCM is and how it is understood by the aca-demicians and the industrialists over the years. The next subsectiongives an outline of the various investigations published in referenceto the SSCM practices in accordance with automotive industries.This provides the base for identifying the research gap for the cur-rent study which is explained in the third sub section.
2.1. Sustainable supply chain management (SSCM)
SSCM is an area of research which has seen remarkable growthover the last few years, evidenced by a dramatic increase in thenumber of publications in this field (Seuring and Müller, 2008).

2 serva
Mymigi2sisfitfoaicmiStotfnfihdro(mgsntaicogCaWtteaam
2
tcarwbqrTS(
86 D. Mathivathanan et al. / Resources, Con
ore than 300 research articles were published in the last 15ears or so on the topics of green and sustainable supply chainanagement (Seuring, 2013). Initial efforts focused on improv-
ng economic aspects of the supply chain, followed by introducingreen/environmental practices into the supply chains, and result-ng in an evolution of green supply chain management (Sarkis,003; Govindan et al., 2015c). According to Srivastava (2007), greenupply chain management is “integrating environmental thinkingnto supply chain management, including product design, materialourcing and selection, manufacturing processes, delivery of thenal products to the consumers, and end-of-life management ofhe product after its useful life.” Thus, green supply chains mainlyocus on greening the supply chain and the associated benefitsf doing so (Zhu and Sarkis, 2004). The concept of globalizationnd the evolution of corporate social responsibilities fueled thenclusion of social aspects into the more typical environmental con-erns of supply chains (Govindan et al., 2014b). When supply chainanagement equally incorporates the three pillars of sustainabil-
ty – economy, environment, and society – the term Sustainableupply Chain Management (SSCM) is used (Elkington, 1998). Fur-her, Seuring and Müller (2008) define SSCM as “the managementf material, information and capital flows as well as coopera-ion among companies along the supply chain while taking goalsrom all three dimensions of sustainable development, i.e. eco-omic, environmental and social, into account which are derived
rom customer and stakeholder requirements.”Various other def-nitions are found for SSCM in the previous literature and weighlight a few below. Lerberg Jorgensen and Steen Knudsen (2006)efined SSCM as a “means by which companies manage their socialesponsibilities across dislocated production processes spanningrganizational and geographical boundaries.” Carter and Rogers2008) defined SSCM based on the triple bottom line approach, risk
anagement, transparency, strategy, and culture as “the strate-ic, transparent integration and achievement of an organization’social, environmental, and economic goals in the systemic coordi-ation of key inter-organizational business processes for improvinghe long-term economic performance of the individual companynd its supply chains.”Broadly, SSCM is one that adds sustainabil-ty to the existing SCM processes; it is a balanced and integratedonsideration of the social, environmental, and economic impactsf business (Font et al., 2008). Teuteberg and Wittstruck (2010)ave a pictorial representation of “House of Sustainable Supplyhain Management” that depicts the three dimensions of sustain-bility as the pillars of SSCM which keep the house in balance.ittstruck and Teuteberg (2012) stated that SSCM is nothing but
he inclusion of environmental and social aspects into one’s tradi-ional supply chain management. The conversion of a traditionalconomy-based supply chain management into SSCM involves thedoption of certain practices (Linton et al., 2007). Many definitionsnd explanations for SSCM co-exist in previous literature; the pri-ary concurrences in SSCM research are the SSCM practices.
.2. SSCM practices
How does one transform an existing supply chain into a sus-ainable one? How do firms attain a competitive edge over theirompetitors without compromising the environmental and societalspects? How do firms achieve a high degree of social and envi-onmental performance? What is the best way for a firm to dealith potentially catastrophic changes in market trends introduced
y foreign investors? Automotive industries in India face all theseuestions due to modernization, globalization, and increased envi-
onmental awareness (Govindan et al., 2016a; Zailani et al., 2017).he answer to all these questions is the recommendation to adoptSCM practices. SSCM practices, according to Markman and Krause2016), are “a function of two inseparable principles: (1) they musttion and Recycling 128 (2018) 284–305
enhance ecological health, follow ethical standards to further socialjustice, and improve economic vitality; and (2) they must prioritizethe environment first, society second, and economics third.”
Over the last few years there is a steady growth in the number ofresearch studies carried out in the area of SSCM (Beske and Seuring,2014). Carter and Rogers (2008) proposed a framework summariz-ing SSCM practices and the pre-requisites for implementing thosepractices through case studies. Walker and Preuss (2008) identi-fied different barriers to the practice of sustainability. Researchersinvestigated the affordability of SSCM practices and found that afirm’s lack of proper managerial time is a bigger factor than thelack of financial resources. Svensson (2007) classified supply chainsas first, second, and nth-order supply chains based on the prac-tices implemented. Pagell and Wu (2009) constructed a case studymodel categorizing SSCM practices to discover the uniquenessof companies following SSCM practices in achieving competitiveadvantage. Vachon and Klassen (2008) classified the upstream anddownstream collaboration activities among the supply chain part-ners using SSCM practices. Gold et al. (2010) proposed that whenstriving for sustainability, a firm and its supply chain should bothpossess all the requisite internal resources to implement SSCMpractices. Ageron et al. (2012) proposed a conceptual model forSSCM explaining the reasons, characteristics, and barriers for adop-tion of SSCM through SSCM practices. Beske (2012) constructed aframework integrating SSCM practices and dynamic capabilities bya critical analysis of literature. Morali and Searcy (2013) focusedon SSCM practices followed in Canadian industries and addressedthe challenges faced during its implementation for achieving sus-tainability. Zailani et al. (2012) investigated the positive outcomesachieved by implementing SSCM practices on a firm’s economic andsocial performance through a factor analysis based on survey dataobtained from over 400 manufacturing firms in Malaysia. Gloveret al. (2014) examined the extent of SSCM practices implemented inthe food industry based on Institutional Theory. Pressures that forcethe firms to adopt sustainable practices in their business strategieswere also investigated. Govindan et al. (2014a) analyzed the impactof SSCM practices using a three-dimensional deductive researchbased approach; they considered the three dimensions of sustain-ability through lean, resilient, and green supply chain managementparadigms. Beske et al. (2014) critically analyzed SSCM practicesassociated with the food industry and summarized how the prac-tices allow companies to gain control over their supply chain andto achieve a competitive advantage. Jia et al. (2015a) analyzedand identified dominant SSCM practices in the mining and min-eral industries using Interpretive Structural Modelling (ISM). Wuet al. (2016) proposed a comprehensive and quantitative methodto understand the concept of SSCM and to assess its performance.Dubey et al. (2016) highlighted alternative methods research forSSCM by providing a conceptual framework that explores SSCMdrivers and their relationships. Esfahbodi et al. (2016a) address thetrade-offs between environmental and cost performance in SSCMespecially in emerging economies. Ahmad et al. (2016a) reviewedcorporate sustainability reporting practices in accordance to SSCMin the oil and gas industry. Ahmad et al. (2016b) focused on thechallenges in relation to the SSCM practices in industries. Esfahbodiet al. (2016b) summarized the role of governance in the adop-tion of SSCM practices and investigated the performance gains ofan organization with regard to both environment and economy.Hussain et al. (2016) provided a comprehensive framework on sus-tainability measurement with a practical approach for measuringand implementing SSCM practices in Arab countries.
It is thus clear that many researchers have focused on the need
for implementation of SSCM in firms, the benefits of adopting SSCMpractices, and the impact of those practices on a firm’s perfor-mance (Jia et al., 2015c; Luthra et al., 2017). Firms generally realizethe importance of shifting from traditional supply chains to SSCM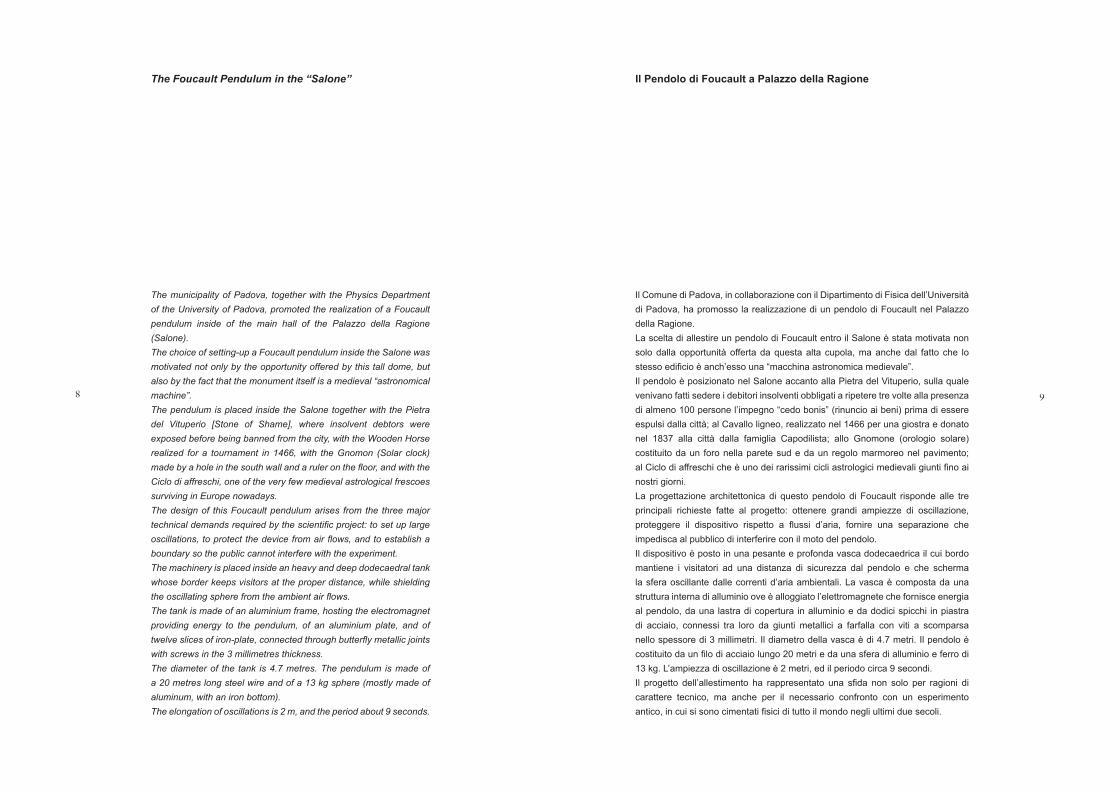
D. Mathivathanan et al. / Resources, Conservation and Recycling 128 (2018) 284–305 287
Table 1List of Sustainable Supply Chain Management practices in automotive industries.
Sl.No. Practices Explanation Sources
Management category1 Triple bottom-line approach (P1) Equal importance to all three dimensions of
sustainability in strategic decision makingBeske et al. (2014); Beske and Seuring (2014); Dyllick andHockerts (2002); Zubir et al. (2012); Gimenez and Tachizawa(2012); Koplin et al. (2007); Linton et al. (2007); Matos andHall (2007); Nikolaou et al. (2013); Pagell and Wu (2009);Seuring and Müller (2008); Zailani et al. (2012)
2 Supply Chain orientation (P2) Considering the sustainability aspects in wholesupply chain for decision making
Beske and Seuring (2014); Beske et al. (2014); Carter and LianeEaston (2011), Pagell and Wu (2009); Sarkis (2001); Seuringand Müller (2008)
3 Reverse logistics, using Product recoverytechniques (P3)
reuse, recycle and remanufacturing Brandenburg et al. (2014); Carter and Rogers (2008); Guide(2000); Inderfurth et al. (2001); Lin (2013); Nagalingam et al.(2013)
4 Management commitment (P4) Commitment to SSCM from top and middlelevel managers
Jia et al. (2015a); Rostamzadeh et al. (2015); Shaharudin et al.(2015)
Supplier category5 Environmental purchasing (P5) Purchasing greener raw materials Carter et al. (2000); Miemczyk et al. (2012); Walton and
Handfield (1998); Zhu et al. (2013)6 Standards and Certifications (P6) Adhering to environmental and social
standards of the societyBeske and Seuring (2014); Diabat et al. (2014); Giunipero et al.(2012); Jia et al. (2015a); Handfield et al. (2005); Walton et al.(1998)
7 Auditing suppliers (P7) ensuring that sustainability standards are metin every order
Igarashi et al. (2013); Jia et al. (2015a,b,c); Handfield et al.(2005)
8 Green packaging (P8) Minimum use of resources along withrenewable raw materials used for packaging
Carter and Liane Easton (2011); El-Berishy et al. (2013); Faccioet al. (2014); Gupta and Kumar (2013); Jia et al. (2015a,b,c);Govindasamy (2010); Winkler (2011); Zailani et al. (2012)
Collaboration category9 Long term relationships (P9) Collaborative development of products and
processes through long term relationshipswith the supply chain partners
Ashby et al. (2012); Beske and Seuring (2014); Beske et al.(2014); Gold et al. (2010); Miemczyk et al. (2012); Pagell andWu (2009); Ziggers and Trienekens (1999)
10 Collaborating with suppliers (P10) to produce environment friendly products Attaran and Attaran (2007); Carter and Rogers (2008);Sacaluga and Froján (2014)
11 SC Partner Development (P11) cooperation between suppliers andmanufacturers in product developmentrelationship
Bidault et al. (1998); Fossas-Olalla et al. (2010); Gold et al.(2010); Ziggers and Trienekens (1999)
12 Joint development (P12) Improving sustainable performance throughcollaboration
Beske and Seuring (2014); Beske et al. (2014); Chen andPaulraj (2004); Burgess et al. (2006)
13 Logistical integration (P13) direct involvement of a company with itssuppliers and customers in planning andforecasting
Beske and Seuring (2014); Beske et al. (2014); Skjoett-Larsenet al. (2003); Vachon and Klassen (2008)
14 Technological integration (P14) Collaboration to enhance sustainabilityperformance
Beske and Seuring (2014); Beske et al. (2014); Croom et al.(2000); Power (2005)
Design category15 Design of products to reduce waste and
costs (P15)Cost effective design produced by minimumuse of resources
Ashby et al. (2012); Zubir et al. (2012); Govindan et al. (2013);Hasan (2013); Li et al. (2014); Guang Shi et al. (2012); Xia et al.(2015)
16 Redesigning processes for emissionsreduction (P16)
Minimization of emission of harmful gases andwaste produced during production
Ji et al. (2014); Renukappa et al. (2013); Handfield et al. (2005);Sacaluga and Froján (2014); Walton and Handfield (1998)
17 Innovation (P17) Use of technology for increasing efficiency byinterpreting shared knowledge on buyerbehaviors and social trends
Beske and Seuring (2014); Carter and Rogers (2008); Zubiret al. (2012); Matos and Hall (2007); Svensson (2007)
Internal practices category18 Life Cycle Analysis/Assessment (P18) technique to assess environmental impacts
associated with all the stages of a product’s lifefrom cradle to grave
Beske and Seuring (2014); Beske et al. (2014); Brandenburget al. (2014); Egilmez et al. (2014); Gold et al. (2010); Ji et al.(2014); Matos and Hall (2007); Singh et al. (2014); Srivastava(2007)
19 Effective use of by-products (P19) Use of the secondary products efficiently Bansal and McKnight (2009); Carter and Rogers (2008);Edgeman (2013), Fiksel (2003); Moors (2006); Pagell and Wu(2009); Zhang et al. (2013)
20 Enhanced Communication (P20) More transparent communication bringsvisibility and effectiveness in SSCM
Beske and Seuring (2014); Matos and Hall (2007)
21 Use of cleaner process technology (P21) process involved in production is madepollution and waste free
Dubey et al. (2016); Zubir et al. (2012); Sangwan and Mittal(2016); Seuring and Müller (2008)
Society Category22 Cooperation with customers (P22) for eco design and green packaging Bidault et al. (1998); Fossas-Olalla et al. (2010)23 Environmental awareness training (P23) Train management, employee and the
community about sustainable environmentalpractices.
Igarashi et al. (2013); Jia et al. (2015a); Lozano (2013); Weiet al. (2007)
24 Measurement and reward systems linkedto sustainability (P24)
Encouraging employees by proving incentives Koplin et al. (2007); Pagell and Wu (2009)
25 Worker safety and human rights (P25) Implementing and following the safety aspectsand laws of the governments regardingemployment
Carter and Rogers (2008); Kleindorfer et al. (2005)
288 D. Mathivathanan et al. / Resources, Conservation and Recycling 128 (2018) 284–305
Table 2Initial Direct Relation Matrix − Management perspective.(For interpretation of the references to colour in the Table legend, the reader is referred to the web version of thisarticle.)
Prac�ce P1 P2 P3 P4 P5 P6 P7 P8 P9 P10 P11 P12 P13 P14 P15 P16 P17 P18 P19 P20 P21 P22 P23 P24 P25
P1 0 2 3 2 2 3 3 3 2 2 3 1 2 2 2 2 2 2 2 2 2 3 3 2 2P2 2 0 2 1 2 3 3 2 3 3 3 3 2 2 2 2 2 2 2 2 2 3 2 2 3P3 0 0 0 0 0 2 0 0 2 2 2 0 3 3 0 0 3 3 3 3 0 3 3 2 2P4 3 3 3 0 3 3 2 2 3 3 3 3 3 3 3 3 0 0 0 2 3 2 3 3 3P5 2 2 2 0 0 3 3 3 0 2 0 0 0 0 0 0 0 2 3 2 3 0 0 0 2P6 3 2 2 3 3 0 3 3 2 2 2 0 0 2 3 3 2 3 3 2 3 3 3 3 3P7 0 0 0 0 3 3 0 0 2 2 2 2 0 0 0 0 0 3 0 2 0 0 0 0 2P8 2 0 0 0 2 2 0 0 0 0 0 0 0 2 2 2 0 2 0 0 3 0 0 0 3P9 2 2 3 2 0 0 2 2 0 3 3 3 3 3 0 0 0 0 0 3 0 3 2 2 0
P10 0 0 2 0 0 0 2 2 2 0 2 2 2 2 0 0 0 0 0 2 0 3 0 0 0P11 2 2 3 0 2 2 3 2 3 3 0 3 4 4 2 2 3 1 2 3 2 3 3 2 0P12 0 0 0 2 0 2 2 0 2 2 2 0 2 2 0 0 2 0 0 2 0 0 0 0 0P13 0 2 3 2 3 2 2 0 2 2 2 2 0 0 0 0 0 0 0 2 0 0 0 0 0P14 0 0 2 0 0 0 0 0 2 2 2 2 2 0 2 2 3 3 3 3 2 3 0 2 2P15 0 2 0 0 3 2 2 2 0 0 2 0 0 2 0 2 3 2 3 0 3 0 0 0 0P16 0 2 0 0 2 2 2 2 0 0 0 2 0 2 2 0 2 2 2 0 3 2 3 3 3P17 0 0 3 0 0 0 0 0 0 1 1 1 2 2 3 3 0 3 3 3 3 0 0 0 0P18 2 1 3 0 3 2 3 2 0 0 0 0 0 0 3 3 3 0 3 0 3 0 3 0 0P19 0 0 2 0 0 2 2 0 0 0 0 0 0 3 3 3 1 3 0 0 3 0 0 0 0P20 0 3 2 0 0 2 3 2 3 3 3 3 3 3 2 2 3 0 0 0 0 3 3 3 3P21 0 0 2 0 3 3 3 3 0 0 0 0 0 3 3 3 0 3 3 0 0 3 2 2 2P22 0 0 3 0 0 0 0 3 0 0 0 0 0 0 0 0 3 0 0 0 0 0 0 0 0P23 2 0 3 2 3 3 3 3 0 0 0 2 2 3 3 3 3 3 3 0 3 0 0 3 3P24 0 0 2 0 2 2 0 0 0 2 0 2 2 2 3 3 3 3 3 0 3 3 2 0 3P25 2 2 0 2 2 3 0 0 0 0 0 0 0 0 0 3 3 2 0 2 3 2 2 0 0
Table 3Initial Direct Relation Matrix − Government perspective.(For interpretation of the references to colour in the Table legend, the reader is referred to the web version of thisarticle.)
Prac�ce P1 P2 P3 P4 P5 P6 P7 P8 P9 P10 P11 P12 P13 P14 P15 P16 P17 P18 P19 P20 P21 P22 P23 P24 P25
P1 0 2 2 2 2 3 3 3 2 2 3 2 2 2 2 2 2 2 2 2 2 3 3 2 2P2 2 0 2 1 2 3 3 2 3 3 3 3 2 2 2 2 2 2 2 2 2 3 2 2 3P3 0 0 0 0 0 2 0 0 2 2 2 0 3 3 0 0 3 3 3 3 0 3 3 2 2P4 3 3 3 0 3 3 2 2 3 3 3 2 3 3 3 3 0 0 0 2 3 2 3 3 3P5 2 2 2 0 0 2 3 3 0 2 0 0 0 0 0 0 0 2 3 2 3 0 0 0 2P6 3 3 2 3 3 0 3 3 2 3 3 0 0 3 3 3 2 3 3 2 3 3 3 3 3P7 0 0 0 0 3 3 0 0 2 2 2 2 0 0 0 0 0 3 0 2 0 0 0 0 2P8 2 0 0 0 2 2 0 0 0 0 0 0 0 2 2 2 0 2 0 0 3 0 0 0 3P9 2 2 3 2 0 0 2 2 0 3 2 2 3 3 0 0 0 0 0 3 0 3 2 2 0
P10 0 0 2 0 0 0 2 2 2 0 2 2 2 2 0 0 0 0 0 2 0 3 0 0 0P11 2 2 3 0 2 2 3 2 3 3 0 3 4 4 2 2 3 1 2 3 2 3 3 2 0P12 0 0 0 2 0 2 2 0 2 2 2 0 2 2 0 0 2 0 0 2 0 0 0 0 0P13 0 2 3 2 2 2 2 0 2 2 2 2 0 0 0 0 0 0 0 2 0 0 0 0 0P14 0 0 2 0 0 0 0 0 2 2 2 2 2 0 2 2 3 3 3 3 2 3 0 2 2P15 0 2 0 0 3 2 2 2 0 0 2 0 0 2 0 2 3 2 3 0 3 0 0 0 0P16 0 2 0 0 2 3 3 3 2 0 2 2 0 3 3 0 2 2 2 0 3 3 3 3 3P17 0 0 3 0 0 0 0 0 0 1 1 1 2 2 3 3 0 3 3 3 3 0 0 0 0P18 2 1 3 0 3 2 3 2 0 0 0 0 0 0 3 2 3 0 3 0 3 0 3 0 0P19 0 0 2 0 0 2 2 0 0 0 0 0 0 3 3 2 1 3 0 0 0 0 0 0 0P20 0 3 2 0 0 2 3 2 3 3 3 3 3 3 3 3 3 0 0 0 0 3 3 3 3P21 0 3 2 0 3 3 3 3 0 0 0 0 0 3 3 3 0 3 3 0 0 3 2 2 3P22 0 0 3 0 0 0 0 3 0 0 0 0 0 0 0 0 3 0 0 0 0 0 0 0 0P23 2 0 3 2 3 3 3 3 0 0 0 2 2 3 3 2 3 3 3 0 3 0 0 3 3
20
bgiI
P24 2 3 2 3 2 2 0 0 0 2 0 2 2P25 2 2 0 2 2 3 0 0 0 0 0 0 0
y adopting SSCM practices and they understand the advantagesained by doing so. Industries have initiated various activities formplementing SSCM (Dehghanian et al., 2011). In a country likendia, the automotive sector is one of the biggest contributors to
3 3 3 3 3 0 3 3 2 0 30 3 3 2 0 2 3 2 2 0 0
the nation’s GDP and economy. The sector has begun to address theneed for improving environmental and the social performances byorienting themselves towards SSCM practices. Because these prac-tices are correlated with one another, it is important to inspect
D. Mathivathanan et al. / Resources, Conservation and Recycling 128 (2018) 284–305 289
Table 4Initial Direct Relation Matrix − Societal perspective.(For interpretation of the references to colour in the Table legend, the reader is referred to the web version of this article.)
Prac�ce P1 P2 P3 P4 P5 P6 P7 P8 P9 P10 P11 P12 P13 P14 P15 P16 P17 P18 P19 P20 P21 P22 P23 P24 P25P1 0 2 2 2 2 3 2 3 2 2 2 1 2 2 2 2 2 2 2 2 2 3 2 2 2P2 2 0 2 1 2 2 2 2 3 2 3 3 2 2 2 2 2 2 2 2 2 2 2 2 3P3 0 0 0 0 0 2 0 0 2 2 2 0 3 3 0 0 3 3 3 3 0 3 3 2 2P4 3 2 2 0 3 2 2 2 2 2 2 2 2 2 2 2 0 0 0 2 2 2 2 2 2P5 2 2 2 0 0 3 3 3 0 2 0 0 0 0 0 0 0 2 3 2 3 0 0 0 2P6 3 2 2 3 3 0 3 2 2 2 2 0 0 2 3 3 2 3 3 2 3 3 3 3 3P7 0 0 0 0 3 3 0 0 2 2 2 2 0 0 0 0 0 3 0 2 0 0 0 0 2P8 2 0 0 0 2 2 0 0 0 0 0 0 0 2 2 2 0 2 0 0 3 0 0 0 3P9 2 2 3 2 0 0 2 2 0 3 3 3 3 3 0 0 0 0 0 3 0 3 2 2 0
P10 0 0 2 0 0 0 2 2 2 0 2 2 2 2 0 0 0 0 0 2 0 3 0 0 0P11 2 2 3 0 2 2 3 2 3 3 0 3 3 3 2 2 2 1 2 3 2 3 3 2 0P12 0 0 0 2 0 2 2 0 2 2 2 0 3 3 0 0 2 0 0 2 0 0 0 0 0P13 0 2 2 2 2 2 2 0 2 2 2 2 0 0 0 0 0 0 0 2 0 0 0 0 0P14 0 0 3 0 0 3 0 3 2 2 2 2 3 0 3 3 3 3 2 3 2 3 3 3 2P15 0 2 0 0 3 2 2 2 0 0 2 0 0 2 0 2 3 2 3 0 3 0 0 0 0P16 0 2 0 0 2 2 2 2 0 0 0 2 0 2 2 0 2 2 2 0 3 2 3 3 3P17 0 0 3 0 0 0 0 0 0 1 1 1 2 2 3 3 0 3 3 3 3 0 0 0 0P18 2 1 3 0 3 2 3 2 0 0 0 0 0 0 3 3 3 0 3 0 3 0 3 0 0P19 0 0 2 0 0 2 2 0 0 0 0 0 0 3 3 3 1 3 0 0 3 0 0 0 0P20 0 3 2 0 0 2 3 2 3 3 3 3 3 3 2 2 3 0 0 0 0 3 3 3 3P21 0 0 2 0 3 3 3 3 0 0 0 0 0 3 3 3 0 3 3 0 0 3 2 2 2P22 0 0 3 0 0 0 0 3 0 0 0 0 0 0 0 0 3 0 0 0 0 0 0 0 0P23 2 0 3 2 3 3 3 3 0 0 0 2 2 3 3 3 3 3 3 0 3 0 0 3 3
20
tattpsppMpvp
rsiSacttedhvc
2
tappash
P24 0 0 2 0 2 2 0 0 0 2 0 2 2P25 2 3 0 2 3 3 2 2 0 0 0 0 0
he inter influences (Govindan and Chaudhuri, 2016; Govindannd Jepsen, 2016). There is no existing literature which analyseshe inter influences between SSCM practices in an Indian automo-ive industry context with multiple stakeholder perspectives. Theresent study focuses on these voids by seeking a judicial plan foruccessful implementation of SSCM practices; we determine theractices that must be concentrated on in order to achieve com-etitive advantages through a multi stakeholder approach basedCDM technique. The study intends to identify the common SSCM
ractices followed in automotive sector through a literature sur-ey and to understand the prominence relationship among theractices using DEMATEL method. The following Table 1.
Step 3: To find the Total Relation Matrix Eq. (4) is used and theesulting matrices for each case are shown in detail in Tables 8–10hows the list of 25 SSCM practices along with their explanationsdentified from the existing literature. Keywords such as SSCM;SCM practices; best practices; sustainable supply chain man-gement; sustainable supply chain management practices; supplyhain practices were used as data inputs in the scopus based searcho identify these practices. The inter influences are analyzed fromhree perspectives; namely management; government; and soci-tal stakeholders; they are the integral and core elements of anyecision making in the industries. Including these stakeholderselps one to understand the commonalities and differences in theiriews and provides a multi-dimensional approach to address theurrent study.
.3. Research gap
It is observed from the above literature study that SSCM prac-ices play an important role in helping firms to achieve competitivedvantages. Previous research has identified the various SSCMractices, explored their impact on the firm’s performance, and
rovided necessary validating proofs of their advantages. But fromn automotive industry perspective, specifically from an Indiancenario, the prominence and influences of each SSCM practiceave not been explored. This paper seeks to bridge the gap by3 3 3 3 3 0 3 3 2 0 32 3 3 2 2 2 3 2 2 3 0
providing the prominence and influential relationship betweenSSCM practices and by evaluating them from multiple stakeholderperspectives. We utilized a questionnaire survey with respon-dents from South India who are industrial experts, academicians,social activists, and environmental scientists. The highlights of theresearch are as follows:
• Identifying the SSCM practices through literature survey of pre-vious publications
• Proposing a framework to analyze SSCM practices in an Indianautomotive sector on a multi stakeholder perspective usingDEMATEL tool
• Validating prominent SSCM practices identified from the studythrough feedback from experts, industrial managers, and existingliterature
3. Methodology
The first step is to identify the common SSCM practices througha literature review. The next step is to analyze SSCM practicesfrom multi stakeholder perspectives using DEMATEL. The ques-tionnaire was directed to multiple stakeholders of the automotiveindustry, and responses were collected from e-mail conversations,telephonic enquiries, and direct meetings. From the stakeholders’replies, an initial relationship matrix was constructed to evaluatethe SSCM practices with the DEMATEL tool. Here, we analyze theSSCM practices for each stakeholder group individually to find thesimilarities and differences in the views of each group. Finally, toidentify the mandatory practices from the full list, we provide acomparison between the combined stakeholder perspectives andthe individual perspectives from the results obtained.
The solution methodology we apply to identify the prominencesand the inter influences among the SSCM practices is DEMATEL,
a Multi Criteria Decision Making (MCDM) tool. This tool analy-ses the inter influences among complex criteria (Jia et al., 2015b;Govindan et al., 2015b) by simplifying problems; it provides a mapof the interrelationships based on the opinions of the respondents
290
D.
Mathivathanan
et al.
/ R
esources, Conservation
and R
ecycling 128
(2018) 284–305
Table 5Normalized Relation Matrix − Management perspective.
Practice P1 P2 P3 P4 P5 P6 P7 P8 P9 P10 P11 P12 P13 P14 P15 P16 P17 P18 P19 P20 P21 P22 P23 P24 P25
P1 0.000 0.034 0.051 0.034 0.034 0.051 0.051 0.051 0.034 0.034 0.051 0.017 0.034 0.034 0.034 0.034 0.034 0.034 0.034 0.034 0.034 0.051 0.051 0.034 0.034P2 0.034 0.000 0.034 0.017 0.034 0.051 0.051 0.034 0.051 0.051 0.051 0.051 0.034 0.034 0.034 0.034 0.034 0.034 0.034 0.034 0.034 0.051 0.034 0.034 0.051P3 0.000 0.000 0.000 0.000 0.000 0.034 0.000 0.000 0.034 0.034 0.034 0.000 0.051 0.051 0.000 0.000 0.051 0.051 0.051 0.051 0.000 0.051 0.051 0.034 0.034P4 0.051 0.051 0.051 0.000 0.051 0.051 0.034 0.034 0.051 0.051 0.051 0.051 0.051 0.051 0.051 0.051 0.000 0.000 0.000 0.034 0.051 0.034 0.051 0.051 0.051P5 0.034 0.034 0.034 0.000 0.000 0.051 0.051 0.051 0.000 0.034 0.000 0.000 0.000 0.000 0.000 0.000 0.000 0.034 0.051 0.034 0.051 0.000 0.000 0.000 0.034P6 0.051 0.034 0.034 0.051 0.051 0.000 0.051 0.051 0.034 0.034 0.034 0.000 0.000 0.034 0.051 0.051 0.034 0.051 0.051 0.034 0.051 0.051 0.051 0.051 0.051P7 0.000 0.000 0.000 0.000 0.051 0.051 0.000 0.000 0.034 0.034 0.034 0.034 0.000 0.000 0.000 0.000 0.000 0.051 0.000 0.034 0.000 0.000 0.000 0.000 0.034P8 0.034 0.000 0.000 0.000 0.034 0.034 0.000 0.000 0.000 0.000 0.000 0.000 0.000 0.034 0.034 0.034 0.000 0.034 0.000 0.000 0.051 0.000 0.000 0.000 0.051P9 0.034 0.034 0.051 0.034 0.000 0.000 0.034 0.034 0.000 0.051 0.051 0.051 0.051 0.051 0.000 0.000 0.000 0.000 0.000 0.051 0.000 0.051 0.034 0.034 0.000P10 0.000 0.000 0.034 0.000 0.000 0.000 0.034 0.034 0.034 0.000 0.034 0.034 0.034 0.034 0.000 0.000 0.000 0.000 0.000 0.034 0.000 0.051 0.000 0.000 0.000P11 0.034 0.034 0.051 0.000 0.034 0.034 0.051 0.034 0.051 0.051 0.000 0.051 0.068 0.068 0.034 0.034 0.051 0.017 0.034 0.051 0.034 0.051 0.051 0.034 0.000P12 0.000 0.000 0.000 0.034 0.000 0.034 0.034 0.000 0.034 0.034 0.034 0.000 0.034 0.034 0.000 0.000 0.034 0.000 0.000 0.034 0.000 0.000 0.000 0.000 0.000P13 0.000 0.034 0.051 0.034 0.051 0.034 0.034 0.000 0.034 0.034 0.034 0.034 0.000 0.000 0.000 0.000 0.000 0.000 0.000 0.034 0.000 0.000 0.000 0.000 0.000P14 0.000 0.000 0.034 0.000 0.000 0.000 0.000 0.000 0.034 0.034 0.034 0.034 0.034 0.000 0.034 0.034 0.051 0.051 0.051 0.051 0.034 0.051 0.000 0.034 0.034P15 0.000 0.034 0.000 0.000 0.051 0.034 0.034 0.034 0.000 0.000 0.034 0.000 0.000 0.034 0.000 0.034 0.051 0.034 0.051 0.000 0.051 0.000 0.000 0.000 0.000P16 0.000 0.034 0.000 0.000 0.034 0.034 0.034 0.034 0.000 0.000 0.000 0.034 0.000 0.034 0.034 0.000 0.034 0.034 0.034 0.000 0.051 0.034 0.051 0.051 0.051P17 0.000 0.000 0.051 0.000 0.000 0.000 0.000 0.000 0.000 0.017 0.017 0.017 0.034 0.034 0.051 0.051 0.000 0.051 0.051 0.051 0.051 0.000 0.000 0.000 0.000P18 0.034 0.017 0.051 0.000 0.051 0.034 0.051 0.034 0.000 0.000 0.000 0.000 0.000 0.000 0.051 0.051 0.051 0.000 0.051 0.000 0.051 0.000 0.051 0.000 0.000P19 0.000 0.000 0.034 0.000 0.000 0.034 0.034 0.000 0.000 0.000 0.000 0.000 0.000 0.051 0.051 0.051 0.017 0.051 0.000 0.000 0.051 0.000 0.000 0.000 0.000P20 0.000 0.051 0.034 0.000 0.000 0.034 0.051 0.034 0.051 0.051 0.051 0.051 0.051 0.051 0.034 0.034 0.051 0.000 0.000 0.000 0.000 0.051 0.051 0.051 0.051P21 0.000 0.000 0.034 0.000 0.051 0.051 0.051 0.051 0.000 0.000 0.000 0.000 0.000 0.051 0.051 0.051 0.000 0.051 0.051 0.000 0.000 0.051 0.034 0.034 0.034P22 0.000 0.000 0.051 0.000 0.000 0.000 0.000 0.051 0.000 0.000 0.000 0.000 0.000 0.000 0.000 0.000 0.051 0.000 0.000 0.000 0.000 0.000 0.000 0.000 0.000P23 0.034 0.000 0.051 0.034 0.051 0.051 0.051 0.051 0.000 0.000 0.000 0.034 0.034 0.051 0.051 0.051 0.051 0.051 0.051 0.000 0.051 0.000 0.000 0.051 0.051P24 0.000 0.000 0.034 0.000 0.034 0.034 0.000 0.000 0.000 0.034 0.000 0.034 0.034 0.034 0.051 0.051 0.051 0.051 0.051 0.000 0.051 0.051 0.034 0.000 0.051P25 0.034 0.034 0.000 0.034 0.034 0.051 0.000 0.000 0.000 0.000 0.000 0.000 0.000 0.000 0.000 0.051 0.051 0.034 0.000 0.034 0.051 0.034 0.034 0.000 0.000
D.
Mathivathanan
et al.
/ R
esources, Conservation
and R
ecycling 128
(2018) 284–305
291
Table 6Normalized Relation Matrix − Government perspective.
Practice P1 P2 P3 P4 P5 P6 P7 P8 P9 P10 P11 P12 P13 P14 P15 P16 P17 P18 P19 P20 P21 P22 P23 P24 P25
P1 0.000 0.032 0.032 0.032 0.032 0.048 0.048 0.048 0.032 0.032 0.048 0.032 0.032 0.032 0.032 0.032 0.032 0.032 0.032 0.032 0.032 0.048 0.048 0.032 0.032P2 0.032 0.000 0.032 0.016 0.032 0.048 0.048 0.032 0.048 0.048 0.048 0.048 0.032 0.032 0.032 0.032 0.032 0.032 0.032 0.032 0.032 0.048 0.032 0.032 0.048P3 0.000 0.000 0.000 0.000 0.000 0.032 0.000 0.000 0.032 0.032 0.032 0.000 0.048 0.048 0.000 0.000 0.048 0.048 0.048 0.048 0.000 0.048 0.048 0.032 0.032P4 0.048 0.048 0.048 0.000 0.048 0.048 0.032 0.032 0.048 0.048 0.048 0.032 0.048 0.048 0.048 0.048 0.000 0.000 0.000 0.032 0.048 0.032 0.048 0.048 0.048P5 0.032 0.032 0.032 0.000 0.000 0.032 0.048 0.048 0.000 0.032 0.000 0.000 0.000 0.000 0.000 0.000 0.000 0.032 0.048 0.032 0.048 0.000 0.000 0.000 0.032P6 0.048 0.048 0.032 0.048 0.048 0.000 0.048 0.048 0.032 0.048 0.048 0.000 0.000 0.048 0.048 0.048 0.032 0.048 0.048 0.032 0.048 0.048 0.048 0.048 0.048P7 0.000 0.000 0.000 0.000 0.048 0.048 0.000 0.000 0.032 0.032 0.032 0.032 0.000 0.000 0.000 0.000 0.000 0.048 0.000 0.032 0.000 0.000 0.000 0.000 0.032P8 0.032 0.000 0.000 0.000 0.032 0.032 0.000 0.000 0.000 0.000 0.000 0.000 0.000 0.032 0.032 0.032 0.000 0.032 0.000 0.000 0.048 0.000 0.000 0.000 0.048P9 0.032 0.032 0.048 0.032 0.000 0.000 0.032 0.032 0.000 0.048 0.032 0.032 0.048 0.048 0.000 0.000 0.000 0.000 0.000 0.048 0.000 0.048 0.032 0.032 0.000P10 0.000 0.000 0.032 0.000 0.000 0.000 0.032 0.032 0.032 0.000 0.032 0.032 0.032 0.032 0.000 0.000 0.000 0.000 0.000 0.032 0.000 0.048 0.000 0.000 0.000P11 0.032 0.032 0.048 0.000 0.032 0.032 0.048 0.032 0.048 0.048 0.000 0.048 0.065 0.065 0.032 0.032 0.048 0.016 0.032 0.048 0.032 0.048 0.048 0.032 0.000P12 0.000 0.000 0.000 0.032 0.000 0.032 0.032 0.000 0.032 0.032 0.032 0.000 0.032 0.032 0.000 0.000 0.032 0.000 0.000 0.032 0.000 0.000 0.000 0.000 0.000P13 0.000 0.032 0.048 0.032 0.032 0.032 0.032 0.000 0.032 0.032 0.032 0.032 0.000 0.000 0.000 0.000 0.000 0.000 0.000 0.032 0.000 0.000 0.000 0.000 0.000P14 0.000 0.000 0.032 0.000 0.000 0.000 0.000 0.000 0.032 0.032 0.032 0.032 0.032 0.000 0.032 0.032 0.048 0.048 0.048 0.048 0.032 0.048 0.000 0.032 0.032P15 0.000 0.032 0.000 0.000 0.048 0.032 0.032 0.032 0.000 0.000 0.032 0.000 0.000 0.032 0.000 0.032 0.048 0.032 0.048 0.000 0.048 0.000 0.000 0.000 0.000P16 0.000 0.032 0.000 0.000 0.032 0.048 0.048 0.048 0.032 0.000 0.032 0.032 0.000 0.048 0.048 0.000 0.032 0.032 0.032 0.000 0.048 0.048 0.048 0.048 0.048P17 0.000 0.000 0.048 0.000 0.000 0.000 0.000 0.000 0.000 0.016 0.016 0.016 0.032 0.032 0.048 0.048 0.000 0.048 0.048 0.048 0.048 0.000 0.000 0.000 0.000P18 0.032 0.016 0.048 0.000 0.048 0.032 0.048 0.032 0.000 0.000 0.000 0.000 0.000 0.000 0.048 0.032 0.048 0.000 0.048 0.000 0.048 0.000 0.048 0.000 0.000P19 0.000 0.000 0.032 0.000 0.000 0.032 0.032 0.000 0.000 0.000 0.000 0.000 0.000 0.048 0.048 0.032 0.016 0.048 0.000 0.000 0.000 0.000 0.000 0.000 0.000P20 0.000 0.048 0.032 0.000 0.000 0.032 0.048 0.032 0.048 0.048 0.048 0.048 0.048 0.048 0.048 0.048 0.048 0.000 0.000 0.000 0.000 0.048 0.048 0.048 0.048P21 0.000 0.048 0.032 0.000 0.048 0.048 0.048 0.048 0.000 0.000 0.000 0.000 0.000 0.048 0.048 0.048 0.000 0.048 0.048 0.000 0.000 0.048 0.032 0.032 0.048P22 0.000 0.000 0.048 0.000 0.000 0.000 0.000 0.048 0.000 0.000 0.000 0.000 0.000 0.000 0.000 0.000 0.048 0.000 0.000 0.000 0.000 0.000 0.000 0.000 0.000P23 0.032 0.000 0.048 0.032 0.048 0.048 0.048 0.048 0.000 0.000 0.000 0.032 0.032 0.048 0.048 0.032 0.048 0.048 0.048 0.000 0.048 0.000 0.000 0.048 0.048P24 0.032 0.048 0.032 0.048 0.032 0.032 0.000 0.000 0.000 0.032 0.000 0.032 0.032 0.032 0.048 0.048 0.048 0.048 0.048 0.000 0.048 0.048 0.032 0.000 0.048P25 0.032 0.032 0.000 0.032 0.032 0.048 0.000 0.000 0.000 0.000 0.000 0.000 0.000 0.000 0.000 0.048 0.048 0.032 0.000 0.032 0.048 0.032 0.032 0.000 0.000
292
D.
Mathivathanan
et al.
/ R
esources, Conservation
and R
ecycling 128
(2018) 284–305
Table 7Normalized Relation Matrix − Societal perspective.
Practice P1 P2 P3 P4 P5 P6 P7 P8 P9 P10 P11 P12 P13 P14 P15 P16 P17 P18 P19 P20 P21 P22 P23 P24 P25
P1 0.000 0.035 0.035 0.035 0.035 0.053 0.035 0.053 0.035 0.035 0.035 0.018 0.035 0.035 0.035 0.035 0.035 0.035 0.035 0.035 0.035 0.053 0.035 0.035 0.035P2 0.035 0.000 0.035 0.018 0.035 0.035 0.035 0.035 0.053 0.035 0.053 0.053 0.035 0.035 0.035 0.035 0.035 0.035 0.035 0.035 0.035 0.035 0.035 0.035 0.053P3 0.000 0.000 0.000 0.000 0.000 0.035 0.000 0.000 0.035 0.035 0.035 0.000 0.053 0.053 0.000 0.000 0.053 0.053 0.053 0.053 0.000 0.053 0.053 0.035 0.035P4 0.053 0.035 0.035 0.000 0.053 0.035 0.035 0.035 0.035 0.035 0.035 0.035 0.035 0.035 0.035 0.035 0.000 0.000 0.000 0.035 0.035 0.035 0.035 0.035 0.035P5 0.035 0.035 0.035 0.000 0.000 0.053 0.053 0.053 0.000 0.035 0.000 0.000 0.000 0.000 0.000 0.000 0.000 0.035 0.053 0.035 0.053 0.000 0.000 0.000 0.035P6 0.053 0.035 0.035 0.053 0.053 0.000 0.053 0.035 0.035 0.035 0.035 0.000 0.000 0.035 0.053 0.053 0.035 0.053 0.053 0.035 0.053 0.053 0.053 0.053 0.053P7 0.000 0.000 0.000 0.000 0.053 0.053 0.000 0.000 0.035 0.035 0.035 0.035 0.000 0.000 0.000 0.000 0.000 0.053 0.000 0.035 0.000 0.000 0.000 0.000 0.035P8 0.035 0.000 0.000 0.000 0.035 0.035 0.000 0.000 0.000 0.000 0.000 0.000 0.000 0.035 0.035 0.035 0.000 0.035 0.000 0.000 0.053 0.000 0.000 0.000 0.053P9 0.035 0.035 0.053 0.035 0.000 0.000 0.035 0.035 0.000 0.053 0.053 0.053 0.053 0.053 0.000 0.000 0.000 0.000 0.000 0.053 0.000 0.053 0.035 0.035 0.000P10 0.000 0.000 0.035 0.000 0.000 0.000 0.035 0.035 0.035 0.000 0.035 0.035 0.035 0.035 0.000 0.000 0.000 0.000 0.000 0.035 0.000 0.053 0.000 0.000 0.000P11 0.035 0.035 0.053 0.000 0.035 0.035 0.053 0.035 0.053 0.053 0.000 0.053 0.053 0.053 0.035 0.035 0.035 0.018 0.035 0.053 0.035 0.053 0.053 0.035 0.000P12 0.000 0.000 0.000 0.035 0.000 0.035 0.035 0.000 0.035 0.035 0.035 0.000 0.053 0.053 0.000 0.000 0.035 0.000 0.000 0.035 0.000 0.000 0.000 0.000 0.000P13 0.000 0.035 0.035 0.035 0.035 0.035 0.035 0.000 0.035 0.035 0.035 0.035 0.000 0.000 0.000 0.000 0.000 0.000 0.000 0.035 0.000 0.000 0.000 0.000 0.000P14 0.000 0.000 0.053 0.000 0.000 0.053 0.000 0.053 0.035 0.035 0.035 0.035 0.053 0.000 0.053 0.053 0.053 0.053 0.035 0.053 0.035 0.053 0.053 0.053 0.035P15 0.000 0.035 0.000 0.000 0.053 0.035 0.035 0.035 0.000 0.000 0.035 0.000 0.000 0.035 0.000 0.035 0.053 0.035 0.053 0.000 0.053 0.000 0.000 0.000 0.000P16 0.000 0.035 0.000 0.000 0.035 0.035 0.035 0.035 0.000 0.000 0.000 0.035 0.000 0.035 0.035 0.000 0.035 0.035 0.035 0.000 0.053 0.035 0.053 0.053 0.053P17 0.000 0.000 0.053 0.000 0.000 0.000 0.000 0.000 0.000 0.018 0.018 0.018 0.035 0.035 0.053 0.053 0.000 0.053 0.053 0.053 0.053 0.000 0.000 0.000 0.000P18 0.035 0.018 0.053 0.000 0.053 0.035 0.053 0.035 0.000 0.000 0.000 0.000 0.000 0.000 0.053 0.053 0.053 0.000 0.053 0.000 0.053 0.000 0.053 0.000 0.000P19 0.000 0.000 0.035 0.000 0.000 0.035 0.035 0.000 0.000 0.000 0.000 0.000 0.000 0.053 0.053 0.053 0.018 0.053 0.000 0.000 0.053 0.000 0.000 0.000 0.000P20 0.000 0.053 0.035 0.000 0.000 0.035 0.053 0.035 0.053 0.053 0.053 0.053 0.053 0.053 0.035 0.035 0.053 0.000 0.000 0.000 0.000 0.053 0.053 0.053 0.053P21 0.000 0.000 0.035 0.000 0.053 0.053 0.053 0.053 0.000 0.000 0.000 0.000 0.000 0.053 0.053 0.053 0.000 0.053 0.053 0.000 0.000 0.053 0.035 0.035 0.035P22 0.000 0.000 0.053 0.000 0.000 0.000 0.000 0.053 0.000 0.000 0.000 0.000 0.000 0.000 0.000 0.000 0.053 0.000 0.000 0.000 0.000 0.000 0.000 0.000 0.000P23 0.035 0.000 0.053 0.035 0.053 0.053 0.053 0.053 0.000 0.000 0.000 0.035 0.035 0.053 0.053 0.053 0.053 0.053 0.053 0.000 0.053 0.000 0.000 0.053 0.053P24 0.000 0.000 0.035 0.000 0.035 0.035 0.000 0.000 0.000 0.035 0.000 0.035 0.035 0.035 0.053 0.053 0.053 0.053 0.053 0.000 0.053 0.053 0.035 0.000 0.053P25 0.035 0.053 0.000 0.035 0.053 0.053 0.035 0.035 0.000 0.000 0.000 0.000 0.000 0.000 0.035 0.053 0.053 0.035 0.035 0.035 0.053 0.035 0.035 0.053 0.000
D.
Mathivathanan
et al.
/ R
esources, Conservation
and R
ecycling 128
(2018) 284–305
293
Table 8Total Relation Matrix − Management perspective.
Practice P1 P2 P3 P4 P5 P6 P7 P8 P9 P10 P11 P12 P13 P14 P15 P16 P17 P18 P19 P20 P21 P22 P23 P24 P25
P1 0.033 0.069 0.116 0.056 0.091 0.118 0.113 0.104 0.073 0.081 0.094 0.060 0.078 0.100 0.091 0.096 0.097 0.101 0.094 0.085 0.101 0.107 0.100 0.077 0.088P2 0.065 0.036 0.099 0.041 0.089 0.116 0.113 0.087 0.090 0.098 0.095 0.093 0.078 0.099 0.089 0.093 0.097 0.099 0.092 0.086 0.098 0.108 0.083 0.075 0.101P3 0.020 0.023 0.049 0.015 0.034 0.073 0.040 0.034 0.059 0.064 0.062 0.030 0.081 0.093 0.040 0.043 0.095 0.092 0.090 0.084 0.043 0.087 0.082 0.061 0.064P4 0.086 0.091 0.122 0.028 0.114 0.126 0.105 0.095 0.096 0.106 0.102 0.100 0.102 0.124 0.110 0.116 0.072 0.074 0.068 0.093 0.122 0.102 0.107 0.100 0.112P5 0.052 0.052 0.067 0.013 0.033 0.090 0.086 0.080 0.022 0.058 0.024 0.020 0.020 0.036 0.033 0.037 0.032 0.073 0.082 0.060 0.086 0.033 0.030 0.023 0.066P6 0.085 0.072 0.104 0.072 0.113 0.076 0.118 0.110 0.072 0.082 0.079 0.045 0.046 0.104 0.115 0.120 0.102 0.125 0.117 0.085 0.126 0.111 0.105 0.096 0.110P7 0.017 0.018 0.028 0.011 0.072 0.077 0.030 0.025 0.051 0.055 0.053 0.051 0.019 0.026 0.022 0.024 0.026 0.074 0.024 0.057 0.027 0.025 0.023 0.017 0.053P8 0.047 0.016 0.024 0.009 0.059 0.062 0.026 0.024 0.012 0.015 0.015 0.012 0.011 0.056 0.058 0.061 0.026 0.063 0.028 0.018 0.081 0.023 0.022 0.017 0.072P9 0.054 0.057 0.099 0.050 0.037 0.046 0.076 0.069 0.036 0.090 0.087 0.087 0.090 0.098 0.037 0.039 0.047 0.042 0.037 0.091 0.039 0.094 0.068 0.065 0.038P10 0.009 0.012 0.057 0.008 0.016 0.021 0.053 0.050 0.051 0.021 0.052 0.051 0.053 0.057 0.015 0.016 0.023 0.019 0.016 0.055 0.016 0.071 0.016 0.015 0.017P11 0.061 0.066 0.117 0.023 0.086 0.098 0.112 0.085 0.091 0.100 0.048 0.095 0.113 0.132 0.088 0.091 0.112 0.083 0.093 0.104 0.094 0.107 0.095 0.075 0.053P12 0.013 0.017 0.029 0.043 0.021 0.057 0.059 0.020 0.055 0.058 0.057 0.023 0.056 0.061 0.022 0.023 0.056 0.023 0.020 0.059 0.022 0.026 0.020 0.019 0.020P13 0.018 0.053 0.082 0.045 0.075 0.066 0.066 0.027 0.059 0.064 0.061 0.058 0.027 0.034 0.023 0.025 0.028 0.029 0.026 0.064 0.027 0.031 0.026 0.023 0.027P14 0.016 0.022 0.077 0.012 0.032 0.040 0.039 0.032 0.056 0.062 0.060 0.060 0.063 0.043 0.070 0.073 0.093 0.090 0.088 0.081 0.073 0.086 0.032 0.058 0.061P15 0.017 0.050 0.034 0.009 0.081 0.069 0.068 0.062 0.018 0.023 0.053 0.019 0.018 0.067 0.035 0.069 0.080 0.074 0.086 0.026 0.090 0.027 0.025 0.021 0.029P16 0.021 0.053 0.040 0.015 0.073 0.079 0.073 0.068 0.019 0.026 0.023 0.056 0.022 0.073 0.074 0.045 0.076 0.083 0.077 0.029 0.099 0.066 0.079 0.075 0.086P17 0.011 0.018 0.082 0.008 0.028 0.034 0.034 0.026 0.019 0.038 0.039 0.037 0.054 0.069 0.081 0.082 0.035 0.085 0.084 0.073 0.083 0.029 0.027 0.022 0.025P18 0.052 0.037 0.088 0.013 0.089 0.080 0.091 0.069 0.020 0.025 0.025 0.022 0.022 0.043 0.090 0.091 0.088 0.051 0.095 0.029 0.097 0.031 0.080 0.027 0.037P19 0.011 0.013 0.057 0.007 0.026 0.061 0.059 0.022 0.013 0.016 0.017 0.014 0.013 0.076 0.076 0.078 0.044 0.082 0.032 0.019 0.080 0.023 0.022 0.018 0.023P20 0.027 0.079 0.091 0.022 0.048 0.089 0.101 0.077 0.087 0.094 0.091 0.092 0.093 0.107 0.080 0.085 0.108 0.058 0.051 0.050 0.056 0.101 0.091 0.086 0.095P21 0.022 0.022 0.072 0.013 0.090 0.096 0.089 0.085 0.019 0.025 0.023 0.021 0.020 0.089 0.090 0.093 0.045 0.101 0.095 0.028 0.051 0.083 0.064 0.059 0.071P22 0.004 0.003 0.059 0.002 0.006 0.009 0.005 0.055 0.005 0.006 0.006 0.004 0.007 0.011 0.009 0.009 0.059 0.012 0.010 0.009 0.011 0.007 0.007 0.005 0.008P23 0.062 0.032 0.105 0.053 0.105 0.114 0.105 0.095 0.031 0.040 0.037 0.066 0.067 0.107 0.106 0.111 0.106 0.118 0.110 0.045 0.117 0.048 0.045 0.086 0.101P24 0.019 0.022 0.077 0.015 0.072 0.078 0.043 0.037 0.021 0.058 0.025 0.056 0.057 0.076 0.090 0.094 0.095 0.099 0.096 0.032 0.099 0.084 0.065 0.026 0.083P25 0.054 0.056 0.040 0.047 0.069 0.090 0.040 0.037 0.021 0.026 0.024 0.024 0.023 0.038 0.039 0.090 0.086 0.074 0.039 0.060 0.092 0.067 0.066 0.029 0.036
294
D.
Mathivathanan
et al.
/ R
esources, Conservation
and R
ecycling 128
(2018) 284–305
Table 9Total Relation Matrix − Government perspective.
Practice P1 P2 P3 P4 P5 P6 P7 P8 P9 P10 P11 P12 P13 P14 P15 P16 P17 P18 P19 P20 P21 P22 P23 P24 P25
P1 0.032 0.072 0.089 0.055 0.081 0.107 0.104 0.096 0.070 0.076 0.090 0.069 0.071 0.093 0.085 0.083 0.087 0.090 0.084 0.077 0.086 0.098 0.091 0.069 0.081P2 0.062 0.041 0.089 0.040 0.079 0.105 0.104 0.080 0.086 0.092 0.091 0.085 0.072 0.092 0.082 0.082 0.087 0.089 0.082 0.079 0.084 0.100 0.075 0.068 0.094P3 0.019 0.025 0.043 0.016 0.028 0.066 0.036 0.030 0.055 0.060 0.058 0.026 0.075 0.087 0.037 0.035 0.087 0.084 0.082 0.078 0.034 0.081 0.075 0.056 0.059P4 0.082 0.095 0.110 0.029 0.102 0.114 0.096 0.088 0.092 0.099 0.098 0.076 0.093 0.116 0.103 0.103 0.063 0.065 0.059 0.084 0.107 0.094 0.097 0.092 0.104P5 0.048 0.052 0.059 0.011 0.027 0.065 0.078 0.072 0.019 0.053 0.022 0.017 0.017 0.031 0.029 0.028 0.027 0.065 0.073 0.054 0.074 0.028 0.024 0.019 0.059P6 0.084 0.095 0.098 0.072 0.106 0.071 0.113 0.106 0.074 0.096 0.096 0.044 0.045 0.118 0.111 0.109 0.097 0.117 0.110 0.082 0.114 0.109 0.099 0.091 0.106P7 0.015 0.019 0.024 0.011 0.066 0.070 0.026 0.022 0.048 0.052 0.050 0.046 0.017 0.024 0.020 0.020 0.022 0.068 0.020 0.052 0.022 0.022 0.020 0.015 0.049P8 0.045 0.019 0.020 0.009 0.055 0.057 0.024 0.022 0.012 0.014 0.016 0.011 0.010 0.054 0.054 0.055 0.023 0.058 0.025 0.016 0.074 0.022 0.020 0.015 0.069P9 0.050 0.057 0.087 0.048 0.029 0.038 0.067 0.062 0.031 0.081 0.064 0.062 0.080 0.088 0.032 0.031 0.038 0.035 0.031 0.081 0.031 0.085 0.060 0.058 0.033P10 0.008 0.012 0.052 0.007 0.013 0.018 0.049 0.046 0.048 0.018 0.048 0.047 0.049 0.052 0.014 0.014 0.020 0.017 0.014 0.051 0.013 0.066 0.014 0.013 0.015P11 0.058 0.069 0.105 0.024 0.076 0.088 0.103 0.078 0.087 0.093 0.046 0.087 0.105 0.123 0.082 0.079 0.102 0.073 0.083 0.095 0.081 0.099 0.087 0.069 0.047P12 0.012 0.017 0.025 0.041 0.017 0.052 0.054 0.018 0.051 0.054 0.053 0.019 0.052 0.057 0.020 0.020 0.051 0.020 0.018 0.055 0.019 0.023 0.017 0.016 0.018P13 0.015 0.051 0.074 0.043 0.052 0.058 0.059 0.022 0.055 0.059 0.056 0.052 0.024 0.030 0.021 0.020 0.024 0.023 0.021 0.058 0.021 0.027 0.022 0.020 0.023P14 0.016 0.026 0.070 0.013 0.027 0.036 0.035 0.029 0.055 0.058 0.058 0.055 0.058 0.040 0.066 0.065 0.086 0.082 0.080 0.076 0.063 0.080 0.028 0.053 0.057P15 0.016 0.052 0.029 0.009 0.074 0.063 0.063 0.057 0.018 0.021 0.052 0.017 0.016 0.063 0.032 0.061 0.074 0.067 0.079 0.023 0.079 0.025 0.022 0.019 0.027P16 0.028 0.065 0.046 0.021 0.075 0.097 0.093 0.088 0.058 0.034 0.063 0.060 0.029 0.096 0.093 0.046 0.080 0.085 0.079 0.036 0.097 0.088 0.081 0.077 0.089P17 0.011 0.021 0.075 0.008 0.024 0.031 0.031 0.024 0.020 0.036 0.038 0.034 0.051 0.065 0.077 0.074 0.031 0.078 0.077 0.068 0.073 0.027 0.024 0.020 0.023P18 0.049 0.039 0.080 0.012 0.080 0.071 0.084 0.063 0.019 0.023 0.025 0.019 0.019 0.039 0.082 0.064 0.079 0.043 0.086 0.026 0.083 0.028 0.073 0.023 0.033P19 0.009 0.013 0.049 0.006 0.018 0.051 0.050 0.016 0.012 0.013 0.016 0.011 0.011 0.067 0.067 0.049 0.037 0.070 0.023 0.015 0.021 0.017 0.015 0.013 0.016P20 0.027 0.082 0.083 0.024 0.043 0.084 0.096 0.073 0.084 0.089 0.089 0.085 0.087 0.103 0.092 0.092 0.101 0.053 0.047 0.045 0.049 0.096 0.085 0.081 0.090P21 0.025 0.076 0.071 0.017 0.088 0.094 0.089 0.085 0.025 0.029 0.029 0.024 0.022 0.090 0.089 0.088 0.045 0.098 0.091 0.030 0.046 0.084 0.064 0.058 0.087P22 0.004 0.003 0.055 0.002 0.005 0.007 0.004 0.052 0.004 0.005 0.005 0.003 0.007 0.010 0.008 0.008 0.055 0.011 0.009 0.008 0.009 0.006 0.006 0.004 0.007P23 0.059 0.038 0.095 0.053 0.094 0.103 0.096 0.088 0.030 0.037 0.037 0.060 0.062 0.100 0.097 0.081 0.096 0.106 0.099 0.040 0.101 0.043 0.039 0.078 0.093P24 0.058 0.083 0.083 0.068 0.076 0.086 0.052 0.045 0.032 0.067 0.038 0.062 0.063 0.084 0.096 0.095 0.097 0.100 0.097 0.039 0.098 0.092 0.070 0.033 0.090P25 0.051 0.058 0.035 0.045 0.063 0.084 0.037 0.034 0.022 0.025 0.026 0.021 0.021 0.037 0.037 0.081 0.080 0.067 0.035 0.056 0.083 0.063 0.061 0.026 0.033

D.
Mathivathanan
et al.
/ R
esources, Conservation
and R
ecycling 128
(2018) 284–305
295
Table 10Total Relation Matrix − Societal perspective.
Practice P1 P2 P3 P4 P5 P6 P7 P8 P9 P10 P11 P12 P13 P14 P15 P16 P17 P18 P19 P20 P21 P22 P23 P24 P25
P1 0.035 0.073 0.103 0.058 0.096 0.126 0.102 0.115 0.074 0.082 0.079 0.061 0.080 0.103 0.101 0.102 0.100 0.106 0.100 0.087 0.106 0.110 0.091 0.085 0.092P2 0.069 0.040 0.104 0.043 0.096 0.111 0.104 0.099 0.093 0.085 0.098 0.097 0.084 0.106 0.101 0.102 0.102 0.106 0.101 0.091 0.106 0.095 0.092 0.087 0.107P3 0.023 0.028 0.056 0.018 0.041 0.086 0.049 0.046 0.063 0.069 0.067 0.034 0.089 0.101 0.051 0.052 0.103 0.102 0.099 0.091 0.051 0.094 0.093 0.072 0.072P4 0.083 0.071 0.094 0.024 0.107 0.104 0.096 0.094 0.073 0.080 0.077 0.076 0.078 0.096 0.091 0.092 0.060 0.064 0.059 0.084 0.096 0.091 0.085 0.082 0.088P5 0.056 0.057 0.072 0.014 0.039 0.098 0.093 0.089 0.025 0.061 0.027 0.023 0.023 0.041 0.041 0.043 0.037 0.081 0.091 0.064 0.094 0.036 0.035 0.031 0.071P6 0.091 0.079 0.112 0.076 0.125 0.089 0.129 0.111 0.076 0.086 0.083 0.049 0.051 0.113 0.130 0.132 0.111 0.137 0.130 0.093 0.137 0.119 0.117 0.110 0.119P7 0.019 0.021 0.032 0.013 0.078 0.084 0.036 0.030 0.055 0.059 0.056 0.054 0.022 0.030 0.028 0.029 0.029 0.080 0.029 0.061 0.031 0.028 0.027 0.023 0.058P8 0.051 0.020 0.028 0.011 0.067 0.071 0.033 0.033 0.014 0.017 0.016 0.014 0.015 0.062 0.067 0.069 0.030 0.070 0.035 0.021 0.088 0.027 0.028 0.025 0.079P9 0.058 0.062 0.105 0.053 0.042 0.057 0.083 0.081 0.039 0.095 0.092 0.092 0.097 0.106 0.045 0.046 0.052 0.049 0.043 0.097 0.045 0.100 0.077 0.073 0.043P10 0.011 0.014 0.062 0.009 0.019 0.028 0.058 0.058 0.055 0.023 0.056 0.055 0.058 0.061 0.020 0.020 0.026 0.023 0.019 0.059 0.020 0.076 0.021 0.019 0.020P11 0.066 0.072 0.123 0.026 0.093 0.111 0.120 0.099 0.096 0.104 0.051 0.100 0.104 0.124 0.099 0.100 0.102 0.090 0.100 0.109 0.102 0.113 0.108 0.086 0.059P12 0.016 0.020 0.035 0.047 0.026 0.067 0.066 0.028 0.060 0.063 0.062 0.027 0.079 0.084 0.028 0.029 0.062 0.029 0.025 0.066 0.028 0.031 0.027 0.025 0.024P13 0.018 0.054 0.066 0.047 0.060 0.068 0.068 0.029 0.061 0.064 0.062 0.060 0.028 0.034 0.026 0.026 0.028 0.029 0.027 0.066 0.027 0.031 0.028 0.025 0.027P14 0.031 0.037 0.118 0.024 0.060 0.123 0.066 0.111 0.070 0.078 0.076 0.076 0.097 0.070 0.118 0.119 0.120 0.122 0.101 0.100 0.105 0.108 0.107 0.101 0.088P15 0.020 0.054 0.039 0.010 0.088 0.079 0.074 0.071 0.020 0.025 0.056 0.022 0.022 0.073 0.042 0.077 0.086 0.081 0.094 0.029 0.098 0.031 0.032 0.028 0.034P16 0.025 0.059 0.047 0.017 0.083 0.092 0.083 0.081 0.023 0.029 0.027 0.061 0.028 0.082 0.087 0.055 0.084 0.093 0.088 0.034 0.109 0.072 0.090 0.087 0.094P17 0.014 0.021 0.088 0.010 0.033 0.043 0.040 0.034 0.022 0.042 0.042 0.040 0.060 0.075 0.090 0.090 0.039 0.092 0.091 0.078 0.090 0.033 0.034 0.029 0.030P18 0.056 0.041 0.094 0.014 0.097 0.089 0.098 0.077 0.022 0.028 0.027 0.024 0.026 0.048 0.099 0.100 0.094 0.058 0.104 0.033 0.106 0.035 0.087 0.034 0.042P19 0.013 0.016 0.064 0.008 0.032 0.071 0.065 0.030 0.015 0.018 0.019 0.017 0.017 0.082 0.085 0.086 0.050 0.090 0.037 0.022 0.087 0.027 0.030 0.025 0.027P20 0.032 0.087 0.100 0.026 0.057 0.105 0.113 0.093 0.093 0.101 0.098 0.100 0.102 0.118 0.095 0.097 0.117 0.068 0.062 0.057 0.065 0.109 0.104 0.101 0.104P21 0.026 0.027 0.081 0.015 0.100 0.110 0.100 0.099 0.022 0.029 0.027 0.025 0.025 0.098 0.103 0.104 0.052 0.112 0.105 0.034 0.060 0.090 0.075 0.070 0.079P22 0.005 0.004 0.062 0.002 0.007 0.011 0.006 0.059 0.005 0.007 0.007 0.005 0.009 0.013 0.011 0.011 0.062 0.014 0.012 0.010 0.012 0.008 0.008 0.007 0.009P23 0.067 0.038 0.114 0.057 0.117 0.131 0.117 0.112 0.035 0.044 0.041 0.071 0.075 0.117 0.121 0.123 0.116 0.130 0.124 0.051 0.129 0.055 0.056 0.101 0.110P24 0.023 0.028 0.085 0.017 0.081 0.091 0.052 0.049 0.024 0.064 0.029 0.061 0.064 0.085 0.104 0.105 0.104 0.109 0.107 0.037 0.109 0.092 0.075 0.037 0.091P25 0.064 0.084 0.057 0.053 0.108 0.117 0.093 0.090 0.029 0.037 0.034 0.034 0.033 0.058 0.096 0.113 0.107 0.100 0.096 0.074 0.118 0.082 0.082 0.094 0.054

2 serva
(Sts2dTacitteRcifiadd
pt‘
st
A
wtic
w
S
N
R
M
D
R
Diii
dir
96 D. Mathivathanan et al. / Resources, Con
Zhu et al., 2011). The DEMATEL method was first developed by thecience and Human Affairs Program of the Battelle Memorial Insti-ute of Geneva; it was designed in 1973 by Fontela and Gabustotudy the complex and interlinked group of problems (Tzeng et al.,007; Wu and Lee, 2007). DEMATEL provides a structural modelepicting the relationships between criteria under consideration.he method divides criteria into two groups − cause and effect −nd visualizes the causal relationships through relationship matri-es and diagraphs (Falatoonitoosi et al., 2013). The present aims to explore the prominent SSCM practices in automotive indus-ries. This objective has to be established while considering that a)hese practices are not independent of each other and b) that thelements of sustainability are not mutually exclusive (Carter andogers, 2008). Hence, techniques such as Analytic Hierarchy Pro-ess can be eliminated because it assumes that the elements arendependent of each other. The prominent practice is to be foundrom a group of practices, while keeping in mind that they are notndependent of each other. For this purpose, we find DEMATEL asn apt tool for the analysis done in the current study. The proce-ural steps of this method are adopted from Tseng (2009) and areescribed below.
Step 1: Finding the Initial Direct Relation (Average) matrix, “A”The experts provide their opinion regarding the influences of the
ractices in terms of numbers based on a 0–4 scalewith ‘0′ referringo no influence, ‘1’ to low influence, ‘2’ to medium influence, and3′ and ‘4′ to high and very high influence, respectively.
If there are N number of experts and ‘n’ number of criteria con-idered, then each expert fills a matrix Wk = [wij]nxn, k = 1 to N, thenhe average matrix is calculated as,
= [aij]nxn = (∑
Wk)/N (1)
The matrix, A is also called the Initial Direct Relation Matrix,here, aij is denoted as the degree to which the criterion, ‘i’ affects
he criterion. Hence, the Initial Direct Relation matrix indicates thenitial direct effect each criterion exerts on and receives from otherriteria.
Step 2: Obtaining the Normalized Relation Matrix, “X”The Initial Direct Relation matrix is normalized using a value, S,
hich is calculated as follows.
= max{max∑
aij(j = 1, ., n), max∑
aij(i = 1, ., n)} (2)
ormalizedmatrix, X = A/S (3)
All the elements of the normalized matrix lie between 0 and 1.Step 3: Obtaining the Total Relation Matrix, “M”The Total Relation Matrix is calculated from the Normalized
elation Matrix as follows,
= X(I−X)−1 (4)
where“I” is an identity matrix of order, nxn.Step 4: Obtaining the sum of rows and columnsD denotes the sum of the rows of the Total Relation Matrix.
=∑
mij,j = 1, ., n (5)
R denotes the sum of columns of the Total Relation Matrix.
=∑
mij, i = 1, ., n (6)
i shows the net effects, both direct and indirect, given by criterion to the other criteria j = 1, 2, . . ., n. The total effects, direct andndirect, received by criterion j from the other criteria i = 1, 2, . . .,ns represented by Rj.
As a result, while i = j the sum (D + R) that is called “Prominence”epicts the degree of influence role of criterion ‘i’ in system. The
ndex that shows the total effects both given and received by crite-ion i. The difference, (D-R) that is called “Relation” depicts the net
tion and Recycling 128 (2018) 284–305
effect that criterion i donates to the system. Criterion i with positiveD-R values will go to the cause group and when (D-R) is negative,criterion i goes to the effect group.
Step 5: Obtain Causal and Effect DiagramA causal and effect diagram is obtained by means of plotting the
(D + R, D-R) values of all the criteria. Thus the procedure for DEMA-TEL has been explained and the subsequent section deals with theapplication of this procedure to the identified problem.
3.1. Application of the proposed framework
3.1.1. Questionnaire development and data collectionThe SSCM practices as a whole were collected from the literature
review and we identified that these practices can be categorizedunder specific groups on the basis of commonality in their ori-entations and functions. The six major categories identified forthe classification are management, supplier, collaboration, design,internal, and society. Through discussions with industrial expertsat managerial levels in the automotive sector, we validated thecategorization of SSCM practices under these six major groups.A total tally of 50 experienced personnel from the automotiveindustries from Tamilnadu, Southern India were contacted throughe-mails and face to face meetings to arrive at the conclusion ofwhich practices fall under which category. These people are expertsin the automotive field and have experience levels of more than10–15 years. From various automotive industries, the respondentsbelonged to different departments, including product support tech-nology, product manufacturing, Research and Design. We receivedresponses from 33 units and, from these responses, we arrivedwith the categorization. The variations in responses created somehavoc in the categorization process, but with further face to facepersonal meetings with the experts, all differences in the opin-ions were sorted out and we formulated the final classification andexplanations through consensus, shown in Table 1.
Once we came up with the final list, a DEMATEL based ques-tionnaire was prepared for the proposed 25 practices. In order toreach multi stakeholder perspectives, we contacted experts in allthree groups in and around Tamilnadu, India, including industrialmanagers, government officials, and societal and environmentalactivists. A total of 88 individuals comprising all three stakeholdergroups were contacted. Some neglected the survey due to busywork schedules and lack of interest. Finally, we had a sum of 65 unitswho responded to our survey. The SSCM practices were explainedto them and they were asked to rate the influence of practices bypair-wise comparisons based on the 0–4 scale mentioned above.
3.1.2. Application of DEMATELThe raw data is obtained from the three stakeholder groups in
the form of relation matrices and DEMATEL method is applied asfollows.
Step 1: Individual responses are combined accordingly intothree stakeholder groups (management, government, and soci-etal/environmental) using Eq. (1). The above par value for eachsingle cell in the matrix is considered to obtain the Initial DirectRelation matrix for each of the three perspectives and is shownbelow in Tables 2–4.
Step 2: The Normalized value, S is calculated using Eq. (2), andthe Initial Direct Relation matrix, A is divided throughout by S toobtain the Normalized Relation Matrix, X, using Eq. (3).The Normal-ized Relation Matrix for each of the three stakeholder perspectivesis shown in Tables 5–7.
Step 4: The sums of rows and columns of the Total Relation
Matrix are obtained using Eq. (5) and Eq. (6) and are shown inTables 11–13. The sums of the row values calculate the sum ofinfluence given and are denoted as D. The sums of column val-ues give the sum of influence received and are denoted as R. A
D. Mathivathanan et al. / Resources, Conservation and Recycling 128 (2018) 284–305 297
Table 11Sum of influences given and received for each criterion − Management Perspec-tive.(For interpretation of the references to colour in the Table legend, the reader isreferred to the web version of this article.)
Prac�ce D s um R sum D+R D-RP1 2.2 252 0.8 743 3.0 995 1.3 509P2 2.2 184 0.9 877 3.2 060 1.2 307P3 1.4 594 1.8 145 3.2 739 -0.3 551P4 2.4 738 0.6 288 3.1 026 1.8 450P5 1.2 063 1.5 618 2.7 681 -0.3 555P6 2.3 883 1.8 661 4.2 543 0.5 222P7 0.9 040 1.7 429 2.6 469 -0.8 388P8 0.8 579 1.4 731 2.3 310 -0.6 152P9 1.5 725 1.0 954 2.6 679 0.4 771
P10 0.7 908 1.3 298 2.1 205 -0.5 390P11 2.2 222 1.2 529 3.4 751 0.9 694P12 0.8 784 1.1 954 2.0 738 -0.3 169P13 1.0 646 1.2 350 2.2 996 -0.1 704P14 1.4 192 1.8 186 3.2 377 -0.3 994P15 1.1 482 1.5 814 2.7 295 -0.4 332P16 1.4 291 1.7 032 3.1 323 -0.2 741P17 1.1 206 1.7 265 2.8 471 -0.6 059P18 1.3 915 1.8 234 3.2 149 -0.4 318P19 0.9 014 1.6 502 2.5 516 -0.7 488P20 1.9 579 1.4 224 3.3 803 0.5 355P21 1.4 650 1.8 306 3.2 956 -0.3 655P22 0.3 274 1.5 766 1.9 040 -1.2 493P23 2.0 122 1.3 778 3.3 900 0.6 344
totptsTT
ataSeDbT
4
TpvrTTuhttosOa
Table 12Sum of influences given and received for each criterion − Government Perspec-tive.(For interpretation of the references to colour in the Table legend, the reader isreferred to the web version of this article.)
Prac�ce D s um R sum D+R D-RP1 2.0 371 0.8 827 2.9 198 1.1 544P2 2.0 397 1.1 807 3.2 204 0.8 590P3 1.3 315 1.6 466 2.9 781 -0.3 150P4 2.2 593 0.6 837 2.9 430 1.5 756P5 1.0 503 1.4 012 2.4 516 -0.3 509P6 2.3 622 1.7 163 4.0 785 0.6 459P7 0.8 212 1.6 441 2.4 653 -0.8 229P8 0.8 014 1.3 953 2.1 967 -0.5 938P9 1.3 592 1.1 077 2.4 668 0.2 515
P10 0.7 170 1.2 860 2.0 030 -0.5 691P11 2.0 415 1.2 635 3.3 051 0.7 780P12 0.7 975 1.0 902 1.8 878 -0.2 927P13 0.9 300 1.1 550 2.0 850 -0.2 251P14 1.3 121 1.7 581 3.0 702 -0.4 460P15 1.0 577 1.5 256 2.5 833 -0.4 679P16 1.7 017 1.4 831 3.1 848 0.2 187P17 1.0 380 1.5 888 2.6 268 -0.5 508P18 1.2 401 1.6 631 2.9 032 -0.4 231P19 0.6 823 1.5 042 2.1 865 -0.8 219P20 1.8 832 1.3 221 3.2 054 0.5 611P21 1.5 413 1.5 612 3.1 026 -0.0 199P22 0.2 986 1.5 007 1.7 993 -1.2 021P23 1.8 245 1.2 685 3.0 930 0.5 560P24 1.8 039 1.0 842 2.8 881 0.7 197P25 1.1 806 1.3 992 2.5 798 -0.2 186
Table 13Sum of influences given and received for each criterion − Societal Perspective.(Forinterpretation of the references to colour in the Table legend, the reader is referredto the web version of this article.)
Prac�ce D sum R sum D+R D-RP1 2.2 664 0.9 719 3.2 383 1.2 946P2 2.3188 1.1050 3.4238 1.2139P3 1.6 530 1.9 414 3.5 945 -0.2 884P4 2.0 469 0.6 950 2.7 419 1.3 519P5 1.3 416 1.7 507 3.0 923 -0.4 090P6 2.6 042 2.1 606 4.7 648 0.4 436P7 1.0 126 1.9 446 2.9 571 -0.9 320P8 0.9 911 1.8 198 2.8 109 -0.8 287P9 1.7 306 1.1 639 2.8 945 0.5 666
P10 0.8 889 1.3 901 2.2 789 -0.5 012P11 2.3 530 1.3 077 3.6 607 1.0 453P12 1.0 538 1.2 797 2.3 336 -0.2 259P13 1.0 600 1.3 660 2.4 260 -0.3 060P14 2.2 272 1.9 786 4.2 058 0.2 485P15 1.2 850 1.8 773 3.1 623 -0.5 923P16 1.6 263 1.9 218 3.5 481 -0.2 954P17 1.2 612 1.8 712 3.1 324 -0.6 100P18 1.5 341 2.0 354 3.5 695 -0.5 013P19 1.0 320 1.8 768 2.9 088 -0.8 448P20 2.2065 1.5502 3.7567 0.6564P21 1.6 688 2.0 196 3.6 884 -0.3 508P22 0.3 634 1.6 931 2.0 565 -1.3 296P23 2.2535 1.6097 3.8632 0.6438P24 1.7 227 1.4 551 3.1 778 0.2 676
P24 1.5 185 1.1 753 2.6 938 0.3 432P25 1.2 684 1.4 778 2.7 461 -0.2 094
hreshold value is set for the elements of Total Relation Matrix inrder to find the relevant Causal Diagram. The value is taken ashe (Mean + Standard Deviation) of the Total Relation Matrix. In theresent case, the threshold values are calculated in each case andhe values higher than this in the Total Relation Matrix were con-idered for further analysis of the relationships between practices.hese values for each perspective are highlighted and shown inotal Relation Matrix (Tables 8–10).
Step 5: The final step is to obtain the Causal Diagram which isn X-Y plot with D + R values representing the prominences takinghe x-axis and D-R values representing the relations taking the y-xis. By plotting D + R and D-R values in the plot we analyze theSCM practices. Tables 11–13 show the D + R and D-R values forach perspective and Figs. 2–4 show the graphical plot, the Causaliagram with the degree of prominences and relations. The com-ined results including all three perspectives are represented inable 14 and Fig. 5 respectively.
. Results and discussions
This section reveals the results obtained by using the DEMA-EL method. The prominence and relations of the correspondingractices are summarized based on Tables 11–13 involving the indi-idual perspectives. The combined perspective, the average of theesults obtained of all the individual perspectives, is presented inable 14. The positive D-R values highlighted in each of the aboveables 11–14 indicate that the practices associated with these val-es are the prominent ones. The values in the tables represent theorizontal axis point’s values (D + R, the prominence values) andhe vertical axis point’s values (D-R, the relation values) for each ofhe practices, and are the base values on which the diagraphs are
btained. These diagraphs shown in Figs. 2–5 offer a pictorial repre-entation of the causal and effect relationship among the practices.ne can easily identify the prominent practices based on the causend effect groups explained in the diagraphs. It is also described asP25 1.9 055 1.6 223 3.5 278 0.2 832
an interrelationship diagram or Impact Relationship Map because
it depicts the factors and presents the inter influences. The crite-ria having positive D-R values fall under the cause group and therest form the effect group. The relation between these practices is
298 D. Mathivathanan et al. / Resources, Conservation and Recycling 128 (2018) 284–305
the SS
drahitf(sp
Fig. 2. Prominence and Relation between
epicted by means of arrows. The arrows in the figure represent theelationship between two practices. The tail of the arrow is gener-lly at the practice that exerts influence on the other practice; theead of the arrow is at the practice that is the net receiver of the
nfluence. The elements in the cause group are the influencing cri-eria and those in the effect group are the influenced criteria. In theollowing sections we discuss the results under two subsections:1) the similarities and differences from the multi stakeholder per-pectives, and (2) a comparison of individual results with combined
erspective results.CM practices—Management perspective.
4.1. Multi stakeholder perspective −Similarities and differences
Prominent practices with high influential effects over the otherpractices, as found in each category of perspectives, are summa-rized in Table 15 below. This table shows the most influentialpractices in each perspective and the combined results. It can beseen that practices P1, P2, P4, P6, P9, P11, P20, P23, and P24 fallin the cause group for all perspectives. In each of the perspec-tives,(P4), commitment from the management towards SSCM, gets
the highest priority, proving that management commitment tomove forward from old traditional systems and practices is thefirst sign of change. Other practices cannot be followed voluntar-ily without the commitment from the management. The second
D. Mathivathanan et al. / Resources, Conservation and Recycling 128 (2018) 284–305 299
the S
iliebdsapwiPc
s
Fig. 3. Prominence and Relation between
tem in the list of prioritized practices is (P1), the triple bottomine approach. The triple bottom line approach ensures that equalmportance is given to all three dimensions of sustainability (social,nvironmental, and economic) in all strategic decisions to be madey the company, thereby incorporating sustainability into the foun-ation of the organization. Practice (P2), supply chain orientation,cores third in the list. All these three top prioritized practicesre management-oriented practices. The other common influentialractices are P6, P9, P11, P20, P23, and P24. The common practiceshich fall under the effect group make a slightly longer list. Those
n the effect group are P3, P5, P7, P8, P10, P12, P13, P15, P17, P18,
19, and P21. These practices are technically the antecedents of theausal practices.The causal group of practices in each perspective features theame practices as in the other perspectives, but there are a few
SCM practices—Government perspective.
uncommon practices noted. Those specific practices are high-lighted in Table 15. The uncommon practices that fall in the causalgroup are (P16), Redesigning processes for emissions reduction-activities, which ranked as a higher priority in the governmentalperspective, and (P14) and (P25), technological integration andworker safety and human rights, which earned higher priority inthe societal perspective. These are the practices which failed tomake the cut to the influential list in the combined perspective;apparently these practices did not catch the attention of manage-ment or government respondents as vital to the shift to SSCM. Thisresult suggests that management and government stakeholders
may prioritize economic benefits over human rights.
300 D. Mathivathanan et al. / Resources, Conservation and Recycling 128 (2018) 284–305
en the
4s
atPsioc
nt
Fig. 4. Prominence and Relation betwe
.2. Comparison of individual perspectives with the combinedtakeholder perspectives
Combined stakeholder perspectives are nothing but the aver-ge of the responses obtained from individual perspectives. Fromhe combined perspective, practices P1, P2, P4, P6, P9, P11, P20,23,and P24 form the nine elements of the cause group that areimilar to the individual perspectives. The most influential practices (P1), commitment from management towards sustainable devel-pment, and the least influential practice is (P22), cooperation with
ustomers, which coincides among all three perspectives.From this study we infer that although pressures from exter-al stakeholders exert influence, change has to come from withinhe organization to adopt SSCM practices. In a country like India,
SSCM practices—Societal perspective.
one of the leading producers of automobiles tries to move towardsSSCM from their own initiative to attain a competitive edge overother firms. Whereas compliance with mandatory practices, suchas regulations and certifications imposed by the government and byhuman rights, provides motivation to adopt SSCM practices, ulti-mately internal practices imposed by the management hold thekey to change. Practices such as employing the triple bottom lineapproach and incorporating supply chain considerations through-out all decision making aspects play a pivotal role in influencing theother practices. Hence, these are mandatory practices which are
prerequisites for the successful implementation of other practices.
D. Mathivathanan et al. / Resources, Conservation and Recycling 128 (2018) 284–305 301
Table 14Sum of influences given and received for each criterion − Combined Perspective.
Practice D sum R sum D + R D-R
P1 2.2223 0.9584 3.1807 1.2639P2 2.2798 1.1475 3.4272 1.1323P3 1.5265 1.8846 3.4111 −0.3581P4 2.4155 0.6861 3.1017 1.7294P5 1.2942 1.6252 2.9194 −0.3309P6 2.5155 1.9623 4.4777 0.5532P7 0.9442 1.8160 2.7602 −0.8718P8 0.9097 1.5875 2.4973 −0.6778P9 1.6092 1.1514 2.7607 0.4578P10 0.8214 1.3761 2.1975 −0.5547P11 2.2378 1.3134 3.5512 0.9244P12 0.9292 1.2338 2.1629 −0.3046P13 1.0701 1.2740 2.3441 −0.2039P14 1.6146 1.9132 3.5278 −0.2987P15 1.2168 1.6890 2.9058 −0.4723P16 1.6151 1.7622 3.3774 −0.1471P17 1.1760 1.7821 2.9582 −0.6061P18 1.4439 1.9155 3.3594 −0.4716P19 0.9101 1.7097 2.6198 −0.7997P20 2.0716 1.4707 3.5423 0.6010P21 1.5982 1.8741 3.4722 −0.2759P22 0.3405 1.6414 1.9820 −1.3009P23 2.1151 1.4484
P24 1.7109 1.2651
P25 1.4506 1.5510
Table 15Prominent SSCM practices under each perspective.(For interpretation of the refer-ences to colour in the Table legend, the reader is referred to the web version of thisarticle.)
Combined perspecti ve
Mana gemen t perspecti ve
Governmen t perspecti ve
Societal perspective
P1 P1 P1 P1P2 P2 P2 P2P4 P4 P4 P4P6 P6 P6 P6P9 P9 P9 P9P11 P11 P11 P11P20 P20 P16 P14P23 P23 P20 P20P24 P24 P23 P23
5
omSgpSttTw2aubttiit
try like India, the majority of the automotive sectors are owned by
P24 P24P25
. Conclusion
SSCM practices are implemented by automotive industries inrder to achieve sustainability. While stringent policies and govern-ent regulations of developed nations easily allow firms to adopt
SCM practices, industries in an emerging nation like India strug-le to do the same. They find it difficult to identify the prominentractices that have high influence over other practices to adoptSCM. Once those prominent practices are identified and effec-ively implemented, they act as enablers for many other practices;he firm can then follow all the necessary SSCM practices. DEMA-EL, a well-known MCDM technique, suits this kind of problemshere there are inter relationships within the criteria (Jia et al.,
015b). This method classifies the relationships between criterias influencing and being influenced. DEMATEL is a novel approachsed both to form and to analyze the cause and effect relationshipetween criteria (Yang et al., 2008) and/or to infer the inter rela-ionship among criteria considered (Lin and Tzeng, 2009). From
he results obtained from our analysis, we present the follow-ng conclusions. 25 SSCM practices followed in the automotivendustries were identified from the existing literature; all prac-ices aid the firm in achieving a sustainable supply chain through3.5635 0.66672.9760 0.44583.0016 −0.1004
which they may gain a competitive advantage over other firms.But concentrating effectively on all SSCM practices is practicallyimpossible. Hence, it is important to find the most prominent SSCMpractices, especially those that positively influence other prac-tices. The prominence and the influences of the 25 practices werestudied using DEMATEL from multi stakeholder perspectives. Themulti stakeholder collaboration is a majorly incorporated elementacross the globe and, hence, more attention is based on collab-oration between the various stakeholders for sustained success(McComb et al., 2016). Due to the complexity of the data anddue to the availability of only qualitative data, experts from rel-evant fields in south India were targeted and their opinions werecollected through questionnaire surveys. This study explored theviews of management, government, and societal stakeholders onSSCM implementation. Although the stakeholders have a differencein their preferences towards practices, the top practices rankedin each perspective were the same. The study revealed that forautomotive sectors of India, management commitment, includingsupply chain orientation and the triple bottom line approach inall aspects of the supply chain, are the most prominent practices.These three factors act as driving forces for the remaining prac-tices to improve sustainability of the firm. By improving the causegroup, the effect group will also be easily improved (Falatoonitoosiet al., 2013). Hence, these prominent practices should be focusedupon and maintained accordingly for better implementation ofother practices and for sustainability. All the top practices identifiedare management-related practices in each of the three stakeholderperspectives and also in the combined perspectives. This findingreveals that in emerging nations such as India, the internal commit-ment from the management (P4) plays a larger role in identifyingthe way forward towards sustainability than governmental rulesand regulations. The study was mainly focused on the extremecase, considering the private sectors where management is com-pletely responsible for the firm’s action of implementing the rulesand regulations proposed by the government, but our results arealso applicable for general public automotive sectors. In a coun-
private organizations, and hence it is evident that the results of thecurrent study can be applied generally to all Indian automotive sec-
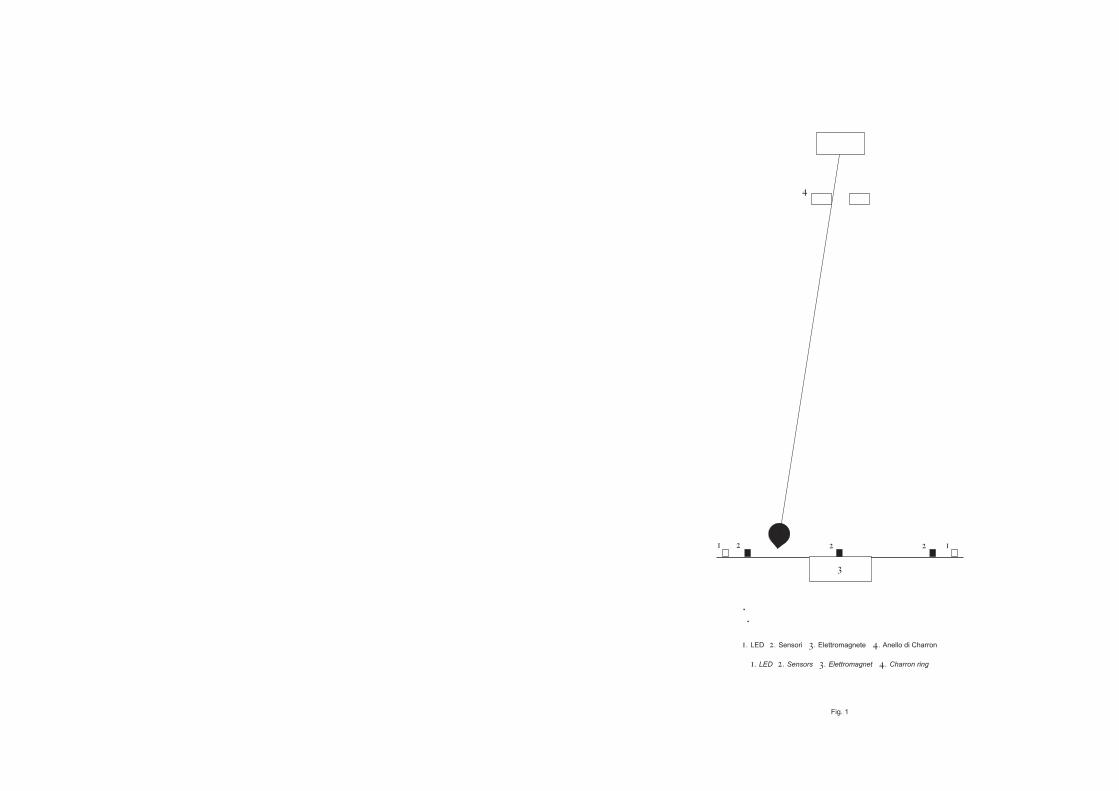
302 D. Mathivathanan et al. / Resources, Conservation and Recycling 128 (2018) 284–305
n the
tt
6
eIfiTtts
Fig. 5. Prominence and Relation betwee
ors. The managerial implications, limitations, and future scope ofhe study are discussed in the following section.
. Managerial implications
The current study includes managerial level implications byxploring dominant SSCM practices in automotive industries in anndian scenario; it also provides a scientific approach that identi-es and evaluates the inter influences among the SSCM practices.
he outcome of the study helps managers of automotive industrieso identify, prioritize, and adopt appropriate practices for the shiftowards SSCM. The current work classified 25 SSCM practices intoix main categories and provided insights on their nature. One ofSSCM practices—Combined perspective.
the implications is identifying the categories under which the prac-tices fall. Once the categories are identified, it helps the managersto easily identify the performance-based practices which shouldbe emphasized. DEMATEL, a method to study the relationshipsamong the practices, helps the managers to understand the causeand effect type of relationships among the SSCM practices. Throughthis study, the inter influences between practices for implementa-tion of SSCM are explored, which will help industrial managers toeffectively implement SSCM by concentrating on the most effectivepractices. The multi stakeholder view helps to identify what each
stakeholder emphasizes, and the collective analysis of all stake-holders’ views provides an in-depth understanding of their viewswhile still respecting their varied importance. This study can help asa valuable tool to provide useful interpretational information both
servat
fnoauipair
7
pseiiIbfspiisae
aisiAttsst
R
A
A
A
A
B
B
B
B
B
B
B
D. Mathivathanan et al. / Resources, Con
or researchers and practitioners and to provide a basis for compa-ies trying to introduce and implement SSCM through a wide rangef practices, especially in a country like India which faces domesticnd international pressure in moving towards SSCM. The approachsed in the study provides a kick- start guidance on the effective
mplementation of SSCM considering the relationships among theractices. Organizations can identify the set of influential practicesnd implement them first, and then, introduce the other practicesn a sequential, step-by-step basis, utilizing the causal and effectelationship for the best performance.
. Limitations and future scope
In the present study, the inter relationships between SSCMractices of automotive industries have been studied from multitakeholder perspectives with the background of an emergingconomy, India. Future research may wish to pursue other emerg-ng nations such as Brazil or China, who have not been consideredn the present study. This study is based on experts’ opinions.ts limitations may include that practical implementation has noteen focused upon, and that this study builds on empirical insightsrom the judgment of automotive industry experts. There may beome scale of error in judgment. The other limitation is that theresent study evaluates the importance of any practice based on its
nfluence over the other practices. Practices which do not possessnter influences with other practices may also be vital practices,o incorporating a networking approach such as ANP and otherdvanced techniques can overcome such limitations (Govindant al., 2016b,c; Hong et al., 2017; Shen et al., 2013).
The present study is done on sustainability implementation inutomotive industries. Future studies may be extended to otherndustries in general. The practices implemented in other industryectors may vary in importance and influence. Hence, other specificndustry sectors, such as service, food etc., can be focused upon.nother extension could compare diverse scenarios by conducting
he same study in different countries, which may provide bet-er insights into their organizational cultures. Because the presenttudy is based on experts’ opinions, research by conducting casetudies of the practices in relevant industries might be done. Inhat case, real scenario influences can be studied and verified.
eferences
geron, B., Gunasekaran, A., Spalanzani, A., 2012. Sustainable supply management:an empirical study. Int. J. Prod. Econ. 140 (1), 168–182.
hmad, W.N.K.W., Rezaei, J., Tavasszy, L.A., de Brito, M.P., 2016b. Commitment toand preparedness for sustainable supply chain management in the oil and gasindustry. J. Environ. Manage. 180, 202–213.
shby, A., Leat, M., Hudson-Smith, M., 2012. Making connections: a review ofsupply chain management and sustainability literature. Supply Chain Manage.:Int. J. 17 (5), 497–516.
ttaran, M., Attaran, S., 2007. Collaborative supply chain management: the mostpromising practice for building efficient and sustainable supply chains. Bus.Process Manage. J. 13 (3), 390–404.
ansal, P., McKnight, B., 2009. Looking forward, pushing back and peeringsideways: analyzing the sustainability of industrial symbiosis. J. Supply ChainManage. 45 (4), 26–37.
eske, P., Seuring, S., 2014. Putting sustainability into supply chain management.Supply Chain Manage.: Int. J. 19 (3), 322–331.
eske, P., Land, A., Seuring, S., 2014. Sustainable supply chain managementpractices and dynamic capabilities in the food industry: a critical analysis ofthe literature. Int. J. Prod. Econ. 152, 131–143.
eske, P., 2012. Dynamic capabilities and sustainable supply chain management.Int. J. Phys. Distrib. Logist. Manage. 42 (4), 372–387.
idault, F., Despres, C., Butler, C., 1998. The drivers of cooperation between buyersand suppliers for product innovation. Res. Policy 26 (7), 719–732.
ouzon, M., Govindan, K., Rodriguez, C.M.T., Campos, L.M., 2016. Identification and
analysis of reverse logistics barriers using fuzzy Delphi method and AHP.Resour. Conserv. Recycl. 108, 182–197.randenburg, M., Govindan, K., Sarkis, J., Seuring, S., 2014. Quantitative models forsustainable supply chain management: developments and directions. Eur. J.Oper. Res. 233 (2), 299–312.
ion and Recycling 128 (2018) 284–305 303
Brundtland, G.H., 1987. World commission on environment and development. OurCommon Future, 383.
Burgess, K., Singh, P.J., Koroglu, R., 2006. Supply chain management: a structuredliterature review and implications for future research. Int. J. Oper. Prod.Manage. 26 (7), 703–729.
Carter, C.R., Liane Easton, P., 2011. Sustainable supply chain management:evolution and future directions. Int. J. Phys. Distrib. Logist. Manage. 41 (1),46–62.
Carter, C.R., Rogers, D.S., 2008. A framework of sustainable supply chainmanagement: moving toward new theory. Int. J. Phys. Distrib. Logist. Manage.38 (5), 360–387.
Carter, C.R., Kale, R., Grimm, C.M., 2000. Environmental purchasing and firmperformance: an empirical investigation. Transp. Res. Part E: Logist. Transp.Rev. 36 (3), 219–228.
Chen, I.J., Paulraj, A., 2004. Towards a theory of supply chain management: theconstructs and measurements. J. Oper. Manage. 22 (2), 119–150.
Croom, S., Romano, P., Giannakis, M., 2000. Supply chain management: ananalytical framework for critical literature review. Eur. J. Purch. SupplyManage. 6 (1), 67–83.
Delhi, S.I.N., 2015. Automotive mission plan 2016–2026—a curtain raiser. AutoTech Rev. 10 (4), 18–21.
Dehghanian, F., Mansoor, S., Nazari, M., 2011. A framework for integratedassessment of sustainable supply chain management. Industrial Engineeringand Engineering Management (IEEM), IEEE International Conference on (pp.279-283). IEEE (December).
Diabat, A., Govindan, K., 2011. An analysis of the drivers affecting theimplementation of green supply chain management. Resour. Conserv. Recycl.55 (6), 659–667.
Diabat, A., Kannan, D., Mathiyazhagan, K., 2014. Analysis of enablers forimplementation of sustainable supply chain management—a textile case. J.Clean. Prod. 83, 391–403.
Dubey, R., Gunasekaran, A., Papadopoulos, T., Childe, S.J., Shibin, K.T., Wamba, S.F.,2016. Sustainable supply chain management: framework and further researchdirections. J. Clean. Prod.
Dyllick, T., Hockerts, K., 2002. Beyond the business case for corporatesustainability. Bus. Strategy Environ. 11 (2), 130–141.
Edgeman, R., 2013. Sustainable enterprise excellence: towards a framework forholistic data-analytics. Corp. Gov. 13 (5), 527–540.
Egilmez, G., Kucukvar, M., Tatari, O., Bhutta, M.K.S., 2014. Supply chainsustainability assessment of the US food manufacturing sectors: a lifecycle-based frontier approach. Resour. Conserv. Recycl. 82, 8–20.
El-Berishy, N., Rügge, I., Scholz-Reiter, B., 2013. The interrelation betweensustainability and green logistics. In Manage. Control Prod. Logist. 6(September (1)), 527–531.
Elkington, J., 1998. Partnerships from cannibals with forks: the triple bottom lineof 21st-century business. Environ. Qual. Manage. 8 (1), 37–51.
Epstein, M.J., 2008. Making Sustainability Work. Greenleaf Publishing, Sheffield,UK.
Esfahbodi, A., Zhang, Y., Watson, G., 2016a. Sustainable supply chain managementin emerging economies: trade-offs between environmental and costperformance. Int. J. Prod. Econ.
Esfahbodi, A., Zhang, Y., Watson, G., Zhang, T., 2016b. Governance pressures andperformance outcomes of sustainable supply chain management—an empiricalanalysis of UK manufacturing industry. J. Clean. Prod., s1.
Faccio, M., Persona, A., Sgarbossa, F., Zanin, G., 2014. Sustainable SC through thecomplete reprocessing of end-of-life products by manufacturers: a traditionalversus social responsibility company perspective. Eur. J. Oper. Res. 233 (2),359–373.
Falatoonitoosi, E., Leman, Z., Sorooshian, S., Salimi, M., 2013. Decision-making trialand evaluation laboratory research journal of applied sciences. Eng. Technol. 5(13), 3476–3480.
Fiksel, J., 2003. Designing resilient, sustainable systems. Environ. Sci. Technol. 37(23), 5330–5339.
Font, X., Tapper, R., Schwartz, K., Kornilaki, M., 2008. Sustainable supply chainmanagement in tourism. Bus. Strategy Environ. 17 (4), 260–271.
Fossas-Olalla, M., Lopez-Sanchez, J.I., Minguela-Rata, B., 2010. Cooperation withsuppliers as a source of innovation. Afr. J. Bus. Manage. 4 (16), p.3491.
Gimenez, C., Tachizawa, E.M., 2012. Extending sustainability to suppliers: asystematic literature review. Supply Chain Manage.: Int. J. 17 (5), 531–543.
Giunipero, L.C., Hooker, R.E., Denslow, D., 2012. Purchasing and supplymanagement sustainability: drivers and barriers. J. Purch. Supply Manage. 18(4), 258–269.
Glover, J.L., Champion, D., Daniels, K.J., Dainty, A.J.D., 2014. An Institutional Theoryperspective on sustainable practices across the dairy supply chain. Int. J. Prod.Econ. 152, 102–111.
Gold, S., Seuring, S., Beske, P., 2010. Sustainable supply chain management andinter-organizational resources: a literature review. Corp. Soc. Responsib.Environ. Manage. 17 (4), 230–245.
Govindan, K., Chaudhuri, A., 2016. Interrelationships of risks faced by third partylogistics service providers: a DEMATEL based approach. Transp. Res. Part E:Logist. Transp. Rev. 90, 177–195.
Govindan, K., Jepsen, M.B., 2016. ELECTRE: a comprehensive literature review onmethodologies and applications. Eur. J. Oper. Res. 250 (1), 1–29.
Govindan, K., Khodaverdi, R., Jafarian, A., 2013. A fuzzy multi criteria approach formeasuring sustainability performance of a supplier based on triple bottom lineapproach. J. Clean. Prod. 47, 345–354.

3 serva
G
G
G
G
G
G
G
G
G
G
G
G
G
H
H
H
H
I
I
J
J
J
J
J
K
K
K
L
L
L
L
L
L
04 D. Mathivathanan et al. / Resources, Con
ovindan, K., Azevedo, S.G., Carvalho, H., Cruz-Machado, V., 2014a. Impact ofsupply chain management practices on sustainability. J. Clean. Prod. 85,212–225.
ovindan, K., Kannan, D., Shankar, K.M., 2014b. Evaluating the drivers of corporatesocial responsibility in the mining industry with multi-criteria approach: amulti-stakeholder perspective. J. Clean. Prod. 84, 214–232.
ovindan, K., Azevedo, S.G., Carvalho, H., Cruz-Machado, V., 2015a. Lean, green andresilient practices influence on supply chain performance: interpretivestructural modeling approach. Int. J. Environ. Sci. Technol. 12 (1), 15–34.
ovindan, K., Rajendran, S., Sarkis, J., Murugesan, P., 2015b. Multi criteria decisionmaking approaches for green supplier evaluation and selection: a literaturereview. J. Clean. Prod. 98, 66–83.
ovindan, K., Soleimani, H., Kannan, D., 2015c. Reverse logistics and closed-loopsupply chain: a comprehensive review to explore the future. Eur. J. Oper. Res.240 (3), 603–626.
ovindan, K., Shankar, K.M., Kannan, D., 2016a. Application of fuzzy analyticnetwork process for barrier evaluation in automotive parts remanufacturingtowards cleaner production—a study in an Indian scenario. J. Clean. Prod. 114,199–213.
ovindan, K., Shankar, K.M., Kannan, D., 2016b. Sustainable material selection forconstruction industry—a hybrid multi criteria decision making approach.Renew. Sustain. Energy Rev. 55, 1274–1288.
ovindan, K., Shankar, M., Kannan, D., 2016c. Supplier selection based on corporatesocial responsibility practices. Int. J. Prod. Econ.
ovindan, K., Seuring, S., Zhu, Q., Azevedo, S.G., 2016d. Accelerating the transitiontowards sustainability dynamics into supply chain relationship managementand governance structures. J. Clean. Prod. 112, 1813–1823.
ovindasamy, V., 2010. Sustainable Supply Chain Management (SSCM) Practices:Antecedents and Outcomes on Sustainable Supply Chain Performance DoctoralDissertation. USM.
uang Shi, V., Lenny Koh, S.C., Baldwin, J., Cucchiella, F., 2012. Natural resourcebased green supply chain management. Supply Chain Manage.: Int. J. 17 (1),54–67.
uide, V.D.R., 2000. Production planning and control for remanufacturing:industry practice and research needs. J. Oper. Manage. 18 (4), 467–483.
upta, S., Kumar, V., 2013. Sustainability as corporate culture of a brand forsuperior performance. J. World Bus. 48 (3), 311–320.
andfield, R., Sroufe, R., Walton, S., 2005. Integrating environmental managementand supply chain strategies. Bus. Strategy Environ. 14 (1), 1–19.
asan, M., 2013. Sustainable Supply Chain Management Practices and OperationalPerformance.
ong, X., Govindan, K., Xu, L., Du, P., 2017. Quantity and collection decisions in aclosed-loop supply chain with technology licensing. Eur. J. Oper. Res. 256 (3),820–829.
ussain, M., Khan, M., Al-Aomar, R., 2016. A framework for supply chainsustainability in service industry with Confirmatory Factor Analysis. Renew.Sustain. Energy Rev. 55, 1301–1312.
garashi, M., de Boer, L., Fet, A.M., 2013. What is required for greener supplierselection? A literature review and conceptual model development. J. Purch.Supply Manage. 19 (4), 247–263.
nderfurth, K., De Kok, A.G., Flapper, S.D.P., 2001. Product recovery in stochasticremanufacturing systems with multiple reuse options. Eur. J. Oper. Res. 133(1), 130–152.
ayaraman, V., Klassen, R., Linton, J.D., 2007. Supply chain management in asustainable environment. J. Oper. Manage. 25 (6), 1071–1074.
i, G., Gunasekaran, A., Yang, G., 2014. Constructing sustainable supply chain underdouble environmental medium regulations. Int. J. Prod. Econ. 147, 211–219.
ia, P., Diabat, A., Mathiyazhagan, K., 2015a. Analyzing the SSCM practices in themining and mineral industry by ISM approach. Resour. Policy 46, 76–85.
ia, P., Govindan, K., Kannan, D., 2015b. Identification and evaluation of influentialcriteria for the selection of an environmental shipping carrier using DEMATEL:a case from India. Int. J. Ship. Transp. Logist. 7 (6), 719–741.
ia, P., Govindan, K., Choi, T.M., Rajendran, S., 2015c. Supplier selection problems infashion business operations with sustainability considerations. Sustainability 7(2), 1603–1619.
annan, D., Govindan, K., Shankar, M., 2016. India: formalize recycling of electronicwaste. Nature 530 (7590), 281.
leindorfer, R., Singhal, K., Wassenhove, L.N., 2005. Sustainable operationsmanagement. Prod. Oper. Manage. 14 (4), 482–492.
oplin, J., Seuring, S., Mesterharm, M., 2007. Incorporating sustainability intosupply management in the automotive industry?the case of the VolkswagenAG. J. Clean. Prod. 15 (11), 1053–1062.
erberg Jorgensen, A., Steen Knudsen, J., 2006. Sustainable competitiveness inglobal value chains: how do small Danish firms behave? Corp. Gov.: Int. J. Bus.Soc. 6 (4), 449–462.
i, D., Wang, X., Chan, H.K., Manzini, R., 2014. Sustainable food supply chainmanagement. Int. J. Prod. Econ. 152, 1–8.
in, C.L., Tzeng, G.H., 2009. A value-created system of science (technology) park byusing DEMATEL. Expert Syst. Appl. 36 (6), 9683–9697.
in, R.J., 2013. Using fuzzy DEMATEL to evaluate the green supply chainmanagement practices. J. Clean. Prod. 40, 32–39.
inton, J.D., Klassen, R., Jayaraman, V., 2007. Sustainable supply chains: anintroduction. J. Oper. Manage. 25 (6), 1075–1082.
ozano, R., 2013. Sustainability inter-linkages in reporting vindicated: a study ofEuropean companies. J. Clean. Prod. 51, 57–65.
tion and Recycling 128 (2018) 284–305
Luthra, S., Govindan, K., Kannan, D., Mangla, S.K., Garg, C.P., 2017. An integratedframework for sustainable supplier selection and evaluation in supply chains.J. Clean. Prod. 140, 1686–1698.
Markman, G.D., Krause, D., 2016. Theory building surrounding sustainable supplychain management: assessing what we know, exploring where to go. J. SupplyChain Manage. 52 (2), 3–10.
Matos, S., Hall, J., 2007. Integrating sustainable development in the supply chain:the case of life cycle assessment in oil and gas and agricultural biotechnology.J. Oper. Manage. 25 (6), 1083–1102.
McComb, E.J., Boyd, S., Boluk, K., 2016. Stakeholder collaboration: a means to thesuccess of rural tourism destinations? A critical evaluation of the existence ofstakeholder collaboration within the Mournes, Northern Ireland. TourismHospital. Res. (p.1467358415583738).
Miemczyk, J., Johnsen, T.E., Macquet, M., 2012. Sustainable purchasing and supplymanagement: a structured literature review of definitions and measures at thedyad, chain and network levels. Supply Chain Manage.: Int. J. 17 (5), 478–496.
Moors, E.H., 2006. Technology strategies for sustainable metals productionsystems: a case study of primary aluminium production in The Netherlandsand Norway. J. Clean. Prod. 14 (12), 1121–1138.
Morali, O., Searcy, C., 2013. A review of sustainable supply chain managementpractices in Canada. J. Bus. Ethics 117 (3), 635–658.
Nagalingam, S.V., Kuik, S.S., Amer, Y., 2013. Performance measurement of productreturns with recovery for sustainable manufacturing. Rob. Comput. Integr.Manuf. 29 (6), 473–483.
Nikolaou, I.E., Evangelinos, K.I., Allan, S., 2013. A reverse logistics socialresponsibility evaluation framework based on the triple bottom line approach.J. Clean. Prod. 56, 173–184.
Orsato, R.J., Wells, P., 2007. The automobile industry & sustainability. J. Clean. Prod.15 (11), 989–993.
Pagell, M., Wu, Z., 2009. Building a more complete theory of sustainable supplychain management using case studies of 10 exemplars. J. Supply ChainManage. 45 (2), 37–56.
Power, D., 2005. Supply chain management integration and implementation: aliterature review. Supply Chain Manage.: Int. J. 10 (4), 252–263.
Renukappa, S., Akintoye, A., Egbu, C., Goulding, J., 2013. Carbon emission reductionstrategies in the UK industrial sectors: an empirical study. Int. J. Clim. ChangeStrategies Manage. 5 (3), 304–323.
Rostamzadeh, R., Govindan, K., Esmaeili, A., Sabaghi, M., 2015. Application of fuzzyVIKOR for evaluation of green supply chain management practices. Ecol. Indic.49, 188–203.
Sacaluga, A.M.M., Froján, J.E.P., 2014. Best practices in sustainable supply chainmanagement: a literature review. In: Managing Complexity. SpringerInternational Publishing, pp. M209–M216.
Sarkis, J., 2001. Manufacturing’s role in corporate environmentalsustainability-Concerns for the new millennium. Int. J. Oper. Prod. Manage. 21(5/6), 666–686.
Sarkis, J., 2003. A strategic decision framework for green supply chainmanagement. J. Clean. Prod. 11 (4), 397–409.
Seuring, S., Müller, M., 2008. From a literature review to a conceptual frameworkfor sustainable supply chain management. J. Clean. Prod. 16 (15), 1699–1710.
Seuring, S., 2013. A review of modeling approaches for sustainable supply chainmanagement. Decis. Support Syst. 54 (4), 1513–1520.
Shaharudin, M.R., Govindan, K., Zailani, S., Tan, K.C., 2015. Managing productreturns to achieve supply chain sustainability: an exploratory study andresearch propositions. J. Clean. Prod. 101, 1–15.
Shen, L., Olfat, L., Govindan, K., Khodaverdi, R., Diabat, A., 2013. A fuzzy multicriteria approach for evaluating green supplier’s performance in green supplychain with linguistic preferences. Resour. Conserv. Recycl. 74, 170–179.
Singh, S., Olugu, E.U., Fallahpour, A., 2014. Fuzzy-based sustainable manufacturingassessment model for SMEs. Clean Technol. Environ. Policy 16 (5), 847–860.
Skjoett-Larsen, T., Thernøe, C., Andresen, C., 2003. Supply chain collaboration:theoretical perspectives and empirical evidence. Int. J. Phys. Distrib. Logist.Manage. 33 (6), 531–549.
Smith, L., Ball, P., 2012. Steps towards sustainable manufacturing throughmodelling material, energy and waste flows. Int. J. Prod. Econ. 140 (1), 227–238.
Srivastava, S.K., 2007. Green supply-chain management: a state-of-the-artliterature review. Int. J. Manage. Rev. 9 (1), 53–80.
Svensson, G., 2007. Aspects of sustainable supply chain management (SSCM):conceptual framework and empirical example. Supply Chain Manage.: Int. J. 12(4), 262–266.
Taticchi, P., Tonelli, F., Pasqualino, R., 2013. Performance measurement ofsustainable supply chains: a literature review and a research agenda. Int. J.Prod. Perform. Manage. 62 (8), 782–804.
Teuteberg, F., Wittstruck, D., 2010. A systematic review of sustainable supply chainmanagement. Multikonferenz Wirtschaftsinformatik 2010, p.203.
Thanki, S., Govindan, K., Thakkar, J., 2016. An investigation on lean-greenimplementation practices in Indian SMEs using analytical hierarchy process(AHP) approach. J. Clean. Prod. 135, 284–298.
Tseng, M.L., 2009. A causal and effect decision making model of service qualityexpectation using grey-fuzzy DEMATEL approach. Expert Syst. Appl. 36 (4),7738–7748.
Tzeng, G.H., Chiang, C.H., Li, C.W., 2007. Evaluating intertwined effects ine-learning programs: a novel hybrid MCDM model based on factor analysisand DEMATEL. Expert Syst. Appl. 32 (4), 1028–1044.

servat
V
W
W
W
W
W
W
W
W
W
X
D. Mathivathanan et al. / Resources, Con
achon, S., Klassen, R.D., 2008. Environmental management and manufacturingperformance: the role of collaboration in the supply chain. Int. J. Prod. Econ.111 (2), 299–315.
acker, J.G., 2004. A theory of formal conceptual definitions: developingtheory-building measurement instruments. J. Oper. Manage. 22 (6), 629–650.
alker, H., Preuss, L., 2008. Fostering sustainability through sourcing from smallbusinesses: public sector perspectives. J. Clean. Prod. 16 (15), 1600–1609.
alton, S.V., Handfield, R.B., Melnyk, S.A., 1998. The green supply chain:integrating suppliers into environmental management processes. Int. J. Purch.Mater. Manage. 34 (1), 2–11.
an Ahmad, W.N.K., de Brito, M.P., Tavasszy, L.A., 2016a. Sustainable supply chainmanagement in the oil and gas industry: a review of corporate sustainabilityreporting practices. Benchmarking: Int. J. 23 (6).
ei, J., Zhao, Y., Xu, H., Yu, H., 2007. A framework for selecting indicators to assessthe sustainable development of the natural heritage site. J. Mountain Sci. 4 (4),321–330.
inkler, H., 2011. Closed-loop production systems—a sustainable supply chainapproach. CIRP J. Manuf. Sci. Technol. 4 (3), 243–246.
ittstruck, D., Teuteberg, F., 2012. Understanding the success factors of sustainablesupply chain management: empirical evidence from the electrics andelectronics industry. Corp. Soc. Responsib. Environ. Manage. 19 (3), 141–158.
u, W.W., Lee, Y.T., 2007. Developing global managers’ competencies using thefuzzy DEMATEL method. Expert Syst. Appl. 32 (2), 499–507.
u, K.J., Liao, C.J., Tseng, M., Chiu, K.K.S., 2016. Multi-attribute approach to
sustainable supply chain management under uncertainty. Ind. Manage. DataSyst. 116 (4), 777–800.ia, X., Govindan, K., Zhu, Q., 2015. Analyzing internal barriers for automotive partsremanufacturers in China using grey-DEMATEL approach. J. Clean. Prod. 87,811–825.
ion and Recycling 128 (2018) 284–305 305
Yang, Y.P.O., Shieh, H.M., Leu, J.D., Tzeng, G.H., 2008. A novel hybrid MCDM modelcombined with DEMATEL and ANP with applications. Int. J. Oper. Res. 5 (3),160–168.
Zailani, S., Jeyaraman, K., Vengadasan, G., Premkumar, R., 2012. Sustainable supplychain management (SSCM) in Malaysia: a survey. Int. J. Prod. Econ. 140 (1),330–340.
Zailani, S., Govindan, K., Shaharudin, M.R., Kuan, E.E.L., 2017. Barriers to productreturn management in automotive manufacturing firms in Malaysia. J. Clean.Prod. 141, 22–40.
Zhang, H., Calvo-Amodio, J., Haapala, K.R., 2013. A conceptual model for assistingsustainable manufacturing through system dynamics. J. Manuf. Syst. 32 (4),543–549.
Zhu, Q., Sarkis, J., 2004. Relationships between operational practices andperformance among early adopters of green supply chain managementpractices in Chinese manufacturing enterprises. J. Oper. Manage. 22 (3),265–289.
Zhu, Q., Sarkis, J., Lai, K.H., 2007. Green supply chain management: pressures,practices and performance within the Chinese automobile industry. J. Clean.Prod. 15 (11), 1041–1052.
Zhu, Q., Sarkis, J., Geng, Y., 2011. Barriers to environmentally-friendly clothingproduction among Chinese apparel companies. Asian Bus. Manage. 10 (3),425–452.
Zhu, Q., Sarkis, J., Lai, K.H., 2013. Institutional-based antecedents and performanceoutcomes of internal and external green supply chain management practices. J.Purch. Supply Manage. 19 (2), 106–117.
Ziggers, G.W., Trienekens, J., 1999. Quality assurance in food and agribusinesssupply chains: developing successful partnerships. Int. J. Prod. Econ. 60,
271–279.Zubir, A.F.M., Habidin, N.F., Conding, J., Jaya, N.A.S.L., Hashim, S., 2012. Thedevelopment of sustainable manufacturing practices and sustainableperformance in Malaysian automotive industry. J. Econ. Sustain. Dev. 3 (7),130–138.