
Resources and Energy Quarterly Dec 2017
12
7. Gas
Transcript of Resources and Energy Quarterly Dec 2017

7. Gas

Resources and Energy Quarterly December 2017 46
7.1 Summary
The value of Australia’s LNG exports is forecast to increase from $22
billion in 2016–17 to $36 billion in 2018–19, driven by higher export
volumes and, to a lesser extent, higher prices.
The completion of the final three Australian LNG projects under
construction will underpin strong growth in export volumes and bring
annual export capacity to 88 million tonnes.
LNG contract prices — under which most Australian LNG is sold — are
forecast to increase in line with oil prices. High LNG spot prices in Asia
are likely to be attractive to Australian exporters in the short-term, but
are expected to decline from their present level.
LNG is forecast to overtake metallurgical coal as Australia’s second
largest resource and energy export in 2018–19.
7.2 Prices
LNG contract prices to rise and spot prices to fall
The average price of Australian LNG (FOB) has edged down over the past
few months. The average price was around $8.20 a gigajoule — around
US$6.80 per million British thermal units (MMbtu) — in October (the latest
available data). Recent price movements are a result of weakening oil
prices over the middle of 2017. The majority of Australian LNG is sold on
long-term contracts linked to the price of Japan Customs-cleared Crude
(JCC) oil lagged by around three months.
LNG spot prices in Asia have risen sharply in recent months, driven by
unplanned outages at a number of LNG facilities and strong pre-winter
buying by key buyers in Asia (particularly China). The price spike has
taken Asian spot prices above oil-linked contract prices. As Figure 7.2
shows, LNG spot prices (Delivered Ex Ship) averaged $11.90 a gigajoule
in November (US$9.60 per MMbtu) while an indicative price for LNG on a
long-term oil-linked contract (Delivered Ex Ship) was around $9.10 a
gigajoule (US$7.30 per MMbtu).
Figure 7.1: Recent movement in export unit values, monthly
Notes: the Japan Customs-cleared Crude (JCC) price is lagged three months.
Source: ABS (2017); Bloomberg (2017)
Figure 7.2: LNG contract price versus spot price, DES, monthly
Notes: the contract price shown here is indicative only and is estimated as 14 per cent of the three-month lagged JCC price plus shipping. DES stands for Delivered Ex Ship. DES LNG includes the cost of shipping and insurance.
Source: Argus (2017); Bloomberg (2017)
0
20
40
60
80
100
120
0
2
4
6
8
10
12
Nov-15 May-16 Nov-16 May-17 Nov-17
US
$ a
barr
el
A$ a
gig
ajo
ule
Export unit values Lagged JCC price (rhs)
0
2
4
6
8
10
12
14
Nov-15 May-16 Nov-16 May-17 Nov-17A
$ a
gig
ajo
ule
Indicative contract price North East Asian LNG spot price

Resources and Energy Quarterly December 2017 47
The price of Australian LNG (FOB) is forecast to increase to average $9.0
a gigajoule in 2018–19, largely driven by higher prices on oil-linked
contracts. The recent increase in oil prices should begin to flow through to
Australian LNG prices around early 2018. The JCC oil price is forecast to
average US$56 a barrel in 2018–19, up from an average US$50 a barrel
in 2016–17. The recent increase in Asian LNG spot prices should also
support average Australian LNG prices in the short-term, as exporters look
to capitalise on the price spike.
However, LNG spot prices in Asia are forecast to decline from present
levels, as the tightness in the market generated by northern winter buying
unwinds. In 2018, Asian LNG spot prices (Delivered Ex Ship) are forecast
to average $8.30 a gigajoule (around US$6.50 per MMbtu). In 2019, LNG
spot prices are forecast to fall to $6.70 a gigajoule (around US$5.40 per
MMbtu), as additions to global supply capacity outstrip growth in LNG
demand.
Domestic wholesale spot prices in Australia’s eastern gas market have not
followed recent movements in Asian LNG spot prices, having continued to
decline since mid-2017. Spot prices on the east coast averaged $6–7 a
gigajoule in November, below netbacks from both Asian LNG spot prices
and oil-linked contract prices. The Appendix at the end of this chapter
discusses the relationship between domestic spot prices and LNG
netbacks.
Figure 7.3: Domestic wholesale gas spot prices on the east coast, monthly
Notes: Wallumbilla is a gas supply hub. STTM stands for Short Term Trading Market. DWGM stands for Declared Wholesale Gas Market.
Source: AEMO (2017)
0
2
4
6
8
10
12
14
16
Nov-12 Nov-13 Nov-14 Nov-15 Nov-16 Nov-17
A$ a
gig
ajo
ule
Adelaide STTM Brisbane STTM Sydney STTM
Wallumbilla Victorian DWGM

Resources and Energy Quarterly December 2017 48
7.3 World trade
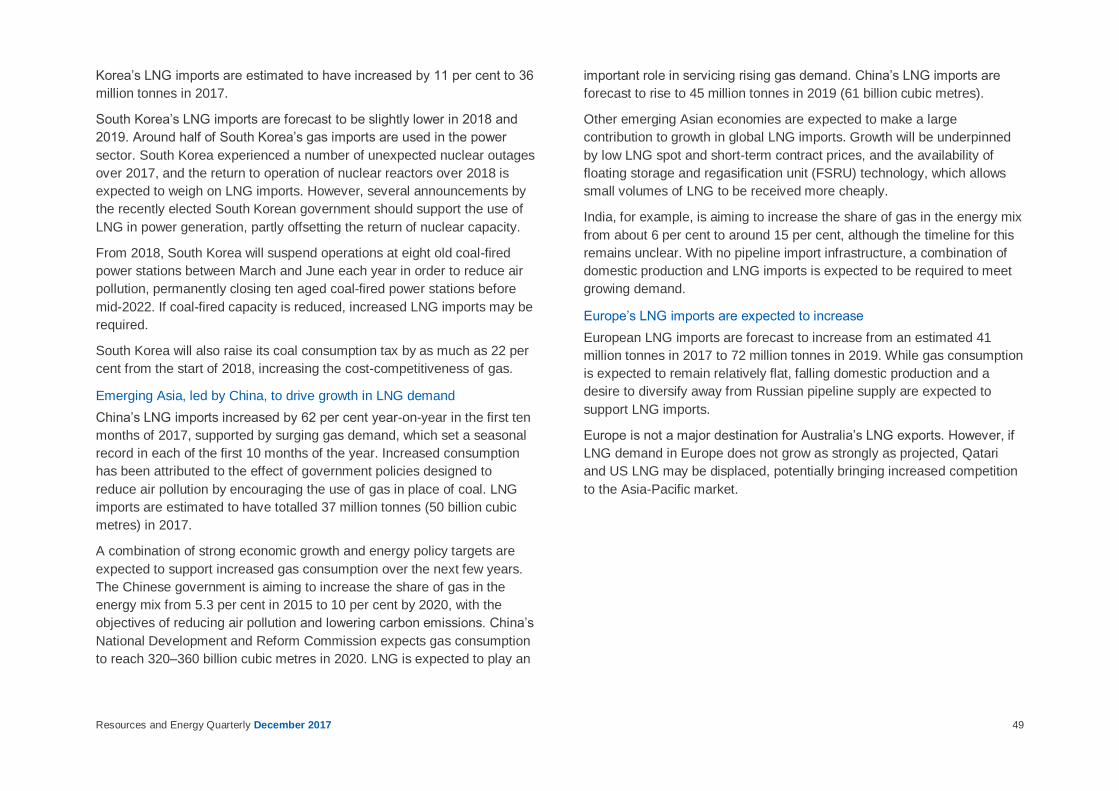
World LNG imports are forecast to increase from 250 million tonnes in
2016 to 326 million tonnes in 2019. Emerging Asia — led by China — and
Europe are expected to drive demand growth (Figure 7.4). Prospects for
growth in the imports of the world’s two largest consumers — Japan and
South Korea — are more limited. Supply growth will be supported by a
major expansion of LNG export infrastructure, primarily in the United
States and Australia.
In 2018, demand growth is expected to keep pace with additions to global
liquefaction capacity. An improved demand outlook, coupled with delays to
the completion of a number of LNG projects, appear to have postponed
the arrival of overcapacity in LNG markets. However, by 2019, LNG
demand growth is expected to be outpaced by additions to world supply
capacity. Consequently, the average capacity utilisation of LNG plants is
expected to fall.
Figure 7.4: LNG import forecasts
Source: Nexant World Gas Model (2017); Department of Industry, Innovation and Science (2017)
7.4 World imports
The imports of the world’s largest LNG buyer are set to decline
After a strong start to the year, Japan’s LNG imports contracted sharply
between August and October following the restart of two nuclear reactors.
Four of Japan’s fleet of 42 reactors (combined capacity 3.5 gigawatts) are
currently operational. Japan’s LNG imports are estimated to have
remained little changed in 2017 at 86 million tonnes.
By 2019, Japan’s LNG imports are forecast to decline to 81 million tonnes.
Overall energy demand in Japan remains subdued. At the same time, LNG
is expected to face increasing competition from other fuel sources in the
power sector, which accounts for two-thirds of Japan’s gas consumption.
The recent restart of two nuclear reactors is expected to weigh on LNG
imports over the outlook period. The Japanese Government’s energy
think-tank, the Institute of Energy Economics (IEEJ), expects 10 reactors
to be operational by the end of March 2019.
Nevertheless, the timing and scale of nuclear restarts remains a key
uncertainty affecting the outlook. In December, the Hiroshima High Court
issued an injunction preventing Ikata No. 3 unit, a reactor which had
restarted in 2016 and was offline for maintenance, from returning to
service in early 2018. The case illustrates how legal challenges and public
opposition to nuclear power complicates the outlook for nuclear generation
in Japan.
LNG also faces increasing competition in power generation from
renewable energy. The IEEJ expects renewable energy generation to
increase at an average annual rate of 7.7 per cent between Japanese
fiscal years (April to March) 2016–17 and 2018–19.
Prospects for growth in South Korea’s imports remain limited
South Korea’s LNG imports increased by 15 per cent year-on-year in the
first ten months of 2017. The rise was supported by increased gas-fired
power generation, with a number of nuclear reactors offline and nuclear-
power generation down during the first ten months of the year. South
0
20
40
60
80
100
Japan SouthKorea
China EmergingAsia (exChina)
Europe Rest ofworld
millio
n tonnes
2017 (estimate) 2019
Resources and Energy Quarterly December 2017 49
Korea’s LNG imports are estimated to have increased by 11 per cent to 36
million tonnes in 2017.
South Korea’s LNG imports are forecast to be slightly lower in 2018 and
2019. Around half of South Korea’s gas imports are used in the power
sector. South Korea experienced a number of unexpected nuclear outages
over 2017, and the return to operation of nuclear reactors over 2018 is
expected to weigh on LNG imports. However, several announcements by
the recently elected South Korean government should support the use of
LNG in power generation, partly offsetting the return of nuclear capacity.
From 2018, South Korea will suspend operations at eight old coal-fired
power stations between March and June each year in order to reduce air
pollution, permanently closing ten aged coal-fired power stations before
mid-2022. If coal-fired capacity is reduced, increased LNG imports may be
required.
South Korea will also raise its coal consumption tax by as much as 22 per
cent from the start of 2018, increasing the cost-competitiveness of gas.
Emerging Asia, led by China, to drive growth in LNG demand
China’s LNG imports increased by 62 per cent year-on-year in the first ten
months of 2017, supported by surging gas demand, which set a seasonal
record in each of the first 10 months of the year. Increased consumption
has been attributed to the effect of government policies designed to
reduce air pollution by encouraging the use of gas in place of coal. LNG
imports are estimated to have totalled 37 million tonnes (50 billion cubic
metres) in 2017.
A combination of strong economic growth and energy policy targets are
expected to support increased gas consumption over the next few years.
The Chinese government is aiming to increase the share of gas in the
energy mix from 5.3 per cent in 2015 to 10 per cent by 2020, with the
objectives of reducing air pollution and lowering carbon emissions. China’s
National Development and Reform Commission expects gas consumption
to reach 320–360 billion cubic metres in 2020. LNG is expected to play an
important role in servicing rising gas demand. China’s LNG imports are
forecast to rise to 45 million tonnes in 2019 (61 billion cubic metres).
Other emerging Asian economies are expected to make a large
contribution to growth in global LNG imports. Growth will be underpinned
by low LNG spot and short-term contract prices, and the availability of
floating storage and regasification unit (FSRU) technology, which allows
small volumes of LNG to be received more cheaply.
India, for example, is aiming to increase the share of gas in the energy mix
from about 6 per cent to around 15 per cent, although the timeline for this
remains unclear. With no pipeline import infrastructure, a combination of
domestic production and LNG imports is expected to be required to meet
growing demand.
Europe’s LNG imports are expected to increase
European LNG imports are forecast to increase from an estimated 41
million tonnes in 2017 to 72 million tonnes in 2019. While gas consumption
is expected to remain relatively flat, falling domestic production and a
desire to diversify away from Russian pipeline supply are expected to
support LNG imports.
Europe is not a major destination for Australia’s LNG exports. However, if
LNG demand in Europe does not grow as strongly as projected, Qatari
and US LNG may be displaced, potentially bringing increased competition
to the Asia-Pacific market.
Resources and Energy Quarterly December 2017 50
7.5 World exports
Global supply capacity to rise
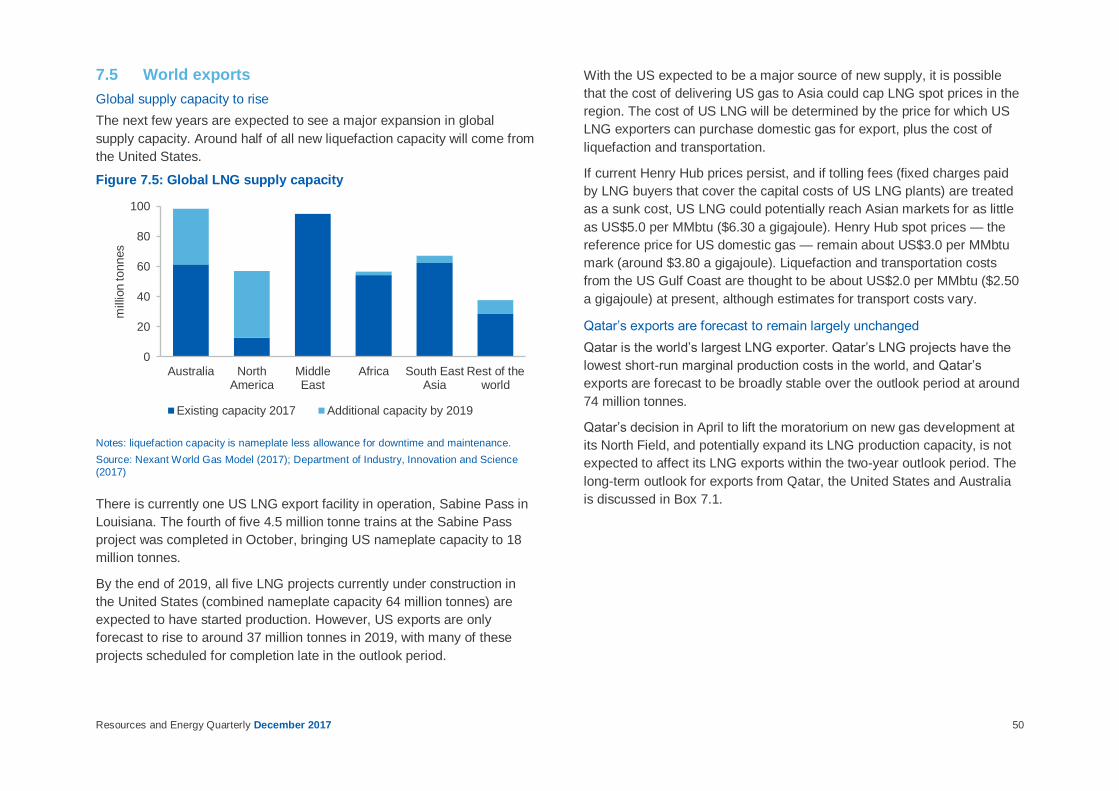
The next few years are expected to see a major expansion in global
supply capacity. Around half of all new liquefaction capacity will come from
the United States.
Figure 7.5: Global LNG supply capacity
Notes: liquefaction capacity is nameplate less allowance for downtime and maintenance.
Source: Nexant World Gas Model (2017); Department of Industry, Innovation and Science
(2017)
There is currently one US LNG export facility in operation, Sabine Pass in
Louisiana. The fourth of five 4.5 million tonne trains at the Sabine Pass
project was completed in October, bringing US nameplate capacity to 18
million tonnes.
By the end of 2019, all five LNG projects currently under construction in
the United States (combined nameplate capacity 64 million tonnes) are
expected to have started production. However, US exports are only
forecast to rise to around 37 million tonnes in 2019, with many of these
projects scheduled for completion late in the outlook period.
With the US expected to be a major source of new supply, it is possible
that the cost of delivering US gas to Asia could cap LNG spot prices in the
region. The cost of US LNG will be determined by the price for which US
LNG exporters can purchase domestic gas for export, plus the cost of
liquefaction and transportation.
If current Henry Hub prices persist, and if tolling fees (fixed charges paid
by LNG buyers that cover the capital costs of US LNG plants) are treated
as a sunk cost, US LNG could potentially reach Asian markets for as little
as US$5.0 per MMbtu ($6.30 a gigajoule). Henry Hub spot prices — the
reference price for US domestic gas — remain about US$3.0 per MMbtu
mark (around $3.80 a gigajoule). Liquefaction and transportation costs
from the US Gulf Coast are thought to be about US$2.0 per MMbtu ($2.50
a gigajoule) at present, although estimates for transport costs vary.
Qatar’s exports are forecast to remain largely unchanged
Qatar is the world’s largest LNG exporter. Qatar’s LNG projects have the
lowest short-run marginal production costs in the world, and Qatar’s
exports are forecast to be broadly stable over the outlook period at around
74 million tonnes.
Qatar’s decision in April to lift the moratorium on new gas development at
its North Field, and potentially expand its LNG production capacity, is not
expected to affect its LNG exports within the two-year outlook period. The
long-term outlook for exports from Qatar, the United States and Australia
is discussed in Box 7.1.
0
20
40
60
80
100
Australia NorthAmerica
MiddleEast
Africa South EastAsia
Rest of theworld
millio
n tonnes
Existing capacity 2017 Additional capacity by 2019

Resources and Energy Quarterly December 2017 51
Box 7.1: Gas, the IEA and the world’s largest LNG exporter
In 2011, the IEA asked whether the world was entering ‘the golden age of
gas’. Six years on, the North American shale gas revolution has been
hugely successful, but gas demand growth has slowed considerably.
Under the IEA’s New Policies Scenario, published in the 2017 World
Energy Outlook, gas demand grows at 1.6 per cent a year to 2040. While
growth is faster than for the other fossil fuels, it is well down on the
average 2.3 per cent a year seen over the past 25 years.
In the IEA’s New Policies Scenario, growth in gas consumption is driven
by industrial demand and, after 2025, demand from the power sector. The
main countries driving gas consumption are in Asia. China accounts for
almost a quarter of additional global gas demand over the outlook period
— the most of any country. By 2040, gas accounts for 25 per cent of the
global energy mix, up from 22 per cent in 2016.
While gas demand growth remains moderate, it drives a major expansion
in the relatively small global LNG market. With over 103 million tonnes of
LNG production capacity under construction, gas markets remain well
supplied for the next few years. By the mid-2020s, however, market over-
capacity is expected to be absorbed by import growth. Investment in new
LNG capacity is likely to be needed from 2020 onwards.
What of the title of world’s largest LNG exporter? Australia was the
second largest LNG exporter in the world in 2016, exporting 45 million
tonnes of LNG. Qatar, the largest exporter, exported 74 million tonnes.
Malaysia was the third largest LNG exporting country at 25 million tonnes.
The United States exported just 4 million tonnes.
OCE projections are for Australia to overtake Qatar as the world’s largest
exporter in 2019. However, Australia’s hold on the title may only be short-
lived. Under the IEA’s New Policies Scenario, some new Australian LNG
projects come to fruition over the outlook period, but these are smaller
incremental projects and there is no second investment wave comparable
to the boom of the last 10 years.
In contrast, LNG exports increase rapidly in the United States during the
2020s, underpinned by the relatively low cost of production of domestic
gas. This increase sees the United States become the world’s largest
LNG exporting country in the mid-2020s. LNG shipments from the United
States are projected to reach 86 million tonnes in 2025 and 115 million
tonnes in 2040.
The United States’ time as the world’s largest LNG exporter, however, is
only expected to be temporary. Qatar’s large and low cost gas resources
provide the foundation for a continued expansion in its LNG exports over
the next two decades. This expansion begins in the early to mid-2020s,
with Qatar having recently lifted its self-imposed moratorium on its North
Gas field. Qatar draws level with the United States in the mid-2030s
before edging past the United States by the end of the decade.
Figure 7.6: Selected country’s LNG exports in the IEA’s New Policies Scenario
Source: International Energy Agency (2017) World Energy Outlook
0
20
40
60
80
100
120
2016 2020 2025 2030 2035 2040
millio
n tonnes
United States Australia Qatar

Resources and Energy Quarterly December 2017 52
7.6 Australia
LNG export earnings to increase, driven by higher export volumes
The value of Australia’s LNG exports increased by 41 per cent year-on-
year in the September quarter, with both the price and volume of
Australia’s LNG exports higher than a year earlier. Australia’s LNG export
earnings are forecast to increase from $22 billion in 2016–17 to $36 billion
in 2018–19. Rising export values will be propelled by higher export
volumes and, to a lesser extent, higher prices.
Figure 7.7: Annual growth in Australia’s LNG export values, contributions from prices and export volumes
Notes: Log change is used to approximate percentage change. The approximation becomes less accurate the larger the percentage change.
Source: ABS (2017); Department of Industry, Innovation and Science (2017)
Australia’s LNG export volumes are forecast to reach 77 million tonnes in
2018–19, up from 52 million tonnes in 2016–17. Higher export volumes will
be driven by increased production at Gorgon, as well as the completion of
the three remaining LNG projects under construction — Wheatstone,
Ichthys and Prelude. These three projects will add around 21 million
tonnes to Australia’s LNG export capacity, bringing total nameplate
capacity to around 88 million tonnes.
Figure 7.8: Australia’s LNG export capacity
Notes: Nameplate capacity.
Source: Department of Industry, Innovation and Science (2017)
Chevron’s Wheatstone project is likely to be the first of the three projects
completed, with train 2 due online in the June quarter 2018. First LNG
production at Inpex’s Ichthys project is expected in the March quarter
2018, with some reports indicating that train 2 could commence operations
as soon as a few months later. Shell’s Prelude Floating LNG project is
likely to be the last of Australia’s recent wave of seven LNG projects to be
completed, with Shell indicating Prelude will be completed between May
and August 2018.
Japan, South Korea and China are expected to be the major destinations
for Australia’s LNG exports. While prospects for growth in the imports of
Japan and South Korea are limited, Australian producers are expected to
capture an increasing share of both country’s imports.
The forecast for export values is little changed
There have been a number of revisions since the September 2017
Resources and Energy Quarterly. In 2017–18, forecast export values are
$0.3 billion lower due to upward revisions to the AUD-USD exchange rate
-60
-40
-20
0
20
40
60
2008–09 2010–11 2012–13 2014–15 2016–17 2018–19
per
cent
Volumes Prices Values
0
20
40
60
80
100
2008–09 2010–11 2012–13 2014–15 2016–17 2018–19
millio
n tonnes
Existing New capacity additions

Resources and Energy Quarterly December 2017 53
and a lower than expected September quarter 2017 export earnings result.
In 2018–19, export values are $1.0 billion higher, with an improved outlook
for oil prices and export volumes.
A number of uncertainties remain
Oil prices remain a key sensitivity to the outlook for LNG export earnings.
If the JCC oil price forecast was reduced by US$5 a barrel, projected LNG
export earnings would be $2.7 billion lower in 2018–19.
Some uncertainty also surrounds the outlook for export volumes, with
competition in global LNG markets is set to intensify. The cost
competitiveness of Australian LNG projects and the amount of flexibility in
Australian LNG contracts are two important factors. LNG contracts often
include clauses which allow buyers to reduce purchases to minimum ‘take-
or-pay’ levels. It is possible buyers may utilise these ‘take-or-pay’
provisions in their oil-linked contracts if oil prices are higher than spot
prices, or if they become over-contracted for LNG.
Figure 7.9: LNG export earnings and the oil price sensitivity
Notes: JCC stands for Japan Customs-cleared Crude.
Source: Argus Media (2017); Nexant World Gas Model (2017); Department of Industry, Innovation and Science (2017)
0
5
10
15
20
25
30
35
40
2008–09 2010–11 2012–13 2014–15 2016–17 2018–19
A$ m
illio
n
Current forecast JCC plus $5 JCC minus $5

Resources and Energy Quarterly December 2017 54
Table 7.1: Gas outlook
Annual percentage change
World Unit 2016 2017 f 2018 f 2019 f 2017 f 2018 f 2019 f
JCC oil price a
– nominal US$/bbl 41.9 51.9 57.0 56.7 23.9 9.9 -0.5
– real h US$/bbl 42.7 51.9 55.8 54.3 21.4 7.6 -2.6
Gas production t Bcm 3 569.5 3 648.3 3 725.2 3 790.3 2.2 2.1 1.7
Gas consumption t Bcm 3 534.5 3 646.1 3 699.8 3 769.9 3.2 1.5 1.9
LNG trade d Mt 250.2 277.5 304.8 325.6 10.9 9.8 6.8
Australia Unit 2015–16 2016–17 2017–18 f 2018–19 f 2016–17 2017–18 f 2018–19 f
Production b Bcm 88.2 105.3 124.2 143.5 19.3 18.0 15.6
– Eastern market Bcm 43.4 54.3 57.6 58.5 25.1 6.0 1.6
– Western market Bcm 43.8 49.6 64.6 74.2 13.2 30.2 14.9
– Northern market c Bcm 0.9 1.3 2.0 10.8 44.3 49.8 441.7
LNG export volume d Mt 36.9 52.1 63.0 76.5 41.4 20.9 21.4
– nominal value A$m 16,576 22,299 29,911 36,392 34.5 34.1 21.7
– real value e A$m 17,206 22,758 29,911 35,543 32.3 31.4 18.8
LNG export unit value g
– nominal value A$/GJ 8.5 8.1 9.0 9.0 -4.9 10.9 0.2
– real value e A$/GJ 8.8 8.3 9.0 8.8 -6.5 8.7 -2.2
– nominal value US$/MMBtu 6.6 6.5 7.3 7.3 -1.5 13.6 -0.1
– real value e US$/MMBtu 6.8 6.6 7.3 7.2 -3.1 11.3 -2.5
Notes: Notes: a JCC stands for Japan Customs-cleared Crude; b Production includes both sales gas and gas used in the production process (i.e. plant use) and ethane. Historical gas production data was revised in the June quarter 2017 to align with Australian Petroleum Statistics published by the Department of Environment and Energy; c Gas production from Bayu-Undan Joint Production
Development Area is not included in Australian production. Browse basin production associated with the Ichthys project is classified as Northern market; d 1 million tonnes of LNG is equivalent to approximately 1.36 billion cubic metres of gas; e In 2017–18 Australian dollars; f Forecast; g 1 MMBtu is equivalent to 1.055 GJ; h In 2017 US dollars;s Estimate; t 2016 is an estimate.
Source: ABS (2017) International Trade in Goods and Services, Australia, Cat. No. 5368.0; Department of Industry, Innovation and Science (2017); Company reports; Nexant World Gas Model (2017)

Resources and Energy Quarterly December 2017 55
7.7 Appendix: LNG netbacks and domestic spot prices
LNG spot prices in North Asia have increased over the past few months,
reaching their highest level in almost three years in November. The spike
appears to have been driven by unexpected outages at several LNG
plants and strong pre-winter buying from major customers, most notably
China. Yet domestic wholesale spot prices on Australia’s east coast have
fallen over the same period, challenging the conventional wisdom that
domestic prices should move with LNG netbacks.
An LNG netback is an LNG price minus the costs involved in getting the
gas to the destination in question, such as transportation and liquefaction.
For example, the LNG spot price netback from Japan to Wallumbilla (a gas
hub in Queensland) refers to the price of spot LNG delivered to Japan
minus the costs of getting gas from Wallumbilla to Japan.
Figure 7.10: Netback at Wallumbilla from North East Asian LNG spot price, November 2017
Notes: the marginal cost of transporting gas via pipeline from Wallumbilla to Gladstone is assumed to be zero, consistent with the September 2017 ACCC Gas Inquiry.
Source: Argus (2017); AEMO (2017); Department of Industry, Innovation and Science (2017)
If LNG netbacks are higher than domestic prices, then LNG exporters
should be willing to purchase domestic gas to on-sell to international
customers, putting upward pressure on domestic prices. If netbacks are
lower than domestic prices, then LNG operators have incentives to direct
uncontracted gas to the domestic market, putting downward pressure on
domestic prices. LNG netbacks and domestic gas prices therefore
converge, or so the argument goes.
While most Australian gas is traded on confidential bilateral contracts, the
prices that can be observed — those on domestic spot markets — have
not followed movements in Asian LNG spot price netbacks in recent
months. Meanwhile, netbacks from oil-linked LNG contract prices remain
above domestic spot prices.
Figure 7.11: LNG spot and oil-linked contract price netbacks at Wallumbilla, monthly
Notes: netbacks are calculated using historical shipping price data and assumptions on
liquefaction costs. The spot price netback uses the Argus North East Asian spot price. The FOB price of LNG on Gladstone oil-linked contracts is estimated at 14 per cent of the three-month lagged Japan Customs-cleared Crude (JCC) oil price.
Source: AEMO (2017); Bloomberg (2017); Argus (2017); Department of Industry, Innovation and Science (2017).
There are a number of possible reasons for the divergence between LNG
netbacks and domestic spot prices. The responsiveness of domestic
prices to LNG netbacks is premised on the idea that LNG exporters are
highly responsive to opportunities to purchase gas on domestic spot
0
2
4
6
8
10
12
Asian spotprice
Shippingcosts
GladstoneFOB price
Liquefactioncosts
Netback atWallumbilla
Potentialprofit
Wallumbillaprice
A$ a
gig
ajo
ule
0
3
6
9
12
15
May-15 Nov-15 May-16 Nov-16 May-17 Nov-17
A$ a
gig
ajo
ule
Wallumbilla gas price Spot price netback Contract price netback

Resources and Energy Quarterly December 2017 56
markets. One reason LNG exporters may not be able to capitalise on
lower domestic prices is that domestic spot markets tend to be thin —
opportunities to purchase sufficient amounts of gas for export may not be
available. For example, gas trades at the Wallumbilla averaged just 0.9
petajoules a month over the 12 months to November 2017. In contrast, a
cargo of LNG from Gladstone contains around 3.5 PJs of gas. Around 25
cargoes are shipped from Gladstone per month.
Figure 7.12: East coast LNG exports and trading at east coast gas hubs, 12 months to November 2017
Notes: DWGM stands for Declared Wholesale Gas Market. Wallumbilla is a gas supply hub. STTM stands for Short Term Trading Market. 1 million tonnes of LNG = 54.4 petajoules. LNG exports do not include gas used by LNG exporters in the process of producing LNG.
Source: Australian Energy Market Operator (2017); Gladstone Ports Corporation (2017)
Other issues also complicate the relationship between netbacks and
domestic spot prices. If LNG exporters are to take advantage of low
domestic spot prices and buy gas, they must be able to vary their exports
in line with those spot market purchases. This may take some time, since
exporters need to secure customers for spot cargoes, which may involve
applying for and winning tenders put out by buyers. Exporters must also
manage operational requirements (such as plant maintenance), which may
discourage opportunistic spot market purchases, even at times when
international prices are relatively high. Finally, exporters may not be willing
to pay all the way up to LNG netback prices for gas on domestic spot
markets, as potential profits from reselling the gas to international
customers at this point are reduced to zero.
There are also other influences on domestic gas prices. For example,
when electricity prices are high enough to cover gas input costs, gas
power generation operators may purchase gas from domestic spot
markets, pushing up prices.
Figure 7.13: Wallumbilla gas prices and gas used for gas powered generation (GPG) in Queensland, monthly
Source: Australian Energy Market Operator (2017); Australian Energy Regulator (2017)
LNG netbacks do exert an influence on domestic gas prices. The ACCC,
for example, has found that expectations of LNG netback prices play an
important role in informing contract price negotiations. However, in the
case of domestic spot markets, the data to date suggests that spot prices
will not necessarily be equal to LNG netbacks, nor necessarily follow their
short term movements. This could be due a range of factors, including a
lack of liquidity in domestic spot markets, rigidities in organising sales of
spot LNG, and other influences on domestic spot prices.
0
200
400
600
800
1,000
1,200
LNGexports
Victoria Wallumbilla SydneySTTM
AdelaideSTTM
BrisbaneSTTM
peta
joule
s
0
2
4
6
8
10
12
14
0
50
100
150
200
250
300
350
Nov-15 May-16 Nov-16 May-17 Nov-17
A$ a
gig
ajo
ule
tera
joule
s, avera
ge d
aily
QLD GPG gas usage Wallumbilla price (rhs)


