Resource GenTree, an integrated resource for analyzing the ...
15
GenTree, an integrated resource for analyzing the evolution and function of primate-specific coding genes Yi Shao, 1,2,14 Chunyan Chen, 1,2,14 Hao Shen, 3,15 Bin Z. He, 4,15,16 Daqi Yu, 1,2 Shuai Jiang, 5,6 Shilei Zhao, 2,7 Zhiqiang Gao, 2,8 Zhenglin Zhu, 9 Xi Chen, 10,11 Yan Fu, 2,8 Hua Chen, 2,7,12 Ge Gao, 5,6 Manyuan Long, 13 and Yong E. Zhang 1,2,12 1 Key Laboratory of Zoological Systematics and Evolution and State Key Laboratory of Integrated Management of Pest Insects and Rodents, Institute of Zoology, Chinese Academy of Sciences, Beijing 100101, China; 2 University of Chinese Academy of Sciences, Beijing 100049, China; 3 College of Computers, Hunan University of Technology, Zhuzhou Hunan 412007, China; 4 FAS Center for Systems Biology and Howard Hughes Medical Institute, Harvard University, Cambridge, Massachusetts 02138, USA; 5 State Key Laboratory of Protein and Plant Gene Research, School of Life Sciences, Center for Bioinformatics, Peking University, Beijing 100871, China; 6 Beijing Advanced Innovation Center for Genomics (ICG), Biomedical Pioneering Innovation Center (BIOPIC), Peking University, Beijing 100871, China; 7 CAS Key Laboratory of Genomic and Precision Medicine, Beijing Institute of Genomics, Chinese Academy of Sciences, Beijing 100101, China; 8 National Center for Mathematics and Interdisciplinary Sciences, Key Laboratory of Random Complex Structures and Data Science, Academy of Mathematics and Systems Science, Chinese Academy of Sciences, Beijing, 100190, China; 9 School of Life Sciences, Chongqing University, Chongqing 400044, China; 10 Wuhan Institute of Biotechnology, Wuhan 430072, China; 11 Medical Research Institute, Wuhan University, Wuhan 430072, China; 12 CAS Center for Excellence in Animal Evolution and Genetics, Chinese Academy of Sciences, Kunming 650223, China; 13 Department of Ecology and Evolution, The University of Chicago, Chicago, Illinois 60637, USA The origination of new genes contributes to phenotypic evolution in humans. Two major challenges in the study of new genes are the inference of gene ages and annotation of their protein-coding potential. To tackle these challenges, we created GenTree, an integrated online database that compiles age inferences from three major methods together with functional genomic data for new genes. Genome-wide comparison of the age inference methods revealed that the synteny-based pipe- line (SBP) is most suited for recently duplicated genes, whereas the protein-family–based methods are useful for ancient genes. For SBP-dated primate-specific protein-coding genes (PSGs), we performed manual evaluation based on published PSG lists and showed that SBP generated a conservative data set of PSGs by masking less reliable syntenic regions. After assessing the coding potential based on evolutionary constraint and peptide evidence from proteomic data, we curated a list of 254 PSGs with different levels of protein evidence. This list also includes 41 candidate misannotated pseudogenes that encode primate-specific short proteins. Coexpression analysis showed that PSGs are preferentially recruited into organs with rapidly evolving pathways such as spermatogenesis, immune response, mother–fetus interaction, and brain develop- ment. For brain development, primate-specific KRAB zinc-finger proteins (KZNFs) are specifically up-regulated in the mid- fetal stage, which may have contributed to the evolution of this critical stage. Altogether, hundreds of PSGs are either recruited to processes under strong selection pressure or to processes supporting an evolving novel organ. [Supplemental material is available for this article.] New genes have attracted the interest of evolutionary geneticists for decades. They are novel genetic units that have originated in the evolutionary period of interest (Long et al. 2003; Kaessmann 2010; Betrán 2015). Extensive studies have shown that various mechanisms, including DNA- or RNA-mediated duplication and de novo origination, lead to a high rate of protein-coding gene gain in human evolution (Zhang et al. 2012; Zhang and Long 2014). Transcriptome profiling has revealed that new genes in the human genome postdating the human and mouse split (i.e., primate-specific genes [PSGs]) are often expressed in the testis (Vinckenbosch et al. 2006; Tay et al. 2009; Kaessmann 2010; Xie et al. 2012) or brain (Tay et al. 2009; Zhang et al. 2011; Xie et al. 2012). Limited case studies have supported the functionality of PSGs in these tissues. For example, glutamate dehydrogenase 2 (GLUD2) is a hominoid-specific RNA-mediated duplicate (func- tional retrocopy or retrogene), which facilitates metabolism in the brain and testis (Burki and Kaessmann 2004; Spanaki et al. 2010). Anecdotal evidence has also implicated PSGs in other bio- logical processes (e.g., injury response) (Costantini et al. 2015; Baird et al. 2016). 14 These authors contributed equally to this work. 15 These authors contributed equally to this work. 16 Present address: Department of Biology, University of Iowa, Iowa City, IA 52242, USA Corresponding author: [email protected] Article published online before print. Article, supplemental material, and publi- cation date are at http://www.genome.org/cgi/doi/10.1101/gr.238733.118. Freely available online through the Genome Research Open Access option. © 2019 Shao et al. This article, published in Genome Research, is available un- der a Creative Commons License (Attribution-NonCommercial 4.0 Internation- al), as described at http://creativecommons.org/licenses/by-nc/4.0/. Resource 682 Genome Research 29:682–696 Published by Cold Spring Harbor Laboratory Press; ISSN 1088-9051/19; www.genome.org www.genome.org
Transcript of Resource GenTree, an integrated resource for analyzing the ...

GenTree, an integrated resource for analyzingthe evolution and function of primate-specificcoding genes
Yi Shao,1,2,14 Chunyan Chen,1,2,14 Hao Shen,3,15 Bin Z. He,4,15,16 Daqi Yu,1,2
Shuai Jiang,5,6 Shilei Zhao,2,7 Zhiqiang Gao,2,8 Zhenglin Zhu,9 Xi Chen,10,11 Yan Fu,2,8
Hua Chen,2,7,12 Ge Gao,5,6 Manyuan Long,13 and Yong E. Zhang1,2,12
1Key Laboratory of Zoological Systematics and Evolution and State Key Laboratory of Integrated Management of Pest Insects andRodents, Institute of Zoology, Chinese Academy of Sciences, Beijing 100101, China; 2University of Chinese Academy of Sciences,Beijing 100049, China; 3College of Computers, Hunan University of Technology, Zhuzhou Hunan 412007, China; 4FAS Center forSystems Biology and Howard Hughes Medical Institute, Harvard University, Cambridge, Massachusetts 02138, USA; 5State KeyLaboratory of Protein and Plant Gene Research, School of Life Sciences, Center for Bioinformatics, Peking University, Beijing 100871,China; 6Beijing Advanced Innovation Center for Genomics (ICG), Biomedical Pioneering Innovation Center (BIOPIC), PekingUniversity, Beijing 100871, China; 7CAS Key Laboratory of Genomic and Precision Medicine, Beijing Institute of Genomics, ChineseAcademy of Sciences, Beijing 100101, China; 8National Center for Mathematics and Interdisciplinary Sciences, Key Laboratory ofRandomComplex Structures and Data Science, Academy ofMathematics and Systems Science, Chinese Academy of Sciences, Beijing,100190, China; 9School of Life Sciences, Chongqing University, Chongqing 400044, China; 10Wuhan Institute of Biotechnology,Wuhan 430072, China; 11Medical Research Institute, Wuhan University, Wuhan 430072, China; 12CAS Center for Excellence inAnimal Evolution and Genetics, Chinese Academy of Sciences, Kunming 650223, China; 13Department of Ecology and Evolution,The University of Chicago, Chicago, Illinois 60637, USA
The origination of new genes contributes to phenotypic evolution in humans. Two major challenges in the study of new
genes are the inference of gene ages and annotation of their protein-coding potential. To tackle these challenges, we created
GenTree, an integrated online database that compiles age inferences from three major methods together with functional
genomic data for new genes. Genome-wide comparison of the age inference methods revealed that the synteny-based pipe-
line (SBP) is most suited for recently duplicated genes, whereas the protein-family–based methods are useful for ancient
genes. For SBP-dated primate-specific protein-coding genes (PSGs), we performed manual evaluation based on published
PSG lists and showed that SBP generated a conservative data set of PSGs by masking less reliable syntenic regions. After
assessing the coding potential based on evolutionary constraint and peptide evidence from proteomic data, we curated a
list of 254 PSGs with different levels of protein evidence. This list also includes 41 candidate misannotated pseudogenes
that encode primate-specific short proteins. Coexpression analysis showed that PSGs are preferentially recruited into organs
with rapidly evolving pathways such as spermatogenesis, immune response, mother–fetus interaction, and brain develop-
ment. For brain development, primate-specific KRAB zinc-finger proteins (KZNFs) are specifically up-regulated in the mid-
fetal stage, which may have contributed to the evolution of this critical stage. Altogether, hundreds of PSGs are either
recruited to processes under strong selection pressure or to processes supporting an evolving novel organ.
[Supplemental material is available for this article.]
New genes have attracted the interest of evolutionary geneticistsfor decades. They are novel genetic units that have originated inthe evolutionary period of interest (Long et al. 2003; Kaessmann2010; Betrán 2015). Extensive studies have shown that variousmechanisms, including DNA- or RNA-mediated duplication andde novo origination, lead to a high rate of protein-coding genegain in human evolution (Zhang et al. 2012; Zhang and Long2014). Transcriptome profiling has revealed that new genes in
the human genome postdating the human and mouse split (i.e.,primate-specific genes [PSGs]) are often expressed in the testis(Vinckenbosch et al. 2006; Tay et al. 2009; Kaessmann 2010; Xieet al. 2012) or brain (Tay et al. 2009; Zhang et al. 2011; Xie et al.2012). Limited case studies have supported the functionality ofPSGs in these tissues. For example, glutamate dehydrogenase 2(GLUD2) is a hominoid-specific RNA-mediated duplicate (func-tional retrocopy or retrogene), which facilitates metabolism inthe brain and testis (Burki and Kaessmann 2004; Spanaki et al.2010). Anecdotal evidence has also implicated PSGs in other bio-logical processes (e.g., injury response) (Costantini et al. 2015;Baird et al. 2016).
14These authors contributed equally to this work.15These authors contributed equally to this work.16Present address: Department of Biology, University of Iowa, IowaCity, IA 52242, USACorresponding author: [email protected] published online before print. Article, supplemental material, and publi-cation date are at http://www.genome.org/cgi/doi/10.1101/gr.238733.118.Freely available online through the Genome Research Open Access option.
© 2019 Shao et al. This article, published in Genome Research, is available un-der a Creative Commons License (Attribution-NonCommercial 4.0 Internation-al), as described at http://creativecommons.org/licenses/by-nc/4.0/.
Resource
682 Genome Research 29:682–696 Published by Cold Spring Harbor Laboratory Press; ISSN 1088-9051/19; www.genome.orgwww.genome.org

The explosion of new techniques, such as organoids derivedfrom induced pluripotent stem cells (iPSCs) (Pääbo 2014;Giandomenico and Lancaster 2017) and gene editing usingCRISPR-Cas9 (Hsu et al. 2014),makes itmore feasible to investigatethe functional roles of new genes in humans. However, progress inunderstanding the contribution of new genes to primate- or hu-man-specific traits has been hindered by the lack of a consensusdata set of PSGs. Actually, the estimated number of PSGs varies be-tween five and 2000 (Demuth et al. 2006; Tay et al. 2009; Zhanget al. 2011; Ezkurdia et al. 2014). Similarly, the number of hu-man-specific genes (HSGs), that is, genes that are not even presentin the chimpanzee genome, ranges from 300 to 700 (Demuth et al.2006; Zhang et al. 2010b).
Two key challenges in creating a consensus data set are thedisagreement in age estimationbetweendifferentmethods and an-notation instability. First, the main gene-dating methods, that is,the synteny-based gene-level dating strategy (Knowles andMcLysaght 2009; Tay et al. 2009; Zhang et al. 2010b) and thehomologous gene family-level datingstrategy (Demuth et al. 2006; Toll-Rieraet al. 2009; Ezkurdia et al. 2014), often as-sign different ages to the same gene. Sofar, no genome-wide comparison hasbeen performed to assess their relativeperformance to allow a rational choice.Second, the annotation for new genes isunstable, often shifting between pro-tein-coding and noncoding modelsacross releases. For example, 660 pri-mate-specific coding models annotatedin Ensembl v51were reannotated as non-coding models, for example, pseudo-genes, in a later release (v65) (Hubbardet al. 2007; Zhang et al. 2010b, 2012). Amajor reason is the uncertainty of theprotein-coding potential for these loci(Zhang et al. 2012). Two approacheshave been proposed to assess the codingpotential of new genes, namely, thedetection of protein-level evolutionaryconstraint (Betrán et al. 2002; Mudgeand Harrow 2016; Xu and Zhang 2016)and peptide search in proteomic datasets (Kim et al. 2014; Wright et al. 2016).Nevertheless, the performance of thesetwo strategies has not been studied on agenome-wide level.
To tackle these challenges, we devel-oped GenTree (http://gentree.ioz.ac.cn/).This resource features age inferencesfrom major genome-wide dating meth-ods or small-scale manual curation.GenTree also presents evolutionary andproteomic evidence for assessing the pro-tein-coding potential. Based on such a re-source, we performed extensive meta-analysis: (1) We compared the strengthsand weaknesses between various datingmethods; (2) we curated a data set of254 PSGs with coding potential; and (3)we finally examined the overall function-al properties of PSGs.
Results
GenTree is an integrated database for new genes in the human
genome
As a new-gene–focused database, GenTree is designed to enable us-ers to evaluate when and how a gene arises and what type of func-tion it may have (Fig. 1).
On the back end, we first applied our previously developedsynteny-based dating pipeline (SBP) (Zhang et al. 2010a,b) todate all human protein-coding genes in Ensembl (Flicek et al.2012) v73 (Supplemental Fig. S1; Methods). To compare SBP esti-mates with those from protein-family–based methods, we incor-porated into GenTree two widely used age data sets from thephylostratigraphy (Domazet-Lošo and Tautz 2010) andProteinHistorian (Capra et al. 2012) databases. Origination mech-anisms were inferred for genes that postdated the vertebrate split.To assess the potential functions of new genes, we integratedpublicly available functional genomics data and population
Figure 1. The overall architecture of GenTree. It integrates three types of data: (1) gene annotationdata from Ensembl; (2) gene age inference and originationmechanism inference data; and (3) gene func-tion information based on either functional genomic data including Human Protein Atlas (HPA),Genotype-Tissue Expression (GTEx), Human Proteome Map (HPM) and BrainSpan (http://www.brainspan.org) data, quantitative genetic data (genome-wide association data fromGWASdb2), and se-lection data (positive selection tracks from PopHuman).
Evolution and function of primate-specific genes
Genome Research 683www.genome.org

genomic data while accounting for the uncertainty due to thesimilarity between paralogs if possible (Methods).
On the front end,GenTree implements a user-friendlyweb in-terface to provide both individual gene information and summary
statistics of gene families or functional groups. To showcase thefunctionality of GenTree for individual genes, we use the afore-mentioned GLUD2 as an example. As shown in Figure 2A, amouse-over will show the SBP dating result, which is in agreementwith previous studies (Fig. 2A, branch 10; Supplemental Fig. S1;Burki and Kaessmann 2004). GenTree also shows evidence forGLUD2originating via RNA-based duplication: It has a single exon,whereas the parental gene GLUD1 has multiple exons (Fig. 2B).Lastly, GenTree presents functional genomic data (HumanProtein Atlas [HPA]), showing that GLUD2 is predominantlyexpressed in the testis (Fig. 2C), consistent with both the knowntestis bias of new genes (Vinckenbosch et al. 2006; Kaessmann2010) and the previous literature for GLUD2 (Spanaki et al. 2010).GenTree allows the user to compare the expression profile of thenew gene to the parental gene by showing that the parental copyfor GLUD2, that is, GLUD1, is more strongly and more broadly ex-pressed (Fig. 2C).Notably, after removing testis data, theexpressionlevels of GLUD1 and GLUD2 are in fact positively correlated (Fig.2D). This pattern has been discovered for retrogene and parentalgene pairs in rice and zebrafish (Sakai et al. 2011; Zhong et al.2015). The Genotype-Tissue Expression (GTEx) data (The GTExConsortium2015) show similar correlation (Supplemental Fig. S2).
Besides single gene annotation, GenTree provides summarystatistics for genes with the same Gene Ontology (GO) term (Ash-burner et al. 2000) or InterPro family annotation (Hunter et al.2009). In both cases, we calculated the gene age distribution foreach GO or InterPro family category, divided by chromosomes.For example, the Krueppel-associated box C2H2 zinc-finger pro-tein family (KZNF) was known to have expanded especially onChromosome 19 (Chr 19) of humans (Nowick et al. 2010, 2011).Consistent with this, the chromosomal browser view (Supplemen-tal Fig. S3) revealed that KZNFs are enriched for PSGs (82 or 11%)compared with the genome-wide background (354 or 1.8%, Fish-er’s exact test [FET] P=2.2 ×10⁻¹⁶), with Chr 19 harboring 55(67%) entries.
SBP performs dating at the individual gene level based on syntenic
alignment, whereas phylostratigraphy and ProteinHistorian act at
the gene family level based on protein alignment
To be comprehensive, GenTree provides users with multiplegene dating data, namely, SBP and protein-family–based ages
A
B
C
D
Figure 2. Representative sections in the gene page of GenTree databaseshowing the evolutionary and functional features of GLUD2. (A) Branchview of GLUD2. When the mouse is placed over the branch on whichGLUD2 originated, the top left tooltip shows the inferred age, that is,branch 10. For the external leaf node, the black line indicates the syntenicalignment, and the gray line indicates the nonsyntenic alignment. Whenthe mouse is placed over an external node, that is, gibbon, the top righttooltip shows the alignment details in this species. Photo courtesy of JimZuckerman, Gibbon Conservation Center. (B) Paralogous alignment be-tween GLUD2 and its parental gene, GLUD1. The top row shows thegene structure of GLUD2 with the open reading frame (ORF) indicatedin a blue block and the untranslated region (UTR) indicated in an unfilledblock. The gene structure of GLUD1 on the bottom is likewise indicated.The diagram in the center shows the protein alignment at the exon level,which is triggered by mouse-over. Mismatches are indicated in red.Users can zoom into a specific region of interest. (C) HPA transcriptomeprofile across tissues for the two paralogs. For each tissue, themean expres-sion across replicates is shown as the log2-transformed FPKM value.(D) Scatter plot view of expression intensity. Users can disable samplesfrom some tissue (e.g., testis) and zoom into an area filled with data pointsof interest. Accordingly, the Pearson’s correlation and P-value across the re-maining samples (e.g., without testis) are recalculated automatically.
Shao et al.
684 Genome Researchwww.genome.org

(phylostratigraphy and ProteinHistorian) (Fig. 1). We performedgenome-wide comparisons between them to determine their suit-ability for dating PSGs.
Overall, SBP was consistent with phylostratigraphy and Pro-teinHistorian for 60% of all genes (Fig. 3A). However, the consis-tency for young genes is much lower than that for older genes.Specifically, for PSGs dated by SBP, the majority (>90%) were as-signed to older branches by phylostratigraphy, whichmainly com-prise DNA- and RNA-mediated duplicates (Fig. 3B). In comparison,orphans or candidate de novo genes show a higher consistently(75% vs. 6%, FET P=9.8 ×10⁻⁴). Such a pattern is expected becausephylostratigraphy assigns the age of the oldest member to thewhole family (Domazet-Lošo et al. 2007). ProteinHistorian is sim-ilar as phylostratigraphy (Fig. 3C) except in the case of a patchyphylogenetic distribution, that is, candidate orthologs are lost insome ingroup lineages. In those situations, ProteinHistorian mayinfer multiple recent gains rather than one ancient origination(Capra et al. 2013). This should contribute to our observationthat ProteinHistorian sometimes infers a younger age than SBPdoes (Fig. 3A,C).
Different from phylostratigraphy and ProteinHistorian, SBPrelies on syntenic relationshipsbasedonwhole-genomealignmentand distinguishes different duplicates. Although this makes SBPsuitable for dating recently originated genes, the same feature lim-its its ability to date evolutionarily old genes because only 70% ofall genes show conserved synteny between humans and zebrafish(Barbazuk et al. 2000). In practice, SBP collapses all genes predatinghuman–zebrafish split into a single age group. In contrast, family-level dating is applicable over a broader time range due to both itsscalability and low decay rate of proteins (Albà and Castresana2007; McLysaght and Hurst 2016).
Besides gene or family-level dating, SBP and protein-family–based methods differ with respect to their dependence on annota-tion quality for reference species. On one hand, SBP relies only ongenomic alignment, hence it is insensitive to annotation quality,which is crucial for protein-family–based methods. On the otherhand, SBP only tracks the presence or absence of syntenic DNAfragments in the reference species with respect to the gene in thefocal species and not whether those syntenic fragments are tran-scribed and translated into a protein. Thus, SBP can overestimateage when a reference species harbors the orthologous DNA butdoes not express the protein. Taking the myeloma overexpressed(MYEOV) gene as an example, SBP showed that the DNA sequenceemerged in a common ancestor of humans and opossums(Supplemental Fig. S4A). However, MYEOV has been reported tobe a primate-specific de novo protein-coding gene (Chen et al.2015), which is also supported by phylostratigraphy andProteinHistorian (Supplemental Fig. S4B,C).
By presenting both the gene- and family-level dating results,GenTree allows users to have a comprehensive view and choosethe most appropriate age estimate based on the specific context.Taking the aforementioned GLUD2 as an example, both SBP andthe previous synteny-based report (Burki and Kaessmann 2004)showed that GLUD2 is a hominoid-specific retrogene, whereasphylostratigraphy and ProteinHistorian dated this gene back tothe common ancestor of cellular life (Supplemental Fig. S5). Thelatter assignment is consistent with the gene family, includingGLUD2, being evolutionarily old. Indeed, SBP dates the othermember of the family, that is, GLUD1, as predating the vertebratesplit (Supplemental Fig. S6). Together, the results of the threemethods for this family suggest that GLUD1 is an old gene sharedby cellular organisms, whereas GLUD2 is a PSG.
SBP detects and controls for
less reliable synteny
The quality of synteny constructed bywhole-genome alignment (Kent et al.2003) determines the accuracy of datingresult of SBP. In the initial release ofSBP, we introduced two functionalitiesto detect and mask less reliable synteny(Zhang et al. 2010a,b). We first excludedgenes that have>70%of exons consistingof transposable elements (TEs). TEs areknown to form nested clusters in mam-mals (Abrusán et al. 2008) and thus causedifficulties in between-species align-ment. Even if a TE does not form a clust-er, the identification of its bona fideortholog is oftennot straightforward. Fol-lowing a similar reason, we excludedY-linked genes because Chromosome Yis full of TEs and remains poorly assem-bled for most reference species. Overall,the filter of TEs led to the exclusion of177 (0.9%) genes.
Second, we dealt with recently du-plicated genes, which tend to have low-quality synteny because of the difficultyin assembly or alignment. We cannotsimply mask all recent duplicates, how-ever, because they account for a large
A B
C
Figure 3. Comparison of gene age estimates between SBP, phylostratigraphy, and ProteinHistorian.Panel A shows the statistics for all genes; panels B and C focus on SBP-dated PSGs and group them basedon their origination mechanism.
Evolution and function of primate-specific genes
Genome Research 685www.genome.org

number of PSGs (Bailey and Eichler 2006; Kemkemer et al. 2009).Instead, we identified and masked 661 (3%) genes that showpatchy phylogenetic distribution of orthologs, which often sug-gest problematic synteny inference (Methods). For example, awell-known human-specific duplicated fusion gene, CHRFAM7A(Costantini et al. 2015), showed reciprocal synteny in orangutanbut not in chimpanzee and gibbon (Supplemental Fig. S7A). Givensuch a patchy distribution of candidate orthologs, we masked thisgene from dating. Actually, the aforementioned synteny was de-tected based on the old orangutan assembly (Supplemental Fig.S7A), which disappeared on the new orangutan assembly (Supple-mental Fig. S7B). Such a scenario is likely due to a sequencing gapin the old assembly (Supplemental Fig. S7C), and thus it makessense to mask this gene. Furthermore, primate-specific syntenybreaks are known to be enriched with recent duplicates (Kem-kemer et al. 2009). For 82 coding genes located in synteny breaks,12 (15%, Supplemental Table S1, Methods) were masked and 27(33%) were dated as PSGs, both of which are significantly higherthan the background proportion (binomial test P< 1×10⁻⁴).
In this work, we added a third filter to control for spurioussynteny caused by convergent dispersed duplication. As shownin the case of GLUD2, our original implementation of SBP (Zhanget al. 2010b) dated its origination to just before the split of humanand rhesus macaque. However, the previous work (Burki andKaessmann2004) showed thatGLUD2predated the split of humanand gibbon (Fig. 2A). We traced this discrepancy to errors in thesynteny inference in which the UCSC synteny view and manualsequence alignments showed that an independent retropositionoccurred in the evolution of rhesus monkey, which confoundedthe construction of synteny (Fig. 4; Supplemental Fig. S8). To han-dle such scenarios, we took advantage ofUCSC annotations of syn-teny tracks and excluded nonsyntenic maps, which affected 182(1%) genes (Methods).
Gene dating by SBP is robust across Ensembl releases
and conservative for PSGs
We previously showed the general consistency of SBP with a fewsmall-scale synteny-based data sets of gene ages (Zhang et al.2010a,b). Given the availability of multiple SBP-based genome-wide age data releases and recently generated data sets of PSGsand HSGs, we herein perform a more thorough comparison be-tween this work and published data sets.
First, we compared the current estimates with previous SBP-based estimates (Zhang et al. 2010b, 2012). It is worth notingthat the SBP method used in the present work is not differentfrom what was used previously, except the newly added filter fornonsyntenic maps. We thus focused on how different Ensemblversions affect age estimates of SBP. As shown in Figure 5A, the ef-fect of Ensembl releases on the age estimate is small: BetweenEnsembl v51 and v73, 18% of the genes were assigned different
ages. The difference between Ensembl v65 and v73 is even smaller,affecting just 5% of the genes. The relatively large difference be-tween v51 and v73 is attributable to the following factors: (1) dif-ferences in the human genome assemblies (NCBI build 36 vs.GRCh37); (2) changes in the genome alignments owing to updatesin both the human genome and the reference genome assemblies;and (3) gene structure changes (e.g., newly annotated exons) ow-ing to updates in human gene annotation. In contrast, v65- andv73-based age data share the same human genome assembly,and the differences of reference species assemblies or gene annota-tions are also minor.
Next, we compared SBP-based estimates with three recentlypublished lists of HSGs or PSGs, two of which are based on synteny(Dennis et al. 2017; Florio et al. 2018) and one based on phyloge-netic tree reconstruction (Jacobs et al. 2014).We found that, on av-erage, our results agree with the published lists in 50% of the cases(Fig. 5B; Supplemental Table S2). Among those that do not agree,25% (e.g., the aforementioned CHRFAM7A) were attributable togenes being masked in our dating pipeline because of unreliablesynteny.
For the remaining 25% of the cases, our estimates are olderthan the published estimates. The first reason for this is becausewe separately evaluated each exon in a gene, and when the resultsfor all exons do not agree, we used the age of the oldest exon as theage estimate of the entire gene. Our rationale is that the oldestexon, being the most conserved, is likely also the most importantfor the gene’s function. In cases in which exons have different agedue to exon shuffling or partial duplication, the age of genewill besomewhat ambiguous (Capra et al. 2013). For example, theankyrin repeat domain 20 family member A2 (ANKRD20A2) isclassified as human-specific by Florio et al. (2018). However, theUCSC syntenic view showed that ANKRD20A2 is human-specificin its middle exons but orthologous with chimpanzee in terminalexons (Supplemental Fig. S9). This is why SBP dated this gene inthe common ancestor of human and chimpanzee. A secondreason could be intrinsic methodological difference. Specifically,Jacobs et al. (2014) focused on 14 primate-specific KZNFs identi-fied based on reconstructed gene trees. SBP assigned an older agefor six of the 14 cases. Because KZNFs are prone to gene conversionbecause of their tandem arrangement (Nowick et al. 2013), distor-tion of gene trees may occur. Therefore, SBP estimates could bemore reliable for these cases.
In summary, we conclude that SBP is suitable for dating newgenes, with its pros and cons listed below. On the up side, SBP as acomputational pipeline is applicable to the genome-wide dating. Itis robust to genome releases and is insensitive to the quality of an-notation in the reference species. On the down side, SBPonly looksfor syntenic DNA fragments without assessing their transcriptionand translation potential, resulting in overestimates for de novoproteins. It also masks genes that have low-quality syntenic rela-tionships with reference species, and this group is known to be en-riched with young duplicates.
Given its strength and limitations, our final list of 805PSGs consist of 777 entries dated by SBP plus 10 entries reportedin the literatures but were excluded in our pipeline (e.g.,CHRFAM7A, Supplemental Table S3) and 18 published primate-specific de novo genes (Chen et al. 2015; Ruiz-Orera et al. 2015;McLysaght and Hurst 2016). For the 18 de novo genes, eightare supported by phylostratigraphy and ProteinHistorian,whereas the remaining 10 are not included in their dating results,possibly due to differences in the Ensembl versions (SupplementalTable S3).
Figure 4. Two independent retropositions of GLUD1 in primateevolution.
Shao et al.
686 Genome Researchwww.genome.org

At least a portion of PSGs encode proteins, as supported
by evolutionary constraint or peptide mapping
A second challenge in the study of PSGs is the instability oftheir annotation, as shown by changes from coding genes topseudogenes between Ensembl releases (Zhang et al. 2012).We reasoned that PSGs with protein evidence are more likelyto play an important role than those without. Therefore, we sys-tematically evaluated the coding potential of PSGs by combin-ing two approaches. The first took evolutionary information,that is, signatures of selective constraints for coding sequences.The second method searched peptides derived from the HumanProteome Map (HPM) covering 30 tissues or cell types (Kim et al.2014).
Our evolutionary approach is basedon the assumption that protein-codinggenes generally show lower rates ofnonsynonymous substitutions than syn-onymous ones (Ka/Ks < 1), with theexception of genes under positive selec-tion. In total, we implemented four relat-ed tests. First, we used the conventionalKa/Ks test based on two orthologous se-quences (Yang 2007). To have sufficientpower (enough substitutions betweenthe orthologs), this test requires the pres-ence of a relatively distant ortholog. Wethus applied this test to 94 PSGs predat-ing the human–monkey split (Xu andZhang2016;Methods). Among these cas-es, we found 51 (54%) cases with a Ka/Ks
value significantly smaller than one (q<0.05, Table 1; Supplemental Table S4).
For duplicated PSGs that emergedafter the human–rhesus split (branches10–13 in Supplemental Fig. S1, e.g.,GLUD2), we applied two modified ver-sions of the Ka/Ks test. First, we comparedthe child copy with the parental copy in-stead of with the ortholog in a referencespecies. Under the null hypothesis in
which the parental copy is under constraint (Ka/Ks < 1) and thechild copy is nonfunctional (Ka/Ks = 1), we expect the Ka/Ks ratiobetween the child and parental copies to be less than one butnot significantly lower than 0.5 (Betrán et al. 2002). A paralogousKa/Ks ratio significantly lower than 0.5 is therefore taken as evi-dence for constraints on both copies. We applied this method to124 pairs (Methods) and found five (4%) to be significant at thisconservative threshold (Table 1; Supplemental Table S5). Second,we performed a branch-level test that included orthologous genesof parental genes in outgroup species (Methods). Because this testcan examine the selection pressure specifically on the child genebranch, it is expected to have a higher power compared to theparalogous test. Consistently, out of 74 cases, 14 are significant(14/74 vs. 5/124, FET P=0.001, Supplemental Table S6).
Table 1. Statistics of evolutionary tests and proteogenomics mapping
Method Gene model Branch Total count Detected genes (q<0.05)
Ka/Ks < 1Orthologous Ka/Ks test Coding 0–7 13,852 12,159 (98%)
8–9 94 51 (54%)Pseudogene 8–9 3144 1 (0.03%)
Ka/Ks < 0.5Paralogous Ka/Ks test Coding 0–9 628 410 (65%)
10–13 124 5 (4%)Ka/Ks < 1
Branch test Coding 8–9 64 22 (34%)10–13 74 14 (19%)
CountN/Count(N+S) < 0.7Polymorphism-based test Coding 0–9 18,948 4183 (22%)
10–13 524 4 (0.8%)With peptide
Proteogenomics Coding 0–7 18,669 9575 (51%)8–13 803 46 (5.7%)
Pseudogene 8–13 9928 40 (0.4%)
(CountN) Number of nonsynonymous polymorphisms.(Count(N+S)) Total number of nonsynonymous and synonymous polymorphisms.
A B
Figure 5. Evaluation of SBP-dated ages. (A) Bar plot showing percentage of genes with consistent,older, or younger ages in earlier SBP dating based on Ensembl v51 and v65 compared to the currentwork based on Ensembl v73. Only coding gene models maintained across different Ensembl releasesare used. (B) Comparison between the current SBP release (Ensembl v73) and three published human-specific gene (HSG) or primate-specific gene (PSG) lists.
Evolution and function of primate-specific genes
Genome Research 687www.genome.org

Finally, we applied the polymorphism-based test for PSGspostdating the human and rhesus macaque split. This method isconceptually similar to the orthologous Ka/Ks test but uses poly-morphism instead of divergence (Moyers and Zhang 2016). For acoding region under neutrality, the ratio of nonsynonymous poly-morphisms and all polymorphisms will be equal to that from themutational input, which is approximately 0.7. A statistical paucityof nonsynonymous polymorphisms compared with that expectedtherefore indicates a protein-level constraint. We applied this testto 524 PSGs with at least one SNP available in the 1000 Genomeshuman variation data (The 1000 Genomes Project Consortium2015) and found that only four of the 524 (0.8%) cases exhibiteda significantly lower level of nonsynonymous polymorphisms(Table 1; Supplemental Table S7). This low fraction is unsurprisinggiven that the polymorphism-based test is known to have lowpower to detect the signals of selection, because deleterious muta-tions can segregate at low frequencies before being removed by se-lection (Kryazhimskiy and Plotkin 2008).
In total, the four tests identified 93 (12%) PSGs under nega-tive selection. In contrast, the tests applied to the old genes alwaysyield much higher percentages (Table 1). This suggests that oldgenes in general experience stronger selective constraints becauseof their higher expression levels (Zhang et al. 2012; Zhang andYang 2015).
Next, we searched the proteomic database for peptideevidence of the candidate PSGs. We processed the raw mass spec-trometry data from all 30 HPM samples (Kim et al. 2014) by distin-guishing child and parental copies (Methods). Among the PSGs, 46(5.7%) had matching peptides. In contrast, 51% of the old genes(non-PSGs) had peptide evidence (Table 1; Supplemental TableS8). Among the expressed PSGs, ∼20% are predominantly ex-pressed in the testis (Supplemental Fig. S10), which is consistentwith the testis bias observed at the transcriptional level for newgenes (Vinckenbosch et al. 2006; Kaessmann 2010).
Combining the evolutionary tests and proteomic evidence,we identified a total of 123of 805 (15%) codingPSGs thatwere sup-ported by at least onemethod (Supplemental Table S9). Among 46PSGs with peptide evidence, 16 (35%) were also supported by evo-lutionary analyses (Supplemental Fig. S11). Suchmoderate overlapcould arise from method-specific false negatives or false positives.For example, the HPM proteomics data set recovered only half ofthe non-PSGs, likely due to the limited tissues that were sampled.A search of the 805 PSGs in the UniProt database (The UniProtConsortium 2015) revealed that 66 out of the 123 (54%) havebeen experimentally shown to encode proteins (SupplementalFig. S11). In contrast, only 90 (13%) of the remaining 682 PSGswere experimentally supported based on UniProt. This suggeststhat the evolutionary and proteogenomic analyses we conductedare capable of identifying bona fide protein-coding genes.
After including the 90 PSGs with experimental supportfrom UniProt, we obtained a nonredundant data set of 213 (28%,123+90) PSGs that are protein coding. This represents the best an-notation we can achieve at this time. In comparison, 16,252 of the18,669 (87%) non-PSGs are supported by at least one type ofevidence.
Forty-one primate-specific pseudogenes may encode proteins,
and thus the human genome likely encodes 254 PSGs with coding
evidence
Our initial list of 805 PSGs consists of Ensembl-annotated pro-tein-coding genes and experimentally characterized PSGs report-
ed in the literature (Supplemental Table S3). Given the difficultyof differentiating protein-coding genes from pseudogenes (Zhanget al. 2012; Mudge and Harrow 2016), we asked whethersome primate-specific pseudogenes (PSPGs) may in fact encodeproteins. To address this question, we performed computa-tional analyses for 9928 SBP-dated PSPGs (Methods) as we didfor PSGs.
Based on the open reading frames (ORFs) predicted accordingto the coding paralogs, we applied the orthologousKa/Ks test to the3144 PSPGs that predated human and rhesus monkey split, whichshows relatively higher sensitivity (Table 1, Methods). However,consistent with PSPGs being annotated as pseudogenes inEnsembl, we identified only one entry under selective constraints(Table 1; Supplemental Table S10). Next, we queried the ORFs ofthe PSPGs against the HPM data and detected 40 translated entries(Table 1; Supplemental Table S11). For the nonredundant data setof 41 PSPGs, the protein-coding potential of 38 cases is further sup-ported by ribosome-profiling data (Supplemental Table S12),which captures actively translated mRNAs collected by theGWIPS-viz database (Michel et al. 2015).
The criteria for annotating a pseudogene is the presence ofpremature termination codons (PTCs) or frame-disrupting indelsrelative to their coding homologs. The truncated transcript couldbe targeted by nonsense-mediated mRNA decay, and thus no pro-tein ismade (Yang et al. 2015). This, however, is not necessarily thecase, and a short protein can be expressed and be functional (Xuand Zhang 2016). Indeed, for 37 of the 41 PSPGs identified above(Supplemental Table S12), proteogenomics or selective constraintssuggest a short ORF (e.g., Supplemental Fig. S12), which is consis-tent with the presence of PTCs or indels. For the remaining fourgenes, we unexpectedly found that the proteomic evidence sup-ports two tandemly linked short ORFs rather than a single truncat-ed protein. In other words, these represent new gene structuresthat emerge from the fission of an ancestrally larger protein.
Oneof the four cases,MYH16,wasbelieved tobeapseudogenedue to a frame-disrupting indel, whose pseudogenization couldcause jaw-dropping and brain expansion in human evolution(Stedman et al. 2004). Herein, we found that its fission status iswell supported. Specifically, as shown in Figure 6, both mRNAand EST sequences strongly support a transcript with 41 intronsflanked by the canonical splicing junction (GT-AG). This transcriptcould be translated as two ORFs based on the ancestral frame,which exactly flanks the indel. The HPM proteomics data showedthat both the upstream and downstream ORFs are expressed withmultiple matching peptides. Analogously, the ribosome-sequenc-ing data support the existence of both ORFs (Fig. 6). These dataare consistent with two previous reports: (1) The orthologous Ka/Ks values between human and chimp are less than one for bothORFs, although the difference is significant only for the upstreamORF (Perry et al. 2005); and (2) mass spectrometry data supportthe coding potential of the downstream ORF, which was furthervalidated by synthetic peptides (Branca et al. 2014). Moreover,MYH16 is one of six PSGs that show signatures of recent positive se-lectionbasedon thePopHumandatabase (SupplementalTable S13,Methods). In particular, this locus has a high integrated HaplotypeScore (iHS) (Voight et al. 2006) and Cross Population ExtendedHaplotype Homozygosity (XP-EHH) (Sabeti et al. 2007) in theEuropean population (Fig. 6).
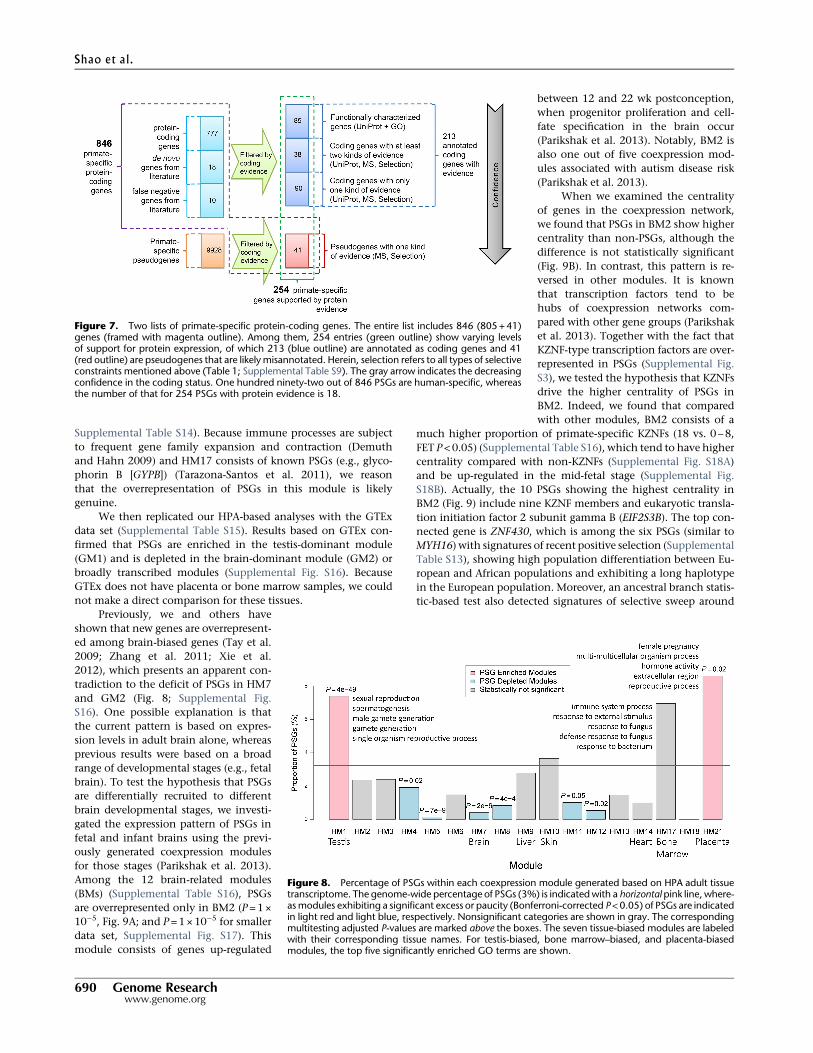
In summary, we identified 41 annotated PSPGs that are likelyto encode proteins. Together with the 213 PSGs identified in theprevious section, a total of 254 candidate PSGs are supported byat least one type of protein-level evidence (Fig. 7). Among them,
Shao et al.
688 Genome Researchwww.genome.org

85 are relatively well characterized, as supported by both protein-level expression in UniProt and GO terms (Supplemental TableS9). An additional 38 PSGs are supported by two types of proteinevidence.
Notably, although we did not specify a cutoff of ORF lengthfor annotated protein-coding genes, the majority (85%, Supple-mental Fig. S13) of PSGs are longer than the often-used cutoff of100 amino acids (Hangauer et al. 2014). Under another cutoff de-signed for new genes, that is, 50 amino acids (Zhao et al. 2014),the proportion increases to 96%. For the small data set with codingevidence, the proportion will be 96% (>100) and 100% (>50),respectively.
PSGs are preferentially involved in
spermatogenesis, mother–fetus
interactions, defense responses,
and brain development
To gain insight into the potential func-tions of the PSGs, we used the HPAtranscriptome data integrated in GenTreeand performed weighted gene coexpres-sion network analysis (WGCNA) (Lang-felder and Horvath 2008) for the 846(801+45) candidate PSGs (Fig. 7; Meth-ods). We identified 17 HPA-based mod-ules (HMs), seven of which (HM1, -7, -9,-10, -14, -17, -21) were tissue biased (Sup-plemental Fig. S14; Supplemental TableS14). Among these seven modules, HM1is associatedwith testis-dominant expres-sion (Supplemental Fig. S14A,B), and GOterm enrichment analysis suggested thatHM1 genes are involved in spermatogen-esis (Fig. 8, Methods).
In addition to the well-known testisbias of new gene expression (HM1)(Vinckenbosch et al. 2006; Tay et al.2009; Kaessmann 2010; Xie et al. 2012),we found a similar extent of enrichmentof PSGs in the placenta-biased module(HM21 in Fig. 8; Supplemental Fig.S14A,B). For example, one membergene, that is, primate-specific galectin16 (LGALS16), has been shown to medi-ate maternal–fetal interaction by pro-moting immune cell death (Than et al.2009). LGALS16 shows strong LD in Afri-can population as shown by an outlieriHS score (1.81, Supplemental TableS13), suggesting that this gene may besubject to local adaptation. In contrast,HM7, which contains adult brain-biasedgenes, shows a significant deficit ofPSGs. This finding is consistent withthe observation that the adult brain tran-scriptome is conserved between humansand mice (Strand et al. 2007). Similarly,the 10 modules containing broadly ex-pressed genes tend to consist of fewerPSGs than the genome average, althoughthis difference is significant for only fivemodules (HM4-5, HM8, HM11-12) (Fig.
8). This pattern is also consistent with the known tendency ofnew genes to be tissue-specific (Zhang et al. 2012).
To increase our confidence in the above trends (Fig. 8), werepeated the enrichment analyses in the smaller data set of 254PSGs with protein evidence. All patterns were reproducible (Sup-plemental Fig. S15), although the statistical significance was of-ten lower because of the smaller sample size. One exceptionwas HM17, for which the enrichment of PSGs was more sig-nificant in the smaller data set (P= 0.02) than in the full dataset (P=0.18). The genes in HM17 are mainly transcribed inbone marrow and have functions related to immune responses(enriched GO terms in Fig. 8; Supplemental Fig. S14A,B;
Figure 6. Gene structure and expression ofMYH16. The UCSC Genome Browser snapshot around theMYH16 locus is presented. The tracks including “FilteredmRNA” and “Filtered EST” show only the entriesthat are uniquely mapped to this locus. Because these mRNA and ESTs share a single compatible exon–intron structure, one transcript encoding 43 exons can be inferred, as shownby the GENCODE (Ensembl)pseudogene annotation track.MYH16 can therefore be translated as two ORFs separated by the indel (adeletion of “AC”), whose position is highlighted by the purple arrow. Two continuous exons supportedby four ESTs (e.g., DY655550) are highlighted by a purple frame, indicating that these two ORFs are en-coded by a single transcript. Uniquelymapping peptides detected by two algorithms (MaxQuant, pFind)and Ka/Ks values reported by Perry et al. (2005) are shown. The iHS and XP-EHH tracks from PopHumanwere added, with the 95th percentile indicated by the purple line. CEU and YRI represent one Europeanpopulation and one African population, respectively.
Evolution and function of primate-specific genes
Genome Research 689www.genome.org
Supplemental Table S14). Because immune processes are subjectto frequent gene family expansion and contraction (Demuthand Hahn 2009) and HM17 consists of known PSGs (e.g., glyco-phorin B [GYPB]) (Tarazona-Santos et al. 2011), we reasonthat the overrepresentation of PSGs in this module is likelygenuine.
We then replicated our HPA-based analyses with the GTExdata set (Supplemental Table S15). Results based on GTEx con-firmed that PSGs are enriched in the testis-dominant module(GM1) and is depleted in the brain-dominant module (GM2) orbroadly transcribed modules (Supplemental Fig. S16). BecauseGTEx does not have placenta or bone marrow samples, we couldnot make a direct comparison for these tissues.
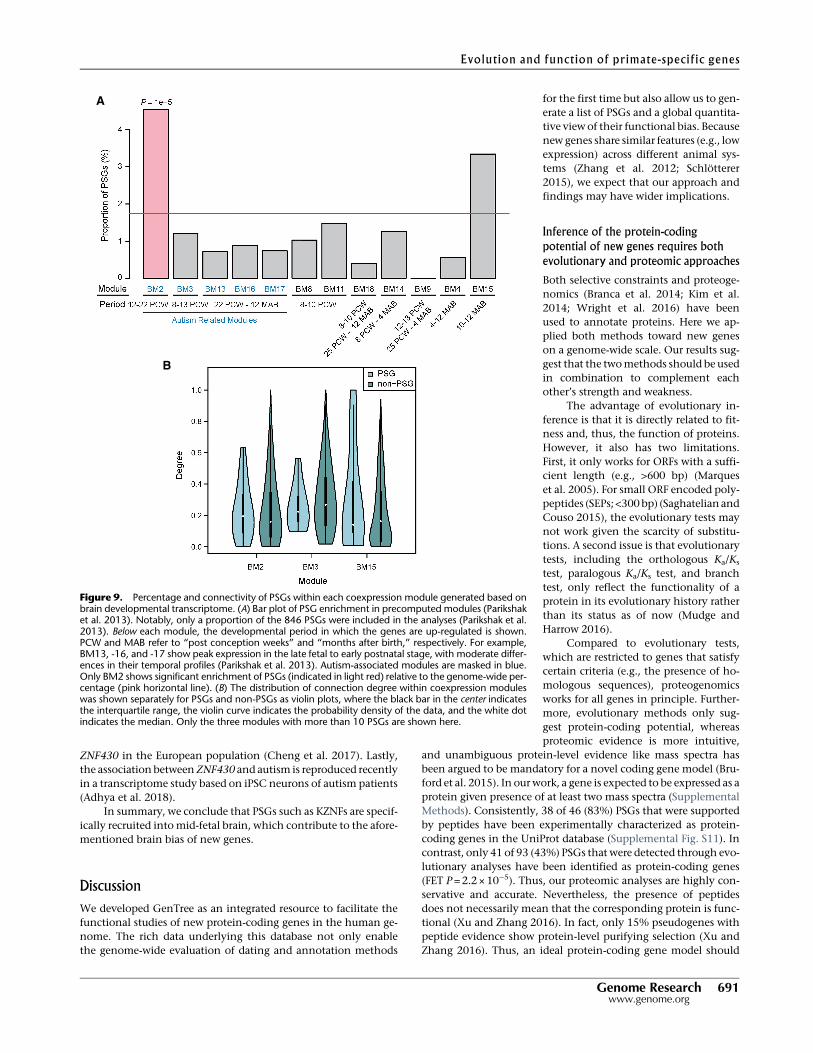
Previously, we and others haveshown that new genes are overrepresent-ed among brain-biased genes (Tay et al.2009; Zhang et al. 2011; Xie et al.2012), which presents an apparent con-tradiction to the deficit of PSGs in HM7and GM2 (Fig. 8; Supplemental Fig.S16). One possible explanation is thatthe current pattern is based on expres-sion levels in adult brain alone, whereasprevious results were based on a broadrange of developmental stages (e.g., fetalbrain). To test the hypothesis that PSGsare differentially recruited to differentbrain developmental stages, we investi-gated the expression pattern of PSGs infetal and infant brains using the previ-ously generated coexpression modulesfor those stages (Parikshak et al. 2013).Among the 12 brain-related modules(BMs) (Supplemental Table S16), PSGsare overrepresented only in BM2 (P=1 ×10⁻⁵, Fig. 9A; and P=1×10⁻⁵ for smallerdata set, Supplemental Fig. S17). Thismodule consists of genes up-regulated
between 12 and 22 wk postconception,when progenitor proliferation and cell-fate specification in the brain occur(Parikshak et al. 2013). Notably, BM2 isalso one out of five coexpression mod-ules associated with autism disease risk(Parikshak et al. 2013).
When we examined the centralityof genes in the coexpression network,we found that PSGs in BM2 show highercentrality than non-PSGs, although thedifference is not statistically significant(Fig. 9B). In contrast, this pattern is re-versed in other modules. It is knownthat transcription factors tend to behubs of coexpression networks com-pared with other gene groups (Parikshaket al. 2013). Together with the fact thatKZNF-type transcription factors are over-represented in PSGs (Supplemental Fig.S3), we tested the hypothesis that KZNFsdrive the higher centrality of PSGs inBM2. Indeed, we found that comparedwith other modules, BM2 consists of a
much higher proportion of primate-specific KZNFs (18 vs. 0 –8,FET P<0.05) (Supplemental Table S16), which tend to have highercentrality compared with non-KZNFs (Supplemental Fig. S18A)and be up-regulated in the mid-fetal stage (Supplemental Fig.S18B). Actually, the 10 PSGs showing the highest centrality inBM2 (Fig. 9) include nine KZNF members and eukaryotic transla-tion initiation factor 2 subunit gamma B (EIF2S3B). The top con-nected gene is ZNF430, which is among the six PSGs (similar toMYH16) with signatures of recent positive selection (SupplementalTable S13), showing high population differentiation between Eu-ropean and African populations and exhibiting a long haplotypein the European population. Moreover, an ancestral branch statis-tic-based test also detected signatures of selective sweep around
Figure 8. Percentage of PSGs within each coexpression module generated based on HPA adult tissuetranscriptome. The genome-wide percentage of PSGs (3%) is indicatedwith a horizontal pink line, where-asmodules exhibiting a significant excess or paucity (Bonferroni-corrected P<0.05) of PSGs are indicatedin light red and light blue, respectively. Nonsignificant categories are shown in gray. The correspondingmultitesting adjusted P-values are marked above the boxes. The seven tissue-biased modules are labeledwith their corresponding tissue names. For testis-biased, bone marrow–biased, and placenta-biasedmodules, the top five significantly enriched GO terms are shown.
Figure 7. Two lists of primate-specific protein-coding genes. The entire list includes 846 (805 +41)genes (framed with magenta outline). Among them, 254 entries (green outline) show varying levelsof support for protein expression, of which 213 (blue outline) are annotated as coding genes and 41(red outline) are pseudogenes that are likelymisannotated. Herein, selection refers to all types of selectiveconstraints mentioned above (Table 1; Supplemental Table S9). The gray arrow indicates the decreasingconfidence in the coding status. One hundred ninety-two out of 846 PSGs are human-specific, whereasthe number of that for 254 PSGs with protein evidence is 18.
Shao et al.
690 Genome Researchwww.genome.org
ZNF430 in the European population (Cheng et al. 2017). Lastly,the associationbetweenZNF430 and autism is reproduced recentlyin a transcriptome study based on iPSC neurons of autism patients(Adhya et al. 2018).
In summary, we conclude that PSGs such as KZNFs are specif-ically recruited intomid-fetal brain, which contribute to the afore-mentioned brain bias of new genes.
Discussion
We developed GenTree as an integrated resource to facilitate thefunctional studies of new protein-coding genes in the human ge-nome. The rich data underlying this database not only enablethe genome-wide evaluation of dating and annotation methods
for the first time but also allow us to gen-erate a list of PSGs and a global quantita-tive viewof their functional bias. Becausenew genes share similar features (e.g., lowexpression) across different animal sys-tems (Zhang et al. 2012; Schlötterer2015), we expect that our approach andfindings may have wider implications.
Inference of the protein-coding
potential of new genes requires both
evolutionary and proteomic approaches
Both selective constraints and proteoge-nomics (Branca et al. 2014; Kim et al.2014; Wright et al. 2016) have beenused to annotate proteins. Here we ap-plied both methods toward new geneson a genome-wide scale. Our results sug-gest that the twomethods should be usedin combination to complement eachother’s strength and weakness.
The advantage of evolutionary in-ference is that it is directly related to fit-ness and, thus, the function of proteins.However, it also has two limitations.First, it only works for ORFs with a suffi-cient length (e.g., >600 bp) (Marqueset al. 2005). For small ORF encoded poly-peptides (SEPs; <300bp) (Saghatelian andCouso 2015), the evolutionary tests maynot work given the scarcity of substitu-tions. A second issue is that evolutionarytests, including the orthologous Ka/Ks
test, paralogous Ka/Ks test, and branchtest, only reflect the functionality of aprotein in its evolutionary history ratherthan its status as of now (Mudge andHarrow 2016).
Compared to evolutionary tests,which are restricted to genes that satisfycertain criteria (e.g., the presence of ho-mologous sequences), proteogenomicsworks for all genes in principle. Further-more, evolutionary methods only sug-gest protein-coding potential, whereasproteomic evidence is more intuitive,
and unambiguous protein-level evidence like mass spectra hasbeen argued to be mandatory for a novel coding gene model (Bru-ford et al. 2015). In ourwork, a gene is expected to be expressed as aprotein given presence of at least two mass spectra (SupplementalMethods). Consistently, 38 of 46 (83%) PSGs that were supportedby peptides have been experimentally characterized as protein-coding genes in the UniProt database (Supplemental Fig. S11). Incontrast, only 41 of 93 (43%) PSGs that were detected through evo-lutionary analyses have been identified as protein-coding genes(FET P=2.2 × 10⁻⁵). Thus, our proteomic analyses are highly con-servative and accurate. Nevertheless, the presence of peptidesdoes not necessarily mean that the corresponding protein is func-tional (Xu and Zhang 2016). In fact, only 15% pseudogenes withpeptide evidence show protein-level purifying selection (Xu andZhang 2016). Thus, an ideal protein-coding gene model should
A
B
Figure 9. Percentage and connectivity of PSGs within each coexpression module generated based onbrain developmental transcriptome. (A) Bar plot of PSG enrichment in precomputed modules (Parikshaket al. 2013). Notably, only a proportion of the 846 PSGs were included in the analyses (Parikshak et al.2013). Below each module, the developmental period in which the genes are up-regulated is shown.PCW and MAB refer to “post conception weeks” and “months after birth,” respectively. For example,BM13, -16, and -17 show peak expression in the late fetal to early postnatal stage, with moderate differ-ences in their temporal profiles (Parikshak et al. 2013). Autism-associated modules are masked in blue.Only BM2 shows significant enrichment of PSGs (indicated in light red) relative to the genome-wide per-centage (pink horizontal line). (B) The distribution of connection degree within coexpression moduleswas shown separately for PSGs and non-PSGs as violin plots, where the black bar in the center indicatesthe interquartile range, the violin curve indicates the probability density of the data, and the white dotindicates the median. Only the three modules with more than 10 PSGs are shown here.
Evolution and function of primate-specific genes
Genome Research 691www.genome.org
be supported by both selection and the proteomic evidence. How-ever, in this work we chose to include all PSGs supported by anyone of the methods, given their individually low power (Table 1;Fig. 7).
PSGs contribute to phenotypic evolution
Through genome-wide dating and reannotation, we generated ahigh-quality data set of PSGs and inferred the functional bias ofPSGs by classifying genes into coexpression modules. The resultscorroborated known patterns. Specifically, for the brain bias ofnew genes (Zhang et al. 2011), our analysis revealed a complex pat-tern, inwhich thepreviouslyobserved enrichment for newgenes isrestricted to themid-fetal stage, whereas there is in fact a paucity ofPSGs among the adult brain-specific genes (Figs. 8, 9). For the over-representation of PSGs among placenta-biased genes (Knox andBaker 2008), our results strengthenedprevious observations, show-ing an even greater excess (50% to 170%).We also detected a novelpattern, that is, the enrichment of PSGs implicated in the defenseresponse (Fig. 8; Supplemental Fig. S15), which is not surprisinggiven the rapid gene family evolution in immune response(Demuth and Hahn 2009). Thus, new genes are either recruitedto processes under tremendous selection pressure, such as male re-production and defense, or to processes supporting an evolvingnovel organ, such as an expanded brain and placenta. Similar tothe results for the fetal brain (Fig. 9B), the centrality of PSGs in tes-tis, bone marrow, and placenta is also higher (Supplemental Fig.S19), suggesting the functional importanceofPSGs in theseorgans.It is worth noting that our functional enrichment analyses werebased on data that are still limited in tissue and developmental-stage coverage. Thus it is possible thatPSGs are also recruited tooth-er important processes not covered by these data sets (e.g., injuryresponse) (Costantini et al. 2015; Baird et al. 2016).
Besides the global patterns, ourmeta-analyses also help prior-itize candidates for follow-up functional studies, especially consid-ering the majority of PSGs are uncharacterized (Fig. 7; Zhang et al.2012). The aforementionedMYH16 and ZNF430 aremost notable.Orthologs of MYH16 are known to be transcribed in masticatorymuscles of primates (Stedman et al. 2004). In contrast, the two de-rived ORFs in human are transcribed in multiple tissues such asstomach and testis (Supplemental Fig. S20A,B). GWASdb2 furtherimplicates this locus in Crohn’s disease and osteoarthritis, lendingsupport to its neofunctionalization in nonmuscle tissues (Supple-mental Fig. S20C). From this aspect, four cases including MYH16(Supplemental Table S12) represent a neofunctionalization modelof gene fission in which LoFmutations led to the fission of the an-cestral gene into two smaller ORFs and possible domain decou-pling. This model is substantially different from the traditionalsubfunctionalizationmodel of gene fission,which occurs by dupli-cation followed by complementary degeneration in each copy(Wang et al. 2004; Zhou and Wang 2008).
ZNF430 represents another interesting case given its highcentrality (BM2, Supplemental Fig. S18) and signal of positive se-lection (Supplemental Table S13). Notably, KZNFs overall are sub-ject to frequent domain evolution (Nowick et al. 2010, 2011). Wethus analyzed the domain evolution of PSGs and tested whetherBM2 was enriched with PSGs with domain changes. Consistently,BM2 covers six out of 13 PSGs with domain changes (Supplemen-tal Data Set 1), which is significant compared with the overallbackground (binomial test P=0.001). The excess is mainly con-tributed by five KZNFs: (1) changes of zinc-finger copy numbers(ZNF320 and ZNF486) and (2) loss of KRAB (ZNF117, ZNF138,
ZNF714). ZNF486 and ZNF117 are particularly notable. ZNF486shows copy number difference of zinc fingers between rhesusmonkey and human/gibbon lineage (Supplemental Data Set 1),which may cause the difference of binding (Nowick et al.2010). Furthermore, ZNF486 is associated with copy number var-iant in children with motor coordination disorder, implicating itsimportance in brain development (Mosca 2013). ZNF117 is sub-ject to two independent losses of KRAB in both the ancestor ofhuman and chimpanzee, and the gibbon lineage, respectively(Supplemental Fig. S21). For an old KZNF shared by mammals,i.e., ZNF268, loss of KRAB is reported to resort proteins from nu-cleus to cytoplasm and thus cause radical functional changes(Wang et al. 2013). Whether ZNF117 situates in the same sce-nario and how its different location shapes brain developmentalprogram across primate warrant future studies.
In summary, PSGs represent a group of genes potentially driv-ing phenotypic evolution in primates.
GenTree will be more interactive and fine-tuned for functional
studies of new genes
We plan to improve GenTree from the following three aspects.First, our analyses show how complex it is to date and annotatenew genes (Figs. 5, 7). It seems that manual curation is still thebest method for some cases (e.g., CHRFAM7A). Thus, similar toother popular databases (e.g., FlyBase) (Crosby et al. 2007),GenTree will be more community driven in future updates. For ex-ample, an interactive form can be designed to allow users to com-ment on age and coding status. Second, our coexpression analysiscorroborated the narrow expression of new genes. Single-cell tran-scriptomes provide higher spatiotemporal resolution than bulk tis-sue data currently integrated in GenTree. Actually, for PSG-biasedtissues such as fetal brain or testis, single-cell data are recently be-coming available (Nowakowski et al. 2017;Wang et al. 2018). Aftercontrolling mapping ambiguity, such data will be more helpful inmotivating function-related hypotheses than bulk data (e.g.,HPA). Finally, isoforms likely have different evolutionary ages(e.g., Supplemental Fig. S22). Although users can view ages of dif-ferent isoforms in the current release, the other functionality onweb pages (e.g., transcriptional quantification) is only availablefor the representative isoform, which can be optimized in future.
Methods
For an extended version, please see Supplemental Methods.
General gene data set and computational tools
We used Ensembl v73 (October, 2013) (Flicek et al. 2012) as ourcore gene set. The longest principle transcript (Rodriguez et al.2015) was used to represent each gene unless otherwise noted.We used MySQL v5.1.61 for storing and querying the data,BioPerl and BioEnsembl to assemble the pipeline, and R v3.2.3(R Core Team 2007) to perform statistical analyses.
Synteny-based pipeline
We dated 20,300 Ensembl (Flicek et al. 2012) annotated codinggenes located on themajor chromosomes, based on our previouslydescribed SBP (Fig. 1; Supplemental Table S3; Zhang et al. 2010a,b).Briefly, for each gene, we inferred the phylogenetic distribution ofits orthologs based on the whole-genome alignment generated bythe UCSC Genome Browser (Kent et al. 2003; Rhead et al. 2010)and assigned evolutionary age according to the most ancient
Shao et al.
692 Genome Researchwww.genome.org

exon (Supplemental Fig. S1). We excluded 838 (4%) genes fromdating because of their unreliable synteny: (1) geneswith >70% ex-onic regions overlapping with RepeatMasker (Smit et al. 2017)tracks of UCSC or genes situated on Chromosome Y; (2) geneswith a patchy phylogenetic distribution of orthologs, which tend-ed to be covered by known synteny breaks (Kemkemer et al. 2009).As an improvement compared to our previous studies (Zhang et al.2010a,b), we excluded the UCSC alignment blocks labeled as two-way nonsyntenic (“nonsyn”).
Analogously, we also dated 14,134 pseudogenes and identi-fied 9927 primate-specific entries. For MYH16, although the cod-ing region was inferred as emerging on branch 2 (SupplementalFig. S1), the indel in MYH16 was known to postdate the human–chimpanzee split (Stedman et al. 2004). Given the extensive studyof this locus in the fields of evolutionary genetics (Stedman et al.2004) and proteogenomics (Branca et al. 2014), we manuallymerged it into the data set of primate-specific pseudogenes (9928PSPGs).
Comparison across age data sets
To evaluate the quality of SBP, we integrated two genome-wide agedata sets including phylostratigraphy (Domazet-Lošo and Tautz2010) and ProteinHistorian (Capra et al. 2012) and three recentlypublished HSG or PSG lists (Jacobs et al. 2014; Dennis et al.2017; Florio et al. 2018). We examined how SBP agreed with thesedata sets.
Robustness of PSG list between GRCh37 and GRCh38 assembly
releases
By lifting PSGs fromGRCh37 (Ensembl v73) to GRCh38, we foundthat only 5% (45/846) of the genes could not be lifted with 100%coverage, and these genemodels got expired in the new release. Bycomparing PSG or HSG lists based on GRCh38 (Dennis et al. 2017;Florio et al. 2018) with ourGRCh37-based lists, we found that onlyeight (12%) gene models are unique to GRCh38. This degree of al-ternation (5%or 12%) is not expected to change our functional en-richment analysis (e.g., Fig. 8).
Inference of origination mechanisms
We inferred gene originationmechanisms asDNA-mediated dupli-cates, retrogenes or de novo genes as previously described (Zhanget al. 2010a,b). We further curated a list of de novo genes from re-cent literature (Chen et al. 2015; Ruiz-Orera et al. 2015;McLysaghtandHurst 2016). To be conservative, only 18 entries that are anno-tated as coding genes in Ensembl v73 were retained.
RNA-seq data processing
We first downloaded theHPARNA-seq data set of 27 tissues (Uhlenet al. 2010). We took the splice-aware mapper STAR (v2.4.0k)(Dobin et al. 2013) to align the reads to the human genome guidedby the Ensembl annotation. The output of “quantMode” wasserved as the input of the quantification software, RSEM(v1.2.19) (Li and Dewey 2011). As a complementary data source,we also integrated the GTEx data set covering 32 tissues (TheGTEx Consortium 2015). Specifically, to control the heterogenei-ty, we picked 1936 samples from individuals who are ofEuropean descent with an age between 20 and 50 yr. We excludedthose low-quality samples with an RNA integrity (RIN) value lessthan seven. We performed quantification via kallisto because ofits high speed (Bray et al. 2016). We finally integrated theBrainSpan transcriptome because of the expression bias of newgenes in brain (Tay et al. 2009; Zhang et al. 2011; Xie et al.
2012). Because BrainSpan does not provide raw sequencing data,we incorporated its precomputed FPKM values directly intoGenTree.
Analyses of selection force
We performed four types of tests for coding genes, all of whichare followed by multiple test corrections via the qvalue package(http://github.com/jdstorey/qvalue).
First, for the orthologous Ka/Ks test, we extracted the ortho-logs from the rhesus macaque based on the Ensembl Compara da-tabase (Vilella et al. 2009) and the UCSC synteny data. We alignedthe protein sequence and translated this alignment to a codon-lev-el alignment. We then ran the PAML 4.8 package (Yang 2007) toperform the likelihood ratio test (LRT) with the expectation ofKa/Ks as one after excluding less reliable alignments. Second, forthe paralogous Ka/Ks test, we constructed the protein sequencealignment using BLAST (bl2seq 2.2.26) based on the parent–childgene relationship. We performed LRT with the expectation of 0.5(Betrán et al. 2002). Third, for the branch test, we focused onPSGs with a parental copy that predates primate and rodent splitor emerges even earlier. We then tested whether the derived copybranch shows a Ka/Ks significantly smaller than one. For thePSGs with a Ka/Ks smaller than one, we excluded potentiallypseudogenic entries identified by the olfactory receptor database(https://senselab.med.yale.edu/ordb/). Finally, for the polymor-phism-based test, we downloaded the latest phase3 data of the1000 Genomes Project (1000GP) (The 1000 Genomes ProjectConsortium 2015) and tested whether nonsynonymous SNPsare <70% relative to the sum of synonymous and nonsynony-mous SNPs (Moyers and Zhang 2016).
For 3538 PSPGs predating the human and rhesus monkeysplit, we only implemented the orthologous alignment-based Ka/Ks test after predicting ORFs based on the parental proteins.
GenTree also integrates the PopHuman database (Casillaset al. 2017), which provides FST, XP-EHH, and iHS tracks relatedto positive selection.
Domain evolution
For each PSG and its orthologs, we performed a domain search forthe longest protein via the “search_pfam.pl” script based on thePfam v31 database (Finn et al. 2015). By following the Dollo parsi-mony, we identified candidate domain gain or loss events. Weidentified 85 events, 72 of which were caused by confounding fac-tors (Supplemental Table S17).
Mass spectrometry data analyses
We modified the published pipeline (Kim et al. 2014) as follows:(1) We implemented free software pFind v2.8 (Li et al. 2005;Wang et al. 2007) and MaxQuant v1.5.3.30 (Cox and Mann2008); (2) we discarded peptides withmore than four electric char-ges; (3) the more rigorous group level false discovery rate was esti-mated for peptides from PSGs when pFind was used (Fu and Qian2014; Zhang et al. 2015); (4) we excluded peptides mapping tomultiple genes or different genomic locations; and (5) we discard-ed peptides in which the only mismatches between top two hitsare isoleucine versus leucine, which are not distinguishable forproteomics (Zhang et al. 2013).
For candidate misannotated pseudogenes, we further re-quired (1) theminimal predictedORF ismore than 50 amino acids;and (2) the differentiating amino acids should not be a polymor-phic nonsynonymous site in the paralogous protein, based onthe 1000GP data.
Evolution and function of primate-specific genes
Genome Research 693www.genome.org

We then performed manual curation and took the intersec-tion of pFind and MaxQuant as the final output.
Coexpression network analysis
Weconstructed coexpressionmodules based on theHPA transcrip-tome data using WGCNA software (v1.51) (Langfelder andHorvath 2008). We required genes to be present in at least one tis-sue, with a mean FPKM across replicates higher than 0.5, whichrepresented robust transcription (Hart et al. 2013). We ranWGCNA according to the method of Parikshak et al. (2013),with the followingmodifications: (1) We specified the soft thresh-old as 12 rather than 26 because the former fits the data well(Supplemental Fig. S23A); and (2) to identify more modules whileensuring a decentmodule size, we set the deep split parameter andminimum module size in the cutreeHybrid function to four and150, respectively. For modules with an excess of PSGs, we per-formed GO term enrichment analysis with the KOBAS server(Xie et al. 2011).WGCNA forGTEx datawas performed in a similarway, except that the power was chosen as 20 (Supplemental Fig.S23B).
Within each module, we measured centrality of one gene bysumming its correlation coefficients to other genes, which is fur-ther normalized by dividing the raw value by themaximumdegreeof this module (Chou et al. 2014).
Data access
The web-accessible database together with the batch download isavailable at GenTree (http://gentree.ioz.ac.cn/).
Acknowledgments
We thank SunjinMoon, Joshua Akey, Lisa Stubbs, Yang Shen, andZhang laboratory members for helpful discussions. We appreciatethe insightful comments of three anonymous reviewers. This re-search was supported by grants from the Strategic PriorityResearch Program of the Chinese Academy of Sciences(XDB13000000), the National Key Basic Research Program ofChina (2015CB943001, 2013CB531202), the National NaturalScience Foundation of China (91731302, 31771410, 31200941,31500668), and the Fundamental Research Funds for the CentralUniversities (106112016CDJXY290002). Computing was jointlysupported by the HPC Platform of BIG, the HPC Platform of theScientific Information Centre of IOZ, and the NCMIS CAS.
Author contributions: Y.E.Z. conceived and designed the study.Y.S. and C.C. performed the computational analyses exceptdomain-related analyses performed by D.Y. S.J. and G.G. contrib-uted to GTEx data analyses. Z.G., X.C., and Y.F. contributed tothe proteomic analyses. S.Z. and H.C. contributed to populationgenomic analyses. Y.S., H.S., and Z.Z. developed the website.Y.S., C.C., Y.E.Z., and B.Z.H. analyzed the data. Y.E.Z., B.Z.H,Y.S., C.C., and M.L. wrote the paper.
References
The 1000Genomes Project Consortium. 2015. A global reference for humangenetic variation. Nature 526: 68. doi:10.1038/nature15393
Abrusán G, Giordano J, Warburton PE. 2008. Analysis of transposon inter-ruptions suggests selection for L1 elements on the X chromosome. PLoSGenet 4: e1000172. doi:10.1371/journal.pgen.1000172
Adhya D, Swarup V, Nowosaid P, Shum C, Jozwik K, McAlonan G, MendezMA,Horder J,MurphyD, GeschwindDH, et al. 2018. Shared gene co-ex-pression networks in autism from induced pluripotent stem cell (iPSC)neurons. bioRxiv doi:10.1101/349415
Albà MM, Castresana J. 2007. On homology searches by protein Blast andthe characterization of the age of genes. BMC Evol Biol 7: 53. doi:10.1186/1471-2148-7-53
Ashburner M, Ball CA, Blake JA, Botstein D, Butler H, Cherry JM, Davis AP,Dolinski K, Dwight SS, Eppig JT, et al. 2000. Gene Ontology: tool for theunification of biology. The Gene Ontology Consortium. Nat Genet 25:25–29. doi:10.1038/75556
Bailey JA, Eichler EE. 2006. Primate segmental duplications: crucibles ofevolution, diversity and disease. Nat Rev Genet 7: 552–564. doi:10.1038/nrg1895
Baird A, Costantini T, Coimbra R, Eliceiri BP. 2016. Injury, inflammationand the emergence of human-specific genes. Wound Repair Regen 24:602–606. doi:10.1111/wrr.12422
Barbazuk WB, Korf I, Kadavi C, Heyen J, Tate S, Wun E, Bedell JA,McPherson JD, Johnson SL. 2000. The syntenic relationship of thezebrafish and human genomes. Genome Res 10: 1351–1358. doi:10.1101/gr.144700
Betrán E. 2015. The “life histories” of genes. J Mol Evol 80: 186–188. doi:10.1007/s00239-015-9668-x
Betrán E, Thornton K, Long M. 2002. Retroposed new genes out of the X inDrosophila. Genome Res 12: 1854–1859. doi:10.1101/gr.6049
Branca RM, Orre LM, Johansson HJ, Granholm V, Huss M, Pérez-Bercoff Å,Forshed J, Käll L, Lehtiö J. 2014. HiRIEF LC-MS enables deep proteomecoverage and unbiased proteogenomics. Nat Methods 11: 59–62.doi:10.1038/nmeth.2732
Bray NL, Pimentel H, Melsted P, Pachter L. 2016. Near-optimal probabilisticRNA-seq quantification. Nat Biotechnol 34: 525. doi:10.1038/nbt.3519
Bruford EA, Lane L, Harrow J. 2015. Devising a consensus framework for val-idation of novel human coding loci. J Proteome Res 14: 4945–4948.doi:10.1021/acs.jproteome.5b00688
Burki F, Kaessmann H. 2004. Birth and adaptive evolution of a hominoidgene that supports high neurotransmitter flux. Nat Genet 36: 1061–1063. doi:10.1038/ng1431
Capra JA, Williams AG, Pollard KS. 2012. ProteinHistorian: tools for thecomparative analysis of eukaryote protein origin. PLoS Comput Biol 8:e1002567. doi:10.1371/journal.pcbi.1002567
Capra JA, StolzerM,DurandD, Pollard KS. 2013. Howold ismy gene? TrendsGenet 29: 659–668. doi:10.1016/j.tig.2013.07.001
Casillas S, Mulet R, Villegas-Mirón P, Hervas S, Sanz E, Velasco D,Bertranpetit J, Laayouni H, Barbadilla A. 2017. PopHuman: the humanpopulation genomics browser. Nucleic Acids Res 46: D1003–D1010.doi:10.1093/nar/gkx943
Chen JY, Shen QS, ZhouWZ, Peng J, He BZ, Li Y, Liu CJ, Luan X, DingW, LiS, et al. 2015. Emergence, retention and selection: a trilogy of origina-tion for functional de novo proteins from ancestral lncRNAs in primates.PLoS Genet 11: e1005391. doi:10.1371/journal.pgen.1005391
Cheng X, Xu C, DeGiorgio M. 2017. Fast and robust detection of ancestralselective sweeps. Mol Ecol 26: 6871–6891. doi:10.1111/mec.14416
Chou WC, Cheng AL, Brotto M, Chuang CY. 2014. Visual gene-networkanalysis reveals the cancer gene co-expression in human endometrialcancer. BMC Genomics 15: 300. doi:10.1186/1471-2164-15-300
Costantini TW, Dang X, Coimbra R, Eliceiri BP, Baird A. 2015. CHRFAM7A,a human-specific and partially duplicated α7-nicotinic acetylcholine re-ceptor gene with the potential to specify a human-specific inflammato-ry response to injury. J Leukoc Biol 97: 247–257. doi:10.1189/jlb.4RU0814-381R
Cox J, Mann M. 2008. MaxQuant enables high peptide identification rates,individualized p.p.b.-range mass accuracies and proteome-wide proteinquantification. Nat Biotechnol 26: 1367–1372. doi:10.1038/nbt.1511
Crosby MA, Goodman JL, Strelets VB, Zhang P, Gelbart WM. 2007. FlyBase:genomes by the dozen. Nucleic Acids Res 35: D486–D491. doi:10.1093/nar/gkl827
Demuth JP, Hahn MW. 2009. The life and death of gene families. Bioessays31: 29–39. doi:10.1002/bies.080085
Demuth JP, De Bie T, Stajich JE, Cristianini N, Hahn MW. 2006. The evolu-tion of mammalian gene families. PLoS One 1: e85. doi:10.1371/journal.pone.0000085
Dennis MY, Harshman L, Nelson BJ, Penn O, Cantsilieris S, Huddleston J,Antonacci F, Penewit K, Denman L, Raja A, et al. 2017. The evolutionand population diversity of human-specific segmental duplications.Nat Ecol Evol 1: 0069. doi:10.1038/s41559-016-0069
Dobin A, Davis CA, Schlesinger F, Drenkow J, Zaleski C, Jha S, Batut P,ChaissonM,Gingeras TR. 2013. STAR: ultrafast universal RNA-seq align-er. Bioinformatics 29: 15–21. doi:10.1093/bioinformatics/bts635
Domazet-Lošo T, Tautz D. 2010. Phylostratigraphic tracking of cancer genessuggests a link to the emergence ofmulticellularity inmetazoa. BMCBiol8: 66. doi:10.1186/1741-7007-8-66
Domazet-Lošo T, Brajkovic ́ J, Tautz D. 2007. A phylostratigraphy approachto uncover the genomic history of major adaptations in metazoan line-ages. Trends Genet 23: 533–539. doi:10.1016/j.tig.2007.08.014
Shao et al.
694 Genome Researchwww.genome.org

Ezkurdia I, Juan D, Rodriguez JM, Frankish A, Diekhans M, Harrow J,Vazquez J, Valencia A, Tress ML. 2014. Multiple evidence strands sug-gest that there may be as few as 19,000 human protein-coding genes.Hum Mol Genet 23: 5866–5878. doi:10.1093/hmg/ddu309
Finn RD, Coggill P, Eberhardt RY, Eddy SR, Mistry J, Mitchell AL, Potter SC,Punta M, Qureshi M, Sangrador-Vegas A, et al. 2015. The Pfam proteinfamilies database: towards a more sustainable future. Nucleic Acids Res44: D279–D285. doi:10.1093/nar/gkv1344
Flicek P, Ahmed I, Amode MR, Barrell D, Beal K, Brent S, Carvalho-Silva D,Clapham P, Coates G, Fairley S, et al. 2012. Ensembl 2013. Nucleic AcidsRes 41: D48–D55. doi:10.1093/nar/gks1236
Florio M, Heide M, Pinson A, Brandl H, Albert M, Winkler S, Wimberger P,Huttner WB, Hiller M. 2018. Evolution and cell-type specificity of hu-man-specific genes preferentially expressed in progenitors of fetal neo-cortex. eLife 7: e32332. doi:10.7554/eLife.32332
Fu Y, Qian X. 2014. Transferred subgroup false discovery rate for rare post-translational modifications detected by mass spectrometry. Mol CellProteomics 13: 1359–1368. doi:10.1074/mcp.O113.030189
Giandomenico SL, Lancaster MA. 2017. Probing human brain evolutionand development in organoids. Curr Opin Cell Biol 44: 36–43. doi:10.1016/j.ceb.2017.01.001
The GTEx Consortium. 2015. The Genotype-Tissue Expression (GTEx) pilotanalysis: multitissue gene regulation in humans. Science 348: 648–660.doi:10.1126/science.1262110
Hangauer MJ, Carpenter S, McManus MT. 2014. Discovering the complex-ity of the metazoan transcriptome. Genome Biol 15: 112. doi:10.1186/gb4172
Hart T, Komori HK, LaMere S, Podshivalova K, Salomon DR. 2013. Findingthe active genes in deep RNA-seq gene expression studies. BMCGenomics 14: 778. doi:10.1186/1471-2164-14-778
Hsu PD, Lander ES, Zhang F. 2014. Development and applications ofCRISPR-Cas9 for genome engineering. Cell 157: 1262–1278. doi:10.1016/j.cell.2014.05.010
Hubbard TJP, Aken BL, Beal K, Ballester B, Caccamo M, Chen Y, Clarke L,Coates G, Cunningham F, Cutts T, et al. 2007. Ensembl 2007. NucleicAcids Res 35: D610–D617. doi:10.1093/nar/gkl996
Hunter S, Apweiler R, Attwood TK, Bairoch A, Bateman A, Binns D, Bork P,Das U, Daugherty L, Duquenne L, et al. 2009. InterPro: the integrativeprotein signature database. Nucleic Acids Res 37: D211–D215. doi:10.1093/nar/gkn785
Jacobs FMJ, Greenberg D, Nguyen N, Haeussler M, Ewing AD, Katzman S,Paten B, Salama SR, Haussler D. 2014. An evolutionary arms race be-tween KRAB zinc-finger genes ZNF91/93 and SVA/L1 retrotransposons.Nature 516: 242–245. doi:10.1038/nature13760
Kaessmann H. 2010. Origins, evolution, and phenotypic impact of newgenes. Genome Res 20: 1313–1326. doi:10.1101/gr.101386.109
Kemkemer C, Kohn M, Cooper DN, Froenicke L, Högel J, Hameister H,Kehrer-Sawatzki H. 2009. Gene synteny comparisons between differentvertebrates provide new insights into breakage and fusion events duringmammalian karyotype evolution. BMC Evol Biol 9: 84. doi:10.1186/1471-2148-9-84
Kent WJ, Baertsch R, Hinrichs A, Miller W, Haussler D. 2003. Evolution’scauldron: duplication, deletion, and rearrangement in the mouse andhuman genomes. Proc Natl Acad Sci 100: 11484–11489. doi:10.1073/pnas.1932072100
Kim M-S, Pinto SM, Getnet D, Nirujogi RS, Manda SS, Chaerkady R,Madugundu AK, Kelkar DS, Isserlin R, Jain S, et al. 2014. A draft mapof the human proteome. Nature 509: 575–581. doi:10.1038/nature13302
Knowles DG, McLysaght A. 2009. Recent de novo origin of human protein-coding genes. Genome Res 19: 1752–1759. doi:10.1101/gr.095026.109
Knox K, Baker JC. 2008. Genomic evolution of the placenta using co-optionand duplication and divergence. Genome Res 18: 695–705. doi:10.1101/gr.071407.107
Kryazhimskiy S, Plotkin JB. 2008. The population genetics of dN/dS. PLoSGenet 4: e1000304. doi:10.1371/journal.pgen.1000304
Langfelder P, Horvath S. 2008. WGCNA: an R package for weighted correla-tion network analysis. BMC Bioinformatics 9: 559. doi:10.1186/1471-2105-9-559
Li B, Dewey CN. 2011. RSEM: accurate transcript quantification from RNA-seq data with or without a reference genome. BMC Bioinformatics 12:323. doi:10.1186/1471-2105-12-323
Li D, Fu Y, Sun R, Ling CX, Wei Y, Zhou H, Zeng R, Yang Q, He S, Gao W.2005. pFind: a novel database-searching software system for automatedpeptide and protein identification via tandem mass spectrometry.Bioinformatics 21: 3049–3050. doi:10.1093/bioinformatics/bti439
Long M, Betrán E, Thornton K, Wang W. 2003. The origin of new genes:glimpses from the young and old. Nat Rev Genet 4: 865–875. doi:10.1038/nrg1204
Marques AC, Dupanloup I, Vinckenbosch N, Reymond A, Kaessmann H.2005. Emergence of young human genes after a burst of retropositionin primates. PLoS Biol 3: e357. doi:10.1371/journal.pbio.0030357
McLysaght A, Hurst LD. 2016. Open questions in the study of de novo genes:what, how and why. Nat Rev Genet 17: 567–578. doi:10.1038/nrg.2016.78
Michel AM, Ahern AM, Donohue CA, Baranov PV. 2015. GWIPS-viz as atool for exploring ribosome profiling evidence supporting the synthesisof alternative proteoforms. Proteomics 15: 2410–2416. doi:10.1002/pmic.201400603
Mosca S. 2013. “Discovery and characterization of rare genomic copy num-ber variants in children with developmental coordination disorder.”Master’s thesis, University of Calgary, Alberta, Canada.
Moyers BA, Zhang J. 2016. Evaluating phylostratigraphic evidence for wide-spread de novo gene birth in genome evolution.Mol Biol Evol 33: 1245–1256. doi:10.1093/molbev/msw008
Mudge JM, Harrow J. 2016. The state of play in higher eukaryote gene anno-tation. Nat Rev Genet 17: 758–772. doi:10.1038/nrg.2016.119
Nowakowski TJ, Bhaduri A, Pollen AA, Alvarado B, Mostajo-Radji MA, DiLullo E, Haeussler M, Sandoval-Espinosa C, Liu SJ, Velmeshev D, et al.2017. Spatiotemporal gene expression trajectories reveal developmentalhierarchies of the human cortex. Science 358: 1318–1323. doi:10.1126/science.aap8809
Nowick K, Hamilton AT, Zhang H, Stubbs L. 2010. Rapid sequence and ex-pression divergence suggest selection for novel function in primate-spe-cific KRAB-ZNF genes. Mol Biol Evol 27: 2606–2617. doi:10.1093/molbev/msq157
NowickK, Fields C,Gernat T, Caetano-Anolles D, KholinaN, Stubbs L. 2011.Gain, loss and divergence in primate zinc-finger genes: a rich resourcefor evolution of gene regulatory differences between species. PLoS One6: e21553. doi:10.1371/journal.pone.0021553
Nowick K, Carneiro M, Faria R. 2013. A prominent role of KRAB-ZNF tran-scription factors in mammalian speciation? Trends Genet 29: 130–139.doi:10.1016/j.tig.2012.11.007
Pääbo S. 2014. The human condition: a molecular approach. Cell 157: 216–226. doi:10.1016/j.cell.2013.12.036
Parikshak NN, Luo R, Zhang A, Won H, Lowe JK, Chandran V, Horvath S,Geschwind DH. 2013. Integrative functional genomic analyses impli-cate specific molecular pathways and circuits in autism. Cell 155:1008–1021. doi:10.1016/j.cell.2013.10.031
Perry GH, Verrelli BC, Stone AC. 2005. Comparative analyses reveal a com-plex history ofmolecular evolution for humanMYH16.Mol Biol Evol22:379–382. doi:10.1093/molbev/msi004
R Core Team. 2007. R: a language and environment for statistical computing. RFoundation for Statistical Computing, Vienna. http://www.R-project.org/.
Rhead B, Karolchik D, Kuhn RM, Hinrichs AS, Zweig AS, Fujita PA, DiekhansM, Smith KE, Rosenbloom KR, Raney BJ, et al. 2010. The UCSCGenomeBrowser database: update 2010.Nucleic Acids Res38:D613–D619. doi:10.1093/nar/gkp939
Rodriguez JM, Carro A, Valencia A, Tress ML. 2015. APPRIS WebServer andWebServices. Nucleic Acids Res 43: W455–W459. doi:10.1093/nar/gkv512
Ruiz-Orera J, Hernandez-Rodriguez J, Chiva C, Sabidó E, Kondova I, BontropR, Marqués-Bonet T, Albà MM. 2015. Origins of de novo genes in humanand chimpanzee. PLoS Genet 11: e1005721. doi:10.1371/journal.pgen.1005721
Sabeti PC, Varilly P, Fry B, Lohmueller J, Hostetter E, Cotsapas C, Xie X,Byrne EH, McCarroll SA, Gaudet R, et al. 2007. Genome-wide detectionand characterization of positive selection in human populations.Nature449: 913–918. doi:10.1038/nature06250
Saghatelian A, Couso JP. 2015. Discovery and characterization of smORF-encoded bioactive polypeptides. Nat Chem Biol 11: 909–916. doi:10.1038/nchembio.1964
Sakai H, Mizuno H, Kawahara Y, Wakimoto H, Ikawa H, Kawahigashi H,Kanamori H, Matsumoto T, Itoh T, Gaut BS. 2011. Retrogenes in rice(Oryza sativa L. ssp. japonica) exhibit correlated expression with theirsource genes. Genome Biol Evol 3: 1357–1368. doi:10.1093/gbe/evr111
Schlötterer C. 2015. Genes from scratch—the evolutionary fate of de novogenes. Trends Genet 31: 215–219. doi:10.1016/j.tig.2015.02.007
Smit AFA, Hubley R, Green P. 2017. RepeatMasker Open-3.0 (1996–2010).http://www.repeatmasker.org.
Spanaki C, Zaganas I, Kleopa KA, Plaitakis A. 2010. Human GLUD2 gluta-mate dehydrogenase is expressed in neural and testicular supportingcells. J Biol Chem 285: 16748–16756. doi:10.1074/jbc.M109.092999
Stedman HH, Kozyak BW, Nelson A, Thesier DM, Su LT, Low DW, BridgesCR, Shrager JB, Minugh-Purvis N, Mitchell MA. 2004. Myosin gene mu-tation correlates with anatomical changes in the human lineage. Nature428: 415–418. doi:10.1038/nature02358
Strand AD, Aragaki AK, Baquet ZC, Hodges A, Cunningham P, Holmans P,Jones KR, Jones L, Kooperberg C, Olson JM. 2007. Conservation of
Evolution and function of primate-specific genes
Genome Research 695www.genome.org

regional gene expression inmouse and human brain. PLoS Genet 3: e59.doi:10.1371/journal.pgen.0030059
Tarazona-Santos E, Castilho L, Amaral DR, Costa DC, Furlani NG,Zuccherato LW, Machado M, Reid ME, Zalis MG, Rossit AR, et al.2011. Population genetics of GYPB and association study betweenGYPB∗S/s polymorphism and susceptibility to P. falciparum infectionin the Brazilian Amazon. PLoS One 6: e16123. doi:10.1371/journal.pone.0016123
Tay SK, Blythe J, Lipovich L. 2009. Global discovery of primate-specificgenes in the human genome. Proc Natl Acad Sci 106: 12019–12024.doi:10.1073/pnas.0904569106
ThanNG, Romero R, GoodmanM,Weckle A, Xing J, Dong Z, Xu Y, TarquiniF, Szilagyi A, Gal P, et al. 2009. A primate subfamily of galectins ex-pressed at thematernal–fetal interface that promote immune cell death.Proc Natl Acad Sci 106: 9731–9736. doi:10.1073/pnas.0903568106
Toll-RieraM, BoschN, BelloraN, Castelo R, Armengol L, Estivill X, AlbàMM.2009. Origin of primate orphan genes: a comparative genomics ap-proach. Mol Biol Evol 26: 603–612. doi:10.1093/molbev/msn281
Uhlen M, Oksvold P, Fagerberg L, Lundberg E, Jonasson K, Forsberg M,Zwahlen M, Kampf C, Wester K, Hober S, et al. 2010. Towards a knowl-edge-based human protein atlas. Nat Biotechnol 28: 1248–1250. doi:10.1038/nbt1210-1248
The UniProt Consortium. 2015. UniProt: a hub for protein information.Nucleic Acids Res 43: D204–D212. doi:10.1093/nar/gku989
Vilella AJ, Severin J, Ureta-Vidal A, Heng L, Durbin R, Birney E. 2009.EnsemblCompara GeneTrees: complete, duplication-aware phylogenet-ic trees in vertebrates. Genome Res 19: 327–335. doi:10.1101/gr.073585.107
Vinckenbosch N, Dupanloup I, Kaessmann H. 2006. Evolutionary fate ofretroposed gene copies in the human genome. Proc Natl Acad Sci 103:3220–3225. doi:10.1073/pnas.0511307103
Voight BF, Kudaravalli S, Wen XQ, Pritchard JK. 2006. A map of recent pos-itive selection in the human genome. PLoS Biol 4: 446–458. doi:10.1371/journal.pbio.0040446
WangW, YuH, LongM. 2004. Duplication-degeneration as amechanismofgene fission and the origin of new genes inDrosophila species.Nat Genet36: 523–527. doi:10.1038/ng1338
Wang LH, Li DQ, Fu Y,WangHP, Zhang JF, Yuan ZF, Sun RX, Zeng R, He SM,Gao W. 2007. pFind 2.0: a software package for peptide and proteinidentification via tandem mass spectrometry. Rapid Commun MassSpectrom 21: 2985–2991. doi:10.1002/rcm.3173
Wang W, Cai J, Wu Y, Hu L, Chen Z, Hu J, Chen Z, Li W, Guo M, Huang Z.2013. Novel activity of KRAB domain that functions to reinforce nuclearlocalization of KRAB-containing zinc finger proteins by interacting withKAP1. Cell Mol Life Sci 70: 3947–3958. doi:10.1007/s00018-013-1359-4
WangM, Liu X, Chang G, Chen Y, An G, Yan L, Gao S, Xu Y, Cui Y, Dong J,et al. 2018. Single-cell RNA sequencing analysis reveals sequential cellfate transition during human spermatogenesis. Cell Stem Cell 23: 599–614.e4. doi:10.1016/j.stem.2018.08.007
Wright JC, Mudge J, Weisser H, Barzine MP, Gonzalez JM, Brazma A,Choudhary JS, Harrow J. 2016. ImprovingGENCODE reference gene an-notation using a high-stringency proteogenomics workflow. NatCommun 7: 11778. doi:10.1038/ncomms11778
Xie C, Mao X, Huang J, Ding Y, Wu J, Dong S, Kong L, Gao G, Li CY, Wei L.2011. KOBAS 2.0: a web server for annotation and identification of en-riched pathways and diseases.Nucleic Acids Res 39:W316–W322. doi:10.1093/nar/gkr483
Xie C, Zhang YE, Chen JY, Liu CJ, ZhouWZ, Li Y, ZhangM, Zhang R,Wei L,Li CY. 2012. Hominoid-specific de novo protein-coding genes originat-ing from long non-coding RNAs. PLoS Genet 8: e1002942. doi:10.1371/journal.pgen.1002942
Xu J, Zhang J. 2016. Are human translated pseudogenes functional?Mol BiolEvol 33: 755–760. doi:10.1093/molbev/msv268
Yang Z. 2007. PAML 4: phylogenetic analysis by maximum likelihood. MolBiol Evol 24: 1586–1591. doi:10.1093/molbev/msm088
Yang H, He BZ, Ma H, Tsaur SC, Ma C, Wu Y, Ting CT, Zhang YE. 2015.Expression profile and gene age jointly shaped the genome-wide distri-bution of premature termination codons in a Drosophila melanogasterpopulation. Mol Biol Evol 32: 216–228. doi:10.1093/molbev/msu299
Zhang YE, Long M. 2014. New genes contribute to genetic and phenotypicnovelties in human evolution. Curr Opin Genet Dev 29C: 90–96. doi:10.1016/j.gde.2014.08.013
Zhang J, Yang JR. 2015. Determinants of the rate of protein sequence evolu-tion. Nat Rev Genet 16: 409–420. doi:10.1038/nrg3950
Zhang YE, Vibranovski MD, Krinsky BH, Long M. 2010a. Age-dependentchromosomal distribution of male-biased genes in Drosophila. GenomeRes 20: 1526–1533. doi:10.1101/gr.107334.110
Zhang YE, Vibranovski MD, Landback P, Marais GAB, Long M. 2010b.Chromosomal redistribution of male-biased genes in mammalian evo-lution with two bursts of gene gain on the X chromosome. PLoS Biol8: e1000494. doi:10.1371/journal.pbio.1000494
Zhang YE, Landback P, Vibranovski MD, LongM. 2011. Accelerated recruit-ment of new brain development genes into the human genome. PLoSBiol 9: e1001179. doi:10.1371/journal.pbio.1001179
Zhang YE, Landback P, Vibranovski M, Long M. 2012. New genes expressedin human brains: implications for annotating evolving genomes.Bioessays 34: 982–991. doi:10.1002/bies.201200008
Zhang Y, Fonslow BR, Shan B, Baek MC, Yates JR III. 2013. Protein analysisby shotgun/bottom-up proteomics. Chem Rev 113: 2343–2394. doi:10.1021/cr3003533
Zhang K, Fu Y, Zeng WF, He K, Chi H, Liu C, Li YC, Gao Y, Xu P, He SM.2015. A note on the false discovery rate of novel peptides in proteoge-nomics. Bioinformatics 31: 3249–3253. doi:10.1093/bioinformatics/btv340
Zhao L, Saelao P, Jones CD, Begun DJ. 2014. Origin and spread of de novogenes in Drosophila melanogaster populations. Science 343: 769–772.doi:10.1126/science.1248286
Zhong Z, Yang L, Zhang YE, Xue Y, He S. 2015. Correlated expression of ret-rocopies and parental genes in zebrafish.Mol Genet Genomics 291: 723–737. doi:10.1007/s00438-015-1140-5.
ZhouQ,WangW. 2008. On the origin and evolution of new genes—a geno-mic and experimental perspective. J Genet Genomics 35: 639–648. doi:10.1016/S1673-8527(08)60085-5
Received April 19, 2018; accepted in revised form January 29, 2019.
Shao et al.
696 Genome Researchwww.genome.org