Resource and Technology Provision through Contract Farming … farming/Resources/11.2 Parmod...
26
Resource and Technology Provision through Contract Farming in India Parmod Kumar (Fellow) 6th May, 2007
Transcript of Resource and Technology Provision through Contract Farming … farming/Resources/11.2 Parmod...

Resource and Technology Provision through
Contract Farming in India
Parmod Kumar
(Fellow)
6th May, 2007

What is Contract Farming
• Contract farming refers to a system under which farmer sells her produce under forward contract to a known buyer. The buyer could be an agri business firm, a local processing unit or a multinational company.
• Contract is nothing but a commitment by a seller/farmer to supply an agricultural commodity of a particular quality, at a particular time, in requisite amount and at a pre agreed price to the contracted buyer

Types of Contract
• Market specification: Contracts are pre-harvest
agreements that bind the buyer and the grower to a particularset of conditions governing the sale of the crop. Theseconditions often specify price, quality and timing
• Resource provision: Contracts oblige the
processor to supply crop inputs, extension, credit etc., inexchange for a marketing agreement
• Production management: Contracts bind the
farmer to follow a particular production method or input regimen, usually in exchange for a marketing agreement or resource provision.

Contract Farming in India
• At present many firms are practicing contract
farming in different states. A few examples are:
• Pepsi – in potato, green chilly and citrus fruits in
Punjab;
• Green Agro Pack – gherkins in Karnataka
• Reliance Agrotech – cashew, mango, bambo and
teak in M.P.

Contract Farming in India
• A.V. Thomas Group Kochi – marigold in A.P. and T.N.
• HLL – chicory in Gujarat; basmati rice in Punjab; and dairy in U.P.
• Coimbatore Cots and Coatings Ltd – cotton in T.N.
• Ion Exchange Enviro Farm Ltd – organic mango, banana, pineapple, pulses and vegetables in Maharashtra
• Mittal Farms – medicinal plants and herb in Gujarat
• Semi Labs and Natural Remedies – medicinal plants in Karnataka
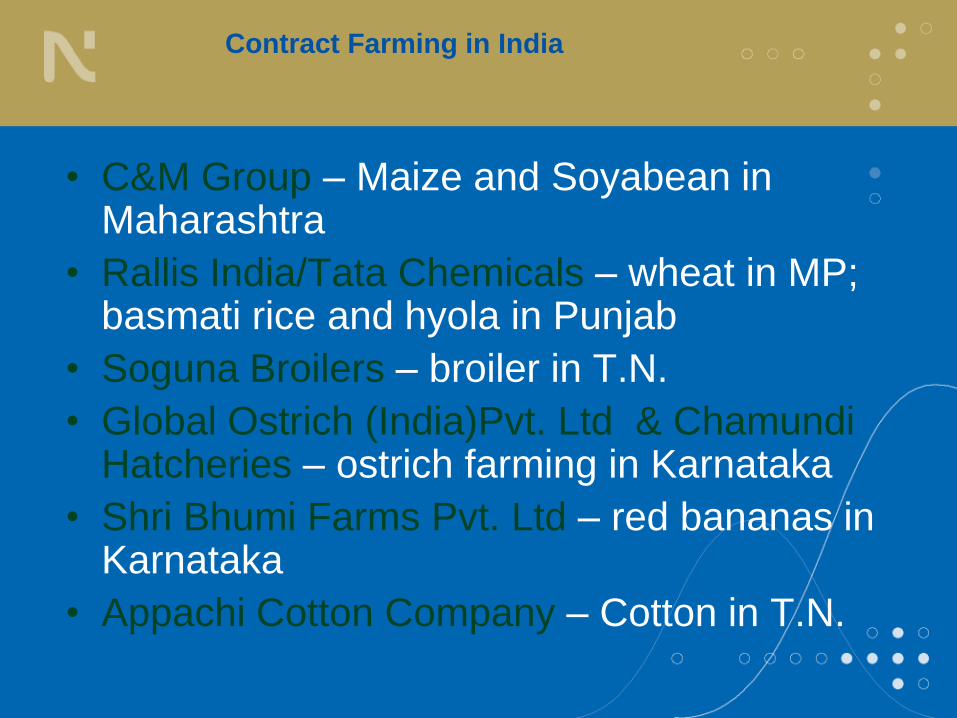
Contract Farming in India
• C&M Group – Maize and Soyabean in Maharashtra
• Rallis India/Tata Chemicals – wheat in MP; basmati rice and hyola in Punjab
• Soguna Broilers – broiler in T.N.
• Global Ostrich (India)Pvt. Ltd & Chamundi Hatcheries – ostrich farming in Karnataka
• Shri Bhumi Farms Pvt. Ltd – red bananas in Karnataka
• Appachi Cotton Company – Cotton in T.N.

Contract Farming Models
. Direct Contract between the Farmer and
Company
• (i) Pepsi/Fritolay (ii) Hindustan Lever Limited (iii)
Chambal Agritech Limited and (iv) A.M. Todd.
• Indirect Contract (tripartite) between the
farmer, the PAFC and the companies
• (i) Escorts Ltd (ii) DCM Sriram (iii) Mahindra
Shubh Labh and (iv) Tata Chemicals Ltd.

Objectives of the Study
• Evaluating application of contract farming onsmall versus large farms
• To measure the level of crop diversification in theregions widely covered by contract farming
• To see the role of corporate led contract farmingin raising productivity/profitability and in boostinggrowth in the agricultural sector

Data Base and Methodology
• A primary survey of 200 households,
comprising 100 each of contract and non
contract farmers in Punjab.
• Stratified Random Sampling Method was used
to draw sample for the contract and non
contract farmers.
• Because of non availability of information about
the size of operational holdings in each class,
the sample selected was not in their
proportionate size.
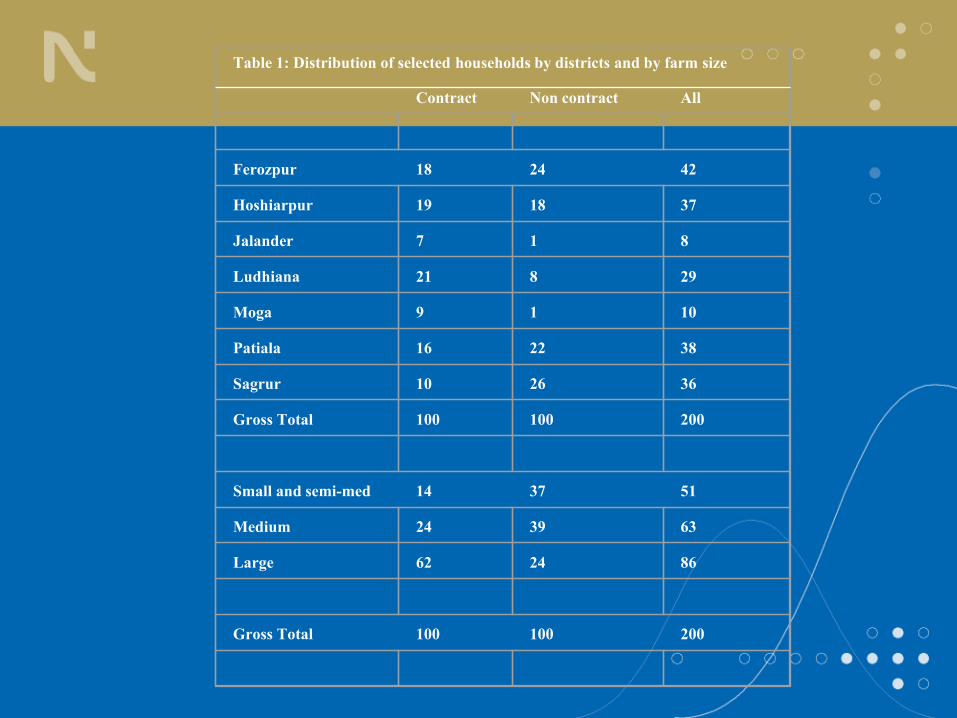
Table 1: Distribution of selected households by districts and by farm size
Contract Non contract All
Ferozpur 18 24 42
Hoshiarpur 19 18 37
Jalander 7 1 8
Ludhiana 21 8 29
Moga 9 1 10
Patiala 16 22 38
Sagrur 10 26 36
Gross Total 100 100 200
Small and semi-med 14 37 51
Medium 24 39 63
Large 62 24 86
Gross Total 100 100 200

Empirical Findings
• Written Contract but without any legal obligations both, on the
part of firms as well as farmers.
• Provision of seed to farmers free of cost by Chambal Agritech
while at market price by others.
• Provision of other implements to the farmers at company’s cost
in the case of Chambal Agritech and A.M. Todd
• Only direct contracting firms fulfilled the commitment of
providing extension services to the farmers and buying back their
product at the pre agreed price
• The PAFC led public sector contract farming model failed in all
aspects of CF, e.g., provision of inputs, extension services and
buy back commitments
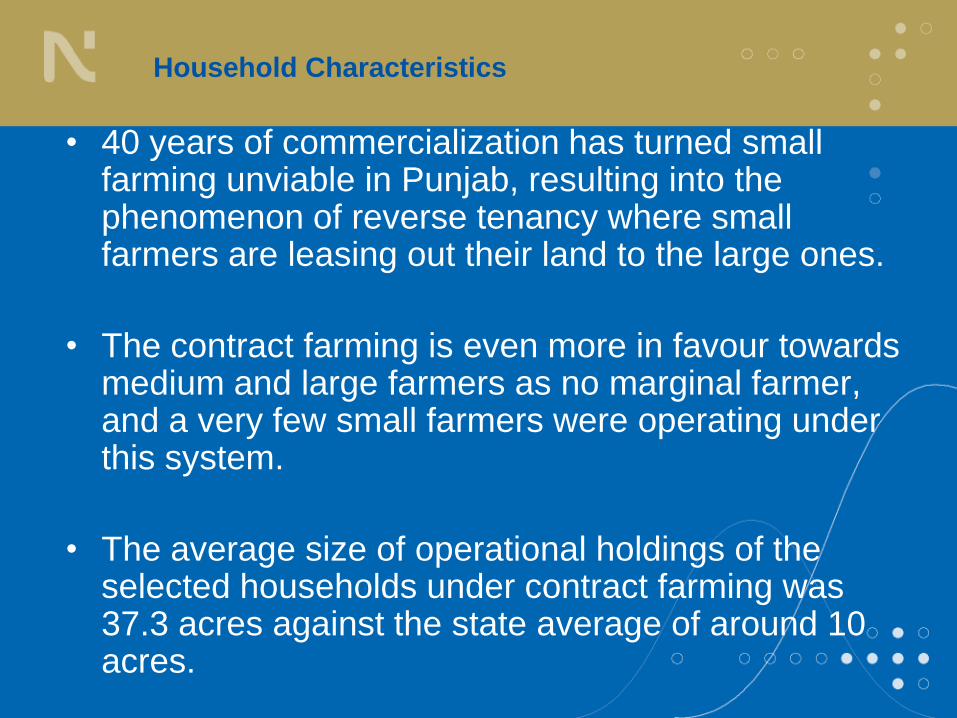
Household Characteristics
• 40 years of commercialization has turned small farming unviable in Punjab, resulting into the phenomenon of reverse tenancy where small farmers are leasing out their land to the large ones.
• The contract farming is even more in favour towards medium and large farmers as no marginal farmer, and a very few small farmers were operating under this system.
• The average size of operational holdings of the selected households under contract farming was 37.3 acres against the state average of around 10 acres.

Table 2: The main characteristics of the selected farmers
House
hold
size
(No)
Own
Area
(Acres)
Net area leased
in (Acres)
Net
operated
area
(Acres)
Cropping
Intensity
Area under
contract
farming
(Acres)
Full time
labourers
hired
(No)
Contract Farmers
SSM 5.36 8.11 0.54 (06.3) 8.64 2.05 2.27 (12.8) 0.71
Medium 7.46 12.40 5.15 (29.4) 17.54 2.11 7.56 (20.4) 0.92
Large 7.35 27.89 23.47 (45.7) 51.35 2.07 15.74 (14.8) 2.89
Aggregate 7.10 21.40 15.86 (42.6) 37.26 2.08 11.89 (15.4) 2.11
Non Contract Farmers
Small 5.89 5.19 0.99 (16.0) 6.18 2.04 0.00 0.24
Medium 6.72 13.38 3.22 (19.4) 16.60 2.05 0.00 0.85
Large 9.71 37.08 20.44 (35.5) 57.52 2.20 0.00 3.04
Aggregate 7.13 16.04 6.53 (28.9) 22.57 2.14 0.00 1.15
Source: Own survey estimates

Table 3: Cropping pattern of selected farmers (Percentage of gross cropped area)
Contract Farmers Crop
Contract
crops
Non contract
crops
Total
Non contract
farmers
Gross Total
Paddy 0.0 38.7 32.8 31.3 32.2 (32.5)
Wheat 0.0 36.1 30.6 32.3 31.2 (43.1)
Basmati 27.4 0.0 4.2 2.3 3.5 (-)
Potato 22.3 9.8 11.7 13.5 12.4 (-)
Potato-seed 18.9 0.0 2.9 0.0 1.8 (-)
Mint 10.7 0.3 1.9 0.0 1.2 (-)
Maize 10.2 1.2 2.6 3.5 2.9 (2.1)
Sunflower 6.1 5.6 5.7 6.0 5.8 (-)
Durum wheat 2.8 0.0 0.4 0.0 0.3 (-)
Hyola 0.8 0.0 0.1 0.1 0.1 (-)
Groundnut 0.6 0.0 0.1 0.1 0.1 (0.1)
Other coarse grains 0.0 0.0 0.0 0.1 0.0 (0.4)
Other pulses 0.0 0.8 0.7 0.4 0.6 (0.7)
Other oilseeds 0.0 0.1 0.1 0.3 0.1 (1.0)
Sugarcane 0.0 1.6 1.4 0.7 1.1 (1.6)
Cotton 0.0 0.1 0.1 0.3 0.2 (6.6)
Other vegetables 0.0 1.3 1.1 0.4 0.8 (-)
Fruits and plantations 0.0 0.3 0.3 3.7 1.6 (-)
Green fodder 0.0 4.2 3.6 5.2 4.2 (-)
Other crops 0.0 0.0 0.0 0.0 0.0 (12.0)
Total 100.0 100.0 100.0 100.0 100.0
Note: The figures in parentheses are percentage of GCA in Punjab during the TE 1999-01. The figures were
calculated based on data obtained from Economic Survey Punjab, various years
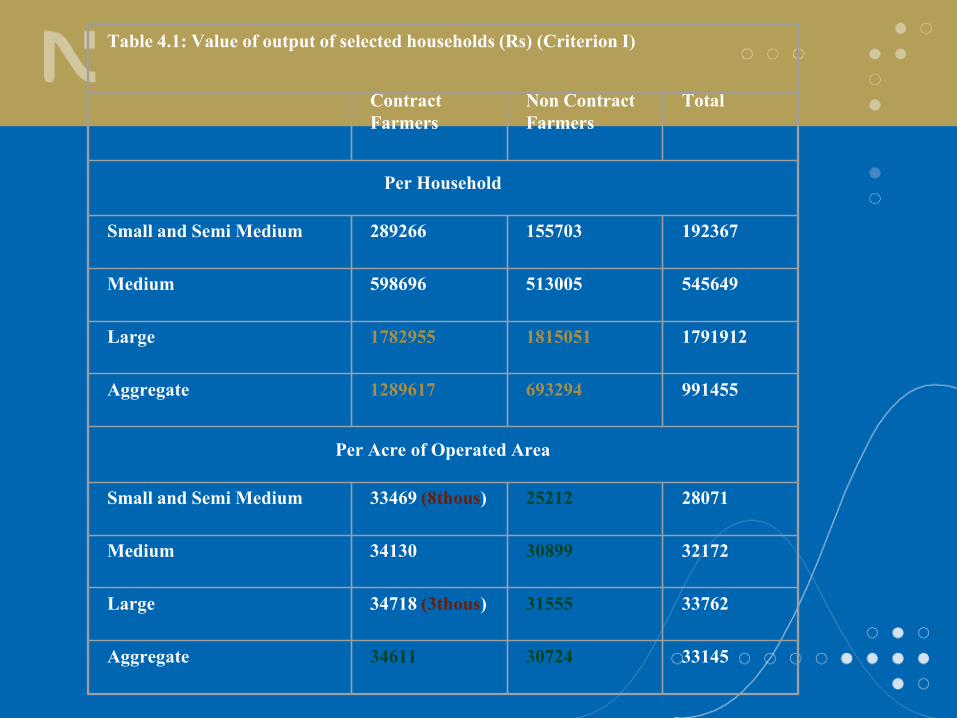
Table 4.1: Value of output of selected households (Rs) (Criterion I)
Contract
Farmers
Non Contract
Farmers
Total
Per Household
Small and Semi Medium 289266 155703 192367
Medium 598696 513005 545649
Large 1782955 1815051 1791912
Aggregate 1289617 693294 991455
Per Acre of Operated Area
Small and Semi Medium 33469 (8thous) 25212 28071
Medium 34130 30899 32172
Large 34718 (3thous) 31555 33762
Aggregate 34611 30724 33145

Table 4.2: Value of output of selected households (Rs) (Criterion II)
Contract Farmers Crop
Contract
crops
Non contract
crops
Non contract
farmers
Total
Per Household
Small and Semi Medium 59867 (20.7) 229399 (79.3) - -
Medium 165673 (27.7) 433023 (72.3) - -
Large 364655 (20.5) 1418300 (79.5) - -
Aggregate 274229 (21.3) 1015387 (78.7) - -
Per Acre of Cropped Area
Small and Semi Medium 26398 14817 12376 13741
Medium 21787 14720 15071 15513
Large 23212 15621 14318 15976
Aggregate 23078 15497 14338 15768

The Cost and Returns
• The cost of production was generally higher in the case of contract farmers as compared to non contract farmers. In majority of the cases, this was also true across all size categories.
• Accordingly, the difference in net returns between the contract and non contract farmers was not as high as it was observed in the case of total value of output

Table 5: Input use, output and returns per acre realized by contract and non contract farmers
(Rs. per acre)
Contract farmers
Non contract farmers
SSM
M
L
T
SSM
M
L
T
Seed
1380
(4.7)
2291
(8.6)
2153
(8.4)
2143
(8.3)
1158
(5.3)
910
(3.7)
1863
(8.2)
1518
(6.6)
Manure, fertilizer and plant protection
3677
(12.6)
4488
(16.9)
4297
(16.8)
4298
(16.7)
3620
(16.7)
4111
(16.6)
4565
(20.0)
4339
(18.9)
Irrigation charges
790
(2.7)
612
(2.3)
546
(2.1)
561
(2.2)
613
(2.8)
745
(3.0)
578
(2.5)
629
(2.7)
Hired tractor / bullock maintenance
421
(1.4)
27
(0.1)
0
(0.0)
17
(0.1)
694
(3.2)
49
(0.2)
0
(0.0)
85
(0.4)
Own tractor charges
1929
(6.6)
1662
(6.2)
1664
(6.5)
1672
(6.5)
739
(3.4)
1673
(6.8)
1653
(7.3)
1566
(6.8)
Machine harvesting & threshing charg
924
(3.2)
938
(3.5)
852
(3.3)
864
(3.4)
799
(3.7)
1142
(4.6)
873
(3.8)
943
(4.1)
Total material cost
9122
(31.2)
10018
(37.6)
9511
(37.2)
9555
(37.1)
7624
(35.1)
8629
(34.9)
9531
(41.9)
9079
(39.5)
Hired labour charges
1912
(6.5)
1745
(6.6)
1995
(7.8)
1964
(7.6)
1055
(4.9)
1394
(5.6)
1849
(8.1)
1638
(7.1)
Imputed value of family labour
951
(3.3)
1084
(4.1)
434
(1.7)
524
(2.0)
1421
(6.6)
753
(3.0)
523
(2.3)
680
(3.0)
Total operational cost
11986
(41.0)
12847
(48.3)
11939
(46.7)
12043
(46.7)
10100
(46.6)
10776
(43.6)
11903
(52.3)
11397
(49.6)
Rental value of owned land
13002
(44.5)
8744
(32.8)
6874
(26.9)
7247
(28.1)
8214
(37.9)
10214
(41.3)
6507
(28.6)
7483
(32.6)
Rent paid for leasing in land
2198
(7.5)
3651
(13.7)
5918
(23.1)
5541
(21.5)
2604
(12.0)
2628
(10.6)
3718
(16.3)
3292
(14.3)
Depreciation on implements
385
(1.3)
332
(1.2)
333
(1.3)
335
(1.3)
148
(0.7)
335
(1.4)
332
(1.5)
314
(1.4)
Interest on fixed capital
1663
(5.7)
1049
(3.9)
503
(2.0)
602
(2.3)
626
(2.9)
781
(3.2)
311
(1.4)
478
(2.1)
Total fixed cost
17248
(59.0)
13777
(51.7)
13628
(53.3)
13725
(53.3)
11592
(53.4)
13957
(56.4)
10869
(47.7)
11567
(50.4)
Total cost
29234
(100.0)
26624
(100.0)
25567
(100.0)
25768
(100.0)
21692
(100.0)
24733
(100.0)
22771
(100.0)
22964
(100.0)

Table 5 Contd: Input use, output and returns per acre realized by contract and non contract farmers
(Rs. per acre)
Contract farmers Non contract farmers
SSM M L T SSM M L T
Cost A2 13233 15414 17423 17060 11283 12651 15098 14010
Cost A2+FL 14184 16497 17857 17584 12704 13404 15621 14689
Cost B1 12697 12812 12008 12121 9305 10804 11691 11195
Cost B2 25699 21557 18882 19368 17519 21018 18198 18678
Cost C1 13649 13896 12442 12645 10726 11557 12214 11875
Cost C2 26650 22640 19316 19892 18940 21771 18721 19358
Cost C2* 26650 22640 19316 19892 18940 21771 18721 19358
Cost C3 29315 24904 21248 21881 20834 23948 20593 21293
Gross value of output
33469
34130
34718
34611
(3887)
25212
30899
31555
30724
Gross Value added
24347
24112
25207
25056
(3411)
17588
22270
22024
21645
Farm business income (FBI) 1 17237 16251 16025 16090 11734 16379 15290 15243
Farm business income (FBI) 2 4235 7506 9151 8843 3520 6166 8783 7760
Net returns over
Cost A1 22434 22367 23213 23092 16533 20876 20175 20007
Cost B1 20771 21318 22710 22490 15907 20095 19863 19529
Cost B2 7770 12573 15836 15243 7693 9881 13357 12046
Cost C1 19820 20234 22277 21966 14486 19342 19341 18849
Cost C2 6819 11490 15402 14719 6272 9128 12834 11367
FBI1 = Carryout income (Excluding the imputed cost of owned land
FBI2 = Net returns to farmer after subtracting all paid out and imputed cost including that of owned land

Table 6: The estimated production function for the selected households Dependent Variable: Log Value of output per acre
Independent Variables
Aggregate
Contract
Non
contract
Aggregate
Contract
Non
contract
Constant
3.48
(7.7)
3.58
(4.9)
3.92
(6.0)
5.22
(13.7)
5.33
(9.5)
5.47
(9.4)
Log Net operated area
(per acre)
0.06
(4.1)
0.06
(2.3)
0.06
(2.8)
0.04
(2.7)
0.04
(1.7)
0.04
(1.7)
Log Seed
(per acre)
0.09
(5.1)
0.10
(4.2)
0.05
(1.8)
0.11
(5.7)
0.13
(5.1)
0.06
(1.9)
Log (Fertilizer + plant
protection) (per acre)
0.21
(4.0)
0.18
(2.4)
0.29
(3.7)
0.19
(3.6)
0.15
(2.0)
0.27
(3.2)
Log Mechanization & tractor
(per acre)
0.23
(5.9)
0.22
(3.6)
0.18
(3.1)
0.18
(4.3)
0.15
(2.4)
0.15
(2.3)
Log Irrigation payments (Rs)
(per acre)
0.09
(2.7)
0.06
(1.1)
0.13
(2.9)
-
-
-
Log Labour use (Rs.)
(per acre)
0.25
(4.8)
0.30
(3.8)
0.15
(2.1)
-
-
-
Log irrigation (no of hours of
tubewell) (per acre)
-
-
-
0.10
(3.5)
0.15
(2.8)
0.08
(2.1)
Log Labour use (no of days)
(per acre)
-
-
-
0.23
(4.5)
0.25
(3.2)
0.17
(2.4)
Adjusted R-squared 0.63 0.64 0.56 0.64 0.66 0.57
F-statistic 55.43 30.12 19.93 57.8 33.5 18.4
Chow Test*
(Equality of the Coefficients
1.30
-
-
1.06
-
-
Note: The table value of Chow test at (7, 186) degree of freedom was 3.23 at 5 % significance.
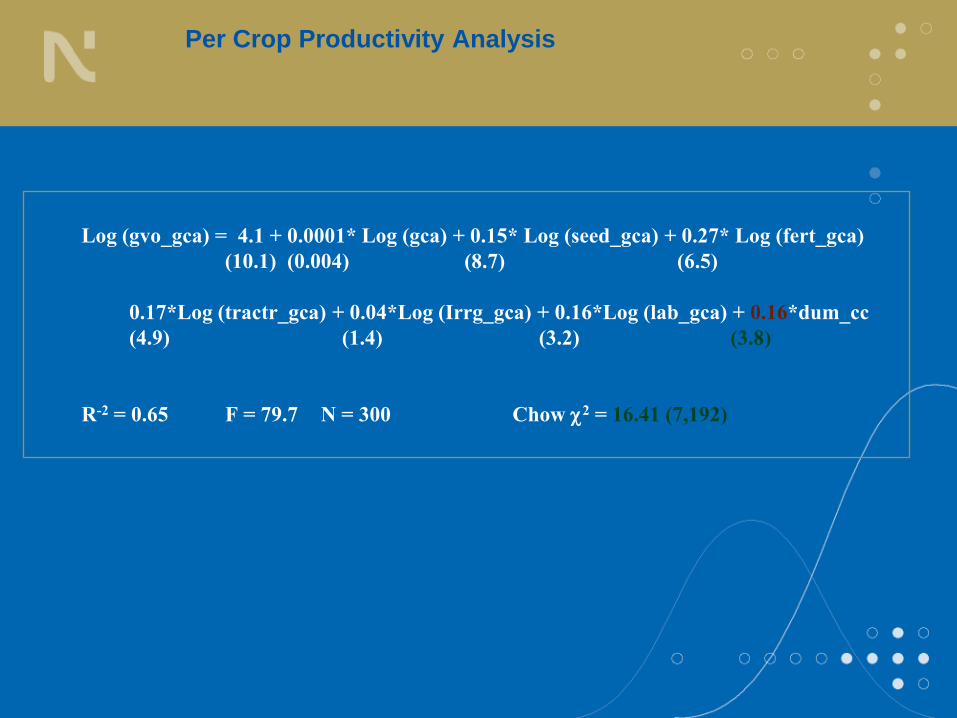
Per Crop Productivity Analysis
Log (gvo_gca) = 4.1 + 0.0001* Log (gca) + 0.15* Log (seed_gca) + 0.27* Log (fert_gca)
(10.1) (0.004) (8.7) (6.5)
0.17*Log (tractr_gca) + 0.04*Log (Irrg_gca) + 0.16*Log (lab_gca) + 0.16*dum_cc
(4.9) (1.4) (3.2) (3.8)
R-2 = 0.65 F = 79.7 N = 300 Chow 2 = 16.41 (7,192)

Concluding Remarks
• Out of the two models of direct and indirect
contract (through PAFC) followed by the
companies, the functioning of the former was
better.
• The system of contract farming in the state was
tilted towards medium and large farmers
• Contract farmers of all the categories tried to
maintain an immunity against risk of entering into
a contract by laying at least 2/3rd of their
operated area under non contract crops

Concluding Remarks
• Contract farming in the selected areas has to someextent, brought in diversification in the sowing patternof rabi crops, by substituting wheat, by one of thecombinations of potato-sunflower, potatoseed-mint orpotato-hyola. In the khariff season, however, no suchlucrative alternatives were available to the farmers
• The productivity data clearly showed a visiblesuperiority of contract farmers over their counterpartnon contract farmers in all size classes.
• The superiority of contract holders over non contractones was more dominant in the case of cropproductivity

Concluding Remarks
• As cost of cultivation was generally higher on contract farms in comparison to non contract farms, the gross value added as well as farm business income had less dispersion between these two sets of farmers as compared to farm productivity.
• The regression analysis revealed a direct relationship between farm size and productivity possibly because of higher use of mechanical operations in the sowing and harvesting activities, as the latter ascribe a clear advantage of economies of scale to the large holders.

Concluding Remarks
• Chow test did not reject the null hypothesis
that the coefficients of production functions
of contract and non contract farmers were
not significantly different, however, the test
was rejected in the case of crop
productivity indicating higher crop
productivity in the case of contracted
crops. The same was also confirmed by
the positive and significant coefficient of
dummy variable of contract crops.

Thank You.