Resistance to Incipient caries and properties of composite ...
100
Resistance to Incipient caries and properties of composite resin containing nano-sized tricalcium phosphate-fluorapatite (TCP-FA) filler Myung-Eun Kim Department of Dental Science The Graduate School, Yonsei University
Transcript of Resistance to Incipient caries and properties of composite ...

Resistance to Incipient caries and properties of composite resin
containing nano-sized tricalcium phosphate-fluorapatite (TCP-FA) filler
Myung-Eun Kim
Department of Dental Science
The Graduate School, Yonsei University

Resistance to Incipient caries and properties of composite resin
containing nano-sized tricalcium phosphate-fluorapatite (TCP-FA) filler
Directed by Professor Kyoung-Nam Kim, D.D.S., Ph.D.
The Doctoral Dissertationsubmitted to the Department of Dentistrythe Graduate School of Yonsei University
in partial fulfillment of the requirements for the degree of PhD. in Dental Science
Myung-Eun Kim
June, 2014


TABLE OF CONTENTS
LIST OF FIGURES ·············································································
LIST OF TABLES ···············································································
ABSTRACT ···························································································
. INTRODUCTION ············································································ 1 1. Composite resin ············································································· 1 2. Secondary caries of composite resin ··········································· 3 3. Prevention of secondary caries on composite resin restorative materials ······································································· 4 4. Tricalcium phosphate (TCP) and fluorapatite (FA) ··················· 6 5. Nano-sized particle ········································································ 8 6. The objective of this study ························································ 10
. MATERIALS AND METHODS ·················································· 12 1. Materials ······················································································· 12 1.1 Synthesis nano-sized TCP-FA filler ······································ 12 1.1.1 Synthesis of nano-sized FA ·············································· 12 1.1.2 Synthesis of nano-sized TCP ·············································· 13 1.1.3 Composition of nano-sized TCP-FA ································ 14 1.2 Fabrication of resin matrix ····················································· 14 1.3 Fabrication of composite resin ··············································· 15 2. Methods ························································································· 17

2.1 Characteristic analysis of synthesis powder ························· 17 2.1.1 XRD analysis ···································································· 17 2.2.2 SEM analysis ······································································ 17 2.2.3 TEM analysis ······································································ 17 2.2 Measurement of resistance of demineralization ··················· 19 2.2.1 Preparation of specimen ····················································· 19 2.2.2 Process of demineralization ··············································· 20 2.2.3 Measurement of demineralization resistance ···················· 22 2.3 Acid neutralizing properties ···················································· 24 2.3.1 Preparation of specimen ····················································· 24 2.3.2 Process of acid neutralizing ·············································· 24 2.3.3 Measurement of acid neutralizing ····································· 25 2.4 Mechanical properties ······························································ 26 2.4.1 Preparation of specimen ····················································· 26 2.4.2 Process of flexural strength testing ·································· 26 2.5 Physical properties ··································································· 28 2.5.1 Preparation of specimen ····················································· 28 2.5.2 Process of water sorption and solubility test ·················· 28 2.6 Biological properties ································································ 30 2.6.1 Preparation of specimen ····················································· 30 2.6.2 Process of cytotoxicity test ··············································· 30 2.6.3 Evaluation of cytotoxicity ·················································· 31 2.7 Statistical analysis ···································································· 33
. RESULTS ······················································································· 34 1. Characteristic analysis of synthesis powder ····························· 34 1.1 XRD analysis ··········································································· 34
1.2 SEM analysis ··········································································· 34 1.3 TEM analysis ··········································································· 35 2. Analysis on resistance of demineralization ······························· 37 2.1 Evaluation of surface microhardness ····································· 37 2.2 Evaluation of QLF-D ······························································ 39 2.3 Correlation between loss of fluorescence and surface microhardness reduction ············································· 40 3. Acid neutralizing properties ························································ 42 3.1 pH change of the solution by time ······································ 42 3.2 Time to raise pH from 4 to 5.5 ··········································· 44 4. Mechanical properties ·································································· 46 4.1 Flexural strength evaluation ···················································· 46 5. Physical properties ······································································· 48 5.1 Water sorption evaluation ······················································· 48 5.2 Solubility evaluation ································································ 49 6. Biological properties ···································································· 51 6.1 Cytotoxicity evaluation ···························································· 51
. DISCUSSION ················································································· 55
. CONCLUSION ··············································································· 69
. REFERENCES ··············································································· 71
ABSTRACT (In KOREAN) ································································ 85

LIST OF FIGURES
Figure 1. Synthesis of TCP and FA ································· 13
Figure 2. Fabrication of composite resin ·························· 15
Figure 3. Making process of demineralization solution ································································ 21
Figure 4. The QLF-D ·························································· 23
Figure 5. The XRD patterns of TCP-FA filler ················ 34
Figure 6. SEM and TEM images of the TCP, FA and TCP-FA ························································ 36
Figure 7. QLF images of each groups after 24 hours and 48 hours demineralization ··············· 41
Figure 8. pH change of pH 4.0 solution by time ·········· 43
Figure 9. Time to raise the solution pH from 4.0 to 5.5 ··································································· 45
Figure 10. 3-point flexural strength values of composite resin with TCP-FA filler contents ·················· 47
Figure 11. Water sorption values of composite resin with TCP-FA filler contents ·················· 49
Figure 12. Solubility values of composite resin with TCP-FA filler contents ··························· 50
Figure 13. Undiluted solution ············································· 53
Figure 14. Diluted solution by 50 % ································ 53

LIST OF TABLES
Table 1. Filler mass fraction in the composite resin (%) ······························································· 16
Table 2. Grades of cytotoxicity corresponding to cell viability percentage ······································· 32
Table 3. Surface microhardness reduction of each groups ···································································· 38
Table 4. Degree of fluorescence loss in each groups ···································································· 39
Table 5. Correlation between F value by QLF and %SMHR by VHN ········································ 40
Table 6. Difference of each groups on pH value of pH 4.0 from 1 to 90 minutes ···························· 44
Table 7. Comparison of water sorption and solubility between each groups ··························· 48
Table 8. Optical density of each groups according to concentration-dilution ······································· 52
Table 9. Evaluation of cytotoxicity ··································· 54

Abstract
Resistance to Incipient caries and properties of composite resin containing nano-sized tricalcium phosphate-fluorapatite (TCP-FA) filler
Myung Eun KIM
Department of DentistryThe Graduate School, Yonsei University
(Directed by Professor Kyoung-Nam Kim, D.D.S., Ph.D.)
Introduction
Composite resin has been widely used for dental restoration because demand for esthetic application are increased and the properties of materials are improved. However, secondary caries, which is a carious lesion around an existing restoration limit longevity of the restoration and it is a frequent and important reason for the replacement of an existing restoration. Thus it is need to improve materials in order to effectively inhibit it.
Tricalcium phosphate [TCP, Ca3(PO4)2], which release calcium and phosphate, has resistance on demineralization and promote remineralization of tooth. Fluorapatite [FA, Ca10(PO4)6F2] releases fluoride and shows aptitude to delay caries process. It also enhances mechanical properties when it is added to TCP.
For this reason, the objective of this study was to evaluate resistance on initial caries and was to investigate material properties of composite
resin containing TCP-FA filler.

Materials and methods
FA with CaHPO4, Ca(OH)2 and CaF2, and TCP with CaHPO4 and Ca(OH)2 were synthesized through dry mechanochemical process. After synthesis, TCP-FA that mixed fluorapatite-tricalcium phosphate mass ratio of 4:6 were developed.
Phase analysis of TCP-FA were evaluated with the X-ray diffractometer (XRD) and morphological feature, size of particle and agglomerate distribution were investigate by SEM and TEM.
After characteristic analysis, TCP-FA filler were respectively added 0 %, 10 %, 15 %, 20 %, 25 % in resin matrix and resistance on initial caries, mechanical, physical and biological properties were evaluated
To evaluate resistance on initial caries, resistance of demineralization and acid neutralization were investigated. Resistance of demineralization were evaluated by VHN and QFL-D after 24 and 48 hours demineralization. Acid neutralizing properties were evaluated by pH change per minute for 90 minutes and time to raise pH from 4.0 to 5.5.
Flexural strength for mechanical properties, water sorption and solubility for physical properties and cytotoxicity for biological properties were evaluated.
Results
TCP-FA were identified similar peak with FA and TCP by XRD. Particle with cubic and spheroidal morphology were observed. Particle size of TCP and FA were respectively 19.78±6.4 and 26±7.55 nm.
%SMHR (surface microhardness reduction) and F-value (loss of fluorescence) of composite resin with TCP-FA filler were lower than that without TCP-FA filler. Particularly F-value of Group 4 with 20 % fo

TCP-FA filler and Group 5 with 25 % of TCP-FA filler was respectively the lowest among all groups after 24 hours and 48 hours demineralization respectively (p<0.05).
According to add TCP-FA filler, pH change of solution were increased greatly and rapidly. pH was also increased from pH 4.0 to 5.5 in a shorter time by addition of TCP-FA filler. These tendency showed remarkably in Group 5 (p<0.05).
As the addition of TCP-FA filler, flexural strength were decreased. Group 5 was especially lowest among all groups (p<0.05) but there were no difference between other groups except 25 % group (p>0.05).
Water sorption and solubility of all groups were satisfied requirement ISO 4049 standard and cytotoxicity of all groups except 25 % group showed non-cytotoxic.
Conclusion
In this study, there were confirmed that nano-sized TCP-FA filler affected on resistance of demineralization, acid neutralizing properties and material properties. Particularly composite resin containing 20 % more of TCP-FA filler were remarkable. However composite resin containing 25 % of TCP-FA filler showed moderate toxic and low flexural strength. Thus composite resin containing 20 % of TCP-FA filler are effective for initial secondary caries-inhibition.
Kew word : composite resin, nano-sized TCP-FA filler, resistance of
demineralization, acid neutralization, flexural strength,
water sorption, solubility, cytotoxicity

Resistance to Incipient caries and properties of composite resin
containing nano-sized tricalcium phosphate-fluorapatite (TCP-FA) filler
Myung Eun KIM
Department of DentistryThe Graduate School, Yonsei University
(Directed by Professor Kyoung-Nam Kim, D.D.S., Ph.D.)
. Introduction
1. Composite resin
If a cavity is already formed due to the progress of initial dental caries, there is no choice but to restore the tooth using restorative materials because of the tooth's irreversibility (Lee et al., 2003).
Restorative materials include metal materials such as amalgam and gold or metal inlay and esthetic materials such as glass ionomer, resin modified glass ionomer (RMGI), compomer and composite resin (Lai etal., 2013; Yamada et al., 2004; Chan et al., 2006; Donly et al., 1999).
Prior to 1980, dental amalgam was mainly used for dental restoration, but it has drawbacks including concerns about the environmental impact and potential health issues associated with mercury in dental amalgam. Moreover, it is not esthetic (Kovarik 2009; Osborne et al., 2002). Silicate cement, which was first introduced as a direct esthetic restorative material, is not only esthetic but also is anticariogenic due to the release of fluoride ion (Korean council for the faculty of dental materials, 2011).

However, silicate cement has the disadvantages of being a severe irritant to pulp tissue. Its pH is less than 3 at the time of insertion and remains below 7 even after one month. Its high solubility and tendency to disintegrates in the oral cavity is another disadvantage of silicate cement (Anusavice, 2006).
Composite resin was developed to overcome the drawbacks of amalgam and silicate cement and to increase its function and positive properties. They are complex, tooth-colored filling materials composed of a resin matrix, particulate ceramic reinforcing fillers and silane coupling agents which bond the reinforcing fillers to the resin matrix. 80~90 % of resin matrix utilizes the Bisphenol glycerolate dimethacrylate (Bis-GMA) monomer (Ferracane, 1995). Bis-GMA has less volatility and polymerization shrink than traditional methacrylate, greater solidity and a faster setting time, so as a resin restoration material it is receiving a great deal of attention (Lim et al., 1992). Reinforcing fillers comprise 60~80 wt% of composite resin and fillers such as silica, barium, zirconium and strontium. Fillers are used to strengthen of dental composite and for, increased stiffness, reduced dimensional change when heated and cooled, reduced setting contraction, radiopacity, enhanced esthetics and improved ease of handling. In general, the physical and mechanical properties of a composite improve in direct relation to the amount of filler added (Ferracane, 1995).
In their early stage of development, composite resin were for many years considered acceptable restorative materials for anterior application (Ferracane, 1995; Lee et al., 2003). At present, however, they have been widely used for posterior restorations because demand for esthetic application are increased and the properties of materials which include mechanical and physical properties are improved by refined resin matrix and filler and improved bonding systems and methods of composite resin placement (Kim et al., 2001; Osborne et al., 2002).

2. Secondary caries to composite resin
The two main challenges in using composite resin are secondary caries and bulk fracture (Xu et al., 2011). Secondary caries is a carious lesion around an existing restoration that occurs after the restoration has been in place for some time (Lai et al., 2013). It is identified as a main limitation to the longevity of the restoration and is a frequent and important reason for the replacement of an existing restoration (Xu et al.,2011), which accounts for 50~70 % of all restoration (Cheng et al.,2012).
Secondary caries are classified into two. The one is an outer lesion, which is histologically similar to primary lesion nest to a restoration. The other one is a cavity wall lesion, appearing as a rim of altered enamel or enamel and dentin caused by acid penetrating the interface between restoration materials and cavity wall of tooth (Hals, 1975; Neuhaus et al., 2012). Marginal microleakage indicates bacterial, fluid molecular and ion flow into the niche between the restoration material and tooth (Lee et al., 2003). When marginal microleakage occurs, bacterial metabolic activity takes place on the inner niche and pH is lowered by the acid produced by bacterial metabolic activity. Ultimately, demineralization of the tooth occurs (Hwang et al., 2002). Though polymerization shrinkage of composite resin differs depending on filler size and filler content, it is known to be around 2~4 % during polymerization. Polymerization shrinkage destroys the bond between composite resin and the tooth and causes marginal microleakgae, and eventually secondary caries occurs at the exiting restoration (Korean council for the faculty of dental materials, 2011).
There is thus a need for composites with secondary caries-inhibition capabilities which improve resistance to demineralization and promote tooth remineralization.

3. Prevention of secondary caries on composite resin restorative materials
To prevent of secondary caries, there has been studied that substance which have anticariogenic effect and antibacterial effect was added to composite resin (Imazato et al., 1998; Cheng et al., 2012; Moreau et al., 2011). Fluoride is one of the major anticariogenic agent. Fluoride released from dental restorative materials affect caries formation through variety mechanisms including the reduction of demineralization, the enhancement of reminerlaization, the interference of pellicle and plaque formation and the inhibition of microbial growth and metabolism. It may thus reduce or prevent demineralization and promote remineralization of dental hard tissues. Add to this, fluoride has more great affinity with caries lesion than sound enamel. So when fluoride is increased around caries lesion, it is effectively absorbed in caries lesion and inhibit progress of caries. For this reason, several composite resin, adding fluoride as filler or additive, hybrid ionomer and compomer with intermediate properties and composition between composite resin and glass ionomer are developed (Weigand et al., 2007; Xu and Burgess, 2003; Xu et al., 2008). However effect of caries inhibition has been questioned because amount of fluoride release from composite resin and compomer is less than glass ionomer (Park and Kim, 1997), and physical properties is decreased while fluoride is increased (Xu and Burgess, 2003).
One method to prevent secondary caries is to add an antibacterial filler or agent to composite resin (Cheng et al., 2012; Imazato et al., 1998). It has been reported that the occurrence of caries decreases when an antibacterial agent is released around a marginal leakage (Kim, 2002). Wu et al. (2012) have reported that nano silica particles grafted with quaternary ammonium salt (quaternary ammonium iodide N,N,N-trimethyl-3- (trimethoxysilyl) propan-1-aminium iodide) have a strong bactericidal effect
on Streptococcus mutans. The authors have suggested that nano silica particles grafted with quaternary ammonium salt could be used to improve the antibacterial properties of dental composite resin. Another study has reported that antibacterial activity after the curing of dental resin with incorporated antibacterial monomer 12-methacryloyloxydodecylpyridinium bromide (MDPB) and an adhesion -promoting phosphoric monomer demonstrated bacteriostatic activity as a contact antimicrobial (Imazato etal., 1998). However effect of antibacterial agent released from restoration and anticariogenic activity are very low and toxicity of substance releasing antibacterial agent is increased. Addition to, homeostasis of microbial colony in oral cavity is destroyed and mechanical properties and physical properties of restoration is degenerated (Kim, 2002).
The method of adding calcium and phosphate ion has also been suggested. Calcium phosphate, Casein phosphate-amorphous calcium phosphate (CPP-ACP) and apatite composed of calcium and phosphate induce tooth remineralization (Xu et al., 2009). Some studies have reported that in tests of ion release on composite resin containing ACP and decalcium phosphate (DCPA) respectively, all composite resin containing ACP and DCPA released calcium and phosphate ions at sustained levels requisite for remineralization (Skrtic et al., 1996; Xu et al., 2006). Langhorst et al. (2009) have studied about the remineralization effect of composite containing ACP on enamel lesions and have reported composite with ACP indicated greater mineral recovery compared to commercial orthodontic F-releasing cement. The authors have suggested that composite with ACP could be considered a useful adjuvant for the control of caries in orthodontic applications. Calcium and phosphate also affect increment of pH. In study investigating the acid neutralizing properties, pH of solution was quickly increased according to add ACP (Moreau et al., 2011). Therefore calcium ion in ACP affect acid neutralization and could reduce secondary caries, main challenges facing tooth cavity restoration.
4. Tricalcium phosphate (TCP) and Fluorapatite (FA)
Calcium phosphates (CaP) based materials have attracted considerable interest for orthopaedic and dental applications (Ayed and Bouaziz, 2008), because their chemical composition and properties are similar to that of bone mineral (Bouslama et al., 2010; Seeley et al., 2008). Especially they release calcium and phosphate ions which can form hydroxyapatite, resistant demineralization and remineralize enamel and dentin lesions. Therefore these materials have been used as filler in dental resin (Xu etal., 2009). Calcium phosphate belong to an important family of bioceramics resembling the part of calcified tissues, particularly hydroxyapatite Ca10(PO4)6(OH)2(Hap), tricalcium phosphate Ca3(PO4)2
(TCP) and fluorapatite Ca10(PO4)6F2 (Fa) (Ayed and Bouaziz, 2008).Various calcium phosphates have been distinguished only by Ca/P ratio
(Dorozhkin, 2010). An atomic Ca/P ratio and chemical formula of TCP is 1.5 and Ca3(PO4)2 xH2O respectively (Tabrizi and Fahami, 2013b).
TCP is a material which forms a bioactive bond with natural bone. TCP has a lower calcium-to-phosphorous ratio, which increases the degradation rate when the ceramic is placed in a biological environment. TCP degrades when in the body and the products are resorbed by the surrounding tissue and allow for efficient bone tissue engineering as they can promote apatite formation and simultaneously deliver growth factors for osteoconduction (Seeley et al., 2008). TCP not only shows good tissue tolerance with no immunological or toxic reactions (Tabrizi and Fahami, 2013a) but also promote remineralization on demineralized enamel due to fill micropore by calcium and phosphate.
However the use of it was always restricted because of their fragility and their weak resistance to rupture (Bouslama et al., 2013) and decrease the mechanical properties (Ayed and Bouaziz, 2008) such as flexural strengths (Xu et al., 2009). Thus there is an need for maximizing the

mechanical properties of the TCP suitable for biomedical applications (Bouslama et al., 2013).
Some studies which add other substance such as NaF, CaO (Seeley etal., 2008), Hap (Hong et al., 2008), FA (Bouslama et al., 2010; Ayed and Bouaziz, 2008) to TCP have been reported in order to reinforce its properties.
Fluorapatite (FA) has many potential advantages than hydroxyapatite. It has an excellent biocompatibility with the adjacent hard tissue and has a higher chemical and thermal stability (Bouslam et al., 2013; Ayed and Bouaziz, 2008). FA is formed when the OH- in hydroxyapatite of tooth structure is completely substituted by F- (Kahrizsangi et al., 2011). Once structure of tooth have been transformed into FA, it have strong acid resistivity than hydroxyapatite and protects dental caries. Moreover FA can release fluoride and shows aptitude to delay caries process without the biocompatibility degradation. Also it enhances mineralizaition and crystalization (Bouslama et al., 2013; Bouslama et al., 2009; Ayed and Bouaziz, 2008). What is more FA is usually used in dental application due to its grater mechanical strength (Kahrizsangi et al., 2011). and when FA is added to TCP, its mechanical properties are improved (Bouslama et al., 2009; Ayed and Bouaziz, 2008).

5. Nano-sized particle
Nanotechnology - "nano" meaning a billionth part -, is microfine technology that is beyond even the micro level. It was introduced In 1981 with the development at IBM research in Switzerland of STM, which observe combining state inter-atoms. Since the 1990s, advanced countries such as The USA and, Japan have been studied this as national research projects. Korea has also made an attempt at the promotion and development of nanotechnology with the passage of the Development Promotion Act in 2002 (Kim et al., 2009).
Because the structure and form of a substance are controlled by nanotechnology and substances or devices with new properties and functions can be made (Park et al., 2008), even though materials have the same composition, if nano-sized (50~90nm) materials are produced, new physical and chemical properties can be expected (Kim et al., 2009).
Recently, nanotechnology has been applied to the field of dentistry and studies demonstrating its various effects has been done. Glass ionomer cement containing nano-sized -TCP has shown resistance to demineralization on acid (Hong et al., 2008). Nano-sized hydroxyapatite in a 0.05 % NaF mouthrinse has the potential to remineralize an early caries lesion (Kim et al., 2007). Also, a study in which nano-sized ACP was added to composite resin has reported that enough calcium and phosphate ion were released for reminerlization (Xu et al, 2011), and experimental study which measured the mechanical strength of nano-sized calcium phosphate and micro-sized them has reported that nano-sized calcium phosphate showed better properties than micro-sized calcium phosphate, including improved flexural strength, modulus of elasticity, Vickers hardness and compressive strength (Lin et al., 2007).
It is therefore necessary to produce a nano-sized particle and to add to composite resin in order to encourage the release of ion such as calcium,

phosphate and fluoride due to the higher surface of nano-sized particles, and then it inhibit demineralization and induce remineralization while maintaining the conventional properties of the materials.

6. The objectives of this study
After dental caries is treated with composite resin, if the composite resin inhibits demineralization and induces remineralization, it is expected to serve as an anticariogenic restorative materials.
Substances as ACP, -TCP and apatite are known to inhibit tooth demineralization and induce remineralization, as has been shown in many studies (Xu et al., 2011; Mah, 2009; Hamba et al., 2011). However these materials are added to tooth sealant, glass ionomer cement or non-restorative cement. Although these materials are added to composite resin, it is difficult to identify their resistance effect on dental caries because these materials have been studied with regard to their indirect resistance to demineralization or promotion of remineralization through ion release, and have not been directly tested. Existing studies on composite resin containing these materials are insufficient. A study is thus need to directly prove the resistance of dental caries on filler added to composite resin.
Also calcium phosphate be concerned about fracture because its mechanical properties are decreased (Bouslama et al., 2013). There have been some studies about complex materials which mixed two more materials in order to improve the mechanical properties and the resistance to demineralization. Mah (2009), Kim (2011) studied about biphasic calcium phosphate (BCP) in which -TCP and hydroxyapatite were mixed.
FA has beteer mechanical properties than hydroxiapatite when it is added to TCP. Moreover it not only releases fluoride ion but also delay dental caries (Bouslama et al., 2009; Ayed and Bouaziz, 2008). However the studies on it are rare.
In this study, nano-sized TCP and FA were synthesized using a mechanochemical method and the resulting mixture was used as a

composite filler. Because TCP steadily releases ion such as calcium and phosphate. Also FA is expected to release fluoride ion and improve the mechanical properties of TCP.
Resistance to demineralization and acid neutralization of composite resin containing TCP-FA filler were performed in order to evaluate resistance to incipient caries. In addition to mechanical, physical and biological properties were performed to evaluate properties of composite resin containing TCP-FA filler.
The objectives of this study were specifically as follows :
1. The characteristic of TCP-FA is confirmed by XRD, SEM and TEM.
2. Surface microhardness reduction by vickers hardness(VHN) test and loss of fluorescence by QLF-D are performed in order to evaluate resistance to incipient caries of composite resin containing TCP-FA filler.
3. Acid neutralizing is evaluate by pH change of pH 4.0 solution immersed composite resin containing TCP-FA filler.
4. Flexural strength of composite resin with TCP-FA filler is measured in order to evaluate mechanical properties.
5. Water sorption and solubility of composite resin with TCP-FA filler are measured to evaluate physical properties.
6. Cytotoxicity is measured to evaluate biological properties.

. Materials and Methods
1. Materials
1.1 Synthesis nano-sized TCP-FA filler
In this study mechanochemical method was used to synthesis nano-sized TCP and FA. TCP-FA which mixed FA and TCP was used as filler of composite resin.
1.1.1 Synthesis of nano-sized FA
Nano-sized FA was synthesized in accordance with study of Kahrizsangi et al. (Kahrizsangi et al., 2011; Kahrizsangi et al., 2010). To synthesize FA, anhydrous dicalcium phosphate (CaHPO4, Merck, Germany), Calcium hydroxide (Ca(OH)2, Sigma-Aldrich, Germany), and Calcium Fluoride (CaF2, Sigma-Aldrich, Germany) was mixed as molar ratio of 6:3:1.
Mixed powders were ground on a high energy planetary mill (Planetary ball mill PM 100, RETSCH, Germany). Milling process were performed in vials using zirconia ball of diameter 20mm under ambient air atmosphere for 20 hours. The charge-to ball ratio and rotational speed were 1:20 and 600 rpm, respectively. To prevent excessive heating, the milling was carried out in 45-min milling steps with 15-min interval pauses.
Mechanochemical reaction between the materials through high energy planetary ball mill process are as follows :
6CaHPO4 + 3Ca(OH)2 + CaF2 Ca10(PO4)6F2 + 6H2O

Figure 1. Synthesis of TCP and FA.
a. Powder and zirconia ball as molar ratio of 1:20 were put in the jar.b. The jar was placed in high energy planetary boll mill and was
operated.c. After completion of operation, synthesized powder was obtained. d. Synthesized powder was put in the agate mortar. e. Fine powder was obtained through grinding.
1.1.2 Synthesis of nano-sized TCP
Nano-sized TCP was synthesized in accordance with study of Tabrizi and Fahami (2013b). To synthesize tricalcium phosphate, anhydrous dicalcium phosphate (CaHPO4, Merck, Germany) and Calcium hydroxide (Ca(OH)2, Sigma-Aldrich, Germany) was mixed as Ca/P =1.5.

Mixed powders were ground on a high energy planetary mill (Planetary ball mill PM 100, RETSCH, Germany). Milling process were performed in vials using zirconia ball of diameter 20mm under ambient air atmosphere for 10 hours. The charge-to ball ratio and rotational speed were 1:20 and 600 rpm, respectively. To prevent excessive heating, the milling was carried out in 45-min milling steps with 15-min interval pauses.
Mechanochemical reaction between the materials through high energy planetary ball mill process are as follows :
Ca(OH)2 + 2CaHPO4 Ca3(PO4)2 xH2O(Ca/P=1.5)
1.1.3 Composition of nano-sized TCP and FA
To obtain TCP-FA, synthesized TCP and FA were prepared as mass ratio of 4:6 (LIBROR AEX-200B, Shimadzu, Japan). Mixture process were performed in accordance with previous study (Bouslama et al.,2013). Prepared powder were mixed in agate mortar. The powder mixtures were milled in ethanol for 24 hours (Ball mill, Shamwoo scientific Co., Korea). After milling, the mixtures were dried in constant temperature drying oven (Jeil Scientific Ind. Co. Ltd) at 120 for 48 hours.
1.2 Fabrication of resin matrix
A resin matrix mixture process were performed in accordance with previous study (Yang et al., 2013). A resin matrix consisting of 49.5 wt% Bisphenol A glycerolate dimethacrylate (Bis-GMA, Sigma-Aldreich, Germany), 49.5 wt% Triethylene glycol dimethacrylate (TEGDMA, Sigma-Aldrich, Germany), 0.66 wt% 2- (Dimethylamino)ehtyl

methacryllate (DMAEMA, Sigma-Aldrich, Germany) and 0.33 wt% Camphorquinone (CQ, Sigma-Aldrich, Germany) formed.
The mixture was placed in a sonicator (Branson 2210R-DTH, Branson, USA) for 20 min in order to obtain homogeneous state. Then, the resin matrix was blended using magnetic stirrer device (WiseStir MS-20A,Daihan Scientific Co., Ltd, Korea) in the dark enviornment for 24 hours.
Figure 2. Fabrication of composite resin.
a. Resin matrix of 30 wt% was prepared.b. Nano-sized TCP-FA fillers of each groups was prepared. c. Co-fillers was added in nano-sized TCP-FA filler to be 70 wt% of
total filler amount.d. Matrix and filler were mixed until evenly mixed.
1.3 Fabrication of composite resin
Composite resin was composed of matrix of 30 wt% and filler of 70 wt%. Commercial barium glass (Schott, Germany) was used as co-filler of TCP-FA filler. Total filler amount was kept at 70 wt%.
Five groups depending on the proportions of nano sized TCP-FA filler were fabricated. Group 1 : 0 wt% nano-sized TCP-FA + 70 wt% barium glass, Group 2 : 10 wt% nano-sized TCP-FA + 60 wt% barium glass, Group 3 : 15 wt% nano-sized TCP-FA + 55 wt% barium glass, Group 4

FillerExperiment group
1 2 3 4 5
nano-sized TCP-FA 0 10 15 20 25
Barium Glass 70 60 55 50 45
Total 70 70 70 70 70
: 20 wt% nano-sized TCP-FA + 50 wt% barium glass, Group 5 : 25 wt% nano-sized TCP-FA + 45 wt% barium glass (Table 1).
Table 1. Filler mass fraction in the composite resin (%)
The filler of each group was added into resin matrix and mixed on vibrator. Then the mixture were placed in sonicator (Branson 2210R-DTH, Branson, USA) in the dark environment for 15 minutes.

2. Methods
2.1 Characteristic analysis of synthesis powder
2.1.1 XRD analysis
Phase analysis and structural features of TCP-FA were evaluated by X-ray diffractometer (XRD, Ultima IV, Rigaku, Japan). The diffractometer was operated at 40 kV and 30 mA. All measurements were performed within a diffraction range of 20 ° 2 70 ° at scan speed of 1 ° min -1.
The XRD patterns were compared to standards compiled by the Joint Committe on Powder Diffraction and Standards (JCPDS), which involved card #015-0876 for FA, #018-0303 for Ca3(PO4)2xH2O, #09-0169 for -TCP, #01-1079 for Ca(OH)2, #01-1274 for CaF2, and #09-0080 for CaHPO4.
2.1.2 Scanning electronic microscopy (SEM) analysis
The microstructure such as morphological feature and agglomerate distribution of TCP, FA and TCP-FA were observed on a field emission scanning electronic microscopy (FE-SEM, JSM-6701F, JEOL, Japan).
Prior to SEM analysis, each powder coated with a thin layer of gold with a PVD apparatus (sputter coater 108auto, Cressington Scientific instruments Ltd., England). The accelerating voltage and vacuum control were 5.0 kV and fully automated respectively.
2.1.3 Transmission electron microscope (TEM) analysis
The size and morphology of TCP, FA and TCP-FA were observed on a transmission electron microscope (TEM, JEM-1011, JEOL, Japan) that operated at the acceleration voltage of 100 kV.

Before measurement, each powder was diluted in ethanol and was placed sonicator for 15 min in order to prevent aggregation. A dilute suspension of the each powder collected on carbon-coated copper grids and allowed to dry for 3 min.
2.2 Measurement of resistance of demineralization
2.2.1 Preparation of specimen
Bovine teeth were used for measurement of resistance of demineralization and were stored in distilled water at 4 until preparation of specimens. Bovine teeth were sectioned to crown and root with diamond disk (D+Z, Germany) and low speed handpiece and crown were used. Teeth block were prepared 5 X 8 mm size on flat surface of crown and then debris were removed mechanically with hand and ultrasonic scaler. Enamel surface of teeth block were cleaned with a prophylaxis paste without fluoride and were treated ultrasonically in distilled water for 30 minutes.
Teeth block were embedded in acrylic resin block of 20 X 11 X 8 mm (length, width, height respectively) with oval hole (longer side : 12 mm, shorter side : 8 mm) and then were ground using a automatic polished machine (ECOMET , Buehler, USA) with 200, 400, 800, 1200 and 2000 grit silicone carbide paper under wet conditions to expose flat enamel surfaces. Finally enamel surface were polished with oxide alumina powder (Junsei chemical Co., Ltd., Japan) and low speed handpiece and were cleaned using ultrasonic machine (Branson 2210R-DTH, Branson, USA) for 30 minutes to remove residue. Enamel surface were rinsed with distilled water and then were stored at 4 until test.
Prepared specimen with dentin exposures, any cracks and defects were excluded and specimens with Vickers hardness value between 200 and 300 through Vickers hardness test (DMH-2, Matsuzawaseiki, Japan) were used. Total one hundred specimens were obtained and were divided randomly into 5 groups of 20 each.
To measure of resistance of demineralization, rectangular cavities with a length of 4 mm, a width of 2 mm and a depth of 2 mm were prepared using a #330 bur and high speed handpiece with water coolant. Identical

sized polyester window film (2 X 4 X 2 mm) were attached on the specimen to reduce size error between cavities. Margin of cavities were finished with fissure bur. Cavities were rinsed with running distilled water and were dried.
Composite resin were placed into the cavities, pressed with polyester film and glass slide and cured with a light-curing unit (Bluephase, Ivoclar Vivadent Ltd., Liechtenstein) for 60 sec. The restored surface were polished flat using a automatic polished machine (ECOMET ,Buehler, USA) with 2000 grit silicon carbide paper.
The half of surface were painted thinly with nail varnish 2 to 3 times and then were stored in distilled water at 37 until test.
2.2.2 Process of demineralization
2.2.2.1 Preparation of Demineralization Solution
Demineralization solution was prepared in accordance with study of Kim (2011) and Lee et al. (2012).
1.0 M concentration of lactic acid that 88.5 mL of 85 % lactic acid solution (Sigma-Aldrich, Germany) was mixed with distilled water to be volume of 1000 mL and was aged in water bath (BW-05E, JEIOTECH Co. Ltd., Korea) at 90 for 8 hours was prepared.
10 g of carbopol (Carbopol ETD 2050 polymer, Noveon Inc., USA) was added to 900 mL of distilled water and was stirred without heating for 24 hours. Then 50 % of NaOH solution was added to carbopol solution on stirrer device (WiseStir MS-20A, Daihan Scientific Co., Ltd, Korea) until pH 7.0 (Orion 4 star, Thermo Electron corporation, USA).
50 cc of 1.0 M lactic acid solution was mixed with distilled water to be volume of 500 mL and was adjusted pH with 50 % of NaOH solution (pH 4.8). Then 1.5 g of tribasic calcium phosphate (HAP,

Sigma-Aldrich, Germany) was added to them and was adjusted with 50 % of HCl for 30 minutes to maintain pH 4.8. After 30 minutes, solution was filtered with vacuum filtration device and 50 cc of 1M lactic acid and 500 cc of 1 % carbopol were added to filtered solution. Distilled water was filled to be volume of 1000 cc and was adjusted to pH 4.8 with 50 % of NaOH.
Figure 3. Making process of demineralization solution.a. 1 % carbopol solution was adjusted to pH 7.0b. 1 M of lactic acid was adjusted to pH 4.8.c. 1.5 g of HAP was added to (b) solution and was adjusted pH for
30 minutes to maintain pH 4.8. d. Solution was filtered with vacuum filtration device.
2.2.2.2 Demineralization of specimen
The specimens were rinsed with distilled water and were dried. The specimens were individually immersed in plastic container containing 5 mL demineralization solution. 10 specimens per each group were stored at 37 for 24 hours and 10 specimens per each group were stored at 37 for 48 hours
After demineralization of specimens, specimens were rinsed with distilled water for 3 minutes and were dried. Then nail varnish on specimens were removed with acetone.

2.2.3 Measurement of demineralization resistance
2.2.3.1 Microhardness test
Microhardness of Demineralization surface and sound surface were measured using microhardness testing machine (DMH-2, Matsuzawaseiki, Japan) attached vickers diamond indenter.
Vickers diamond indenter was placed inner 1 mm around restoration and were pressed vertically with load of 200 g for 10 sec. The mean of four part (upper, lower, right left) was calculated.
The percentage of surface microhardness reduction (SMHR) was calculated using the following equation :
%SMHR = 100 (VHNsound - VHNdemin)/ VHNsound
where VHNsound is Vickers hardness number of sound surface and VHNdemin is Vickers hardness number of demineralization surface.
2.2.3.2 Quantitative Laser Fluorescence test
The mineral loss in demineralization specimens was evaluated by fluorescence loss values using a quantitative laser fluorescence-digital device (QLF-D Biluminator TM, Inspektor research system BV, Amsterdam, Netherlands, Figure 4).
The specimens were placed on flat floor and were focused on the five-folder magnification. Then QLF-D examinations were performed in the dark environment.
After examination, identical size window was designated on image to reduce error of measurement and F value as fluorescence loss values of demineralized surface compared to sound surface were recorded using

the QA2 program (version 1.23, Inspektor research system BV, Netherlans).
Figure 4. The QLF-D. This device (A) is based on a full-sensor SLR camera epuipped with an illumination tube with white and blue light-emitting diodes positioned in a ring around the lens opening(B) (Lee et al., 2013).

2.3. Acid neutralizing properties
2.3.1 Preparation of specimen
Stainless steel mould with 2 mm of length, 25 mm of width and 2 mm of height was placed on polyester film on slide glass (Marienfeld, Paul marienfeld GmbH & Co.KG. Germany) and was filled with materials as evenly as possible without bubbles or voids in the mould with a slight excess.
Second film was placed on the mould and covered this with second slide glass. Restoration in the mould were light-cured using a light-curing unit (bluephase, Ivoclar Vivadent Ltd., Liechtenstein). A light-curing unit was moved and was cured overlapping from the section to another section for each 40 sec until entire length of the specimens has been cured. This procedure was repeated on the other side of specimens. After light-curing, The specimens were removed form the mould and carefully removed any were abraded with 600 grit silicone carbide paper (Daesung, Korea). Twelve specimens were prepared in each group.
2.3.2 Process of acid neutralizing
A sodium chloride (NaCl, Ducsan pure chemicals co. Ltd, Korea) solution (133 mmol/L) was buffered to pH 4.0 with lactic acid (Sigma-Aldrich, Germany).
Following previous studies (Geurtsen et al., 1999), three specimens were immersed in 15 mL solution, yielding a specimen surface/solution of 42.4 /mL.
As soon as the specimens were immersed in the acid solution (pH 4.0), the pH of the solution was monitored with pH meter (Neomet pH-220L, HY co., Korea). The pH meter had been calibrated at pH 4.01,

pH 7.00 and pH 10.00 before use. The pH was recorded versus minute which was continued for 90 minutes. This procedure was repeated 3 times using new specimens.
2.3.3 Measurement of acid neutralizing
To identify acid neutralizing properties, The pH change of solution per minute were measured. And to measure raising time of pH value in solution, the time required to raise from pH 4.0 to pH 5.5 was investigated from data which was obtained previous pH change test.

2.4 Mechanical properties
2.4.1 Preparation of specimen
To measure mechanical properties, preparation of specimens were performed according to ISO 4049 standard (2009). Stainless steel mould with 2 mm of length, 25 mm of width and 2 mm of height was placed on polyester film on slide glass (Marienfeld, Paul marienfeld GmbH & Co.KG. Germany) and was filled with experimental materials as evenly as possible without bubbles or voids in the mould with a slight excess. Second film was placed on the mould and covered this with second slide glass.
Restoration in the mould were light-cured using a light-curing unit (bluephase, Ivoclar Vivadent Ltd., Liechtenstein). A light-curing unit was moved and was cured overlapping from the section to another section for each 40 sec until entire length of the specimens has been cured. This procedure was repeated on the other side of specimens.
After light-curing, The specimens were removed form the mould and carefully removed any were abraded with 400 grit silicone carbide paper (Daesung, Korea). Ten specimens were prepared in each group.
2.4.2 Process of flexural strength testing
The width and height of specimens were measured at its centre to an accuracy of 0.01 mm. After the specimen were transferred to the flexural strength testing apparatus (Instron 3366, Instron, USA), A load was applied to the specimen at a cross-head speed of 1 mm/min until the specimens were fractured. The maximum load were recorded and the flexural strength ( ) was calculated using the following equation :

= 3Fl / 2bh2
Where F is the maximum load exerted on the specimen l is the distance between the supports (20 mm) b is the width of the specimen h is the height of the specimen
After test were repeated on the nine other specimens, the mean of ten flexural strength value was calculated in each group.

2.5 Physical Properties
2.5.1 Preparation of specimen
Water sorption and solubility of composite resin were performed according to ISO 4049 standard (2009).
To prepare specimen, the mould with 15.0 mm of diameter and 1.0 mm of height was placed on polyester film on slide glass. The mould was filled with composite resin of each group as evenly as possible without bubbles or voids with a slight excess. Second film was placed on the mould and covered this with second slide glass. Restoration in the mould were light-cured using a light-curing unit (bluephase, Ivoclar Vivadent Ltd., Liechtenstein). A light-curing unit was moved and was cured overlapping from the section to another section for each 20 sec until entire whole specimens has been cured. This procedure was repeated on the other side of specimens. After light-curing, The specimens were carefully removed from the mould and were polished with 1200 grit silicone carbide paper (Daesung, Korea). Ten specimens were prepared in each group.
2.5.2 Process of water sorption and solubility test
All specimens were stored in incubator (ILP-02, JEIOTECH CO. Ltd., Korea) maintained at (37±1) for 22 hours. Then specimen were transferred to another incubator maintained at (23±1) and were stored for 2 hours.
Specimens were weighted repeatedly using analytical balance (Eltra 84, Germany) with an accuracy of 0.1 mg until a constant mass (m1) was obtained.
After final drying, diameter and thickness of the specimens were measured using digital caliper with an accuracy of 0.01 mm and mean of

that were calculated by measuring two times and four times respectively. The volume (V) of specimen were calculated with the mean diameter and thickness.
The specimen was immersed in 10 mL of distilled water at (37±1) for 7 days. After 7 days, the specimens were removal from stored container and rinsed with distilled water, which were blotted away surface water until free from visible moisture waved in the air for 15 sec and weighed. This mass was recorded as m2.
After the weighing, specimens were transferred to incubator and weight of dried specimens were measured daily until a constant mass (m3) was obtained.
Water sorption (Wsp) and solubility (Wsl) of specimens were calculated using the following equations :
Wsp = (m2-m3) / V
Where m2 is the mass of the specimen after immersion in water for 7 days
m3 is the mass of the dried specimen V is the volume of the specimen
Wsl = (m1-m3) / V
Where m1 is the conditioned mass prior to immersion in water m3 is the mass of the dried specimen V is the volume of the specimen

2.6 Biological properties
2.6.1 Preparation of specimen
To prepare specimen for cytotocxicity, the mould with 15.0 mm of diameter and 1.0 mm of height was placed on polyester film on slide glass. The mould was filled with composite resin of each group as evenly as possible without bubbles or voids with a slight excess. Second film was placed on the mould and covered this with second slide glass. Restoration in the mould were light-cured using a light-curing unit (Bluephase, Ivoclar Vivadent Ltd., Liechtenstein). A light-curing unit was moved and was cured overlapping from the section to another section for each 20 sec until entire whole specimens has been cured. This procedure was repeated on the other side of specimens. After light-curing, The specimens were carefully removed from the mould and were polished with 1200 grit silicone carbide paper (Daesung, Korea). Six specimens were prepared in each group.
2.6.2 Process of cytotoxicity test
MTT (3-(4,5-dimethylithiazol-2-yl)-2,4-diphenyltetrazoliumbromid) assay which was utilized in order to measure cytotoxicity was performed according to ISO 10993-5 standard (2009). The specimens, the ratio of area to solution is about 3cm2 to mL
according to ISO 10993-12 standard (2012), were incubated in cell culture medium at 37 for 24 hours. Negative control was utilized serum free cell culture media under the same extraction condition as vehicle control.
1 x 10⁴/well of L929 cell dispensed 100 L culture medium into 96-well plate and were incubated for 24 hours. After 24 hours

incubation, culture medium were aspirated from the cells. 100 Lextract per well were added and were incubated at 37 for 24 hours. After 24 hours treatment, the culture medium were removed from the plates and were washed with PBS. After incubation were completed, 50
L of the MTT solution (Sigma-Aldrich, Germany) on 1mg/mL in phenol red free RPMI 1640 media (welgene, Korea) was added to each test well and the plates were further incubated at 37 for 2 hours. After 2 hours incubation, MTT solution was removed and 100 L of dimethyl sulfoxide (DMSO, Amresco, USA) were added in each well. This plate was put on the shaker for 30 minute. The absorbance were read at a 540 mn of wavelength using spectrophotometer (Epoch, Bioteck, USA).
The reduction of viability compared to the blank were calculated using the following equations :
Viability (%) = OD540e X 100OD540ob
where OD540e is the mean value of the measured optical density of the test
sample.OD540ob is the mean value of the measured optical density of blanks
2.6.3 Evaluation of cytotoxicity
Degree of cytotoxicity was evaluated applying standard criteria of Jung's study (2009).
The standard criteria was shown in Table 2.

%Viability Cytotoxicity grade
600 - 10030 - 600 - 30
None cytotoxicModerate cytotoxicSevere cytotoxic
Table 2. Grades of cytotoxicity corresponding to cell viability percentage
2.7 Statistical analysis
The all data of surface microhardness reduction, loss of fluorescence, acid neutralization, flexural strength, water sorption, solubility and cytotoxicity were analyzed with one-way ANOVA for the significant effects of the variables. Tukey's multiple comparison test was used to compare each groups. The significance level of all data was 0.05. The correlation between loss of fluorescence and surface microhardness reduction was analyzed with Pearson's correlation. The significance level of all data was 0.01. All analysis were tested using SPSS 12.0 program (SPSS Inc., USA).
. RESULTS
1. Characteristic analysis of synthesis powder
1.1 XRD analysis
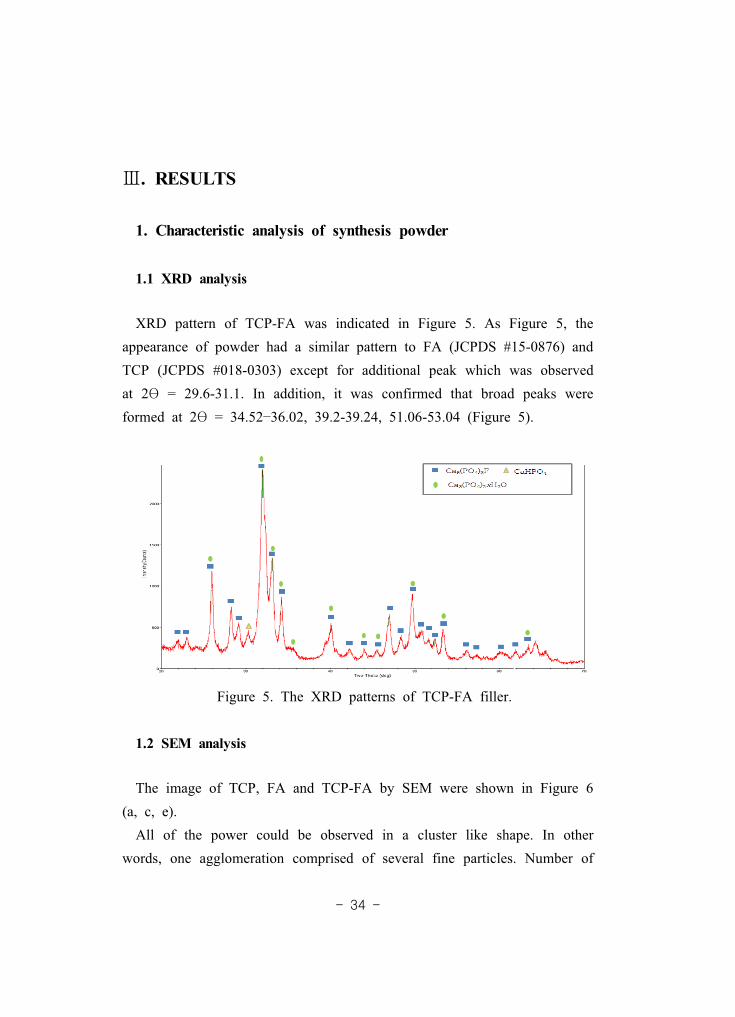
XRD pattern of TCP-FA was indicated in Figure 5. As Figure 5, the appearance of powder had a similar pattern to FA (JCPDS #15-0876) and TCP (JCPDS #018-0303) except for additional peak which was observed at 2 = 29.6-31.1. In addition, it was confirmed that broad peaks were formed at 2 = 34.52 36.02, 39.2-39.24, 51.06-53.04 (Figure 5).
Figure 5. The XRD patterns of TCP-FA filler.
1.2 SEM analysis
The image of TCP, FA and TCP-FA by SEM were shown in Figure 6 (a, c, e).
All of the power could be observed in a cluster like shape. In other words, one agglomeration comprised of several fine particles. Number of

particles forming agglomeration were irregular and their surfaces are not smooth. For this reason, it was difficult to reliability identify the morphological feature of each powder.
1.3 TEM analysis
The image of TCP, FA and TCP-FA by TEM were shown in Figure 6 (b, d, f).
The particles of all powder showed at high tendency toward agglomeration and number of particles did not possess regularity with on SEM image. However, in contrast with SEM, it was possible to partially identify morphological feature of particles. The TCP and FA particles were particularly spheroidal (6-b) and cubic (or rod) (6-d). That of TCP-FA were a mixture of features of TCP and FA (6-f).
Only particles which had a distinct boundary were chosen and measured for size. TCP particles size were 19.78±6.45 nm, FA particles
size were 26±7.55 nm.

Figure 6. SEM and TEM images of the TCP (a, b), FA (c, d), and
TCP-FA (e, f).

2. Analysis on resistance of demineralization
2.1. Evaluation of surface microhardness
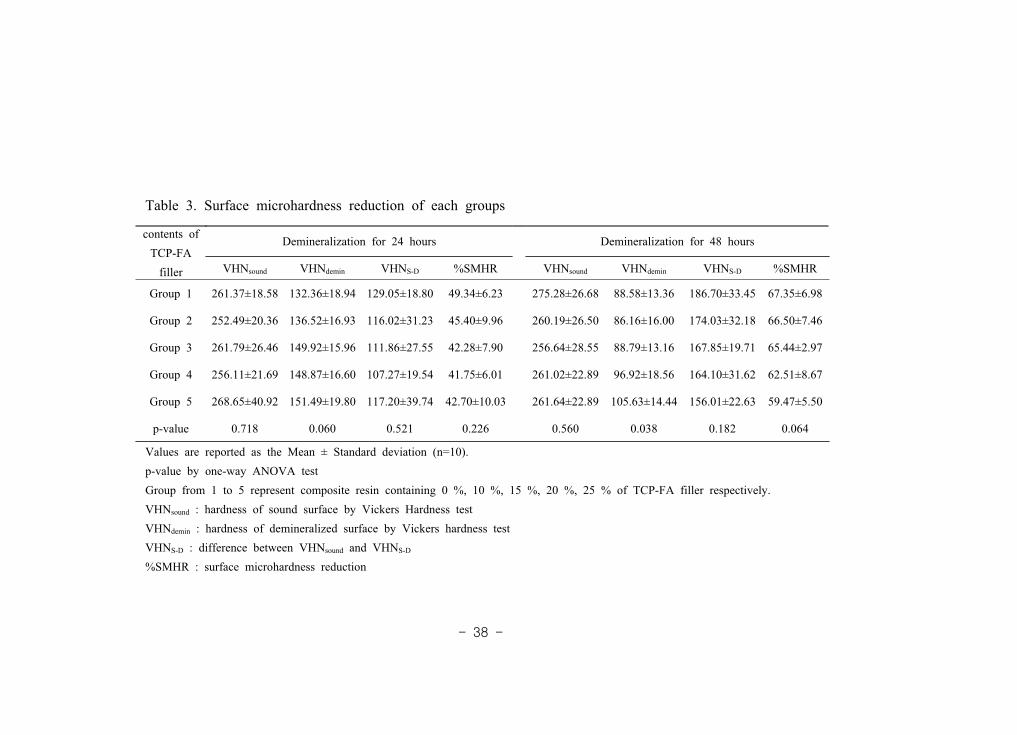
Surface microhardness reduction (%SMHR) of composite resin with addition of TCP-FA filler were shown in Table 3.
As a result of demineralization for 24 hours, Surface microhardness reduction (%SMHR) of Group 4 with 20 % of TCP-FA filler (41.75±6.01) was lowest among groups but there were not significant differences (p>0.05).
As result of demineralization for 48 hours, Surface microhardness reduction (%SMHR) of Group 5 with 25 % of TCP-FA filler (59.47±5.50) was lowest among groups but there were also no significant differences (p>0.05).
contents of TCP-FA
filler
Demineralization for 24 hours Demineralization for 48 hours
VHNsound VHNdemin VHNS-D %SMHR VHNsound VHNdemin VHNS-D %SMHR
Group 1 261.37±18.58 132.36±18.94 129.05±18.80 49.34±6.23 275.28±26.68 88.58±13.36 186.70±33.45 67.35±6.98
Group 2 252.49±20.36 136.52±16.93 116.02±31.23 45.40±9.96 260.19±26.50 86.16±16.00 174.03±32.18 66.50±7.46
Group 3 261.79±26.46 149.92±15.96 111.86±27.55 42.28±7.90 256.64±28.55 88.79±13.16 167.85±19.71 65.44±2.97
Group 4 256.11±21.69 148.87±16.60 107.27±19.54 41.75±6.01 261.02±22.89 96.92±18.56 164.10±31.62 62.51±8.67
Group 5 268.65±40.92 151.49±19.80 117.20±39.74 42.70±10.03 261.64±22.89 105.63±14.44 156.01±22.63 59.47±5.50
p-value 0.718 0.060 0.521 0.226 0.560 0.038 0.182 0.064
Table 3. Surface microhardness reduction of each groups
Values are reported as the Mean ± Standard deviation (n=10).p-value by one-way ANOVA testGroup from 1 to 5 represent composite resin containing 0 %, 10 %, 15 %, 20 %, 25 % of TCP-FA filler respectively.VHNsound : hardness of sound surface by Vickers Hardness testVHNdemin : hardness of demineralized surface by Vickers hardness testVHNS-D : difference between VHNsound and VHNS-D
%SMHR : surface microhardness reduction

2.2. Evaluation of Quantitative Laser Fluorescence (QLF-D)
In order to confirm resistance of initial demineralization of composite resin on addition of TCP-FA filler, F value (loss of fluorescence) of specimen was calculated and compared (Table 4 and Figure 7).
As result a result of demineralization for 24 hours, F value was significant different as on addition of TCP-FA filler (p<0.05), F value of Group 4 with 20 % of TCP-FA filler (10.12±1.49) was significantly lower than Group 1 without TCP-FA filler (13.21±2.07) (p<0.05).
As a result of demineralization for 48 hours, F value was also significantly different on addition of TCP-FA filler (p<0.05), F value of Group 5 with 25 % of TCP-FA filler (14.33±5.42) was significantly lower than Group 1 without TCP-FA filler (24.53±4.87) (p<0.05).
Table 4. Degree of fluorescence loss in each groups
contents of TCP-FA filler
n△F value after
demineralization for 24 hours
△F value after demineralization for 48
hoursGroup 1 10 13.21±2.07a 24.53±4.87a
Group 2 10 12.05±1.88ab 23.39±8.24ab
Group 3 10 11.72±2.16ab 18.66±6.44ab
Group 4 10 10.12±1.49b 18.40±7.87ab
Group 5 10 10.97±1.80ab 14.33±5.42b
Values are reported as the Mean ± Standard deviation.p value < 0.05 by one-way ANOVA testa b The same characters are not significant by Tukey's mutilple comparison at =0.05Group from 1 to 5 represent composite resin containing 0 %, 10 %, 15 %, 20 %, 25 % of TCP-FA filler respectively.△F : loss of fluorescence
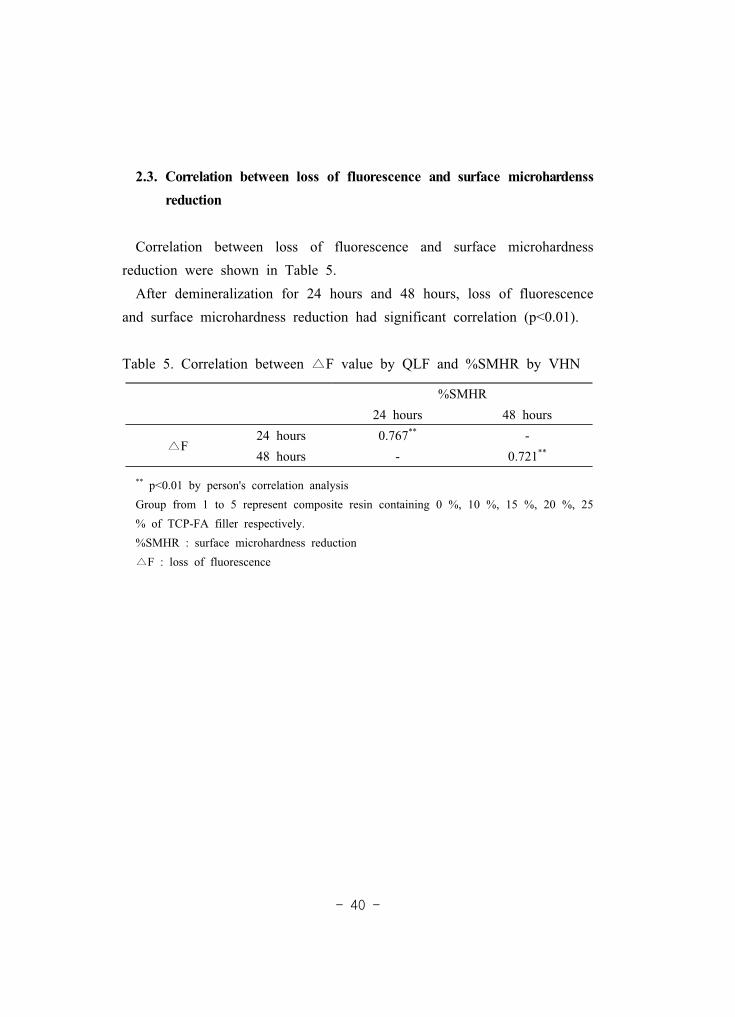
2.3. Correlation between loss of fluorescence and surface microhardenss reduction
Correlation between loss of fluorescence and surface microhardness reduction were shown in Table 5.
After demineralization for 24 hours and 48 hours, loss of fluorescence and surface microhardness reduction had significant correlation (p<0.01).
Table 5. Correlation between F value by QLF and %SMHR by VHN
%SMHR24 hours 48 hours
F24 hours 0.767** -48 hours - 0.721**
** p<0.01 by person's correlation analysisGroup from 1 to 5 represent composite resin containing 0 %, 10 %, 15 %, 20 %, 25 % of TCP-FA filler respectively.%SMHR : surface microhardness reduction
F : loss of fluorescence

Group 1
Group 2
Group 3
Group 4
Group 5
24 hours demineralization 48 hours demineralization
Figure 7. QLF images of each groups after 24 hours and 48 hours demineralization.

3. Acid neutralizing properties
3.1 pH change of the solution by time
Figure 8 was shown pH change of solution per minute. pH change per minute increased rapidly with the increase in content of TCP-FA filler.
pH change of Group 5 showed an increase of the highest magnitude in the shortest time among all groups, while that of Group 1 was hardly changed (Figure 8).
There were no significant difference among groups for 1 minute (p>0.05), but after 2 minutes, there were significant differences of pH change in order Group 5 > Group 4 > Group 3 > Group 2 > Group1 (p<0.05). The result by Tukey HSD test showed that pH change of Group 4 and Group 5 were significant higher than Group 1 from 2 to 90 minutes after immersion, that of Group 3 and Group 4 were significant higher than Group 1 from 10 and 12 after immersion respectively (p<0.05). Though these difference between groups were irregularly shown up to 63 minutes, all groups was completely shown a significant difference from 64 to 90 minutes after immersion (p<0.05, Table 6).

Figure 8. pH change of pH 4.0 solution by time. Values are reported as the Mean ± Standard deviation (n=4).
p value < 0.05 by one-way ANOVA test Group from 1 to 5 represent composite resin containing 0 %,
10 %, 15 %, 20 %, 25 % of TCP-FA filler respectively.

Table 6. Difference of each groups on pH value of pH 4.0 from 1 to 90 minutes
min Group 1 Group 2 Group 3 Group 4 Group 5
2 min 4.04±0.18a 4.15±0.67ab 4.16±0.95ab 4.28±0.69b 4.34±0.13b
10 min 4.05±0.22a 4.25±0.10ab 4.30±0.17b 4.49±0.12b 4.86±0.87c
12 min 4.05±0.18a 4.30±0.11b 4.37±0.13bc 4.56±0.13cd 4.91±0.13d
15 min 4.05±0.18a 4.32±0.13ab 4.42±0.12bc 4.63±0.15c 5.04±0.17d
30 min 4.06±0.03a 4.38±0.13ab 4.59±0.21b 5.17±0.04c 5.65±0.20d
45 min 4.07±0.02a 4.41±0.13ab 4.70±0.23b 5.36±0.13c 5.91±0.26d
60 min 4.08±0.03a 4.45±0.14b 4.79±0.20c 5.47±0.14d 6.20±0.17e
64 min 4.08±0.03a 4.46±0.14b 4.79±0.18c 5.49±0.15d 6.26±0.17e
75 min 4.08±0.03a 4.50±0.15b 4.86±0.21c 5.58±0.15d 6.39±0.09e
90 min 4.08±0.03a 4.53±0.15b 5.01±0.27c 5.67±0.14d 6.56±0.19e
Values are reported as the Mean ± Standard deviation. (n=4). p value < 0.05 by one-way ANOVA test. a-e The same characters are not significant by Tukey's mutilple comparison at =0.05. Group from 1 to 5 represent composite resin containing 0 %, 10 %, 15 %, 20 %, 25
% of TCP-FA filler respectively. Table 6 was showed the value every 5 minutes for convenience.
3.2 Time to raise pH from 4 to 5.5
Figure 9 showed the time taken for the composite to increase the solution's pH from 4 to 5.5.
Time to reach pH 5.5 in Group 5 (26.5±7.19) was more rapid than in Group 4 (57±16) (p<0.05). In contrast, Group 3, Group 2 and Group 1 never reached pH of 5.5. until 90 minutes.

Figure 9. Time to raise the solution pH from 4.0 to 5.5. The rod represent the mean of time to raise the solution' pH from 4.0 to 5.5 of 4th in each groups and error bar represents the standard deviation of the mean values (p<0.05 by independent two samples t-test).
Horizontal bur represent never reached pH 5.5 until 90 minutes.
Group from 1 to 5 represent composite resin containing 0 %,
10 %, 15 %, 20 %, 25 % of TCP-FA filler respectively.

4. Mechanical properties
4.1 Flexural strength evaluation
Figure 10 were shown the results of 3-point flexural strength of composite resin used in this study. On addition of TCP-FA filler, flexural strength values among groups were significantly different (p<0.05). Increasing of contents of TCP-FA filler, resulted in decreased flexural strength values in order Group 5 (71.39±24.95) > Group 4 (89.28±15.09) > Group 3 (98.28±19.05) > Group 2 (102.50±18.58) > Group 1 (115.43±29.67). The flexural strength value of Group 5 was lower than Group 1, Group 2 and Group 3, while there were no difference among groups except Group 5 (p>0.05).

Figure 10. 3-point flexural strength values of composite resin with TCP-FA filler contents. The rod represents the mean of flexural strength values of 10 specimens in each groups and error bar represents the standard deviation of the mean values.
Group from 1 to 5 represent composite resin containing 0 %, 10 %, 15 %, 20 %, 25 % of TCP-FA filler respectively.

5. Physical properties
Water sorption and solubility were measured in order to evaluate physical properties (Table 7).
Table 7. Comparison of water sorption and solubility between each groups
Group 1 Group 2 Group 3 Group 4 Group 5
water sorption
18.02±2.82a 11.76±1.20b 17.18±3.13a 17.84±4.50a 24.43±2.54c
solubility 3.89±1.08a 5.00±1.32ab 4.80±075ab 5.14±0.98ab 5.80±1.98b
Values are reported as the Mean ± Standard deviation (n=10).p value < 0.05 by one-way ANOVA test.a-c The same characters are not significant by Tukey's mutilple comparison at =0.05.Group from 1 to 5 represent composite resin containing 0 %, 10 %, 15 %, 20 %, 25 % of TCP-FA filler respectively.
5.1 Water sorption evaluation
The result of water sorption were shown in Figure 11. Water sorption of all groups satisfied requirement ( 40 / ) of ISO 4049 standard (2009). There were significant differences of water sorption, among all groups (p<0.05). Water sorption of Group 5 (24.43±2.54) were greatest and that of Group 2 (11.76±1.20) was lowest among all groups (p<0.05).

Figure 11. Water sorption values of composite resin with TCP-FA filler contents. The rod represents the mean of water sorption of 10 specimens in each groups and error bar represents the standard deviation of the mean values.
Group from 1 to 5 represent composite resin containing 0 %, 10 %, 15 %, 20 %, 25 % of TCP-FA filler respectively.
5.2 Solubility evaluation
The result of solubility were shown in Figure 12. Solubility of all groups satisfied requirement ( 7.5 / ) of ISO 4049 standard (2009). There were significant differences in solubility among all groups (p<0.05). Solubility of Group 5 (5.80±1.98) was greatest while that of Group 1 (3.89±1.08) was lowest among all groups (p<0.05).

Figure 12. Solubility values of composite resin with TCP-FA filler contents. The rod represents the mean of solubility of 10 specimens in each groups and error bar represents the standard deviation of the mean values.
Group from 1 to 5 represent composite resin containing 0 %, 10 %, 15 %, 20 %, 25 % of TCP-FA filler respectively. Bar represents.

6. Biological properties
6.1 Cytotoxicity evaluation
The result of cytotoxicity were shown in Table 8 and Figure 13, 14. Optical density in undiluted solution were differences among groups
(p<0.05). Optical density of Group 5 was lowest among groups. In contrast optical density in diluted solution by 50 % were not different among groups.
%Viability in undiluted solution were significant differences among groups (p<0.05). Group 5 (0.64±0.02) showed lower %Viability than Control group (1.56±0.11) (p<0.05). Whereas %Viability in diluted solution by 50 % were not different among groups (p>0.05).
The result of assessment of cytotoxicity based on %Viability was shown in Table 9. %Viability in all groups except Group 5 was more than 60 %. Thus it was assessed that there was no cytotoxicity in all groups, except Group 5. Cytotoxicity of Group 5 in undiluted solution was moderate while that there was no cytotixicity in diluted solution by 50 %.

Table 8. Optical density of each groups according to concentration-dilution
optical density(undiluted solution)
optical density(diluted solution by 50 %)
Control 1.56±0.11a 1.56±0.11
Group 1 1.14±0.00ab 1.43±0.07
Group 2 1.02±0.27ab 1.33±0.27
Group 3 1.01±0.19ab 1.26±0.25
Group 4 1.06±0.32ab 1.29±0.33
Group 5 0.64±0.02b 1.12±0.11
p-value 0.043 0.480
Values are reported as the Mean±Standard deviation (n=6).p-value <0.05 by one-way ANOVA test.
a-b The same characters are not significant by Tukey's multiple comparison at =0.05 Group from 1 to 5 represent composite resin containing 0 %, 10 %, 15 %, 20 %, 25
% of TCP-FA filler respectively.
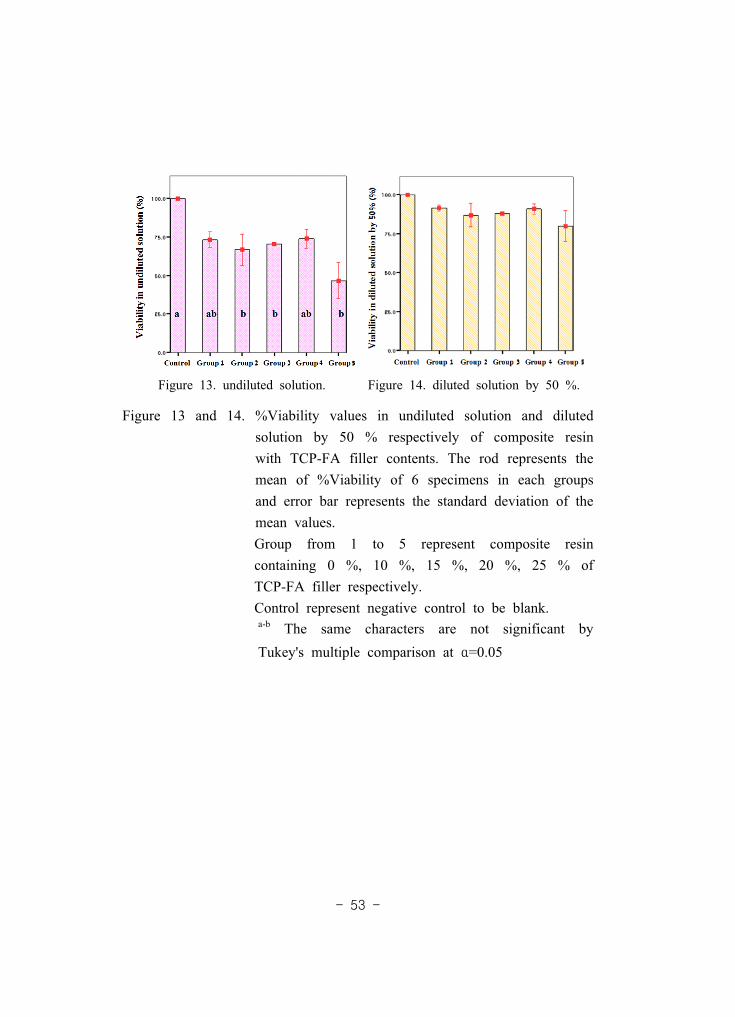
Figure 13. undiluted solution. Figure 14. diluted solution by 50 %.
Figure 13 and 14. %Viability values in undiluted solution and diluted solution by 50 % respectively of composite resin with TCP-FA filler contents. The rod represents the mean of %Viability of 6 specimens in each groups and error bar represents the standard deviation of the mean values.
Group from 1 to 5 represent composite resin containing 0 %, 10 %, 15 %, 20 %, 25 % of TCP-FA filler respectively.
Control represent negative control to be blank. a-b The same characters are not significant by
Tukey's multiple comparison at =0.05

Table 9. Evaluation of cytotoxicity
% Viability(undiluted solution)
% Viability(diluted solution by 50 %)
Cytotoxicity
Group 1 73.1 91.4 Not
Group 2 66.7 86.9 Not
Group 3 70.5 87.8 Not
Group 4 73.8 90.8 Not
Group 5 46.7 79.9 *
* Cytotoxicity of Group 5 is moderate cytotoxic in undiluted solution and non-cytotoxic in diluted solution by 50 %.

. DISCUSSION
Substance has been widely synthesized by multiple techniques such as precipitation (Zhu et al., 2009; Eslami et al., 2009), spray-drying (Cheng et al., 2012), sol-gel (Lee et al., 2011), hydrothermal (Rodriguez et al.,2003), double deposition (Somarani et al., 2005) and mechanochemical methods (Kahrizsangi et al., 2011; Kahrizsangi et al., 2010; Tabrizi and Fahami, 2013b).
Mechanochemical methods have some advantages in that melting is not necessary and that the powders are nanocrystalline. Moreover the mechanochemical process can be performed under wet or dry conditions (Kahrizsangi et al., 2011).
Mechanochemical process under wet condition is complicated by the handling of the materials and the operation of the apparatus with a resultant poor reproducibility. The composition of the resulting product is greatly affected by even a slight difference in reaction conditions and the time needed for obtaining the substance is prolonged thus the cost of processing becomes higher, Under dry conditions on the other hand, the reproducibility is higher, with a lower processing cost. Therefore the dry process is more suitable than the wet process, for substance synthesis (Rhee, 2002). For this reason, TCP and FA were synthesized using a dry mechanochemical process.
Anhydrous dicalcium phosphate, calcium hydroxide and calcium fluoride were used for synthesis of FA. Sintering did not obtain amorphous FA, as shown in study of Kahrizsangi et al. (2011).
There have been various studies of milling time. Kahrizsangi et al.(2011) obtained FA through milling for 60 hours and 600 rpm of rotational speed. In another study by Kahrizsangi et al. (2010) starting materials were milled for 2, 5, 10, 15, 20 hours and 600 rpm of
rotational speed. The result demonstrated that FA was successfully performed through the mentioned reaction after 5 hours of milling and the purity of particle which were milled for 15 and 20 hours was better than those of 5 and 10 hours. Also Nikcevic et al. (2004) reported that the result from milling between 1 to 9 hours under 230 rpm of rotational speed indicated defined peaks of FA, for the sample milled for 5 hours. Clear resolution of all characteristic diffraction peaks for FA were seen in the sample milled for 6 hours. Further increase in milling time up to 9 hours resulted in a further increase in crystalline order of the FA phase.
In accordance to previous studies, a pilot test was performed for 10, 20 and 60 hours to synthesize FA. The sample milled for 20 hours, corresponded with previous studies while samples milled for 10 and 60 hours did not corresponded. As a result of the pilot test, milling was performed for 20 hours in order to synthesize of FA.
In accordance with Tabrizi et al. (2013b) study, pilot test was performed for 10 hours in order to synthesize TCP. The sample corresponded with that of the their study. Milling time was performed as in the pilot test, based on the results obtained from the pilot test.: furthermore, the same method of the pilot test was applied in this study.
TCP to FA ratio was 6: 4. There have been reports that optimal values of Young's modulus and shear modulus were obtained when 40 % of FA was added to TCP (Bouslama et al., 2013), but rupture strength was decreased when 40 % more of FA was added to TCP (Bouslama et al.,2010).
According to whether silane-treated or not, there is a difference in ion release. If filler are treated with silane, the bond between resin matrix and filler is more stronger and mixing them is more easier. However treatment of silane inhibit infiltration of moisture and restrict ion release. Furthermore anticariogenic effect is decreased (Park, 2010). The study which measured Ca and PO4 ion release after adding respectively
silane-treated dicalcium phosphate (DCPA) and silane-untreated DCPA to composite resin showed that composite resin which had added silane-untreated filler appear to have higher ion release (Xu et al., 2007). For that reason, fabricated nano-sized TCP and FA powder (TCP-FA) was not treated with silane in this study.
Barium glass was used as a co-filler because it is a typical dental glass filler (Xu et al., 2011). The reason why the amount of TCP-FA filler added to composite resin was limited, is that at the maximum 25 % it was difficult to mix constituent. Xu et al. (2011) designed their study such that the total filler mass fraction of groups which had added nano-sized amorphous calcium phosphate (NACP) of < 20 % was 75 %, while that which had added NACP of > 20 % was 70%. This was because with 20 % NACP, the paste was relatively dry at 75 % total filler level.
In order to increase crystalline, thermal process is performed at 600 ~ 1100 after synthesis (Kahrizsangi et al., 2011; Eslami et al., 2009; Tabrizi and Fahami, 2013a; Tabrizi and Fahami, 2013b; Choi and Kumta, 2007). After the thermal process, the particle is transformed from amorphous phase into the crystalline phase, thus leading to the production of high crystalline filler (Choi and Kumta, 2007). Aaptite phase with high crystallinity has lower activity and solubility (Eslami et al., 2009). However in this study, the thermal process was not performed in order to synthesize of nano-sized amorphous filler which has high ion release, increase resistance of demineralization, neutralize acid and prevent dental caries.
The major peaks observed in the XRD pattern of synthesized powder were similar to FA and TCP except for the additional peak which was observed between 2 = 29.6-31.1. Additional peak was attributed to CaHPO4 from the starting materials. Broadened peaks were partially confirmed in some section (Figure 5).

These result agreed with some previous studies that the used mechanochemical methods (Kahrizsangi et al., 2011; Tabrizi and Fahami, 2013b). Kahrizsangi et al. (2011) synthesized FA from various starting materials using mechanochemical method. In their study, the peak of CaHPO4 was observed in the group which was used same materials as in this study, and broad peaks were partially confirmed in the group which were not sintered. They have reported that synthesized sample exhibited poor crystallinity such as deformation in the structure of FA due to Ca-lead 'amorphousity' (Kahrizsangi et al., 2011). Tabrizi and Fahami (2013a) have reported that the sample milled for 10 hours showed a high level of overlapping range of all scan data, particularly in the range of 25° 2 55°. This behavior is attributed to the formation of the low crystalline structure of amorphous tricalcium phsophate (ATPC) as shown in the XRD pattern. Also this crystalline phase reached around 22 % while these increased and reached about 72 % after annealing. Crystallization of amorphous phase occurred during heating in the range of 900-1100 . This behavior led to the formation of highly crystalline
-TCP (Tabrizi and Fahami, 2013a). SEM and TEM was applied to confirm the morphological feature,
agglomerated distribution and particle size of synthesized TCP and FA respectively. From SEM and TEM images, it can be seen that the synthesized powder had a high tendency to agglomerate with a large number of small particles in the agglomerate (Figure 6). This may be attributed to the inter-particular coalescence under mechanical activation. Coalescence may occurred by collision of two adjacent primary particles that share a common crystallographic orientation. Two primary particles attach to each other and combine into a secondary one repeatedly. As a result, a large complex is formed (Tabrizi and Fahami, 2013b).
TCP and FA had a spheroidal-like and rod-like (cubic-like) morphology respectively. TCP-FA showed tangled shape. This result correspond with
Eslami et al. (2009) study and Tabrizi & Fahami (2013b) study (Figure 6-b, d, f).
Particle size affect on ion release. In smaller sized particles, the surface of particle is greater and results in higher ion release (Arcis et al., 2002; Huang et al., 2003). Some studies reported that the nano-sized particle was obtained by mechanochemical method (Kahrizsangi et al., 2011; Eslami et al., 2009). In current study, mean particle size of TCP and FA were about 26 nm and 20 nm respectively (Figure 6-b, d). This result less than or corresponded with previous studies (Kahrizsangi et al., 2011; Eslami et al., 2009). As a result, with mechanochemical method is possible to obtain nano-sized crystal structure.
In this study, specimens were artificially demineralized in demineralization solution for 24 hours and 48 hours in order to confirm resistance on demineralization of composite resin containing TCP-FA filler.
Various time for demineralization were shown in previous studies. Kim et al. (2008), Kim et al. (2009), Kwon et al. (2010), Hong et al. (2008), Choi et al. (2008) and You and Kim (2012) had demineralized specimen for 24 hours (1 day), 48 hours (2 days), 72 hours (3 days), 96 hours (4 days), 168 hours (7 days), and 336 hours (14 days) respectively. In this study, a part of the specimens were demineralized for 24 hours and the rest were demineralizaed for 48 hours in order to assess resistance to initial demineralization.
Resistance to demineralization is usually measured and analyzed by various devices after forming lesion on a sound tooth artificially (Kim etal., 2009; Kwon et al., 2010; Hong et al., 2008; Yoon et al., 2008). Vickers hardness (VHN) test is used to measure change of surface (VHN) (Kim et al., 2008; , Kim et al., 2010), and confocal laser scanning microscope (CLSM) (Lee, 2011; Youn et al., 2005), cross sectional micro hardness (CSMH) (Kim et al., 2009) or polarization

microscope (Kim et al., 2010) are used to measure depth of lesion. CLSM particularly is used to measure not only depth of lesion but also content and loss of mineral. Transversal microradiography (TMR) is used to measure depth of lesion and loss of mineral (Lee et al., 2004). Atomic force microscopy is also used to measure roughness of surface (Wang et al., 2012). Plasma light is used to measure optical density (Yoon, 2008). Scanning electronic microscope (SEM) is sued to observe phase of surface (Kim et al., 2009; Wang et al., 2012).
These measurement methods are difficult to apply and to quantify on clinical trial since they are required to progress in vitro (Shen et al.,2001). TMR is a well known gold standard because its sensitivity and specificity are excellent (Zero., 1999). However it has some disadvantages that it not only requires time and effort but also destroys specimen. For this reason, it is unsuitable for monitoring in the long term (Song et al.,2010). Therefore methods that detect and quantify demineralization of enamel, as well as provide longevous monitering are needed. Quantitative light-induced fluorescence (QLF) can serve these functions. QLF is based on optical and visible light evaluating initial demineralization of enamel, it is a system of detection and quantification. The theoretical basis of this method is that enamel has fluorescence itself, demineralized enamel had reduced fluorescence. There are some advantages to the QLF system. As the difference of fluorescence intensity, and degree of demineralization is quantified, it is also possible to monitor and evaluate long term activity of lesion (Pretty et al., 2003), In addition, it is possible to easily measure without destroying specimen. It is convenient for analysis due to the use of a personally owned program. Aljehani et al. (2004) utilized QLF and DIAGNOdent in order to quantify of white spot lesions adjacent to fixed orthodontic appliances and to determine inter-rater agreement. The correlation between histopathology, which provide the gold standards, and DIAGNOdent and QLF were measured and compared.
The results were showed that correlation between QLF and histopathology has higher than the correlation between DIAGNOdent and histopathology in deep of lesion, loss of mineral and inter-rater agreement. Thus they reported that QLF is suitable to quantify carious lesions. Song et al.(2010) measured effect of anticariogenic products on carbonated beverage by QLF and confirmed correlation between QLF and microhardness and erosion. The result showed high correlation. They reported that QLF was useful to observe initial erosion. Particularly QLF-D was developed to make up for existing weakness of QLF which has a limit on obtaining images using intra oral camera. It is excellent in resolution due to the use of Digital single-lens reflex camera, easy to take a photograph and reproducibility of position is favorable. Thus it is easy to compare change of lesion and possible to observe the whole tooth simultaneously (You and Kim, 2012). For this reason, QLF-D was used in this study to measure the loss of fluorescence. Correlation with surface microhardness reduction was also confirmed.
The result of QLF measurement after demineralization for 24 hours showed that loss of fluorescence in Group 4 adding 20 % of TCP-FA filler was lower than Group 1 without TCP-FA filler (p<0.05). The result after demineralization for 48 hours also were shown to decrease gradually with an increasing content of TCP-FA filler (p<0.05, Figure 7, Table 4).
Although it was not significant, %SMHR of composite resin with added TCP-FA filler was lower than that of composite resin without TCP-FA filler. After demineralization for 24 hours, %SMHR in Group 4 with 20 % of TCP-FA filler was lowest among groups (p>0.05, Table 3), after demineralization for 48 hours, it was gradually decreased with an increasing content of TCP-FA filler. %SMHR in Group 5 with 25 % of TCP-FA filler was lowest among the groups (p>0.05, Table 3)
The results of correlation between surface microhardness reduction (%SMHR) and loss of fluorescence ( F) showed a significant

correlation at both 24 hours and 48 hours demineralization (p<0.01, Table 5). Therefore it is considered that QLF-D could be a useful device to quantify demineralization, and composite resin with added TCP-FA filler has an effect on resistance to demineralization. This effect was especially remarkable in composite resin with more than 20 % of TCP-FA filler.
It is supposed that the effect of remineralization was induced on the surface of enamel and demineralization space was decreased. This is the reason why release and diffusion of substance from materials was caused by the inflow of acid (Mah, 2009). Xu et al. (2011) demonstrated that ion release of composite resin containing nano-sized ACP (17.76 /g)was higher than that of micro-sized ATCP (0.5 /g).
As the calcium salts and phosphate salts are mixed with saliva, they dissolve and release calcium and phosphate ions. Mixing of calcium ion with phosphate ions results in the immediate precipitation of ACP or amorphous calcium fluoride phosphate (ACFP) in the presence of fluoride ions. In the intra-oral environment, these phases such as ACP and ACFP are potentially very unstable and my rapidly transform into a more thermodynamically stable, crystalline phase such as hydroxyapatite and fluorhydroxyapatite. However, before phase transformation, calcium and phosphate ions should be transiently bioavailable to promote enamel subsurface lesion remineralization (Cochrane et al., 2010). In addition, the reaction product under presence of calcium and phosphate salt decreases ratio of remineralization (Reynold 1998). Thus, it is important to present adequate amount of calcium, phosphate salt and fluoride (Cochrane et al.,2010). For this reason, it is considered that fluoride ion released from FA will have a synergistic effect with TCP.
In the oral cavity, a local plaque pH of above 6 is the safe zone, pH of 6.0 - 5.5 is potentially cariogenic, and pH of 5.5 - 4 is the cariogenic or danger zone (Decker and Loveren, 2003; Xu et al., 2011).

The oral plaque pH after a glucose rinse can decrease to 4.5 or even 4 and stays for about 30 minutes. It increases back to a safe pH of 5.5 or higher, after the bacteria have completed their metabolic activity on the glucose and the saliva has buffered the acid. Hence, the damage is done within the first 30 min after a glucose rinse. There appears to be a critical pH, below which demineralization dominates, leading to a net enamel mineral dissolution. This critical pH varies with ionic concentrations of the oral fluid, but is ~ 5.5 for most individuals. Therefore, it would be highly desirable for the composite restoration to quickly neutralize the local acids and raise the cariogenic pH from 4 to a safe pH of 5.5 or above, thereby helping to inhibit caries (Moreau etal., 2011).
Moreau et al. (2011) have studied that acid neutralization of composite with nano-sized amorphous calcium phosphate (NACP) were measured. pH change of composite resin increased higher and more rapidly with the addition of NACP. In comparison, the commercial hybrid composite resin and RMGI did not raise the pH. Yang et al. (2013) have demonstrated that pH change of dental sealant increased more greatly and rapidly with the addition of novel 45S5 bioamorphousglass.
In this study, pH change by time, and time to raise pH from 4.0 to 5.5 were measured to evaluate acid neutralization of the composite. pH change greatly increased adding TCP-FA filler. In contrast, Group 1 without TCP-FA filler had little increase in pH (p<0.05, Figure 8). In addition to, Group 5 with 25 % of TCP-FA filler and Group 4 with 20 % of that came back to critical pH 5.5, especially Group 5 rapidly increased than Group 4 (p<0.05, Figure 9). That is the reason why TCP-FA filler accompanied with a series of surface reactions due to release of alkali ion such as Ca2+ in the aqueous environments (Gandolfi et al., 2011).
In this study, Group 1, Group 2, Group 3 did not reached pH 5.5 until 90 minutes (Figure 9). It is supposed that this study was designed

to measure for 90 minutes, but that time was too short to measure. However pH change increased until 7 days as calcium ion release (Gandolfi et al., 2011) and pH change was a continuous dynamic process and not static in this study. Thus if measurement of pH change could be performed over 90 minutes, it would be possible to measure the time to raise pH to 5.5.
Two major challenges of restorative materials are secondary caries and bulk fracture (Xu et al., 2008), enhancement of strength besides resistance of caries is required for develop of composite resin.
This study showed that flexural strength of composite resin decreased on addition of nano-sized TCP-FA filler (p<0.05, Figure 10) whereas it was higher than that of Skrtic et al. (1996) study and O'Donnell et al.(2005) study which measured strength of composite added ACP. It is supposed that filler size affects mechanical strength. Moreau et al. (2011) study have reported that strength of light cured composite resin with added nano-sized ACP decreased with contents of filler, however strength of composite resin with added 10-30 % of filler was similar with hybrid composite resin for anterior and posterior tooth, and that with added 40 % of filler was higher than composite resin containing micro filler. Also the strength of all experimental groups with added nano-sized ACP were higher than glass ionomer. For this reason, they reported that composite resin adding nano-sized ACP is suitable for restoration of class 1, 2, 3 and 4 cavities.
Although Group 5 adding 25 % of TCP-FA filler has shown lower strength than other groups (p<0.05, Figure 10), there were no significant differences among all groups except Group 5 (p>0.05, Figure 10). Therefore strength of composite resin adding TCP-FA filler less than 20 % was similar to the non-addition group. Some studies have reported that strength of composite filler adding reinforced filler was higher than single filler (Xu et al., 2007; Xu et al., 2009). Xu et al. (2007) reported that

flexural strength of composite with added nano-sized dicalcium phosphate (DCPA) and whisker in the proportion of 1:1 was similar with commercial hybrid composite resin, whereas that of none-addition group was decreased. Thus composite resin containing reinforced filler and nano-sized filler showed ion release and high mechanical strength. Another study by Xu et al. (2009) demonstrated that flexural strength of composite resin adding TTCP and whisker in the proportion of 1:1 was 116 Mpa which was higher by 2 fold, than composite resin adding Ca-PO4. They have reported this result as the reason why fusion TTCP and whisker makes composite not only better in toughness and stability but also in bonding with resin. FA enhanced mechanical properties of TCP and its difference in ratio of addition and thermal temperature. As in previous studies, it is supposed that FA used in this study served as reinforced filler of TCP and thereby affected strength.
In this study, decrease of strength and high standard deviation in each group were shown. It is supposed that the mixture was not homogeneous because resin matrix and filler were mixed by hand. Group 5 with 25 % of TCP-FA filler especially too stiff to mix and had lowest strength among all groups. In addition, the process of mixing was not under vacuum and micro porous formation could occur in specimens. Micro porosity caused high standard deviation. Therefore if attention is paid to the process of mixing, mechanical properties of composite could be better than results of this study.
The restoration materials used in dentistry field are always exposed to saliva and food or water in oral cavity (Choi, 2007). During exposure to various environments, composite resin undergoes change in its material properties (Drummond, 2008). When water intrudes in the composite resin, the bond between silane and filler particles undergoes a hydrolytic breakdown; filler-matrix debonding or hydrolytic degradation of the fillers may occur and microcracks are formed. According to the change,

composite resin, with time, lead to deterioration of the physical and mechanical properties such as tensile strength, flexural strength, modulus of elasticity and wear resistance. Thus the life of composite resin is get shorter (Sideridou et al., 2003, Sideridou et al., 2004). For this reason, it is important to evaluate the materials properties such as water sorption and solubility clinically (Kim, 1999).
According to ISO 4049 standard (2009) standard for dentistry polymer-based restorative materials, suitability for use as dental material is indicated by water sorption of 40 / and solubility of 7.5 /
[ISO 4049 standard (2009)]. The current study has shown that water sorption and solubility of all groups met the requirement of ISO 4049 standard (2009).
In previous studies, there was correlation between water sorption and filler content (Janda et al., 2007), although filler contents were identical, water sorption was different along with particle size of filler (R ttermann et al., 2008, Tarumi et al., 1995). R ttermann et al. (2008) added same contents of microhybrid filler and nano-sized filler to resin-based restorative material and measured water sorption. Their study showed that the experimental group which added nano-sized filler had high water sorption. They reported that the matrices of microhybrid and nano were identical and the volumetric filler contents of the materials were nearly the same, the agglomerated nano filler itself was assumed to be the reason for these very high values. They also demonstrated that the micro porous structure of the agglomerates also caused high water sorption due to absorption of water iva inner micro porosities. In this study, water sorption of Group 5 was higher than other groups (p<0.05, Table 7, Figure 11). This result suppose that although mass ratio of filler in all groups were identical, 5 group which included 25 % of nano-sized filler contained amount filler relatively compared with other groups. Additionally, mixing 25 % of TCP-FA and resin matrix was performed

by hand-mix, not vacuum, micro porosities could thus be formed within composite resin. It is assumed that these micro porosities induced high water sorption.
In previous solubility studies, materials having high water sorption and high ion release have shown high solubility (Silva eta al., 2008, Rttermann et al., 2008). The study of Kim (1999) has reported that solubility of composite resin releasing fluoride were higher, because this result was related with fluoride-release. In this study, Group 5 had the highest solubility (p<0.05, Table 7, Figure 12). According to this result, it is supposed that composite resin including TCP-FA filler were released ion such as calcium and fluoride.
The biocompatibility of materials as well as physical properties are important properties for long term clinical usefulness. Therefore the biocompatibility test of novel materilas is essential. Cytotoxicity test is limited in its assessment of general biocompatibility of materials while its reproducibility is high and its protocol is simple. Also it is easy to standardize the test procedure and it is possible to obtain quantitative result with short term economic benefits. Hence it is required to standardize screening procedures in biological assessment of dental materials and to assess biocompatibility (Kim, 1999).
There are various methods to assess cytotoxicity (Jung, 2009; Kim, 1999), MTT assay which is based on the measurement of the viability of cells via metabolic activity [ISO 10993-5 standard (2009)] have some advantages in that cellular metabolic activity or function are evaluated as compared with other methods (Jung, 2009).
Among the earlier studies on cytotoxicity, Jantova et al. (2009) have studied cytotoxic and antiproliferavtive effects of biomaterial. Biomaterials induced different antiproliferatve effects of increasing order HA<FHA<FA which were time and concentration-dependent. Kim reported that composite resin containing SnF2 filler was moderately cytotoxic. They

also reported their findings on the release of fluoride. However Forghani et al. (2013) by MTT assay of nanocomposite and pure foresterite and FA powder after 3~7 days of cell culture, demonstrated non-cytotoxic effects.
In the current study, all groups except Group 5 were not cytotoxicity (Table 9, Figure 13, 14). Moderate cytotoxicity of Group 5 in undiluted solution was observed (Table 9, Figure 13), while diluted solution by 50 % was not cytotoxicity (Table 9, Fiugre 14). The release of fluoride in FA leads to cytotoxicity. In previous study it was shown that cytotoxicity increased with increasing concentration of additive (Jantova et al., 2009). Thus Group 5 had higher cytotoxicity than other groups since the contents of FA in Group 5 was highest among groups.
In this study, it was confirmed that composite resin containing TCP-FA filler affected resistance of initial caries, physical, mechanical and biological properties.
Particularly composite resin containing more than 20 % of TCP-FA filler had high resistance to demineralization and acid neutralization, as well as suitable water sorption and solubility of restorative materials. However composite resin adding 25 % of TCP-FA filler had decreased mechanical strength and were a little cytotoxicity while that containing 20 % of TCP-FA filler was not cytotoxicity and higher mechanical strength than 25 % of TCP-FA filler.
For this reason, it is considered that composite resin containing 20 % of TCP-FA filler is suitable to clinical application. Further studies are required, in order to improve mechanical strength.

. Conclusion
The major challenge of composite resin is to develop materials which are anticariogenic in order to inhibit secondary caries and have sufficient strength to prevent fracture.
In this study, resistance to demineralization on composite resin containing TCP-FA filler which were a mixture synthesized TCP and FA were measured through surface microhardness by VHN and loss of fluorescence by QLF-D. Acid neutralization properties were also measured. In addition, flexural strength, water sorption, solubility and cytotoxicity were measured to identify basic characteristics.
The results were as follow :
1. In XRD analysis, synthesized powder had a similar pattern as JCPDS #15-0876 (fluorapatite) for FA and #018-0303 (tricalciumphosphate) for TCP.
2. SEM and TEM image revealed that TCP particles were spheroidal, FA particles were cubic and TCP-FA particles were a mixture of TCP and FA morphologies.
3. Particle size of TCP and FA were respectively 19.78±6.45 nm, 26±7.55 nm.
4. After 24 hours demineralization, F of Group 4 with 20 % of TCP-FA filler was lowest, and in order Group 5 (25 %), Group 3 (15 %), Group 2 (10 %) and Group 1 (0 %). After 48 hours demineralization, F was lower with addition of TCP-FA filler. F of Group 5 with 25 % of TCP-FA filler thus was lowest among groups (p<0.05).
5. There were significant correlation between surface microhardness reduction and loss of fluorescence (p<0.05).

6. There were significant differences of pH change by time with the addition of TCP-FA filler. pH change was lower with addition of TCP-FA filler. Thus Group 5 with 25 % of TCP-FA filler increased greater and more rapidly among groups (p<0.05).
7. The time to raise pH from 4.0 to 5.5 was faster in Group 5 among groups (p<0.05).
8. Flexural strength of Group 5 was lowest among groups (p<0.05), but there were not significant difference among groups except Group 5 (p>0.05).
9. Water sorption and solubility of all groups satisfied requirements of ISO 4049 standard (2009).
10. There was no cytotoxicity in all groups, except Group 5.
According to the result, it is confirmed that composite resin containing TCP-FA filler has the property of resistance to demineralization and acid neutralization. Moreover it affects mechanical, physical and biological properties.
Composite resin containing 20 % of TCP-FA filler had good resistance to demineralization and acid neutralization, sufficient water sorption and solubility of restorative materials and was non-cytotoxic. Thus composite resin containing 20 % of TCP-FA filler are suitable materials to inhibit initial secondary caries. However follow up studies are required to address improvement in mechanical strength, since their strength was slightly low in this study.

REFERENCES
1. Aljehani A, Tranaus S, Forsberg CM, Mansson BA, Shi XQ: In vitro quantification of white spot enamel lesions adjacent to fixed orthodontic appliances using quantitative light induced fluorescence and DIAGNOdent. Acta Odontol Scand 62: 313-318, 2004.
2. Anusavice KJ: Philips' Science of Dental Materials. 11th ed. 2006, p 446.
3. Arcis RW, Macipe AL, Toledano M, Osorio E, Clemente RR, Murta J, Fanovich MA, Pascual CD: Mechanical properties of visible light-cured resin reinforced with hydroxyapatite for dental restoration. Dent Mater 18: 49-57, 2002.
4. Ayed FB, Bouaziz J: Sintering of tricalcium phosphate-fluorapatite composites by addition of alumina. Ceramics Int 34: 1885-1892, 2008.
5. Ayed FB, Bouaziz J: Sintering of tricalcium phosphate-fluorapatite composites with zirconia. J Eur Ceram Soc 28: 1995-2002, 2008.
6. Bouslama N, Ayed FB, Bouaziz J: Sintering and mechanical properties of tricalcium phosphate-fluorapatite composites. Ceramics Int 35: 1909-1917, 2009.
7. Bouslama N, Ayed FB, Bouaziz J: Effect of fluorapatite additive on densification and mechanical properties of tricalcium phosphate. J Mech Behav Biomed Mater 2: 2-13, 2010.
8. Bouslama N, Chevalier Y, Bouaziz J, Ayed FB: Influence of the sintering temperature on Young's modulus and the shear modulus of tricalcium phosphate-fluorapatite composites evaluated by ultrasound techniques. Mater Chem Phys 141: 289-297, 2013.
9. Chan WD, Yang L, Wan W, Rizkalla AS: Fluoride release from dental cements and composite: A mechanistic study. Dent Mater 22: 366-373, 2006.
10. Cheng L, Weir MD, Xu HHK, Kraigsley AM, Lin NJ, Gibson SL, Zhou X: Antibacterial and physical properties of clacium-phosphate and calcium-fluoride nanocomposites with chlorhexidine. Dent Mater 28: 573-583, 2012.
11. Choi HJ, Choi YC, Kim KC, Choi SC: Remineralization depth of CPP-ACP on demineralization human enamel in vitro. J Korean Acad Pediatr Dent 35: 278-286, 2008.
12. Choi D, Kumta PN: Mechano-chemical synthesis and characterization of nanostructured -tricalcium phosphate powder. Mater Sci Eng C 27: 377-381, 2007.
13. Choi EM: Physical properties and fluoride release of dental pit and fissure sealants including fluoride and stannous fluoride. Doctorial thesis, Yonsei University, Seoul, 2007.
14. Cochrane N, Cai F, Huq N, Burrow M, Reynolds E: New approaches to enhanced remineralization of tooth enamel. J Dent Res 89: 1187-1197, 2010.

15. Decker RT, Loveren CV: Sugars and dental caries. Am J Clin Nutr 78: 881s-892S, 2003.
16. Donly KJ, Jensen ME, Triolo P, Chan D. A clinical comparison of resin composite inlay and onlay posterior restorations and cast-gold restorations at 7 years. Quintessence Int 30: 163-168, 1999.
17. Dorozhkin SV: Amorphous calcium (ortho)phosphates. Acta Biomater 6: 4457-4475, 2010.
18. Drummond JL: Degradation, fatique and failure of resin dental composite materials. J Dent Res 87: 710-719, 2008.
19. Eslami H, Hashjin MS, Tahriri M: The comparison of powder characteristics and physicochemical, mechanical and biological properties between nanostructured ceramics of hydroxyapatite and fluoridated hydroxyapatite. Mater Sci Eng C 29: 1387-1398, 2009.
20. Ferracane JL: Current trends in dental composites. Crit Rev Oral Biol Med 6: 302-318, 1995.
21. Forghani A, Mapar M, Kharaziha M, Fathi MH, Festharaki M: Novel fluorapatite-forsterite nanocomposite powder for oral bone defects. Int J Appl Ceram Technol 10: 282-289, 2013.
22. Gandolfi MG, Taddei P, Tinti A, Dorigo EDS, Prati C: Alpha-tricalcium phosphate improves the apatite-formation ability of calcium-silicate hydraulic cement soaked in phosphate solutions. Mater Sci Eng C 31: 1412-1422, 2011.

23. Geurtsen W, Leyhausen G, Godoy FG: Effect of storage media on the fluoride release and surface microhardness of four polyacid-modified composite resin("compomers"). Dent Mater 15: 196-201, 1999.
24. Hals E: Histology of natural secondary caries associated with silicate cement restorations in human teeth. Arch Oral Biol 20: 291-296, 1975.
25. Hamba H, Nikaido T, Inoue G, Sadr A, Tagami J: Effects of CPP-ACP with sodium fluoride on inhibition of bovine enamel demineralization: A quantitative assessment using micro-computed tomography. J Dent 39: 405-413, 2011.
26. Hong YW, Kim JH, Lee BH, Lee YK, Choi BJ, Lee JH, Choi HJ: The effect of nano-sized -Tricalcium phosphate on remineralization in glass ionomer dental luting cement. Key Eng Mater 361-363: 861-864, 2008.
27. Huang M, Feng J, Wang J, Zhang X, Li Y, Yan Y: Synthesis and characterization of nano-HA/PA66 composites. J Mater Sci Mater Med 14: 655-660, 2003.
28. Hwang GS, Kim JS, Kwon SW: Comparative study on fluoride release and anticariogenic effect of compomers. J Korea Acad Pediatr Dent 29: 1-10, 2002.
29. Imasato S, Imai T, Russel RRB, Torii M, Ebisu S: Antibacterial activity of cured dental resin incorporating the antibacterial monomer MDPB and an adhesion-promoting monomer. J Biomed Mater Res 39: 511-515, 1998.

30. International Organization for Standardization. ISO 4049: Dentistry- Polymer-based restorative materials, 2009.
31. International Organization for Standardization. ISO 10993-5: Biological evaluation of medical devices-Part 5: Tests for in vitrocytotoxicity, 2009.
32. International Organization for Standardization. ISO 10993-12: Biological evaluation of medical devices-Part 12: Sample preparation and reference materials, 2012.
33. Janda R, Roulet JF, Latta M, Ruttermann S. Water sorption and solubility of contemporary resin based filling materials, J Biomed Mater Res B Appl Biomater 82:545-551, 2007.
34. Jantova S, Letasiova S, Theiszova M, Palou M: Comparison of murine fibroblast cell response to fluor-hydroxyapatite composite, fluorapatite and hydroxyapatite by eluate assay. Acta Biologica Hungarica 60: 89-107, 2009.
35. Jung HY: Evaluation of changes in adhesive strength and cytotoxicity of a denture adhesive according to time. J Korean Acad Prosthodont 47: 232-239, 2009.
36. Kahrizsangi ER, Tabrizi NB, Chami A: Synthesis and characterization of fluorapatite-titania (FA-TiO2) nanocomposite via mechanochemical process. Solid State Sci 12: 1645-1651, 2010.
37. Kahrizsangi ER, Tabrizi NB, Chami A: Characterization of single-crystal fluorapatite nanoparticles synthesized via mechanochemical method. Particuology 9: 537-544, 2011.

38. Kim HB: Properties of light-cured pit & fissure sealants containing antibacterial filler. Master's thesis, Yonsei University, Seoul, 2002.
39. Kim HE : Quantification of severity on early caries and threshold recovery rate on remineralization. Doctorial thesis, Yonsei University, Seoul, 2011.
40. Kim HE, Kwon HK, Kim BI: Comparison of resistance to demineralization between the iontophoresis and the conventional fluoride application. J Korean Acad Dent Health 32: 10-19, 2008.
41. Kim HJ: Properties of light-cured composite resins containing SnF2
glass filler. Doctorial thesis, Yonsei University, Seoul, 1999.
42. Kim JH: The comparison of marginal integrity and demineralization resistance of light-cured glass-ionomer cement containing nano-sized biphasic calcium phosphate applying chewing simulator. Master's thesis, Yonsei University, Seoul, 2011.
43. Kim JG, Lee YH, Yang CH, Baik BJ: An experimental study on the tensile strength of posterior resin-based composite. J Korea Acad Pediatr Dent 28: 464-470, 2001.
44. Kim JY, Lee SH, Lee NY: Effect of Fluoride in natural polymer on enamel demineralization J Korean Acad Pediatr Dent 37: 35-43, 2010.
45. Kim MY, Kwon HK, Choi CH, Kim BI: Combined effects of nano-hydroxyapatite and NaF on remineralization of early caries lesion. Key Eng Mater 330-332: 1347-1350, 2007.
46. Kim YS, Min JH, Kim YS, Hong SJ, Kwon HK, Kim BI: The effect of nano-sized carbonate apatite on remineralization of artificial caries-like lesions. J Korean Acad Dent Health 33: 40-50, 2009.
47. Korean council for the faculty of dental materials : Dental Materials, 6th ed 2011, pp 6, pp 157, Koonja publishing Inc.
48. Kovarik RE: Restoration of posterior teeth in clinical practice: evidence base for choosing amalgam versus composite. Dent Clin North Am 53: 71-76, 2009.
49. Kwon HS, Hyun HK, Kim YJ, Kim JW, Jang KT, Kim CC, Hahn SH, Lee SH: Resistance to demineralization of enamel of primary teeth according to restoration: in vitro study using QLF. J Korean Acad Pediatr Dent 37: 44-52, 2010.
50. Lai GY, Zhu LK, Li MY, Wang J: An in vitro study on the secondary caries-prevention properties of three restorative materials. J Prosthet Dent 110: 363-368, 2013.
51. Langhorst SE, O'Donnell JNR, Skrtic D: In vitro remineralization of enamel by polymeric amorphous calcium phosphate composite: Quantitative microradiographic study. Dent Mater 25: 884-891, 2009.
52. Lee ES, Kang SM, Ko HY, Kwon HK, Kim BI: Association between the cariogenicity of d dental microcosm biofilm and its red fluorescence detected by Quantitative light-induced fluorescence-disital(QLF-D). J Dent 41: 1264-1270, 2013.

53. Lee KS, Chang JS, Kim JH, Lee DH, Kim YT: Study about biodegradation of hydroxyapatite and -tricalcium phosphate coating layer. Korean J Bone Metabol 18: 39-47, 2011.
54. Lee MS, Park DY, Ma DS: The remineralization effect of topical fluoride agents on artificial enamel caries. J Korean Acad Oral Health 36: 85-90, 2012.
55. Lee SH, Park JW, Kook JK, Lee NY: Development of filtering system of laser fluorescence for improvement of the diagnostic sensitivity for dental caries. J Korean Acad Pediatr Dent 30: 189-195, 2003.
56. Lee SY, Yang YM, Baik BJ, Kim JG, Jeon CW: An in vitro study of microleakage of composite resin. J Korean Acad Pediatr Dent 30: 593-599, 2003.
57. Lim HN, Shin JW, Min BS: Studies on the developments of experimental restorative composite resins for dental caries and its compatibility to human tooth substrate: Part 2 adhesive properties and adaptability to tooth structures. J Kor Res Soc Dent Mat 19: 209-229, 1992.
58. Lin K, Chang J, Ju J, Wu W, Zeng Y: Properties of -Ca3 (PO4)2
bioceramics prepared using nano-size powders. Ceramics Int 33: 979-985, 2007.
59. Mah YJ; The resistance of demineralization and bonding strength of light-cured glass ionomer dental cement filled with nano-sized

hydroxyapaptite and beta-tricalcium phosphate. Master's thesis, Yonsei University, Seoul, 2009.
60. Moreau JL, Sun L, Chow LC, Xu HHK: Mechanical and acid neutralizing properties and bacteria inhibition of amorphous calcium phosphate dental nanocomposite. J Biomed Mater Res B Appl Biomater 98: 80-88, 2011.
61. Neuhaus KW, Rodrigues JA, Seemann R, Lussi A: Detection of proximal secondary caries at cervical calss -amalgam restoration margins in vitro. J Dent 40: 493-499, 2012.
62. Nikcevic I, Jokanovic V, Mitric M, Nedic Z, Makovec D, Uskokovic D: Mechanochemical synthesis of nanostructured fluorapatite/fluorhydroxyapatite and carbonated fluorapatite/ fluorhydroxyapatite. J Solid State Chem 177: 2565-2574, 2004.
63. O’Donnell JNR, Antonucci JM, Skrtic D: Mechanical properties of
amorphous calcium phosphate composites. J Dent Res 84: 9-12,
2005.
64. Osborne JW, Summitt JB, Robert HW: The use of dental amalgam in pediatric dentistry: review of the literature. Pediatr Dent 24: 439-447, 2002.
65. Park DY, Lee NY, Lee SH: Preventive effect of fluoride-containing adhesive film made by nano. J Korean Acad Pediatr Dent 35: 662-670, 2008.

66. Park JW: Development of anticariogenic composite resin. J Kor Acad Cons Dent 35: 65-68, 2010.
67. Park SH. Kim KY. The anticariogenic effect of fluoride in primer, bonding agent and composite resin in the cavo surface enamel area. Oper Dent 22: 115-120, 1997.
68. Pretty IA, Pender N, Edgar WM, Higham SM: The in vitro detection of early enamel de-and re-mineralization adjacent to bonded orthodontic cleates using quantitative light-induced fluorescence, Eur J Orthod 25: 217-223, 2003.
69. Reynolds E: Anticariogenic complexes of amorphous calcium phosphate stabilized by casein phosphopeptides: a review. Spec Care Dentist 18: 8-16, 1998.
70. Rhee SH: Synthesis of hydroxyapatite via mechanochemical treatment. Biomaterials 23: 1147-1152, 2002.
71. Rodriguez-Lorenzo LM, .Hart JN, Gross KA: Influence of fluorine in the synthesis of apatites. Synthesis of solid solutions of hydroxy-fluorapatite. Biometerials 24: 3777-3785, 2003.
72. R ttermann S, Wandrey C, Raab WHM, Janda R: Novel nano-particles as fillers for an experimental resin-based restorative material. Acta Biomater 4: 1846-1853, 2008.
73. Seeley Z, Bandyopadhyay A, Bose S: Tricalcium phosphate based resorbable ceramics: influence of NaF and CaO addition. Mater Sci Eng C 28: 11-17, 2008.
74. Shen P, Cai F, Nowicki A, Vincent J, Reynolds EC: Remineralization of enamel subsurface lesions by sugar-free chewing gum containing casein phosphopeptide-amorphous calcium phosphate, J Dent Res 80: 2066-2070, 2001.
75. Sideridou I, Tserki V, Papanastasiou G: Study of water sorption, solubility and modulus of elasticity of light-cured dimethacrylate-based dental resins. Biomaterials 24: 655-665. 2003.
76. Sideridou I, Achilias DS, Spyroudi C, Karabela M: Water sorption chracteristics of light-cured dental resins and composites based on Bis-EMA/PCDMA. Biomaterials 25: 367-276, 2004.
77. Silva EM, Almelda GS, Poskus LT, Gulmaraes JGA: Relationship between the degree of conversion, solubility and salivary sorption of a hybrid and a nanofilled resin composite: influence of the light activation mode. J Appl Oral Sci 16: 161-166, 2008.
78. Skrtic D, Antonucci JM, Eanes E: Improved properties of amorphous calcium phosphate fillers in remineralizing resin composites. Dent Mater 12: 295-301, 1996.
79. Somarani S, Banu M, Jemal M, Rey C: Physico-chemical and thermochemical studies of the hydrolytic conversion of amorphous tricalcium phosphate into apatite. J Solid State Chem 178: 1337-1348, 2005.
80. Song JH, Kim YJ, Kim JW, Jang KT, Kim CC, Hahn SH, Lee SH: The preventive effect of commercially available anticariogenic

products on enamel erosion induced by carbonated beverage in vitro. J Korean Acad Pediatr Dent 37: 1-12, 2010.
81. Tabrizi BN, Fahami A: Crystallization behavior of nanostructured amorphous tricalcium phosphate under thermal treatment. Mater Lett 106: 396-400, 2013a.
82. Tabrizi BN, Fahami A: Mechanochemical synthesis and structural characterization of nano-sized amorphous tricalcium phosphate. Ceramics Int 39: 8657-8666, 2013b.
83. Tarumi H, Torii M, Tsuchitani Y: Relationship between particle size of barium glass filler and water sorption of light-cured composite resin. Dent Mater 14: 37-44, 1995.
84. Wang Y, Li X, Chang J, Wu C, Deng Y: Effect of tricalcium silicate(Ca3SiO5) bioactive material on reducing enamel demineralization: an in vitro pH-cycling study. J Dent 40: 1119-1126, 2012.
85. Weigand A, Buschalla W, Attin T: Review on fluoride-releasing restorative materials-fluoride release and uptake characteristics, antibacterial activity and influence on caries formation. Dent Mater 23: 343-362, 2007.
86. Wu J, Jin C, Nie X, Zhou K, Zhou C: Study on synthesis on a novel nano-antibacterial inorganic filler and its antibacterial property. West China J Stomatol 30: 526-529, 2012

87. Xu X, Burgess JO: Compressive strength, fluoride release and recharge of fluoride-releasing materials. Biomaterials 24: 2451-2461, 2003.
88. Xu HHK, Moreau JL, Sun L, Chow LC: Strength and fluoride release characteristics of calcium fluoride based dental nanocomposite. Biomaterials 29: 4261-4267, 2008.
89. Xu HHK, Moreau JL, Sun L, Chow LC: Nanocomposite containing amorphous calcium phosphate nanoparticles for caries inhibition. Dent Mater 27: 762-769, 2011.
90. Xu HHK, Sun L, Weir MD, Antonucci JM, Takani S, Chow LC, Peltz M: Nano DCPA-whisker composites with high strength and Ca and PO4 release. J Dent Res 85: 722-727, 2006.
91. Xu HHK, Weir MD, Sun L: Nanocomposites with Ca and PO4 release : effects of reinforcement, dicalcium phosphate particle size and silanization. Dent Mater 23: 1482-1491, 2007.
92. Xu HHK, Weir MD, Sun L: Calcium and phosphate ion releasing composite: effect of pH on release and mechanical properties. Dent Mater 25: 535-542, 2009.
93. Yamada Y, Tsubota Y, Fukushima S: Effect of restoration method on fracture resistance of endodontically treated maxillary premolar. Int J Prosthodont 17: 94-98, 2004.
94. Yang SY, Piao YZ, Kim SM, Lee YK, Kim KN, Kim KM: Acid neutralizing, mechanical and physical properties of light-cured pit

and fissure sealant containing 45S5 bioactive glass. Dent Mater 29: 1228-1235, 2013.
95. Yoon MO, Lee NY, Lee SH: Effect of a fluoride varnish on the enamel demineralization. J Korean Acad Pediatr Dent 35: 446-455, 2008.
96. You YS, Kim JS: Monitoring of remineralization of decalcified enamel using QLF-D. J Korean Acad Pediatr Dent 39: 257-266, 2012.
97. Youn YA, Cho JH, Lee KH: The effects of a sealant resin on enamel demineralization in orthodontic bracket bonding. Korean J Orthod 35: 43-50, 2005.
98. Zero DT : Application of clinical models in remineralization research. J Clin Dent 10: 74-85, 1999.
99. Zhu Y, Zhang X, Chen Y, Xie Q, Lan J, Qian M, He N: A comparative study on the dissolution and solubility of hydroxyapatite and fluorapatite at 25 and 45 . Chemical Geology 268: 89-96, 2009

ABSTRACT (IN KOREAN)
나노 크기의 tricalcium phosphate-fluorapatite
(TCP-FA) 필러를 함유한
복합 진의 기 우식 항성 특성
<지도교수 김경남>
연세 학교 학원 치의학과
김명은
서론
복합 진은 환자들의 심미 요구가 증가하고 물성이 향상됨에 따
라 범 하게 사용되고 있다. 그러나 수복물 주변에서 발생되는 이
차우식증은 수복물의 수명에 제한을 주어 수복물을 교체하게 되는 빈
번하고 주요한 원인으로 이를 효과 으로 억제할 수 있는 재료의 개
선이 필요하다.
Tricalcium phosphate(인산 삼칼슘, TCP)는 칼슘과 인을 유리시켜
경조직의 탈회에 항하고 재 화를 유도하는 특성을 갖는 것으로 알
려져 있으며, fluorapatite(불화인회석, FA)는 불소를 유리하고 치아우
식증을 지연할 뿐만 아니라 TCP에 첨가되었을 때 기계 인 강도를
증가시킨다고 알려져 있다.
이에 따라 본 연구에서는 나노 크기의 TCP-FA 필러(filler)를 함유
한 복합 진의 기 우식 항성 정도를 측정하고 재료의 특성에 미
치는 향에 해 알아보고자 하 다.

연구 재 료 방법
기계화학 방법을 이용하여 CaHPO4, Ca(OH)2, CaF2로 불화인회석
을 합성하고 CaHPO4와 Ca(OH)2로 트리칼슘포스페이트를 합성한 후,
4 : 6의 비율로 혼합하여 TCP-FA 필러를 제조하 다.
TCP-FA 필러의 상분석은 XRD를 통해 평가하 고, 형태 특징,
입자 크기 응집의 분포는 SEM과 TEM을 이용하여 조사하 다.
특성 분석 후, TCP-FA 필러는 진 기질에 각각 0 %, 10 %, 15
%, 20 %, 25 %를 첨가하 고, 기 우식 항성, 기계 물리
생물학 특성을 평가하 다.
기 우식 항성을 평가하기 해 탈회 항성과 산 화 특성을
조사하 다. 탈회 항성은 24시간과 48시간 탈회 후 표면미세경도와
QLF-D를 통해 평가하 고 산 화 특성은 90분 동안의 분 당 pH 변
화와 pH 4.0에서 pH 5.5까지 증가하는 시간을 통해 평가하 다.
복합 진의 기계 물리 생물학 특성을 평가하기 해 굽힘
강도, 물 흡수도와 용해도 그리고 독성평가를 측정하 다.
결과
XRD 분석결과 TCP-FA의 상은 TCP와 FA와 유사하 고, 큐빅과
타원형의 모양을 보 다. TCP와 FA의 입자 크기는 각각 19.78±6.4
nm와 26±7.55 nm 다.
TCP-FA 필러를 첨가한 복합 진의 표면미세경도 감소율과 형 감
소량은 TCP-FA 필러를 첨가하지 않은 복합 진보다 낮았다. 특히 4군
과(20 %의 TCP-FA 필러 함유)와 5 군(25 %의 TCP-FA 필러 함유)은
각각 24시간과 48시간 탈회 후 가장 낮은 형 감소량을 보 다(p<0.05).
TCP-FA 필러를 첨가함에 따라, 용액의 pH 변화와 속도는 크고 빠
르게 증가했고. 짧은 시간 내에 pH 4.0에서 5.5까지 증가했다. 이러한
경향은 5군(25 %의 TCP-FA 필러 함유)에서 가장 두드러지게 나타
났다(p<0.05).

TCP-FA 필러를 첨가함에 따라, 굽힘 강도는 감소했다. 특히 5군
(25 %의 TCP-FA 필러 함유)의 굽힘 강도가 가장 낮았으나(p<0.05)
5군을 제외한 다른 군 간의 차이는 없었다(p>0.05).
모든 군의 흡수도와 용해도는 ISO 4049의 요구조건을 만족했고 25
%를 제외한 모든 군은 세포독성을 보이지 않았다.
결론
이번 연구에서 나노 크기의 TCP-FA 필러가 탈회 항성과 산
화 특성 그리고 물성에 향을 미치는 것을 확인하 다. 특히 20 %
이상의 TCP-FA 필러를 첨가한 복합 진이 주목할 만 했다. 그러나
25 %의 TCP-FA 필러를 함유한 복합 진은 독성을 보임에 따라 20
%의 TCP-FA 필러를 함유한 복합 진은 기 이차우식증을 억제하
는 데에 효과 이고 향후 기계 성질을 보완한다면 복합 진의 재료
로 활용되는 데 합하다고 사료된다.
핵심되는 말 : 복합 진, 나노 크기의 TCP-FA 필러, 탈회 항성,
산 화, 굽힘강도, 흡수도, 용해도, 세포 독성