RESISTANCE TO ANTIBIOTICS IN BELGIUM AMR Policy … to antibiotics in Belgium... · Autocontrole 46...
51
RESISTANCE TO ANTIBIOTICS IN BELGIUM AMR Policy Dialogue November 22, 2018 Boudewijn Catry Service Healthcare-associated infections and antimicrobial resistance
Transcript of RESISTANCE TO ANTIBIOTICS IN BELGIUM AMR Policy … to antibiotics in Belgium... · Autocontrole 46...

RESISTANCE TO ANTIBIOTICS IN BELGIUM
AMR Policy DialogueNovember 22, 2018
Boudewijn Catry Service Healthcare-associated infections and antimicrobial resistance

Point prevalence survey: PPS (photo)
Surveillance continue (film)
&

Conclusion on ‘Pictures’
Healthcare associated infections (HAI) prevalence (%) in Belgium• Hospitals: 7.3 (2017)• Long term care facilities (LTCFs): 3.5 (2016)
Estimated number of patients per year with an HAI in Belgium• Hospital: 111 276• LTCFs: 170 090
Disability adjusted lifye years (DALY) calculations:Throughout Europe, this study concluded that an estimated number of 33 000 casualties are annually attributed toantimicrobial resistance. For Belgium, this number has been estimated at 530 deaths annually. Among these, 240 and 70could be attributed to third-generation cephalosporin resistant Escherichia coli and Klebsiella pneumoniae (excludingthose resistant to colistin and/or carbapenem), respectively, and 133 to MRSA (methicillin resistant Staphylococcus aureus).Further actions should focus on a reduction of inappropriate antimicrobial consumption and adequate preventive measuresincluding hand hygiene and other infection control policies.
Latour Katrien & Eline VandaelBrecht Devleeschauwer

Surveillances
&
FEEDBACKMRSA
Campaigns
IndicatorsICU & SSIBlood stream infections
C. difficile
Gram -
BeH-SAC
Rectangle = mandatory
VRE

MULTIDRUG RESISTANT ORGANISMS
Microorganism ResistanceMRSA Staphylococcus aureus Met(h)icillinESBL+ Enterobacteriaceae
(E.coli / Klebsiella / …)3de generation cephalosporins
CPE Enterobacteriaceae CarbapenemsVRE Enterococcus faecalis/faecium VancomycinMDR Pseudomonas/Acinetobacter Different classes
CDIF Clostridium difficile Intrinsic (Anaërobic)
Urgent inquiries*
e.g. Candida auris, Mycobacterium chimaera
Intrinsic antibacterial, and/or multi antifungal resistance
Latour Katrien*ECDC
CB1CB2

Slide 5
CB1 Catry, Boudewijn; 29/06/18
CB2 Catry, Boudewijn; 29/06/18
Skin (MRSA) versus Gut bacteria (ESBL, CPE), Belgium 1994-2017
0
1
2
3
4
5
6
7
8
0
1
2
3
4
5
6
7
8
1994
1995
1996
1997
1998
1999
2000
2001
2002
2003
2004
2005
2006
2007
2008
2009
2010
2011
2012
2013
2014
2015
2016
2017
ES
BL+
and
CP
E+
E. c
oli e
t K. p
neum
onia
e/1
000
adm
issi
ons
Incidence of MRSA and ESBL+ and CPE+ E. coli & K. pneumoniae per 1000 admissions(Belgian acute care hospitals; clinical samples only)
1994 - 2017
ESBL+ Escherichia coli ESBL+ Klebsiella pneumoniae #REF! CPE+ Klebsiella pneumoniae MRSA
MRSA: methicillin resistant Staphylococcus aureus; ESBL: extended spectrum beta-lactamaseCPE: carbapenemase producingKatrien Latour & Béatrice Jans
Timely feedback is needed, also for outbreak support team (OST)

EARS-net Belgium , S. aureus, E. col i , E. faecium blood, evolut ion of mult iple resistance, 2013-2017
Mertens, K in press

EARS-net Belgium, E. coli (Urine vs Blood)
Mertens, K in press

Remarkable findings 2017Earsnet-Belgium Blood/CSF*
• S. aureus: decline MRSA: 8.7%IR in 2017 (versus 12.2%IR in 2016)
• E. coli: no increase in multi-resistance• K. pneumoniae: no further increase R% for 3GC and carbapenems• E. faecium: rise in resistance% vancomycin (5.5%R versus
1.7%R in 2016), teicoplanine (6.5%R versus 1.2%R in 2016) and linezolid (2.4%R versus 0.5%R in 2016)
*Preliminary results – validation by NRC’s ongoing
Thomas Struyf – Karl Mertens
Preliminary results

Surveillances
&
FEEDBACKMRSA
Campaigns
IndicatorsICU & SSIBlood stream infections
C. difficile
Gram -
BeH-SAC
Rectangle = mandatory
VRE

Clostridium difficile – mean incidence per 1000 admissions (BE 2008-2017)
NOTE: - ICD associées à l’hôpital: début des symptômes ≥ 2 jours après l’admission- Calcul de l’incidence: Inclusion de tous les hôpitaux ayant fourni des données complètes (numérateurs et dénominateurs)
au moins 1 semestre/an
Incidence moyenne des infections à C. difficile (ICD) dans les hôpitaux aigus,[Belgique 2008-2017]
0.00
0.50
1.00
1.50
2.00
2008 2009 2010 2011 2012 2013 2014 2015 2016 2017
N/1
000
adm
issi
ons
ICD associés à l'hopital Total des ICD
1.75
1
Mortgat ea., in press

Clostridium diff ici le (CDIF), stratif ied by province (BE, 2017)
Note: Incidence moyenne de tous les hôpitaux aigus ayant participé à au moins 1 semestre. Les chiffres pour chaque province indiquent le nombre d’hôpitaux-semestres. Les catégories (couleurs) pour l’incidence sont basées sur les quartiles de la distribution.
Incidence moyenne des infections à C. difficiles (ICD) dans les hôpitaux aigus, par province[N/10.000 journées d’hospitalisation, Belgique 2017]
Mortgat ea., in press

Relationship Infuenza like illnes –antimicrobial consumption - CDIF
Figuur 1Non-pediatric antimicrobial use in the community in Daily Defined Doses per 1000 inhabitant days. Belgium 2007-2013
Bruyndonckx et al., submitted

• Competent authorities
Outbreak
Surveillance & notification
• experts
Outbreak support
Reference labSCIENSANO
Elisabeth Miller & Hélène De Pauw

Enkele gegevens
Enterobacteriaceae
Enterobacteriaceae
EnterobacteriaceaeEnterobacteriaceae
Miller E, De Pauw H

Compliance hand hygiene
De Pauw H, Benhammadi N, et al. 2018

Compliance stratified by indication
De Pauw H, Benhammadi N, et al. 2018

Compliance HH before ‘sterile or invasive contact’
De Pauw H, Benhammadi N, et al. 2018

Compliance Hand hygiene in ICU – BE
( F o n g u h e t a l . A r c h i v e s P u b l i c H e a l t h 2 0 1 6 )

M e r t e n s , 2 0 1 7 W I V- I S P
010
020
030
040
050
060
070
0In
tuba
tie d
agen
/100
0 pa
tient
dag
en
05
1015
2025
3035
Pneu
mon
ien
per 1
000
patie
nt/in
tuba
tie d
agen
97 99 01 03 05 07 09 11 13 15Jaar
IZ verworven
Intubatie geassocieerd
Intubatie gebruik
Figuur 2: Evolutie van IZ-verworven en intubatie geassocieerde pneumoniën, en intubatie gebruik op Intensieve Zorgen, NSIH-ICU surveillance België, 1997-2015.
Mertens K, WIV-ISP 2017
Ventilator associated pneumonia, ICU BE 1997-2015

Blood stream infections (BSI)
Figure 10: Variation hospital-associated bloodstream infections between hospitals, Belgium 2017 (HABSI, hospital-associated bloodstream infection; SD, standard deviation)
Duysburgh, E. 2018
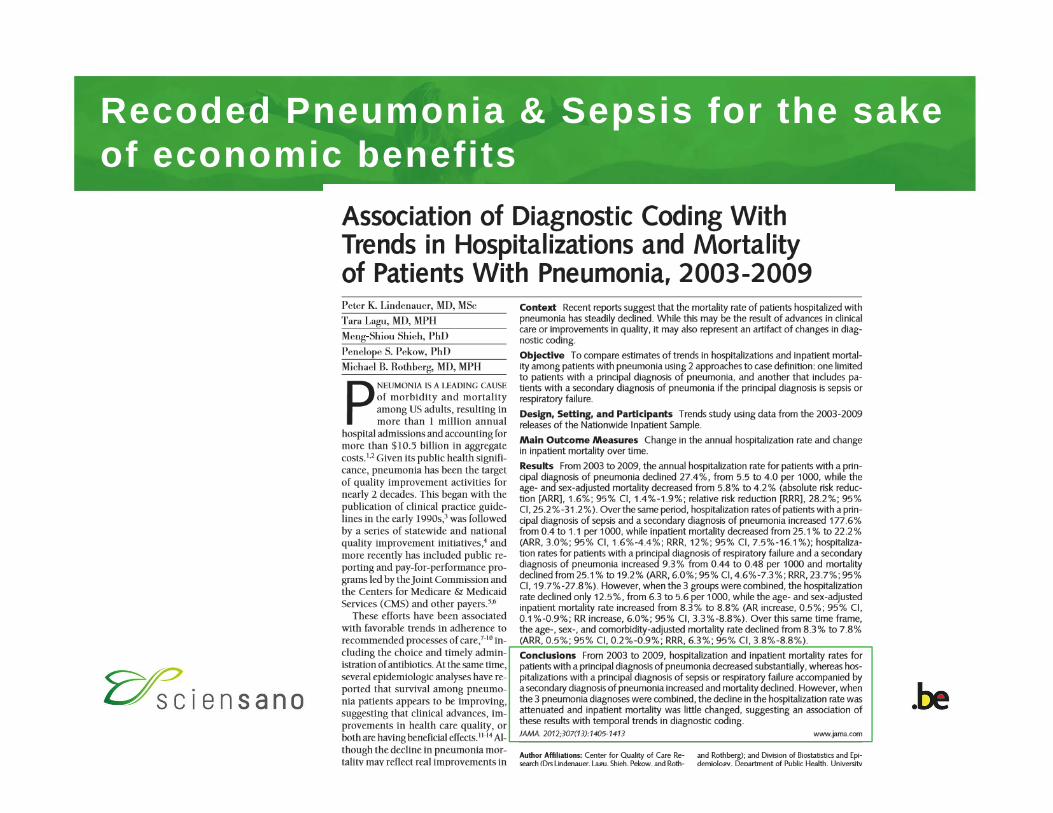
Recoded Pneumonia & Sepsis for the sake of economic benefits

• Competent authorities
Outbreak
Surveillance & notification
• experts
Outbreak support
Reference labSCIENSANO
Elisabeth Miller & Hélène De Pauw

https://www.healthstat.be

Evolut ion of the consumption* of ant ibacter ials for systemic use (J01) in acute-care Belgian hospitals, 2003-2016
Vandael Eline et al., in prep.
RIZIV/INAMI & Healthdata
*Expressed in defined daily doses (DDDs)/1000 patient days (2003-2016)
Currently 18 months delayrealtime monitoring is asked

Anticaterial use (J01) stratified by type of hospitals

Stratification BSI by hospital type
Duysburgh E. 2018

Blood stream infections – stratified by region
Duysburgh E. 2018

Evolut ion of the consumption* of ant ibacter ials for systemic use (J01) in acute-care Belgian hospitals, 2003-2016
Vandael Eline et al., in prep.
RIZIV/INAMI & Healthdata
*Expressed in defined daily doses (DDDs)/1000 patient days (2003-2016)

Antibacterial consumption Belgium, 2017
Antibacterials for systemic use (ATC group J01)
Consumption of antibacterials for systemic use (ATC group J01) in the community (primary care sector) and the hospital sector expressed in DDD per 1000 inhabitants and per day in 2017
ATC group J01 Community (primary care sector)
Hospital sector
Beta-lactam antibacterials, penicillins (J01C) 14.48 0.97
Other beta-lactam antibacterials (J01D) 1.17 0.40
Tetracyclines (J01A) 1.92 0.02
Macrolides, lincosamides and streptogramins (J01F) 3.41 0.11
Quinolone antibacterials (J01M) 2.17 0.19
Sulfonamides and trimethoprim (J01E) 0.19 0.04
Other J01 substances 2.55 0.16
Total 25.89 1.89

EARS-net Belgium
Mertens, K in press
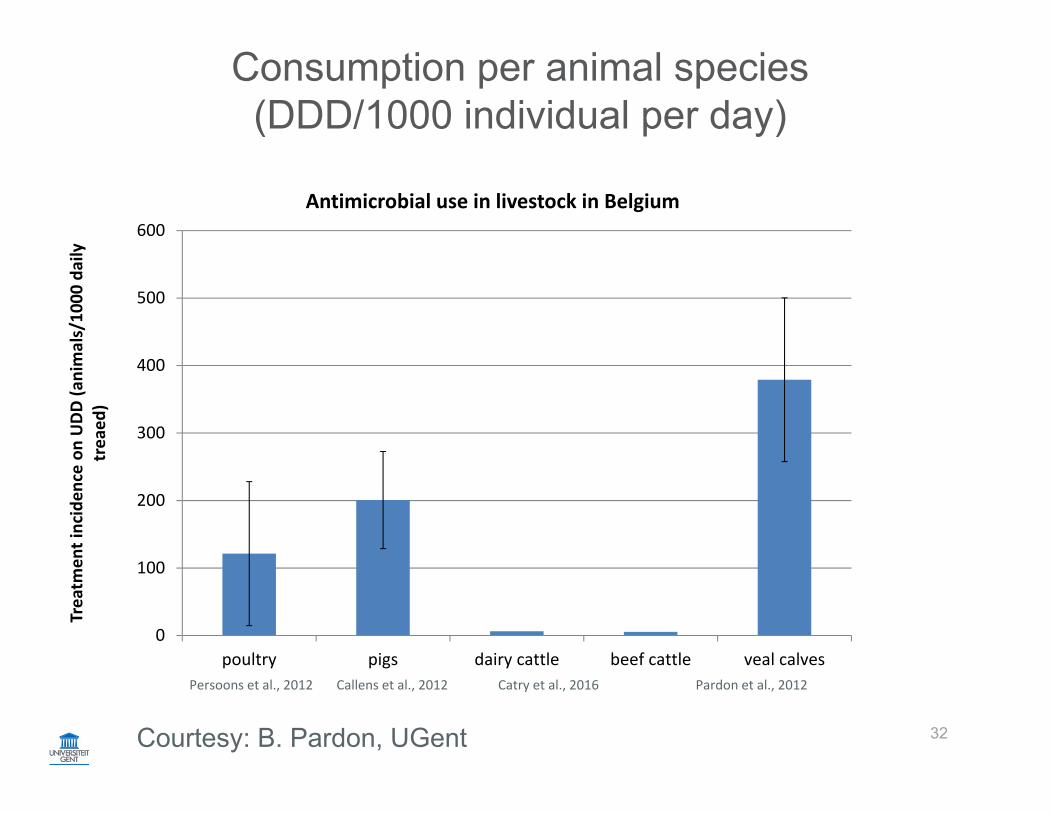
Consumption per animal species(DDD/1000 individual per day)
32
Persoons et al., 2012 Callens et al., 2012 Catry et al., 2016 Pardon et al., 2012
0
100
200
300
400
500
600
poultry pigs dairy cattle beef cattle veal calves
Treatm
ent inciden
ce on UDD (a
nimals/10
00 daily
treaed
)
Antimicrobial use in livestock in Belgium
Courtesy: B. Pardon, UGent

BelVetSac.ugent.be


Results prevalence 2011-2017:Descriptive Statistics
Resistance >50% 2011-2017 Ampicillin, Tetracycline, SulphamethoxazoleTrimethoprim
0
10
20
30
40
50
60
70
80
90
100
2011 2012 2013 2014 2015 2016 2017
Res
ista
nce
(%)
Years
Resistance strains prevalenceVeal calves - E. coli
Ampicillin
Sulphamethoxazole
Tetracycline
Trimethoprim

Results prevalence 2011-2017:Descriptive Statistics
Sulphamethoxazole: 22,50 % (2017)
0
10
20
30
40
50
60
70
80
90
100
2011 2012 2013 2014 2015 2016 2017
Res
ista
nce
(%)
Years
Resistance strains prevalenceBeef cattle - E. coli
Ampicillin
Chloramphenicol
Gentamicin
Nalidixic acid
Sulphamethoxazole
Tetracycline
Trimethoprim

N E. coli = >27 000; 5808; 812 (2005-2015)


Campylobacter jejuni in Poultry Meat (2017)
• % Sensible stable
• Co-R to CipNalTet (2 AB families) remains high and stable

S a l m o n e l l a P o r c i n e m e a t ( P R I 0 3 1 ) E U - A M R
Project nEU AMR Autocontrole 46
EU AMR Gembloux 17
EU AMR Melle 38Total 101
Famille d’AB n %sensible 24 26.371 10 10.992 6 6.59≥3 51 56.04

Antimicrobial consumption (J01) per animal species
41
Persoons et al., 2012 Callens et al., 2012 Catry et al., 2016 Pardon et al., 2012
0
100
200
300
400
500
600
poultry pigs dairy cattle beef cattle veal calves
Treatm
ent inciden
ce on UDD (a
nimals/10
00 daily
treaed
)
Antimicrobial use in livestock in Belgium
Courtesy: B. Pardon, UGent

Anticaterial use (J01) stratified by type of hospitals
Vandael et al, 2018

EARS-net Belgium
Mertens, K in press

Antimicrobial consumption (J01) per animal species
44
Persoons et al., 2012 Callens et al., 2012 Catry et al., 2016 Pardon et al., 2012
0
100
200
300
400
500
600
poultry pigs dairy cattle beef cattle veal calves
Treatm
ent inciden
ce on UDD (a
nimals/10
00 daily
treaed
)
Antimicrobial use in livestock in Belgium
Courtesy: B. Pardon, UGent

Antibacterial use Belgium, Intensive care vs hospital wide
Vandael et al., 2018

Antimicrobial consumption (J01) per animal species
46
Persoons et al., 2012 Callens et al., 2012 Catry et al., 2016 Pardon et al., 2012
0
100
200
300
400
500
600
poultry pigs dairy cattle beef cattle veal calves
Treatm
ent inciden
ce on UDD (a
nimals/10
00 daily
treaed
)
Antimicrobial use in livestock in Belgium
Courtesy: B. Pardon, UGent

Antibacterial consumption Belgium, 2017
Antibacterials for systemic use (ATC group J01)
Consumption of antibacterials for systemic use (ATC group J01) in the community (primary care sector) and the hospital sector expressed in DDD per 1000 inhabitants and per day in 2017
ATC group J01 Community (primary care sector)
Hospital sector
Beta-lactam antibacterials, penicillins (J01C) 14.48 0.97
Other beta-lactam antibacterials (J01D) 1.17 0.40
Tetracyclines (J01A) 1.92 0.02
Macrolides, lincosamides and streptogramins (J01F) 3.41 0.11
Quinolone antibacterials (J01M) 2.17 0.19
Sulfonamides and trimethoprim (J01E) 0.19 0.04
Other J01 substances 2.55 0.16
Total 25.89 1.89
577,1 (2016)

Concluding remarks
Focus on hospital consumption, stratified by type of hospitals
Reflection in tertiary hospitals is urgently needed, in particular ICU
(e.g. Guidelines vs Systematic reviews)
Do no limit focus on acquired multidrug resistance
(HAI at large, CDIF, ILI, mycoses, adverse events….)
- Hand hygiene campaigns should be further elaborated
Requirements: realtime feedback AM consumption
= Prerequisite for containment during outbreaks (Outbreak support team)
- allows also rapid evaluation of (inter)national intervention strategies
One health: direct contact with animals has been underestimated for years
Future deliverable: AM & AMR geographical mapping, stratified and open data

Acute care hospitals, AB consumption
Vandael et al., 2018

Acknowledgements: The NSIH team, BAPCOC, NRCs
the labs & hospitals & nursing homes & healthcare workers
[email protected]@sciensano.be