
RESIN TRANSFER MOLDING OF TEXTILE PREFORMS FOR … · problems during resin infiltration. Resin...
16
/_ •[ " /' ', / r RESIN TRANSFER MOLDING OF TEXTILE PREFORMS FOR AIRCRAFT STRUCTURAL APPLICATIONS Gregory H. Hasko Lockheed Engineering & Sciences Co. Langley Program Office 144 Research Drive Hampton, VA 23666 (804) 864-3093 H. Benson Dexter NASA Langley Research Center Mail Stop 188B Hampton, VA 23665-5225 (804) 864-3094 Mark H. Weideman Virginia Polytechnic Institute and State University Blacksburg, VA 24061 (703) 231-4713 1303 https://ntrs.nasa.gov/search.jsp?R=19950021855 2020-06-03T16:25:42+00:00Z
Transcript of RESIN TRANSFER MOLDING OF TEXTILE PREFORMS FOR … · problems during resin infiltration. Resin...
/_ • [ " /'
N95- 28275
', / r
RESIN TRANSFER MOLDING OF TEXTILE PREFORMS FORAIRCRAFT STRUCTURAL APPLICATIONS
Gregory H. HaskoLockheed Engineering & Sciences Co.
Langley Program Office144 Research Drive
Hampton, VA 23666(804) 864-3093
H. Benson Dexter
NASA Langley Research CenterMail Stop 188B
Hampton, VA 23665-5225(804) 864-3094
Mark H. Weideman
Virginia Polytechnic Institute and State UniversityBlacksburg, VA 24061
(703) 231-4713
1303
https://ntrs.nasa.gov/search.jsp?R=19950021855 2020-06-03T16:25:42+00:00Z

INTRODUCTION
TheNASA LangleyResearchCenteris conductingandsupportingresearchto developcost-effectivefabricationmethodsthatareapplicableto primarycompositeaircraftstructures.Oneofthemostpromisingfabricationmethodsthathasevolvedisresintransfermolding(RTM) of drytextilematerialforms. RTM hasbeenusedfor manyyearsfor secondarystructures,buthasreceivedincreasedemphasisbecauseit is anexcellentmethodfor applyingresintodamage-toleranttextilepreformsat low cost. Textilepreformsbasedonprocessessuchasweaving,braiding,knitting, stitching,andcombinationsof thesehavebeenshowntooffer significantimprovementsindamagetolerancecomparedto laminatedtapecomposites.Theuseof low-costresinscombinedwith textilepreformscouldprovideamajorbreakthroughin achievingcost-effectivecompositeaircraftstructures.RTM usesresinin its lowestcostform,andstorageandspoilagecostsareminimal. Nearnetshapetextilepreformsareexpectedto becost-effectivebecauseautomatedmachinescanbeusedto producethepreforms,post-cureoperationssuchasmachiningandfasteningareminimized,andmaterialscrapratemaybereducedin comparisonwith traditionalprepregmolding.
SuccessfulRTM is dependentuponmanyfactors,includingtoolingapproaches,resincharacteristics,andtextilepreformarchitecture.Locationof resininjectionportsin themold,resinviscosityvariationwith timeandtemperature,andcompactionandpermeabilitycharacteristicsofpreformsareall importantfactorsthatmustbeunderstood.Manyof theRTM processesusedinthepastweredevelopedusingtrial anderrormethods.Low fiber volumefraction(50percentorless)secondarystructuresusingfiberglassmatsarereadilymoldedby RTM. However,aircraft-qualityprimarystructureshavestringentstructuralrequirementsandprocessingconditions,necessitatingascience-basedapproachto RTM processdevelopment.Thepurposeof thispaperisto discussexperimentalandanalyticaltechniquesthatareunderdevelopmentatNASA Langleytoaidtheengineerin developingRTM processesfor airframestructuralelements.Includedareexperimentaltechniquestocharacterizepreformandresinbehaviorandanalyticalmethodsthathavebeendevelopedto predictresinflow andcurekinetics.
TheNASA LangleyRTM developmentteamincludesin-housestaffdevotedtoprocessdevelopment,elementfabrication,andcompositematerialcharacterization;VirginiaPolytechnicInstituteandStateUniversityperformingpreformcharacterizationandanalyticalmodeling;theCollegeof William andMarydevelopingresincharacterizationdataandsensorsystems;andindustrialcontractors(Douglas,Boeing,Lockheed,andGrumman)involvedin processdevelopment,toolingstudies,andsubcomponentfabrication.
RESINTRANSFERMOLDING
ThetermRTM isoftenusedratherlooselyto includeseveralprocessessuchasvacuum/pressureinfiltration, resinfilm infusion,andliquid pressureinjection. In all cases,liquidresininfiltratesadry preform,air is evacuated,andheatis appliedto curethecomposite.Severaldifferenttypesof toolingconceptshavebeendevelopedto accommodateRTM variations.Thepreformmaybeplacedin a matchedcavitymoldor ona single-sidedmoldandcoveredwithaflexiblemembrane.Basedon thecharacteristicsof theresin(liquid or solidatroomtemperature,shortor longgel time),infiltration mayoccurisothermallyor duringheat-up.Pressure used tocompact the preform may also drive the flow of resin, or the compaction and injection pressuresmay be controlled separately.
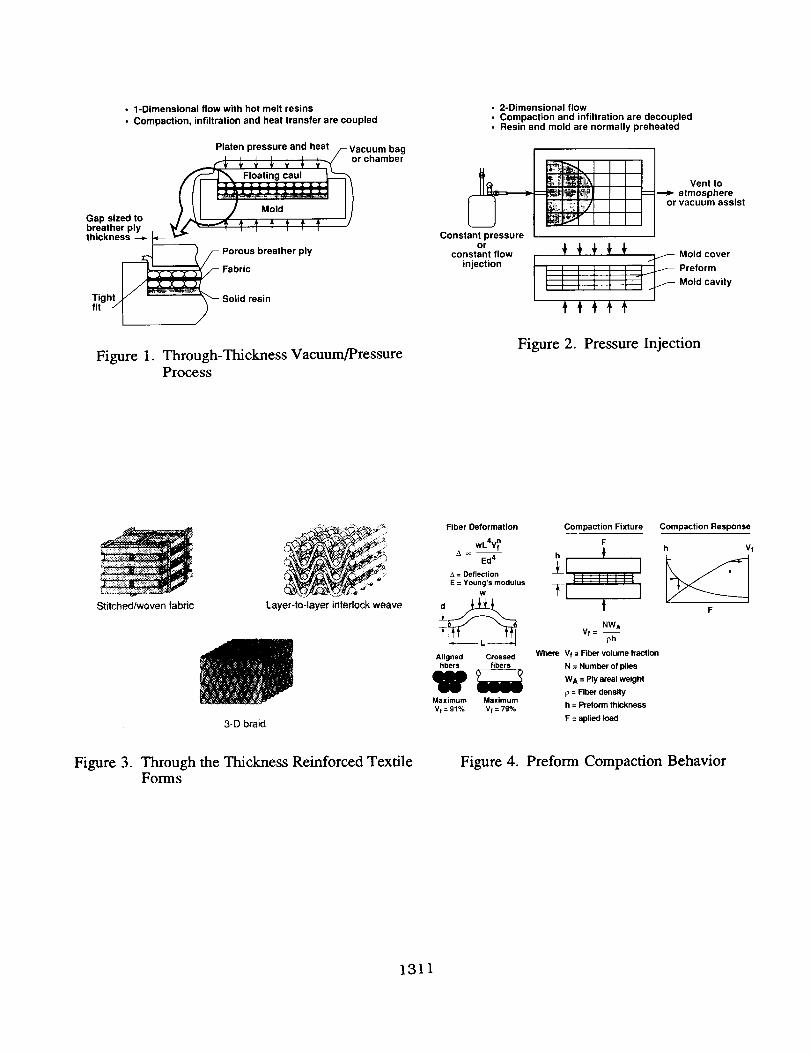
Figure 1 illustrates the process (vacuum/pressure infiltration) used at NASA Langley tofabricate panels from preforms having through-the-thickness reinforcement using hot melt epoxy
1304
resins.Flow occurs through the thickness of the preform as the resin melts and pressure is applied
in a heated press. A tight fit is required between the preform and mold cavity to avoid a resin leakpath around the preform. The pressure performs two functions: debulking the preform, andforcing the resin into the preform.
Figure 2 shows a typical matched cavity process employing pressure injection of resin. Flowoccurs in the plane of the preform. Resin is contained in an extemal tank, which may be heated tolower the viscosity. Compaction pressure is used to close the mold and debulk the preform and is
independent of resin injection pressure.
Some versions of RTM employ a combination of features of the two processes shown,
leading to many variations of mold construction and process parameters. Analytical methods areneeded to aid the mold designer and process engineer to minimize the waste of time and material.
Successful modeling requires data on preform and resin processing properties; however, most ofthese data are not supplied by the preform or resin manufacturers. NASA Langley has sponsored
the development of characterization methods for constituent materials and analytical modelsdescribing the RTM process. Recent results of this research are discussed herein.
Preform B¢hovior
Textile preforms are deformable and porous in their dry state. The amount of rigidity andpermeability is related to the fiber architecture. Several preform architectures are illustrated infigure 3. Another factor affecting preform rigidity and permeability is the size and type of theconstituent fibers. High modulus, brittle fibers impose limits on the amount of crimp and tightnessof the preform as it is produced. When compressed in the thickness direction, preforms exhibitnonlinear behavior as shown in figure 4. The reasons for the nonlinearity are that fibers deform by
bending, behaving as constrained beams, by buckling, behaving as constrained columns, and alsoslide past each other with variable friction effects.
Compaction characteristics of preforms are quantified by mounting a sample between rigidplates, applying a compaction load and measuring the resulting thickness as shown in figure 4.Data are plotted in terms of fiber volume fraction, which is directly related to thickness, againstpressure in figure 5. As indicated in the figure, none of the preforms meets the typical goal of 60
percent fiber volume in the uncompacted condition. Stitching helps to compact the Hexcel 1preform, but it still falls short of the goal. In all cases shown, pressure in excess of vacuum (14.7psi) must be applied to achieve the desired compaction.
Permeability is also a nonlinear function of preform compaction pressure. Pores existbetween fiber bundles (tows) and at the tow intersections in the preform. If a preform is visualized
as a collection of planar pores, the pressure drop at a fixed volumetric flow rate is proportional tothe third power of pore height (ref. 1), which is proportional to fiber volume fraction. In addition,pores may change shape or close off entirely as compaction pressure and fiber volume fractionincrease. Pores formed by aligned tows form a fairly smooth flow path, whereas pores formed bycrossed tows create a much more tortuous path for resin flow as shown in figure 6.
1The use of trademarks of names of manufacturers in this paper does not constitute an official
endorsement, either expressed or implied, of such products or manufacturers by the NationalAeronautics and Space Administration.
1305
Permeabilityismeasuredin aspeciallydesignedfixtureasshownin figure7. Thesampleisplacedin asealedchamberof variableheight.Thechamberis configuredto allow flow in onlyoneof thethreeprimarydirectionsat atime. Fluid of aknownviscosityis pumpedthroughthepreform,andtheresultingpressuredropisrecorded.Permeabilityiscalculatedby multiplyingflow rate,viscosity,andflow lengthanddividing by theproductof flow pressureandarea.Thistestis repeatedat severalpreformthicknesses.Resultsareshownin figure 8for a stitchedandunstitchedquasi-isotropicuniweavepreform. Twoeffectsaresignificant: permeabilityis muchhigherin-planethanthrough-thickness,andthepresenceof stitchesaffectsflow differentlyin thetwodirections.Thestitchescreatechannelsthroughthethicknessof thepreformwhich increasepermeabilityin thatdirection.However,theyalsoform apartialbarrierto flow in theplaneof thepreform,therebyreducingin-planepermeability.
Permeabilityinformationis usefulinprocessdevelopmentatanumberof levels. Molds are
sometimes designed so that infiltration occurs below the target fiber volume fraction of 60 percentso that permeability is high; then full compaction is applied mechanically prior to gelation tosqueeze out excess resin. However, this procedure is difficult for complex shapes. Anothertechnique is to take advantage of thermal expansion differences between mold components to
achieve the same effect. For example, silicone blocks placed inside an aluminum mold will expandand compact the preform as temperature increases. Injection occurs at moderate temperature andlow fiber volume fraction. The final fiber volume fraction is attained at the higher curetemperature.
Mold design criteria can be partly established by consideration of permeability variation overa range of fiber volume fractions. Mold cavity machining tolerances and rigidity determine theuniformity of permeability of the preform. Figure 9 shows the permeability variation of 16 plies of8 harness satin, IM7 graphite fabric. The nominal cavity thickness required for a 60 percent fibervolume is 0.264 inches. If this dimension is allowed to vary by _+0.005 inches, the fiber volume
ranges from 59 to 61 percent. If the dimension varies by +.020 inches, the fiber volume rangesfrom 55 to 65 percent. The corresponding permeabilities are affected to a far greater degree than
the fiber volume fractions. The nominal permeability, in units of 10 -10 in 2, is 6.0. Permeability
variation with the small tolerance ranges from 5.0 to 7.4. However, the variation with the largetolerance is 2.0 to 15.6, a range of more than twice the nominal value, which will most likely causeproblems during resin infiltration.
Resin Characterization
Resins are primarily characterized by viscosity measurements under both isothermal andincreasing temperature conditions. Since viscosity behavior is affected by the existing degree of
resin cure, this parameter must also be quantified. The degree of cure ot of a resin varies with time
and temperature and is measured by differential scanning calorimetry (DSC), which records heat ofreaction during time. This test is run under both isothermal and rising temperature conditions.
Resin viscosity can range from 10 cp to 1015 cp before molecular forces restrict fluidity andelastic behavior sets in (ref. 2). Mold design features and process parameters must be selected to
account for this behavior so that a fully impregnated void-free structure is produced. Examples ofviscosity behavior are shown in figure 10, which shows viscosity as a function of time for two
epoxies, each at two selected temperatures. An important point is that these data are for freshlyformulated resins with no impurities; viscosity may be drastically affected by improper storage orformulation, and its dependence on time at temperature can vary substantially.
For RTM, it is desirable to tailor a mold and process window for minimum viscosity for thelongest time. A relatively viscous resin such as 3501-6 (see figure 10) is recommended for a
through-thickness RTM process only. A resin with low viscosity and short gel time such as
1306

E905L can be used for in-plane injection, but would require multiple inlet ports to rapidly fill largemolds. The E905L has acceptable pot life as long as the temperature is carefully controlled. Otherresins that have been evaluated by NASA Langley are listed in figure 11. Difficulties arise when aprocess is optimized for a specific resin, but a decision is made to alter the resin formulation orswitch to an entirely new resin. Such changes may not require mold redesign in the case of aprepreg material, but may require an existing RTM mold to be discarded in favor of a new design.Adjusting the process parameters may, however, in some cases allow continued use of the existingmold. These examples highlight the need for a predictive model of resin behavior if high-quality,defect-free composites are to be fabricated.
Tackifiers
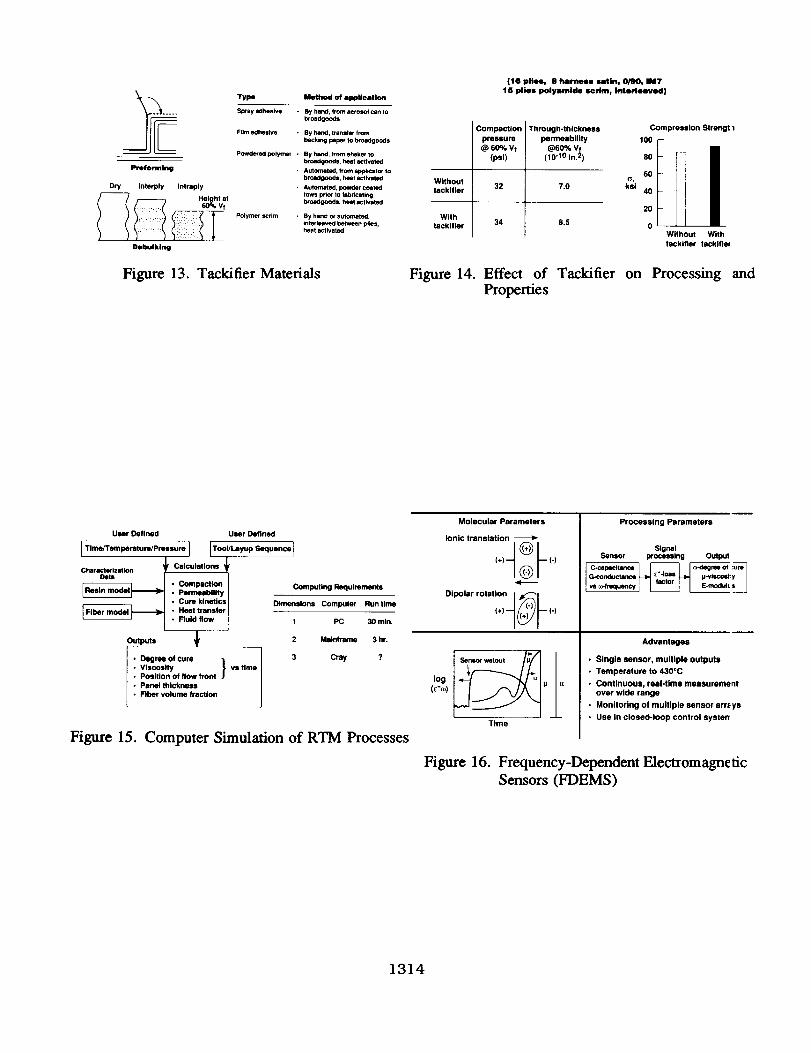
In some cases, textile processes yield a nearly net-shaped preform, such as braiding directlyover a mandrel which is part of a RTM mold. However, in most cases, the textile product issupplied on a roll. The composite fabricator unrolls the material and cuts patterns that areassembled into the final three-dimensional preform. For complex shapes, the assembly processmust be aided either mechanically, such as by stitching, or by bonding with tackifying agents asdescribed below. Figure 12 illustrates a preform for a sine spar. Several plies of a multiaxial warpknit fabric were assembled using a tackifier and a shaping mold.
Another reason for using these tackifier preforming aids is to debulk the preform. As shown
previously, even high density stitching does not fully debulk preforms. Tackifiers applied only tosurfaces of plies do not fully debulk the entire thickness, as shown schematically in figure 13. Theonly ways to fully debulk a preform are by distributing a tackifier through the entire thickness (asby using powder-coated tows for the weaving process), by maintaining in-plane tension (as whenbraiding over a mandrel), or upon closing the mold. Considerable effort sometimes is needed todevise methods of closing molds without pinching or wrinkling preforms. The proper use of atackifier would simplify the mold design.
Several types of tackifiers are listed in figure 13. They are available in a wide range ofapplication temperatures and physical forms, from room temperature sprays to higher temperaturescrims. Some are thermoplastics that remain as a discrete phase in the composite after cure, whileothers are formulated to dissolve in the matrix resin during infiltration. In any case, two criteriamust be met: they must have minimal impact on resin infiltration, and they must have minimal
impact on mechanical properties.
The effects of one type of tackifier (a polyamide scrim interleaved between each ply) onprocessing and mechanical properties of an eight harness satin fabric are shown in figure 14. Boththe compaction pressure and the permeability at 60 percent fiber volume are very similar both withand without the tackifier. There is also little difference in room temperature static compressionstrength.
SCIENCE-BASED RTM PROCESSING
RTM Process Modeling
The approach in developing a process model for RTM has been to derive expressions forone-dimensional flow including all relevant physical effects, verify the model experimentally, then
expand to complex geometries.
The flow of fluid through porous media obeys Darcy's law:
1307

= 7A (1)
where Q is the volumetric flow rate, K is the preform permeability, ].t is the resin viscosity, AP isthe pressure difference between the resin source and the flow front over a distance X, and A is thearea normal to the direction of flow. This is a simple equation, but complexity arises because Kvaries with fiber volume fraction VF and fiber orientation; g varies with temperature T, time t and
degree of cure or; and complex geometries include the Y and Z dimensions in which A may also
vary.
For a simple isothermal one-dimensional case with a nonreacting resin and homogeneousincompressible preform, infiltration pressure and mold filling time can be calculated by hand usingequation (1). However, the vacuum/pressure through-thickness process involves the simultaneousinteraction of all of the parameters in both time and space. A computer is required to expedite thesolution.
A computer model of the RTM process has been under development at Virginia PolytechnicInstitute and State University. Basic features of this model are shown schematically in figure 15.The user specifies the process conditions and mold configuration. The main program calls upsubroutines that contain data for the specific preform and resin. The program outputs values oftemperature, viscosity, position of flow front, degree of cure, fiber volume fraction, and thickness.
Details conceming the calculations performed in the main program are described in reference
3. Compaction behavior is modeled with a logarithmic expansion which requires four constants tobe determined experimentally. Permeability is related to fiber volume fraction using the Kozeny-Carman or Gebart equations, each of which requires an experimentally-determined constant. Resinviscosity is modeled using either an exponential or a William-Landel-Ferry expression, whichrelate viscosity to temperature and degree of cure. Material properties for these expressions aredetermined from viscosity and DSC tests. The degree of cure of a given resin is related to heat ofreaction and can be modeled with exponential equations relating time and temperature history. Theform of these equations can be very different for various resins, and considerable judgement andanalysis of DSC information are required for accurate modeling. Once the forms of the degree ofcure equations are selected, several material constants must be determined from DSC data.
Transient conductive heat flow is a major factor in the through-the-thickness process with hotmelt resins. The heat flow model includes the change in thermal conductivity as resin infiltrates the
preform and accounts for heat generated by the resin cure reaction. Convective heat transferbetween the preform and slowly moving resin is neglected. Material thermal properties are takenfrom published sources. Heat generation from the resin reaction is determined from the degree ofcure calculation.
The flow front position is calculated using a finite element procedure in discrete timeincrements. Darcy's Law is applied to each element between the resin source and the flow front,using the instantaneous values of permeability and viscosity for each element.
Computing requirements are related to the dimensions of the problem as indicated in figure15. The one-dimensional model will run on a personal computer in 1/2 hour or less. However,the two- and three-dimensional models require larger computers and more time. The added
complexity of higher order models arises because of the orthotropic permeability of preforms andthe need to calculate flow front position in multiple directions.
1308
RTM Process MQnitQfing and Control
The College of William and Mary has been developing a sensing system for the cure state ofresins based on dielectric measurements. This system, termed Frequency-Dependent
Electromagnetic Sensing (FDEMS), figure 16, utilizes a thin (0.003 inch) sensor consisting ofinterdigitated electrodes mounted on a substrate. The sensor is excited by an alternating electriccurrent at various frequencies, which in turn causes molecular vibration in the resin. Themolecular action changes as the reaction proceeds, which alters the electrical conductivity and
capacitance of the resin. FDEMS correlates electrical conductivity and capacitance to resinviscosity and degree of cure. This system can be applied to any of the RTM process variations todetect the presence or absence of resin, local viscosity, and degree of cure.
Another use of FDEMS is to enable process control based on sensing the direct process
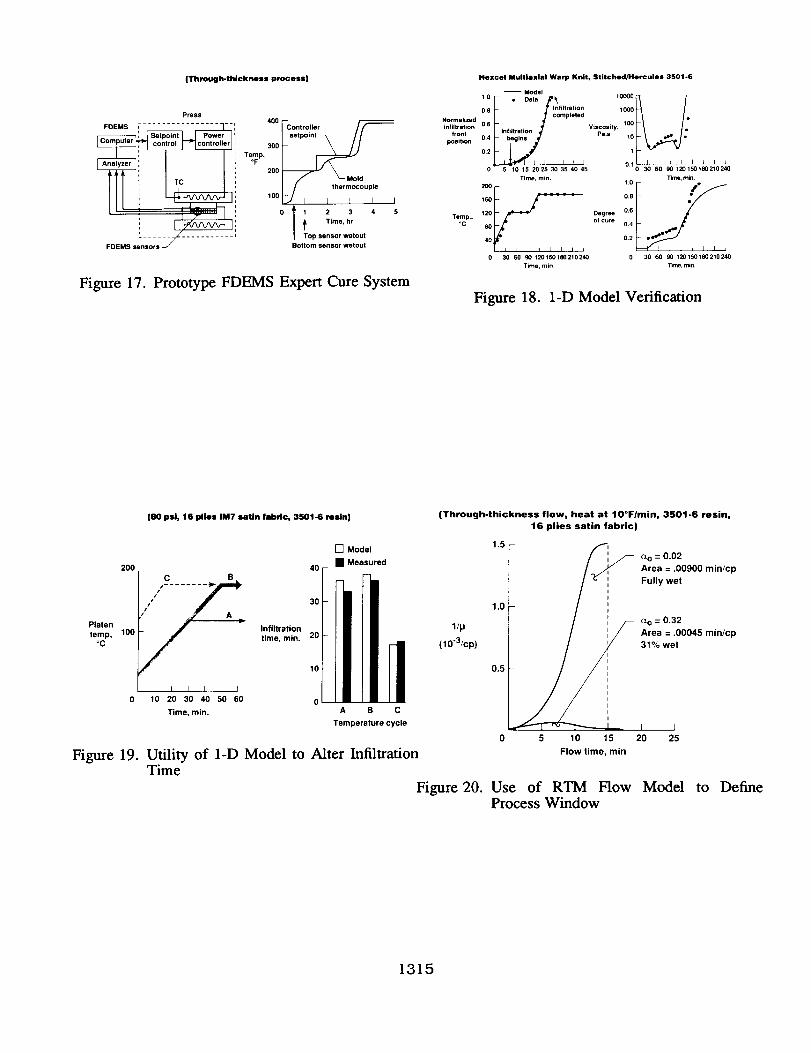
variables (viscosity, degree of cure) in real time, as opposed to the traditional method of controllingindirect variables (mold temperature, time) per a predefined cycle. This procedure is illustrated in
figure 17. Panels have been made with the through-the-thickness infusion process under directcontrol of temperature by the FDEMS system. The system was programmed to maintain a preheat
temperature until both bottom and top sensors indicated wet-out, then to proceed with the cure
cycle.
The use of the FDEMS system in a control mode is being expanded to include larger parts
with more complex flow paths, emerging resins, and control of pressure cycles.
Model Verification and Utilization
The one-dimensional model has been verified using a through-the-thickness infusion process
with three different preforms, 3501-6 resin, and several cure cycles (ref. 3). The mold wasinstrumented with thermocouples for determining temperature distribution, a dial gage to measure
platen deflection for correlation with flow front position, and the FDEMS system to monitorviscosity and degree of cure, and to verify complete infiltration. Results for one case are shown infigure 18. Agreement is very good for temperature and flow front calculations; predictions ofviscosity and degree of cure, although showing some disagreement with experimentalobservations, are still reasonable.
The model was used to derive alternate cure cycles for panels of 0.25 inch nominal thickness
as shown in figure 19. The resin manufacturer recommended a moderate temperature hold duringinfiltration, cycle A. The model was run with the manufacturer's and two other heating cycles:
ramping to the cure temperature, cycle B, and preheating the platens, cycle C. Predicted infiltrationtimes agree well with experimentally determined values, with cycle C reducing infiltration time by
50 percent.
A further example of the utility of the model is in deciding whether to use or discard an aged
sample of resin. The degree of cure advancement during storage, Ct.o, is determined from a DSCtest. For example, hypothetical values of 0.02 and 0.30 were entered in the model, which was runwith one of the above cure cycles. The case with aged resin predicts infiltration into only about 1/3of the full thickness before gelation occurs, whereas full infiltration was predicted for fresh resin.The reason for the difference can be explained by plotting the reciprocal of viscosity against timefor the resin flow front, as in figure 20. The areas under the curves are related to the processwindow. For fresh resin, the area is .00900 min/cp, whereas for the aged resin, the area is only
1309

.00045min/cp. Furthermodelrunswith agedresinandfewerpliesindicatemorecompleteinfiltration, with saturationoccurringat0.063inchthickness.If this is not thick enoughfor theuser,theresinshouldbediscarded.
SUMMARY
Resintransfermolding(RTM) is apromisingmethodfor cost-effectivefabricationofcompositestructureshavingawiderangeof preformarchitecturesandresinprocessingrequirements.Thelargerangeof variationsof theprocessandof materialbehaviorrequiresthatascience-basedunderstandingbeappliedto thedesignof moldsandthedevelopmentof curecycles.
Characterizationtestson textilepreformshaveshownthatcompactionpressurein excessofambientvacuumisrequiredto achievea60percentfiber volume. Permeabilityof preformscandiffer byat leasttwoordersof magnitudebetweenthein-planeandthrough-thicknessdirections.Theeffectsof secondarymaterialssuchasstitchesandtackifiersoncompactionandpermeabilityshouldalsobequantified.
Resinflow andcurekineticshavebeensuccessfullymodeledmathematically.Flowsimulationscanbeperformedonacomputerin orderto savelaborandmaterialsduringprocessdevelopment.Frequency-dependentdielectricsensorshavebeenshownto bebeneficialin bothmonitoringandcontrollingtheRTM process.
Researchsupportedby NASA Langleyin developingtherequiredprocessmodels,databases,andsensingsystemsis beginningtoyield solutionsto practicalproblems.Thework iscurrentlybeingexpandedtoencompassa widerrangeof geometriesandmaterials.
REFERENCES
.
.
.
Rothbart, H.A.: Mechanical Design and Systems Handbook, 2nd Edition, McGraw-HillBook Co., 1986, pp. 43-15.
Van Vlack, L. H.: Materials Science for Engineers, Addison-Wesley Publishing Co., Inc.,1970, p. 232.
Weideman, M.H.: An Infiltration/Cure Model for Manufacture of Fabric Composites by theResin Infusion Process, Masters Thesis, Virginia Polytechnic Institute and State University,Blacksburg, Virginia, 1991.
1310
• 1-Dimensional flow with hot melt resins
• Compaction, infiltration and heat transfer are coupled
Platen pressure and heat/- Vacuum bag
__j_ _ _ _ _ _ _, qorchamber
f(.-'--J_ Floating caul
)./I J .o,° I)Gap sized to _/_ _ _ _ _ ¢ ¢ ,,breather ply ,,thickness --_ _- _ ' ' ' ' ' ' '
_ Porous breather ply
Fabric
Titg Solid resin
Figure 1. Through-Thickness Vacuum]PressureProcess
• 2-Dimensional flow
• Compaction and infiltration are decoupled• Resin and mold are normally preheated
t --;r_ _ atmosphere
.I ,_ vacuum assist
Constant por
constant flow Mold cover
injection Preform
Mold cavity
Figure 2. Pressure Injection
Stitched/woven fabric Layer-to-layer interlock weave
3-D braid
Fiber Deformation Compaction Fixture
wL4V_ F_-- h _
11 IA = DeflectionE = Young's modulus
w TI I
T vf = NWAph
Aligned Crossed Where Vf = Fiber volume fraction
fibers fibers N = Number of plies
_1) _ WA = Ply areal weightp = Fiber density
Maximum MaximumVf = 91% Vf = 79% h = Preform thickness
F = aplied load
Compaction Response
h Vt
Figure 3. Through the Thickness Reinforced TextileForms
Figure 4. Preform Compaction Behavior
1311

Fibervolume
fraction,Vf
.70
.65
.60
.55
.50
.45
.40
.35
.30
Hexcel AS4multisxlal warp knit
stitched
unslitlched __ __....
/ / _ volume
_/_ AS4 triaxial braid fraction J
/
II I I J J
I 50 1O0 150 200
Vacuum Compaction pressure, psigbag
Figure 5. Preform Compaction Data
Along Tows Across Tows
Figure 6. Flow Through Pores in Fibrous PrefoJ'ms
Permeability Fixture
nl--""'g,l,l,l,l_ _ preform
i1Ex..__r _ mflow [j _=_ _ x Fabric preform
R II __j test sample
,owmeter _lll App,,edcompeer,'on
[_::::= _1- load
Inlet flow
Permeability Behavior
Increasing
P
VI
Figure 7. Preform Permeability Measurement
AS4 3K Uniweave (+451-45/0/90)
10-6
10-7
10.8
Preform
permesbilty, 10-9K, In. 2
10 -10
10 -11
10 -12
....... Stitched
-- Unstitched
_/_ i k I0.5 0.6 0.7
Fiber volume fraction, Vf
Figure 8. Preform Permeability Data
In-plane
Out-of-plane
J
0.8
1312

Permeability,
10 -10 in, 2
20
15
10
5
Mold Fiber
cavity volumesize
Nominal .264"
Small tolerance +.005"
i )020''
55 60 65 70
Fiber volume fraction, %
Through-thickness
permeability
traction (10-1o in2)
60% 6.0
59-61% 7.4-5.0
55-65% 15.6-2.0
Figure 9. Permeability Variation of Satin Fabric
100,1)00
10,000
Viscosity, 1000cp
100
J10
0 150
(Water : t cp)
" HerculesI "I 3501-6
127°C. _ _ 88°C -- .---
I I
50 1 0O
Time, min.
Figure 10 Effect of Time and Temperature onViscosity of Epoxy Resins
Hercules 3501-6 Hot melt
Dow CET 2 Hot melt
3M PR500 Paste
Dow Tactix 138/H41 Liquid
BP E905L Liquid
Shell 1895/W Liquid
Shell 862/763 Liquid
Figure 11. Resins Evaluated
Figure 12. Preform for Sine Wave Spar
1313
___ Type
Spray adhesive *
Film adhesive
PowCmr_01polymer -
Pretorming
Dry Interply Intraply
__ Height at
60% Vt
_ --_ Po(ymer scrim •
DebulklrlRl
Methyl of ap_icatlon
By hand, fi_om aerosol can lobroadgoods
By hand, transfer ;ram
backing poper 10broadgoods
By hDnd, from shaker to
broedgoods, heat _lValed
Automated, from ap_kcator tobroadgoods, heat ectlvlled
Auto_'_lldl powOer coeled
lOWS prior lo fabricatingbroadgoods, heal acllvated
By hand o* automated,interleaved between plies,heel 8cllveled
Figure 13. Tackifier Materials
{16 plies, 8 harness satin, 0/90, IM7
15 plies polylmlde scrim, Interleaved)
Without
tacklfler
With
tacklfler
Compaction
pleasure
@ 60% Vt
(psi)
32
34
Through-thickness Compression Strengt 1
(10 -t0 In. 2) 80
6OG,
7.0 ksi 40
2O
8.5 0
Without With
tackifler tacklfief
Figure 14. Effect of Tackifier on Processing andProperties
User Defined
I Tlme/Tem perature/Pressure I
Characterization _f Calculations _
_1.Com. iooI_ • Por_m._ I
• Cure kinetics I
I Fiber model _ • Heat transfer I
l..u,d,ow i
Outputs
• Degree of cure /
Viscosity / vs timePosition of flow front
• Panel thickness
• Fiber volume traction
User Defined
I Tool/Layup Sequence F
Computing Requlremern
Dimensions Compuler Run time
1 PC 30 rain.
2 Mainframe 3 hr
3 cr_ ?
Figure 15. Computer Simulation of RTM Processes
log(c"_)
Molecular Parameters
Ionic translation _>
Dlp°lar r°tat ::,n _ _I_ 1.)
Time
Processing Parameters
SignalSensor processing Output
Advantages
• Single sensor, multiple outputs
• Temperature to 430"C
• Continuous, real-time measurement
over wide range
• Monitoring of multiple sensor arrays
• Use in closed-loop control systen
Figure 16. Frequency-Dependent ElectromagneticSensors (FDEMS)
1314
iThrot_lh.thickness process)
Press
400 [-Controller
t herm0couple
100_/ i L I I
0 1 2 3 4
Time, hr
Top sensor wetout
Bottom sensor wetout
Figure 17. Prototype FDEMS Expert Cure System
Hexcel Multlaxlal WaiT) Knit, Stitched/Hercules 3501-6
-- Model
0.8 )ifl_ InflltraliOn 1000
completed •Normalized 0,6 , 100infiltration Vlscosdy,
Infiltrollon Pe s •from
position 0.4 begins " 10 • _ •
0.2 1
] I I i 01 J k L_0- 5 1015 202530354045 " 0 30 60 90120150180210240
Temp.,oC
Time, mirl. Time, min.
200 1.0 _ _pe
1: Degree 0.6of cure 0.4
40 0.2
1 I J I L J J
0 30 60 go 120150180210240 0 30 60 90 120150180210240
Time, min. Trine, nl_n_
Figure 18. 1-D Model Verification
(80 psi, 16 plies IM7 satin fabric, 3501-6 resin)
200
Platen
temp, 100
°C
[] Model
40 - • Measured
C B
T 30-
Infiltration
time, rain. 20 -
10-
I I I I I I
10 20 30 40 50 60 0
Time, rain. A B C
Temperature cycle
(Through-thickness flow, beat at 10°F/min, 3501-6 resin,
t6 plies satin fabric)
1.5
1.0
1/p
(10"3/cp)
0.5
5 10 15
Flow lime, min
(x o = 0.02
Area = .00900 min/cp
Fully wet
_o = 0.32
Area = .00045 min/cp
31% wet
I I
0 20 25
Figure 19. Utility of 1-D Model to Alter InfiltrationTime
Figure 20. Use of RTM FlowProcess Window
Model to Define
1315

THIS PAGE INTENTIONALLY BLANK
1316

SESSION VIII
DESIGN APPLICATIONS (B)
1317

THIS PAGE INTENTIONALLY BLANK
1318