
Resilience Engineering and Safety Assessment - · PDF fileResilience Engineering and Safety...
14
© Erik Hollnagel, 2008 Resilience Engineering and Safety Assessment Erik Hollnagel Professor & Industrial Safety Chair MINES ParisTech — Crisis and Risk Research Centre Sophia Antipolis, France E-mail: [email protected] © Erik Hollnagel, 2008 Outline of presentation Safety and risk come from an engineering tradition, where risks are attributed to unreliable system components — whether human or technological. In resilience engineering, safety assessment therefore focus on what goes right, as well as on what should have gone right. WHY Safety assessments usually focus on what can go wrong, and how such developments can be prevented Resilience engineering focuses on how systems can succeed under varying and unpredictable conditions
Transcript of Resilience Engineering and Safety Assessment - · PDF fileResilience Engineering and Safety...
© Erik Hollnagel, 2008
Resilience Engineering and Safety Assessment
Erik HollnagelProfessor & Industrial Safety Chair
MINES ParisTech — Crisis and Risk Research CentreSophia Antipolis, France
E-mail: [email protected]
© Erik Hollnagel, 2008
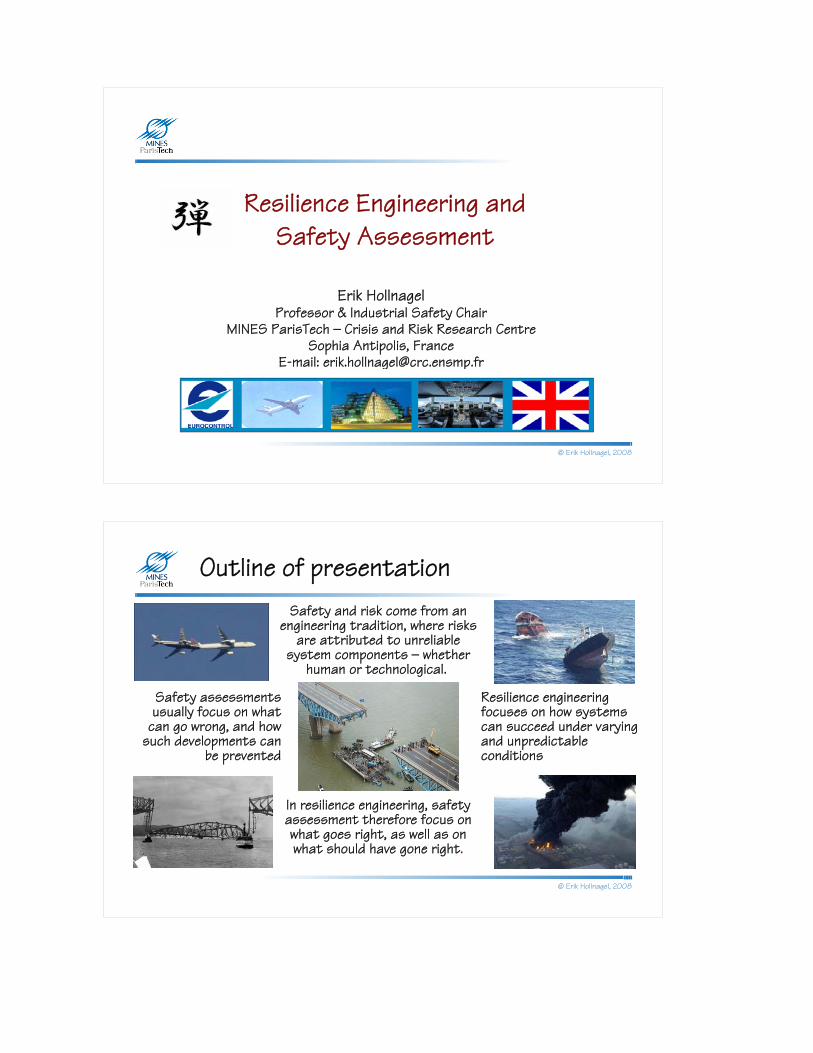
Outline of presentationSafety and risk come from an
engineering tradition, where risks are attributed to unreliable
system components — whether human or technological.
In resilience engineering, safety assessment therefore focus on what goes right, as well as on what should have gone right.
WHY
Safety assessments usually focus on what
can go wrong, and how such developments can
be prevented
Resilience engineering focuses on how systems can succeed under varying and unpredictable conditions

© Erik Hollnagel, 2008
How can we know that we are safe?
Accident analysis
Explaining and understanding what has
happened (actual causes)
Risk assessment
Predicting what may happen
(possible consequences)
In order to achieve freedom from risks, models, concepts and methods must be compatible, and be able to describe ‘reality’ in an adequate fashion.
Elimination or reduction of
attributed causes
Elimination or prevention of
potential risks
How can we know what did
go wrong?
How can we predict what
may go wrong?
© Erik Hollnagel, 2008
First there were technical failures
10
20
30
4050
60
7080
100
90
1960 1965 1970 1975 1980 1985 1990 1995
% A
ttrib
uted
cau
se
2000
Technology, equipment
2005

© Erik Hollnagel, 2008
... and technical analysis methods
1900 1910 1920 1930 1940 1950 1960 1970 1980 1990 2000 2010
FMEA
HAZOP
FMECAFault tree
© Erik Hollnagel, 2008
How do we know technology is safe?
Design principles:Architecture and components:
Models:Analysis methods:Mode of operation:
Structural stability:Functional stability:
Clear and explicitKnownFormal, explicitStandardised, validatedWell-defined (simple)High (permanent)High
© Erik Hollnagel, 2008
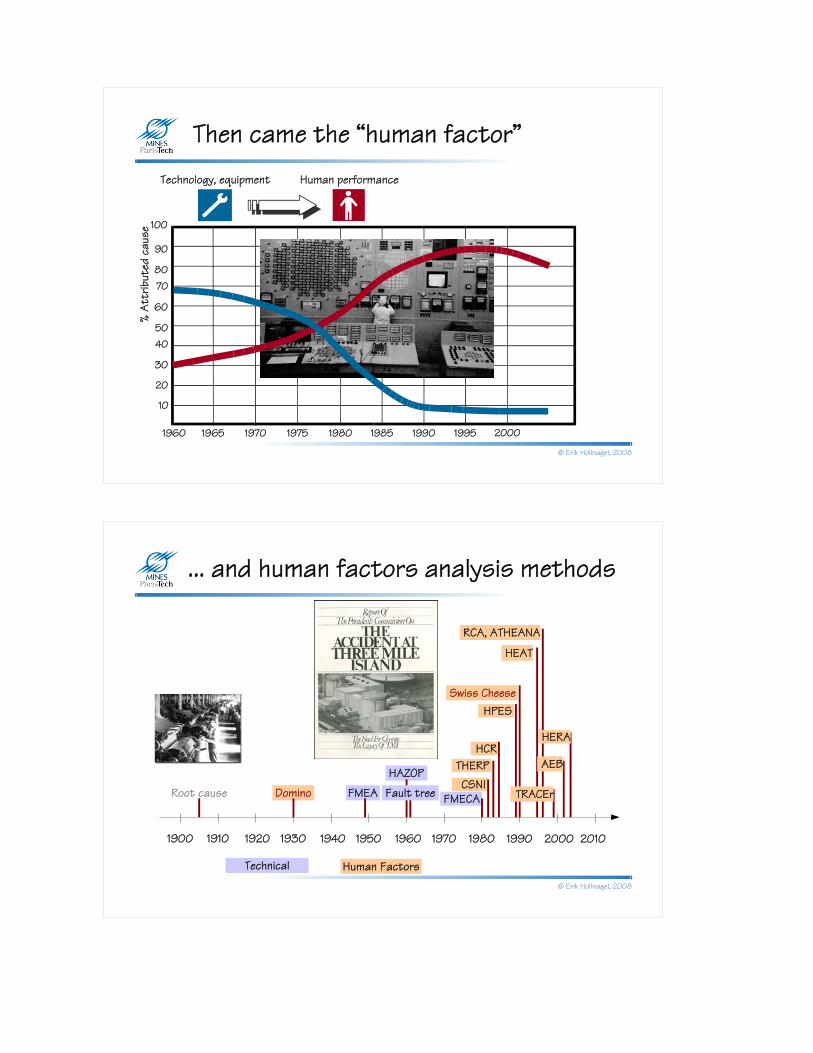
Then came the “human factor”
10
20
30
4050
60
7080
100
90
1960 1965 1970 1975 1980 1985 1990 1995
% A
ttrib
uted
cau
se
2000
Technology, equipment Human performance
© Erik Hollnagel, 2008
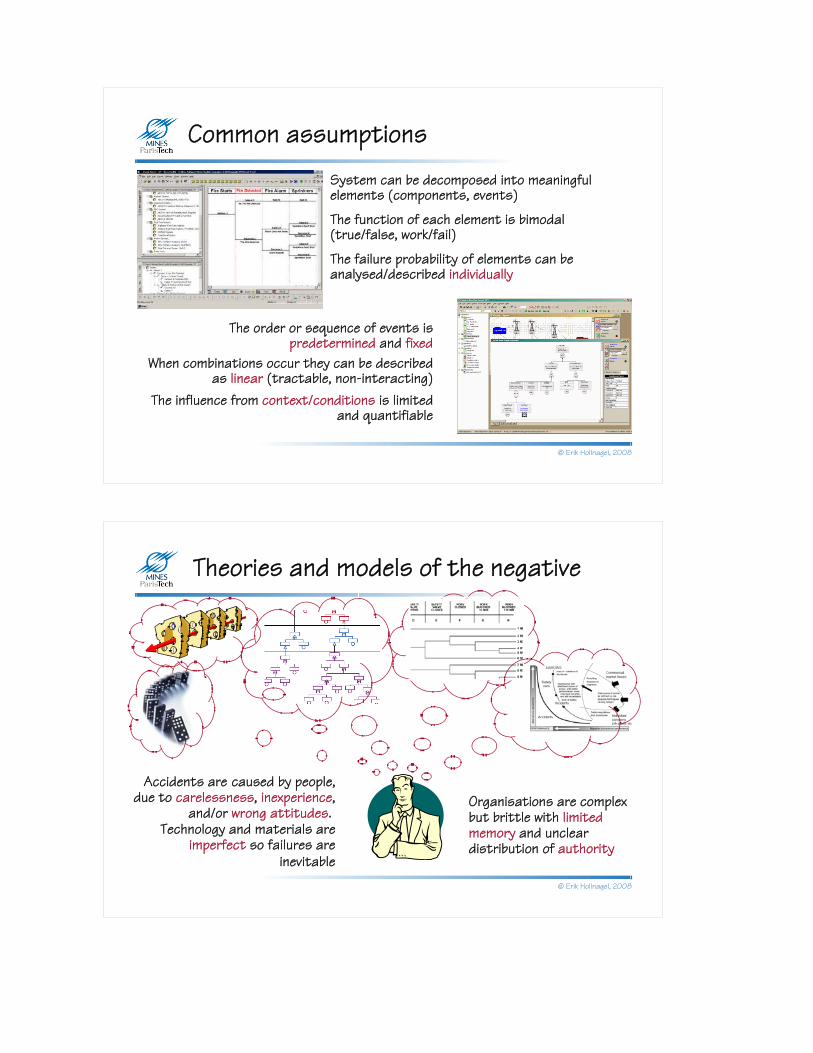
... and human factors analysis methods
1900 1910 1920 1930 1940 1950 1960 1970 1980 1990 2000 2010
Root cause Domino FMEA
HAZOP
FMECACSNI
THERPHCR
HPESSwiss Cheese
RCA, ATHEANA
Fault tree
AEB
HEAT
HERA
TRACEr
Human FactorsTechnical

© Erik Hollnagel, 2008
How do we know humans are safe?
Unknown, inferredPartly known, partly unknownMainly analogiesAd hoc, unprovenVaguely defined, complexVariableUsually reliable
Design principles:Architecture and components:
Models:Analysis methods:Mode of operation:
Structural stability:Functional stability:
© Erik Hollnagel, 2008
Finally, “organisational failures” ...
10
20
30
4050
60
7080
100
90
1960 1965 1970 1975 1980 1985 1990 1995
% A
ttrib
uted
cau
se
2000
Technology, equipment Organisation
2005
Human performance
?
??
Which will be the most unreliable
component?

© Erik Hollnagel, 2008
... and organisational analysis methods
1900 1910 1920 1930 1940 1950 1960 1970 1980 1990 2000 2010
Root cause Domino FMEA
HAZOP
FMECACSNI
THERPHCR
STEP
HPESSwiss Cheese
MTO
TRIPOD
RCA, ATHEANA
AcciMap
FRAMSTAMP
Fault treeCREAM
MERMOSAEB
MORT
HEAT
HERA
TRACEr
Human FactorsTechnical Organisational Systemic
© Erik Hollnagel, 2008
How do we know organisations are safe?
High-level, programmaticPartly known, partly unknownSemi-formal, Ad hoc, unprovenPartly defined, complexStable (formal), volatile (informal) Good, hysteretic (lagging).
Design principles:Architecture and components:
Models:Analysis methods:Mode of operation:
Structural stability:Functional stability:
© Erik Hollnagel, 2008
Common assumptions
The failure probability of elements can be analysed/described individually
The order or sequence of events is predetermined and fixed
When combinations occur they can be described as linear (tractable, non-interacting)
The influence from context/conditions is limited and quantifiable
The function of each element is bimodal (true/false, work/fail)
System can be decomposed into meaningful elements (components, events)
© Erik Hollnagel, 2008
Theories and models of the negative
Technology and materials are imperfect so failures are
inevitable
Accidents are caused by people, due to carelessness, inexperience,
and/or wrong attitudes. Organisations are complex but brittle with limited memory and unclear distribution of authority

© Erik Hollnagel, 2008
Decomposable, simple linear models
Risks as propagation of failures
If accidents happen like
this ...
... then risks can be found
like this ...
The culmination of a chain of events.
Find the component that failed by reasoning backwards from the final consequence.
Probability of component failures
Find the probability that something “breaks”, either alone or by simple,
logical and fixed combinations.
Human failure is treated at the “component” level.
Binary branching
© Erik Hollnagel, 2008
Risks as combinations of failures
Decomposable, complex linear models
Combinations of active failures and latent
conditions.
Look for how degraded barriers or defences combined with an active (human) failure.
Likelihood of weakened defenses, combinations
Single failures combined with latent conditions, leading to degradation of
barriers and defences.
If accidents happen like
this ...
... then risks can be found
like this ...
Combinations of failures and conditions

© Erik Hollnagel, 2008
Learning from when things go right?
P(failure) = 10-4 For every time that something goes wrong, there will be 9.999 times when something goes right.
Proposition 1:
The ways in which things go right are special cases of the ways in which things go wrong.Successes = failures gone wrong.The best way to improve system safety is therefore to study how things go wrong, and to generalise from that.
Potential data source: 1 case out of 10.000
Proposition 2:
The ways in which things go wrong are special cases of the ways in which things go right, orFailures = successes gone wrong.The best way to improve system safety is therefore to study how things go right, and to generalise from that.
Potential data source: 9.999 cases out of 10.000
© Erik Hollnagel, 2008
Success and failureFailure is normally explained as a breakdown or malfunctioning of a system and/or its components.
Resilience Engineering recognises that individuals and organisations must adjust to the current conditions in everything they do. Because information, resources and time always are finite, the adjustments will always be approximate.
This view assumes that success and failure are of a fundamentally different nature.
Safety can be improved by strengthening that ability, rather than just by avoiding or eliminating failures.
Failure can be explained as the absence of that ability — either temporarily or permanently.
Success is due to the ability of organisations, groups and individuals correctly to make these adjustments, in particular correctly to anticipate risks before failures and harm occur.

© Erik Hollnagel, 2008
Non-decomposable, non-linear models
Risks as non-linear combinations
CertificationI
P
C
O
R
TFAA
LubricationI
P
C
O
R
T
Mechanics
High workload
Grease
Maintenance oversightI
P
C
O
R
T
Interval approvals
Horizontal stabilizer
movementI
P
C
O
R
TJackscrew up-down
movementI
P
C
O
R
T
Expertise
Controlledstabilizer
movement
Aircraft designI
P
C
O
R
T
Aircraft design knowledge
Aircraft pitch controlI
P
C
O
R
T
Limiting stabilizer
movementI
P
C
O
R
T
Limitedstabilizer
movement
Aircraft
Lubrication
End-play checking
I
P
C
O
R
T
Allowableend-play
Jackscrew replacementI
P
C
O
R
T
Excessiveend-play
High workload
Equipment Expertise
Interval approvals
Redundantdesign
Procedures
Procedures
Systems at risk are intractable rather than tractable.
The established assumptions therefore have to be revised
CertificationI
P
C
O
R
TFAA
LubricationI
P
C
O
R
T
Mechanics
High workload
Grease
Maintenance oversightI
P
C
O
R
T
Interval approvals
Horizontal stabilizer
movementI
P
C
O
R
TJackscrew up-down
movementI
P
C
O
R
T
Expertise
Controlledstabilizer
movement
Aircraft designI
P
C
O
R
T
Aircraft design knowledge
Aircraft pitch controlI
P
C
O
R
T
Limiting stabilizer
movementI
P
C
O
R
T
Limitedstabilizer
movement
Aircraft
Lubrication
End-play checking
I
P
C
O
R
T
Allowableend-play
Jackscrew replacementI
P
C
O
R
T
Excessiveend-play
High workload
Equipment Expertise
Interval approvals
Redundantdesign
Procedures
Procedures
Unexpected combinations (resonance) of variability of
normal performance.
If accidents happen like
this ...
... then risks can be found
like this ...
Functional resonance analysis model
Unexpected combinations (resonance) of variability of
normal performance.
© Erik Hollnagel, 2008
Revised assumptions - 2008
Some adverse events can be attributed to failures and malfunctions of normal functions, but others are best understood as the result of combinations of variability of normal performance. Risk and safety analyses should try to understand the nature of variability of normal performance and use that to identify conditions that may lead to both positive and adverse outcomes.
Outcomes are determined by performance variability rather than by (human) failure probability. Performance variability is the reason why things go right — but also why they go wrong.
System functions are not bimodal, but normal performance is — and must be — variable.
Systems cannot be decomposed in a meaningful way (no natural elements or components)
CertificationI
P
C
O
R
TFAA
LubricationI
P
C
O
R
T
Mechanics
High workload
Grease
Maintenance oversightI
P
C
O
R
T
Interval approvals
Horizontal stabilizer
movementI
P
C
O
R
TJackscrew up-down
movementI
P
C
O
R
T
Expertise
Controlledstabilizer
movement
Aircraft designI
P
C
O
R
T
Aircraft design knowledge
Aircraft pitch controlI
P
C
O
R
T
Limiting stabilizer
movementI
P
C
O
R
T
Limitedstabilizer
movement
Aircraft
Lubrication
End-play checkingI
P
C
O
R
T
Allowableend-play
Jackscrew replacementI
P
C
O
R
T
Excessiveend-play
High workload
Equipment Expertise
Interval approvals
Redundantdesign
Procedures
Procedures

© Erik Hollnagel, 2008
All outcomes (positive and negative) are due to
performance variability..
From the negative to the positive
Negative outcomes are caused by failures and
malfunctions.
Safety = Reduced number of adverse
events.
Eliminate failures and malfunctions as far
as possible.
Safety = Ability to respond when
something fails.
Improve ability to respond to adverse
events.
Safety = Ability to succeed under varying
conditions.
Improve resilience.
© Erik Hollnagel, 2008
Resilience and safety managementResilience is the intrinsic ability of a system to adjust its functioning prior to, during, or following changes and disturbances, so that it can sustain required operations even after a major mishap or in the presence of continuous stress.
A practice of Resilience Engineering / Proactive Safety Management requires that all levels of the organisation are able to:
Learn from past events, understand correctly
what happened and why
Factual
Monitor threats and revise risk models
Critical
Anticipate threats, disruptions and destabilizing conditions
Potential
Respond to regular and irregular threats in an
effective, flexible manner, Actual

© Erik Hollnagel, 2008
Designing for resilienceResponding: Knowing
what to do, being capable of doing it.
Monitoring: Knowing what to look for (attention)
Anticipating: Finding out and knowing what to expect
Learning:Knowing what has
happened
An increased availability and reliability of functioning on all levels will not only improve safety but also enhance control, hence the ability to predict, plan, and produce.
Factual Critical Potential
Actual
© Erik Hollnagel, 2008
Should be eliminated or contained or otherwise
responded to
May be eliminated or contained or otherwise
responded to
As Low As Reasonably Practicable
ALARP or Tolerability region
(tolerable risk)
Broadly acceptable region
(negligible risk)
Unacceptable region (intolerable risk) Must be eliminated or
contained at any cost
Might be assessed when feasible
Will be eliminated or contained, if not too costly
Save rather than
invest
INVEST!
SAVE!

© Erik Hollnagel, 2008
As high as reasonably practicableWhich events? How were
they found? Is the list revised? How is readiness ensured and maintained?
How are indicators defined? Lagging / leading? How are they “measured”? Are effects transient or permanent? Who looks where and when? How, and when, are they revised?
What is our “model” of the future? How long to we look ahead? What risks are we willing to take? Who believes what and why?
What, when continuously or event-driven, from what
(successes or failures), how (qualitative, quantitative), by individual or by organisation?
Factual Critical Potential
Actual
© Erik Hollnagel, 2008
Resilience and safety management
Managing risks of the present: Since prevention has its limitations, it is necessary also to monitor the
state of the system and / or organisation. This requires an articulated model of leading / lagging
indicators and of “weak” signals.
Managing risksof the future:
Risk managementmeans taking risks
when preparing for future events. This requires a strategy to address both
safety and business goals, and a practical and realistic way of identifying
future risks and threats.
Managing risks of the past: Effective risk management must consider both what went right and what went wrong. Issues: how to learn from accidents, near misses and successes?
Factual Critical Potential
Actual
© Erik Hollnagel, 2008
Thanks for your attention
Any questions?


