Data Confidentiality, Residual Disclosure and Risk Mitigation

Residual Risk Assessment of the Level 2 Ecological Risk Assessment
Species Results Report for the Macquarie Island Toothfish Fishery
Demersal trawl Sub-Fishery
July 2009

2
EXECUTIVE SUMMARY The Australian Fisheries Management Authority (AFMA) has undertaken detailed ecological risk assessments (ERAs) for all major Commonwealth managed fisheries as a key part of the implementation of the ecological component of Ecologically Sustainable Development (ESD). ERAs assess the risks that fishing poses to the ecological sustainability of the marine environment by considering the impact of fishing on all components of the marine environment. The main purpose of ERAs is to prioritise the management, research, data collection and monitoring needs for each fishery.
The ecological risk management (ERM) framework has been developed to ensure that a consistent process is followed across fisheries when responding to the ERA outcomes. This framework ties into current fishery management processes and structures so that it can be easily implemented by fisheries. To support implementation of the ERM framework, AFMA will fully document the risk management for each fishery. This will ensure transparency in the process and allow for easier co-ordination within and between fisheries. Using the results presented in this report, along with the results from any subsequent levels of assessment, appropriate management arrangements will be developed to address the high priority species as part of the ERM framework.
Due to the semi-quantitative nature of the risk assessment, the Level 2 PSA results do not directly account for all management measures, resulting in an over-estimation of the actual risk for some species. To better encompass this, the Level 2 PSA analysis has undergone further refinement by applying a set of residual risk guidelines.
In early 2007, the residual risk guidelines were developed in consultation with CSIRO and stakeholders to assist AFMA managers in refining the Level 2 PSA results. They have been developed to maintain the key features of objectivity and consistency from the ERA process, and to ensure a repeatable and transparent assessment process. These guidelines take into account methodology related matters and the most current management arrangements. To assist managers, a clear set of decision rules are outlined that are to be applied to individual species. The Level 2 PSA residual risk assessment summary for the Macquarie Island demersal trawl sub-fishery is given in Table 3. Overall 48 species were assessed including one target species, 41 byproduct species, three discard species and three TEP species. A summary of the number of species in each category of risk and the guidelines used for each component are given in Table 4. For the Macquarie Island demersal trawl sub-fishery 48 species from a total of 168 assessed were deemed to be high risk. There has been a change from 48 high risk species prior to the residual risk assessment to no high residual risk species. The most common guidelines used were Guidelines 5 and 9. The primary reasons behind changes in risk score were because it was shown that the actual interactions with these species were minimal to zero (determined through the 100% observer coverage) and the limited area (130 km2) of the main trawl fishing ground (Aurora Trough) compared to the area (162,000 km2) of the Marine Protected Area established under the National Representative System of Marine Protected Areas.

3
TABLE OF CONTENTS
EXECUTIVE SUMMARY...........................................................................................................2 1. OVERVIEW .......................................................................................................................4 Scoping .....................................................................................................................................6 Level 1 – Scale, Intensity, Consequence Analysis ....................................................................6 Level 2 – Productivity Susceptibility Analysis ............................................................................6 Level 2 PSA Residual Risk Assessment ...................................................................................6 Level 3 – Quantitative Risk Assessment ...................................................................................7 Constraints of Level 2 PSA Results ..........................................................................................7 2. LEVEL 2 ERA RESIDUAL RISK PROCESS .....................................................................9 3. RESULTS ........................................................................................................................12 4. Conclusion.......................................................................................................................28 Appendix A - Summary of Productivity and Susceptibility Scoring..........................................30 REFERENCES........................................................................................................................31
Attachment 1 - Additional information used in preparing the residual risk reports 32
TABLES Table 1 – Summary of Level 2 ERA Residual Risk Guidelines ...............................................10
Table 2 – Stakeholder engagement ........................................................................................11
Table 3 – Level 2 PSA Residual Risk Results.........................................................................15
Table 4 – Summary of level 2 PSA Residual Risk results .......................................................26
FIGURES Figure 1 Ecological Risk Management framework ....................................................................4 Figure 2 The different levels of risk assessment and the trend in confidence and cost ............5 Figure 3 Flow diagram of the Level 2 ERA residual risk process..............................................9

4
1. OVERVIEW
1.1. Ecological Risk Management Process
A key component in the Australian Fisheries Management Authority’s (AFMA’s) implementation of the ecological component of ESD has been the undertaking of ecological risk assessments (ERAs) for all major Commonwealth managed fisheries. By assessing the impacts of fishing on all parts of the marine environment, the ERAs encompass an ecosystem-based assessment approach. The ERAs will help to prioritise research, data collection monitoring needs and management actions for fisheries and provide information to assist the decision making process so that they can be managed both sustainably and efficiently.
To assist with the implementation of the ecological component of ESD across all fisheries AFMA has established an ecological risk management (ERM) framework (see Figure 1). This framework ensures that a consistent process is followed across fisheries when responding to the ERA outcomes. While this framework focuses on responding to the results of ERAs, it acknowledges that there are other initiatives contributing to the achievement of the ecological component of ESD. The ERM framework will streamline fishery’s responses to the results of ERAs and incorporate other initiatives such as harvest strategies and bycatch and discard programs.
Due to the semi-quantitative nature of the level 2 ERAs, not all risk scores are an accurate representation of actual risk. The Level 2 PSA residual risk process is used to incorporate the effects of current management measures which impact on the level of risk posed by a fishery to species and adjust risk scores where appropriate. From a detailed methodology review, AFMA found that some ERAs did not include all existing management arrangements at the time of assessment. Furthermore, since the initial ERAs were conducted in 2005, the management of some fisheries has changed and additional data and information may have become available.
Figure 1 Ecological Risk Management framework
Risk Assessment TSG*/MACs/RAGs Ecological Risk Assessment Report Residual Risk Assessment Report Quantitative Risk Assessment Report
Risk Analysis TSG*/RAGs
Determine Management Strategy AFMA (based on advice from MACs/RAGs) Environment Committee/Board review/approval Ecological Risk Management Strategy Report
Implement Management Strategy AFMA/MACs
Review/Evaluate Environment Committee/Board
*TSG – Technical Support Group – currently provided by CSIRO
AFMA Annual Reporting
DEWHA Reviews/ Assessments
Internal Review of management actions
AFMA Management (involved in all steps)

5
1.2. ERA Project Since 2001, AFMA has been implementing ERAs. AFMA in collaboration with CSIRO developed the ERA methodology which has now been applied to all major Commonwealth managed fisheries. The aim of the ERA project is to assess both the direct and indirect impacts of a fishery’s activity on all aspects of the marine ecosystem.
1.3. ERA Methodology The ERA methodology is an adaptation of a traditional risk assessment to suit commercial fishing operations. The assessment evaluates the impact of fishing activities on all five major components of the marine ecosystem:
• target species (including bait species);
• byproduct and bycatch (discarded) species;
• threatened, endangered and protected (TEP) species;
• habitats; and
• ecological communities.
The ERA assessment adopts a hierarchical approach (refer to Figure 2). With every progressive level, the precision increases along with confidence in the risk scores (noting that not all components progress all the way through the assessment hierarchy). Each of these levels is outlined in more detail below.
Figure 2 The different levels of risk assessment and the trend in confidence and cost
Scoping
Level 1 Assessment Qualitative: Scale Intensity Consequence Analysis (SICA)
Level 2 Assessment Semi-quantitative: Productivity Susceptibility Analysis (PSA)
Residual Risk Assessment (of the Level 2 Assessment) Semi-quantitative: Residual Risk Assessment Guidelines
Level 3 Assessment Quantitative: Sustainability Assessment of Fishing Effects (SAFE) or Full
Stock Assessment
Risk Assessment Hierarchy
Increasing costs and data requirements
Increasin g accuracy and confidence in attributed risk
6
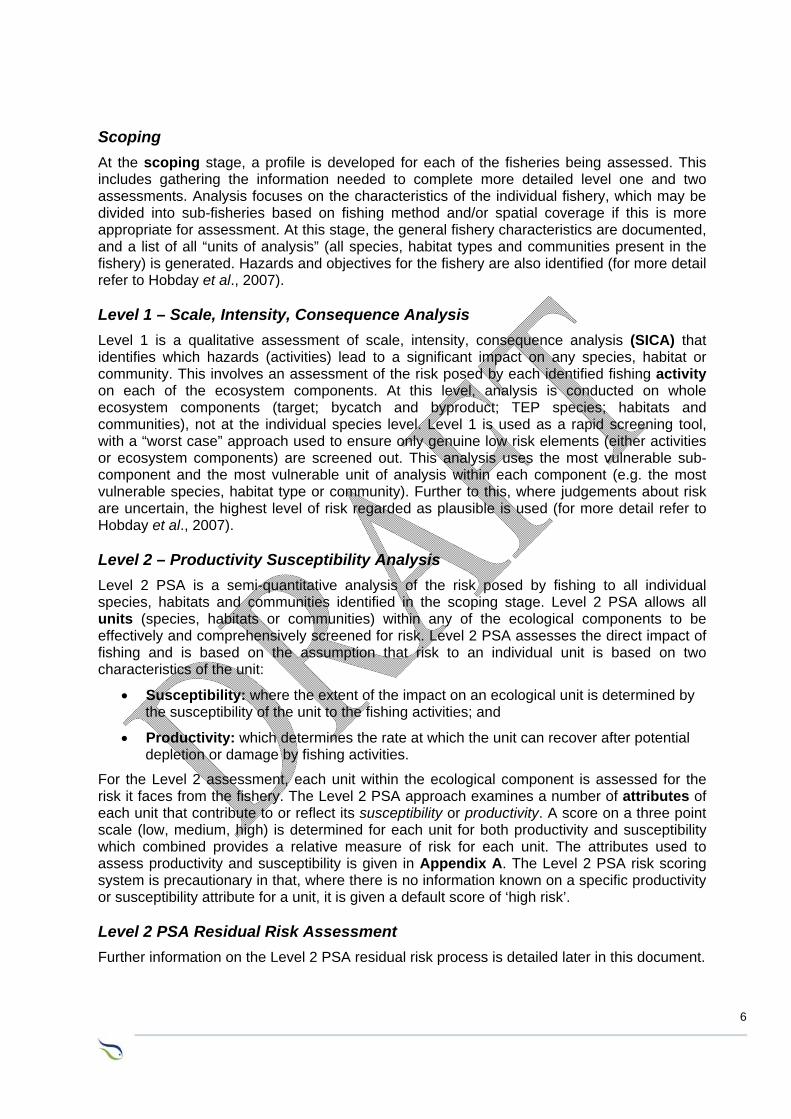
Scoping At the scoping stage, a profile is developed for each of the fisheries being assessed. This includes gathering the information needed to complete more detailed level one and two assessments. Analysis focuses on the characteristics of the individual fishery, which may be divided into sub-fisheries based on fishing method and/or spatial coverage if this is more appropriate for assessment. At this stage, the general fishery characteristics are documented, and a list of all “units of analysis” (all species, habitat types and communities present in the fishery) is generated. Hazards and objectives for the fishery are also identified (for more detail refer to Hobday et al., 2007). Level 1 – Scale, Intensity, Consequence Analysis Level 1 is a qualitative assessment of scale, intensity, consequence analysis (SICA) that identifies which hazards (activities) lead to a significant impact on any species, habitat or community. This involves an assessment of the risk posed by each identified fishing activity on each of the ecosystem components. At this level, analysis is conducted on whole ecosystem components (target; bycatch and byproduct; TEP species; habitats and communities), not at the individual species level. Level 1 is used as a rapid screening tool, with a “worst case” approach used to ensure only genuine low risk elements (either activities or ecosystem components) are screened out. This analysis uses the most vulnerable sub-component and the most vulnerable unit of analysis within each component (e.g. the most vulnerable species, habitat type or community). Further to this, where judgements about risk are uncertain, the highest level of risk regarded as plausible is used (for more detail refer to Hobday et al., 2007). Level 2 – Productivity Susceptibility Analysis Level 2 PSA is a semi-quantitative analysis of the risk posed by fishing to all individual species, habitats and communities identified in the scoping stage. Level 2 PSA allows all units (species, habitats or communities) within any of the ecological components to be effectively and comprehensively screened for risk. Level 2 PSA assesses the direct impact of fishing and is based on the assumption that risk to an individual unit is based on two characteristics of the unit:
• Susceptibility: where the extent of the impact on an ecological unit is determined by the susceptibility of the unit to the fishing activities; and
• Productivity: which determines the rate at which the unit can recover after potential depletion or damage by fishing activities.
For the Level 2 assessment, each unit within the ecological component is assessed for the risk it faces from the fishery. The Level 2 PSA approach examines a number of attributes of each unit that contribute to or reflect its susceptibility or productivity. A score on a three point scale (low, medium, high) is determined for each unit for both productivity and susceptibility which combined provides a relative measure of risk for each unit. The attributes used to assess productivity and susceptibility is given in Appendix A. The Level 2 PSA risk scoring system is precautionary in that, where there is no information known on a specific productivity or susceptibility attribute for a unit, it is given a default score of ‘high risk’. Level 2 PSA Residual Risk Assessment Further information on the Level 2 PSA residual risk process is detailed later in this document.

7
Level 3 – Quantitative Risk Assessment At the conclusion of the Level 2 PSA assessment, a number of units may have been identified as being at high risk because of the activities of the fishery. At this stage a Level 3 analysis may be warranted. This can take various forms including a quantitative sustainability assessment for fishing effects (SAFE) recently developed by CSIRO to assess multiple species or a fully quantitative assessment of a specific species (similar to a standard stock assessment). Quantitative risk assessments constituting the equivalent of a Level 3 risk analysis currently exist for many species. Before proceeding to a fully quantitative Level 3 assessment, investigation of suitable existing information to further understand the risk scores for high risk units should be identified. This may help to overcome some of the constraints of the Level 2 PSA results (outlined below) prior to proceeding to more costly Level 3 analysis for the remaining high risk units. Constraints of Level 2 PSA Results The methodology used in the Level 2 PSA assessment results in risk scores of high, medium or low to reflect potential rather than actual risk. Quantifying the actual risk for any species requires a Level 3 assessment. Due to the semi-quantitative nature of the Level 2 PSA risk assessment, analysis does not take into account all management measures currently in place in fisheries, which may result in an over-estimate of the actual risk for some species. The management arrangements that are not accounted for in the Level 2 assessment include:
• Limits to fishing effort;
• Catch limits (such as Total Allowable Catches - TACs); and
• Other controls such as seasonal closures.
Management arrangements that are accounted for in the assessment include:
• Spatial management that limits the range of the fishery (affecting availability);
• Gear limits that affect the size of animals that are captured (selectivity); and
• Handling practices that may affect the survival of species after capture (post capture mortality).
As a result, the Level 2 PSA is intentionally designed to generate more false positives for high risk (species assessed have a high risk when they are actually low risk) than false negatives (species assessed to be low vulnerability when they are actually high vulnerability). This is due to the Level 2 PSA methodology adopting a precautionary approach to uncertainty. An example of this is when a species is missing information on its productivity and susceptibility attributes the risk score defaults to a higher risk.
In addition, TEP species are included within the assessment on the basis that they occur in the area of the fishery, whether or not there has been a recorded interaction with the fishery. For this reason there may be a higher proportion of false positives for high risk TEP species, unless there is a robust observer program that can verify that species do not interact with the fishing gear.
When AFMA reviewed the methodology using example fisheries, some additional concerns arose. Since the original Level 2 PSA results were produced there is now an improved understanding of: new or updated catch data available from log books and catch records; advances in scientific knowledge that may have become available; and more resolution on the spatial distribution of species etc. Each of these issues is discussed below.

8
Improved data The ERA process adopts a precautionary approach if there is uncertainty about an attribute the higher risk score is used. At the Level 2 PSA when a species is missing either a productivity or susceptibility attribute the score defaults to a high risk category. Furthermore, species attributes that were originally calculated for the fishery may be out-of-date because additional or more precise information has become available. Additional information Since the time of the original ERA assessment, additional information may now be available as a result of other investigations and research etc. Spatial assumptions The Level 2 PSA utilises a precautionary approach when calculating susceptibility by assuming species distribution is only within the jurisdictional boundary of the fishery. While this is appropriate for species that form discrete populations or stocks, the risk score for species that extend beyond the boundary of the fishery such as pelagic and migratory species is not. Interaction and catch data Some species have a low to negligible level of interaction with the fishing gear. Species with very low biological productivity may however still be scored high or medium risk irrespective of their low susceptibility. Considering that the likelihood of interaction is already low there is little additional management that a fishery can introduce to mitigate the risk. Therefore the level of interaction or capture should be included as part of the Level 2 PSA residual risk process. Management arrangements As stated above, effort and catch limits for target and byproduct species are not taken into account in the ERA even though these arrangements may mitigate risk for some species. The Level 2 PSA residual risk process allows many of these management arrangements to be incorporated into the assessment.
Some management arrangements concerning the mitigation of bycatch have been incorporated into the initial ERA process; however, they may now be out-of-date since the initial ERA assessment. The Level 2 PSA residual risk process incorporates some of these management arrangements into the results to better represent the overall risk for a species.
There may be a beneficial overlap of management arrangements for individual species that were not a specific target of that arrangement if there is a high degree of association between the species. In some instances the initial ERA may not have considered the benefit of management arrangements between associated species.
Although seasonal, spatial and depth closures have been considered in the initial ERA, more recent management measures have not been accounted for. The Level 2 PSA residual risk process will consider some of these arrangements and will bring the assessment up-to-date.
The Sub-Antarctic Resource Assessment Group (SARAG) recognising the ecosystem based management approach adopted by the Commission for the Conservation of Antarctic Marine Living Resources (CCAMLR) provided further input to the ERA process. The paper at Attachment 1 provides background material on management, bycatch mitigation strategies, the levels of monitoring and the resultant interpretation of the guidelines applied in the residual risk process.

9
2. LEVEL 2 ERA RESIDUAL RISK PROCESS
2.1. Level 2 ERA Residual Risk All major fisheries have been assessed to Level 2 PSA where applicable. Before moving to a Level 3 assessment, the residual risk guidelines have been applied to account for some of the constraints of the Level 2 PSA assessment. The Level 2 PSA residual risk process (Figure 3) incorporates some of the concepts of a Level 3 assessment and is more cost effective than a full Level 3 assessment. Furthermore, the Level 2 PSA residual risk results more accurately represent overall risk within a fishery and will help clarify if further (Level 3) assessment is necessary.
Figure 3 Flow diagram of the Level 2 ERA residual risk process
2.2. Level 2 PSA Residual Risk Process In 2007 AFMA, with input from CSIRO and stakeholders, developed a set of guidelines to assess the residual risk for species identified as having a high potential risk based on the Level 2 analysis. The guidelines have been designed to ensure that a consistent, transparent and repeatable process is adopted across all fisheries. A summary of the guidelines is given in Table 1. Within each category there are clear decision rules that can be applied to a species (if relevant) to calculate Level 2 PSA residual risk. Each of the guidelines was applied on a species-by-species basis to determine the Level 2 PSA residual risk within the fishery.
When determining the Level 2 PSA residual risk, all considerations included in the calculation process must be recorded, along with the guidelines applied with a detailed justification clearly stated. This ensures that a transparent process is maintained. In review of the ERA results, the guidelines have been applied to all high risk species by managers in consultation with MAC members and experts. Broadly the application processes involved the following steps:
• Sorting the ERA result by high risk, then grouping the high risk species by role within the fishery, then by taxonomic group;
• Creating a list of all management arrangements not included in the Level 2 PSA results for reference when applying the guidelines;
Fishery ecological
risk assessment
Level 2 ERA residual risk
assessment of high risk species
Consideration of many current
fishery management
Consideration of up-to-date and missing
information, catch and log book data
Improved understanding of overall risk
Efficient development of ecological
risk management
strategy

10
• Considering each management arrangement to relevant high risk species;
• Collating spatial information from experts, observer and logbook data for all high risk species for reference when applying the guidelines;
• Deciding if and what guideline applies to each of the high risk species by conducting a species-by-species application;
• Making changes to the necessary attributes, productivity and susceptibility scores to calculate the Level 2 PSA residual risk score;
• Recording all workings, guidelines used, how they have been applied and a justification for the Level 2 PSA residual risk score;
• Providing preliminary Level 2 PSA residual risk results to MACs for feedback; and
• Finalising the Level 2 PSA residual risk results for release.
Before the Level 2 PSA residual risk process was applied to all fisheries the guidelines were trialled in three fisheries, the Eastern Tuna and Billfish Fishery (ETBF), Southern and Eastern Scalefish and Shark Fishery (SESSF), and the Northern Prawn Fishery (NPF). These fisheries were selected for the Level 2 PSA residual risk pilot because they are key fisheries and provide a template for other fisheries. Developments in the application of the Level 2 PSA residual risk process are outlined in Table 2. Table 1 Summary of Level 2 ERA Residual Risk Guidelines*
Guideline Number Summary Guideline 1. Risk rating due to missing/incorrect information.
Considers if susceptibility and/or productivity attribute data for a species is missing or incorrect for the fishery assessment, and is corrected using data from a trusted source or another fishery.
Guideline 2. Additional scientific assessment.
Considers any additional rigorous scientific assessment (i.e. rapid Level 3 risk assessment, population viability analysis) that calculates the species level of risk from fishing, or considers any other scientific published assessments or results.
Guideline 3. At risk due to missing attributes.
When there are three or more missing productivity attributes, considers closely related species within a fishery that have those productivity attributes known.
Guideline 4. At risk with spatial assumptions.
Uses additional information on spatial distribution of species populations to better represent the species distribution overlap with the fishery.
Guideline 5. At risk in regards to level of interaction/capture with a zero or negligible level of susceptibility.
Considers observer or expert information to better calculate susceptibility for those species known to have a low likelihood or no record of interaction or capture with the fishery.
Guideline 6. Effort and catch management arrangements for target and byproduct species.
Considers current management arrangements based on effort and catch limits set using a scientific assessment for key species.
Guideline 7. Management arrangements to mitigate against the level of bycatch.
Considers management arrangements in place that mitigate against bycatch by the use of gear modifications, mitigation devices and catch limits.
Guideline 8. Limits on associated species through other management arrangements.
Considers the implications of management arrangements for a particular species on other associated species.
Guideline 9. Management arrangements relating to seasonal, spatial and depth closures.
Considers management arrangements based on seasonal, spatial and/or depth closures.
* For the complete Residual Risk Guidelines, refer to http://www.afma.gov.au/environment/eco_based/eras/reports.htm
11
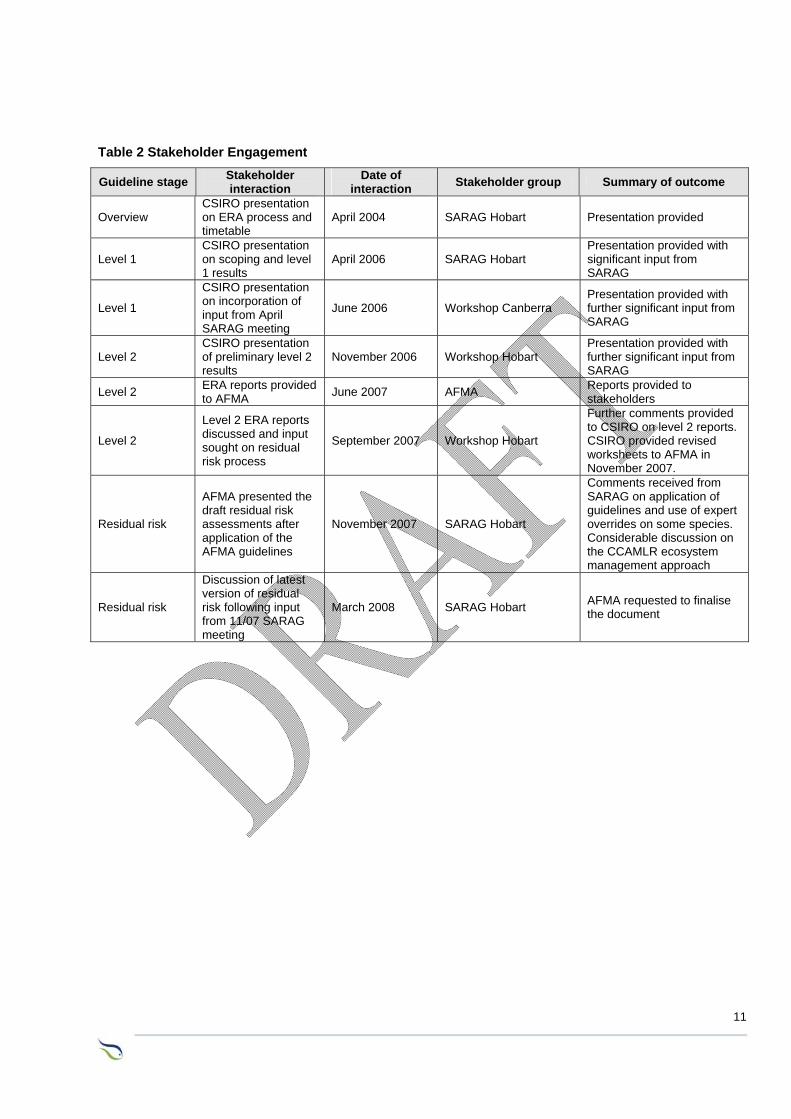
Table 2 Stakeholder Engagement
Guideline stage Stakeholder interaction
Date of interaction Stakeholder group Summary of outcome
Overview CSIRO presentation on ERA process and timetable
April 2004 SARAG Hobart Presentation provided
Level 1 CSIRO presentation on scoping and level 1 results
April 2006 SARAG Hobart Presentation provided with significant input from SARAG
Level 1
CSIRO presentation on incorporation of input from April SARAG meeting
June 2006 Workshop Canberra Presentation provided with further significant input from SARAG
Level 2 CSIRO presentation of preliminary level 2 results
November 2006 Workshop Hobart Presentation provided with further significant input from SARAG
Level 2 ERA reports provided to AFMA June 2007 AFMA Reports provided to
stakeholders
Level 2
Level 2 ERA reports discussed and input sought on residual risk process
September 2007 Workshop Hobart
Further comments provided to CSIRO on level 2 reports. CSIRO provided revised worksheets to AFMA in November 2007.
Residual risk
AFMA presented the draft residual risk assessments after application of the AFMA guidelines
November 2007 SARAG Hobart
Comments received from SARAG on application of guidelines and use of expert overrides on some species. Considerable discussion on the CCAMLR ecosystem management approach
Residual risk
Discussion of latest version of residual risk following input from 11/07 SARAG meeting
March 2008 SARAG Hobart AFMA requested to finalise the document

12
3. RESULTS
3.1. ERA Results For the Macquarie Island demersal trawl sub-fishery 48 species from a total of 168 assessed were deemed to be high risk. There has been a change from 48 high risk species prior to the residual risk assessment to no high residual risk species. The primary reason behind changes in risk score were because it was shown that the actual interactions with these species were minimal to zero (determined through the 100% observer coverage) and the limited area (130 km2) of the main trawl fishing ground (Aurora Trough) compared to the area (162,000 km2) of the Marine Protected Area established under the National Representative System of Marine Protected Areas. Fishery Description Gear: demersal trawl (120 mm) Area: Macquarie Island Toothfish Fishery Depth range: 400-1000 metres Fleet size: 1 vessel Effort: variable up to 120 shots per year Landings: 243 tonnes across both areas (Aurora Trough and Macquarie
Ridge) in 2005/6. Total of 721 tonnes across both areas (1/2001-6/2006) of which 119 tonnes was research quota.
Discard rate: there is a zero discard policy for quota and non-quota teleost species 2 tonnes of bycatch (usually retained, mealed and discarded onshore) across both areas in 2005/6
Total of 14.1 tonnes (~2%) across both areas (1/2001-6/2006) Main target species: Patagonian toothfish Management: quota management system for 1 species and bycatch limit 200
tonnes on all other species/groups Observer program: observer program operating since beginning of fishery in 1994 with
2 observers deployed on each voyage.
Ecological Units Assessed Target species: 1 Byproduct species: 74 Bycatch (Discard) Species: 3 TEP species: 90 Habitats: - Communities: 2
Level 1 Results No ecological components were eliminated at Level 1 (consequence score >3 for at least one activity). Consequence (risk) scores were between 1-3 across all 32 hazards (fishing activities) and four ecological components assessed. Those hazards with moderate risk scores of three were:
• Fishing (direct impact with capture on target species, byproduct/bycatch species and community components)

13
Fishing (direct impact with capture) scored as major risk (=4) to TEP species. No external hazards (consequence score >3) were scored. No other risks rated as major or above (risk scores 4 or 5) were scored.
Habitats for this fishery are not currently assessed using most recent ERAEF methodology due to the quality of available habitat data. Existing Macquarie Island data includes a few CMAR survey images of low quality and restricted distribution, some associated survey descriptions, geomorphic unit mapping, and a few references to invertebrate taxa from bycatch lists. This data is considered to be of limited value at this stage in characterizing both the range of possible benthic habitats that occur within the jurisdictional boundary of the MITF and the associated risk of those habitats to demersal trawling within this region. Application of the existing habitat data from Australian waters including Tasman Rise is not considered an acceptable alternative.
Impacts from fishing on all species components were assessed in more detail at Level 2.
Level 2 Results A total of 168 species were subsequently considered at level 2, of which expert over rides were used on 106 species. Of the 48 species assessed to be at high risk, 36 had more than 3 missing attributes.
Target species
The single target species was assessed to be at potentially high risk but this species has had detailed Level 3 assessments and is under comprehensive and precautionary management plans.
Byproduct species
A larger than expected number of byproduct species was evaluated as high risk (41 species). However most of these species are fishes that are caught in only small quantities. These high risk scores are likely to reflect uncertainty – missing information; most importantly the poorly documented taxonomy and distribution of fish species in the region. The species that were most likely to be at genuine high risk within this group were whiptails and southern flounders. However none of these species have particularly low productivity and whiptails are the only byproduct fish species caught in significant quantities.
A significant amount coral and of benthic invertebrates had been recorded in the byproduct/bycatch suggesting that habitats need assessment. These are generally not resolved to species but the families recorded represent tube anemones, black corals, fan corals and thorny corals. The invertebrate fauna of the region is poorly known but is likely to include long-lived corals, similar to those present on seamounts around southern Tasmania. The coral on some of these seamounts has been reduced and has not recovered after 10 years. These corals are difficult to age but some cold water corals are thought to live to 100 years.
Bycatch (discards)
The sleeper shark, a species of deepwater dogfish, is the main bycatch species. Other species of deepwater dogfish have annual fecundity of less than 1. There are broad concerns for deepwater dogfish, both domestically and internationally. The sleeper shark stands out because of its large size. This means that a relatively small number of individuals contribute to the overall biomass. Studies of other deepwater dogfishes, blue sharks and white sharks suggest survival rates of released sharks are around 50%. There have been studies of sleeper sharks in the region but they do not include yield estimates.

14
TEP Species Three TEP species were assessed as high risk. The wandering albatross has not been captured in the sub-fishery, but has a limited population size on Macquarie Island (40 birds). Even if one bird were captured it would comprise 2% of the population. In fact any level of harvest of this population presents significant risk given that it is recovering from depletion from external (to the trawl fishery) influences. Closely related species, including shy albatross, have been killed by warp wires in trawl fisheries around continental Australia as recorded in observer data. Habitats
Not assessed. However, there are significant areas of the exclusive economic zone (EEZ) around Macquarie Island which have been set aside as marine protected areas, which have been established under the National Representative System of Marine Protected Areas (NRSMPA). The Macquarie Island Marine Park comprises almost one third of the EEZ around Macquarie Island and contains one of the world’s largest ‘no take’ areas. The Aurora Trough sector is the main trawl ground where the majority of the catch is taken and covers a total of 130 square kilometres. The Marine Park covers 162,000 square kilometres, from a total EEZ area of 476,000 square kilometres. Communities The community component was not assessed at Level 2 for this sub-fishery, but should be considered in future assessments when the methods to do this are fully developed.
Summary Seabird interactions have to date been considered the principle ecological risk for the Macquarie Island trawl fishery for Patagonian toothfish and this is likely to remain an important ecological issue because of the particularly low number of wandering albatross on Macquarie Island. The level of observer coverage in the fishery is best practice among Australian fisheries for ensuring compliance with mitigation measures to protect seabirds. There are opportunities to improve the collation and availability of observer data so that it can also be used to evaluate and improve the effectiveness of mitigation measures through adaptive management. Another issue highlighted in this ERAEF assessment is concern for sleeper sharks. This concern will be best addressed across both the line and demersal trawl sub-fisheries. Another issue is our poor knowledge of the fish taxonomy and biogeography of the area. The fish fauna of the region has been studied but the documentation of these studies is incomplete. The remaining issue to emerge from the level 2 analysis of bycatch species is the impact of the trawl gear on benthic invertebrates. This suggests that assessment of habitats should be a priority.
Managing identified risks Using the results of the ecological risk assessment, the next steps for each fishery will be to consider and implement appropriate management responses to address these risks. To ensure a consistent process for responding to the ERA outcomes, AFMA has developed an Ecological Risk Management (ERM) framework.
3.2. Level 2 PSA Residual Risk Results The Level 2 PSA residual risk assessment summary for the Macquarie Island demersal trawl sub-fishery is given in Table 3. Overall 48 species were assessed including one target species, 41 byproduct species, three discard species and three TEP species.

15
A summary of the number of species in each category of risk and the guidelines used for each component are given in Table 4. The most common guidelines used were Guidelines 5 and 9. The primary reasons behind changes in risk score were because it was shown that the actual interactions with these species were minimal to zero (determined through the 100% observer coverage) and the limited area (130 km2) of the main trawl fishing ground (Aurora Trough) compared to the area (162,000 km2) of the Marine Protected Area established under the National Representative System of Marine Protected Areas. Overall there has been a change from 48 high risk species prior to the residual risk assessment to no high residual risk species.

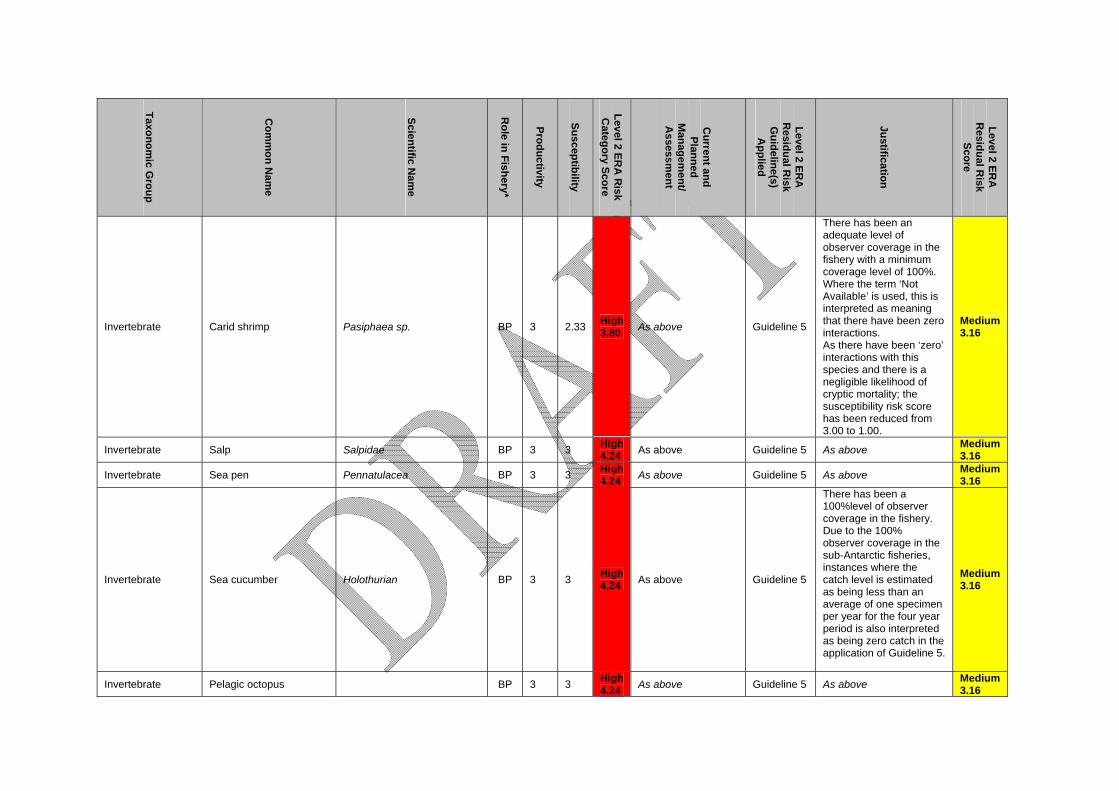
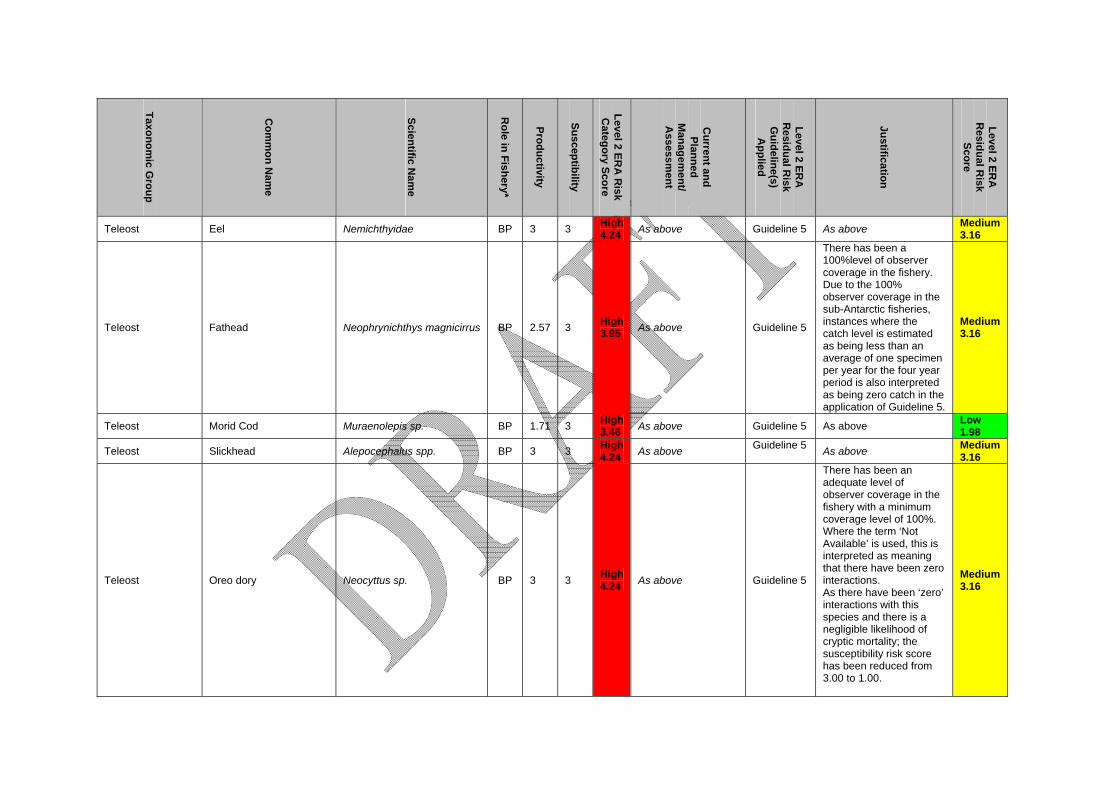
Table 3 Level 2 PSA Residual Risk Results
Taxonomic G
roup
Com
mon N
ame
Scientific Nam
e
Role in Fishery*
Productivity
Susceptibility
Level 2 ERA
Risk
Category Score
Current and Planned
Managem
ent/ A
ssessment
Level 2 ERA
R
esidual Risk
Guideline(s) A
pplied
Justification
Level 2 ERA
R
esidual Risk
Score
Teleost Patagonian toothfish Dissostichus eleginoides TA 1.86 3 High 3.53
For the Macquarie Island Toothfish Fishery a total bycatch limit of 200 tonnes applies for all finfish species (excluding Patagonian toothfish), crabs, sharks, skates and rays per season. If the 200 tonne finfish bycatch limit is reached during the season the fishery will be closed.
Guideline 6
TACs for Patagonian toothfish at Macquarie Island are determined annually based upon an assessment conducted by CSIRO and there is a high level of compliance with these limits as a Catch Documentation Scheme has been implemented and there is a minimum of 100% observer coverage in the fishery as prescribed by CCAMLR, therefore overall risk category was reduced from High to Medium. Longline trial has shown toothfish are widely distributed
Medium 3.18
Chondrichthyan Southern lantern shark Etmopterus granulosus BP 2.43 2.33 High 3.37 As above Guideline 5
There has been an adequate level of observer coverage in the fishery with a minimum coverage level of 100%. Where the term ‘Not Available’ is used, this is interpreted as meaning that there have been zero interactions. As there have been ‘zero’ interactions with this species and there is a negligible likelihood of cryptic mortality; the susceptibility risk score has been reduced from 3.00 to 1.00.
Medium 2.63

Taxonomic G
roup
Com
mon N
ame
Scientific Nam
e
Role in Fishery*
Productivity
Susceptibility
Level 2 ERA
Risk
Category Score
Current and Planned
Managem
ent/ A
ssessment
Level 2 ERA
R
esidual Risk
Guideline(s) A
pplied
Justification
Level 2 ERA
R
esidual Risk
Score
Invertebrate Anthozoan sea anemone Actinaria – undifferentiated BP 3 3 High 4.24 As above
Guideline 5 and Guideline 9
The Marine Protected Area is 162,000 km2 compared to the main trawl grounds in Aurora Trough (130 km2). Habitat and species distributions are represented in the MPA. There has been a 100%level of observer coverage in the fishery. Due to the 100% observer coverage in the sub-Antarctic fisheries, instances where the catch level is estimated as being less than an average of one specimen per year for the four year period is also interpreted as being zero catch in the application of Guideline 5. As there have been ‘zero’ interactions with this species and there is a negligible likelihood of cryptic mortality; the susceptibility risk score has been reduced from 3.00 to 1.00.
Medium 3.16
Invertebrate Flying squid Martialia hyadesi. BP 2.86 1.67 High 3.3 As above Guideline 5 As above Medium
3.03
Invertebrate Flying squid Nototodarus sloanii. BP 2.86 2.33 High 3.69 As above Guideline 5 As above Medium
3.03
Invertebrate Sea star Asteroidea BP 3 3 High 4.24 As above Guideline 5 As above Medium
3.16
Invertebrate Sea urchin Echinoidea BP 3 3 High 4.24 As above Guideline 5 As above Medium
3.16
Taxonomic G
roup
Com
mon N
ame
Scientific Nam
e
Role in Fishery*
Productivity
Susceptibility
Level 2 ERA
Risk
Category Score
Current and Planned
Managem
ent/ A
ssessment
Level 2 ERA
R
esidual Risk
Guideline(s) A
pplied
Justification
Level 2 ERA
R
esidual Risk
Score
Invertebrate Carid shrimp Pasiphaea sp. BP 3 2.33 High 3.80 As above Guideline 5
There has been an adequate level of observer coverage in the fishery with a minimum coverage level of 100%. Where the term ‘Not Available’ is used, this is interpreted as meaning that there have been zero interactions. As there have been ‘zero’ interactions with this species and there is a negligible likelihood of cryptic mortality; the susceptibility risk score has been reduced from 3.00 to 1.00.
Medium 3.16
Invertebrate Salp Salpidae BP 3 3 High 4.24 As above Guideline 5 As above Medium
3.16
Invertebrate Sea pen Pennatulacea BP 3 3 High 4.24 As above Guideline 5 As above Medium
3.16
Invertebrate Sea cucumber Holothurian BP 3 3 High 4.24 As above Guideline 5
There has been a 100%level of observer coverage in the fishery. Due to the 100% observer coverage in the sub-Antarctic fisheries, instances where the catch level is estimated as being less than an average of one specimen per year for the four year period is also interpreted as being zero catch in the application of Guideline 5.
Medium 3.16
Invertebrate Pelagic octopus BP 3 3 High 4.24 As above Guideline 5 As above Medium
3.16

Taxonomic G
roup
Com
mon N
ame
Scientific Nam
e
Role in Fishery*
Productivity
Susceptibility
Level 2 ERA
Risk
Category Score
Current and Planned
Managem
ent/ A
ssessment
Level 2 ERA
R
esidual Risk
Guideline(s) A
pplied
Justification
Level 2 ERA
R
esidual Risk
Score
Invertebrate Squid Histioteuthis sp. BP 3 3 High 4.24 As above Guideline 5 As above Medium
3.16
Invertebrate Squid Loligo sp. BP 3 3 High 4.24 As above Guideline 5
There has been an adequate level of observer coverage in the fishery with a minimum coverage level of 100%. Where the term ‘Not Available’ is used, this is interpreted as meaning that there have been zero interactions. As there have been ‘zero’ interactions with this species and there is a negligible likelihood of cryptic mortality; the susceptibility risk score has been reduced from 3.00 to 1.00.
Medium 3.16
Invertebrate Squid Cirroteuthis sp. BP 3 3 High 4.24 As above Guideline 5 As above Medium
3.16
Teleost Deepwater dogfish Centoscymnus crepidater BP 2.57 1.67 High 3.31 As above Guideline 5 As above Medium
2.75
Teleost Bristlemouth Photichthys sp. BP 3 3 High 4.24 As above Guideline 5 As above Medium
3.16
Teleost Scaleless dragonfish Stomias sp. BP 3 3 High 4.24 As above Guideline 5 As above Medium
3.16
Teleost daggerfish Anotopterus pharao. BP 2.29 3 High 3.27 As above Guideline 5 As above Low
2.49
Teleost Whipnose angler fish Gigantactinidae BP 3 3 High 4.24 As above Guideline 5 As above Medium
3.16
Teleost Seadevil Ceratias tentaculatus BP 2.29 2.33 High 3.27 As above Guideline 5 As above Low
2.49
Teleost Pearlfish Echiodon cryomargarites BP 2.29 3 High 3.77 As above Guideline 5 As above Low
2.49
Teleost Cardinal fish Epigonus sp. BP 3 3 High 4.24 As above Guideline 5 As above Medium
3.16
Taxonomic G
roup
Com
mon N
ame
Scientific Nam
e
Role in Fishery*
Productivity
Susceptibility
Level 2 ERA
Risk
Category Score
Current and Planned
Managem
ent/ A
ssessment
Level 2 ERA
R
esidual Risk
Guideline(s) A
pplied
Justification
Level 2 ERA
R
esidual Risk
Score
Teleost Eel Nemichthyidae BP 3 3 High 4.24 As above Guideline 5 As above Medium
3.16
Teleost Fathead Neophrynichthys magnicirrus BP 2.57 3 High 3.95 As above Guideline 5
There has been a 100%level of observer coverage in the fishery. Due to the 100% observer coverage in the sub-Antarctic fisheries, instances where the catch level is estimated as being less than an average of one specimen per year for the four year period is also interpreted as being zero catch in the application of Guideline 5.
Medium 3.16
Teleost Morid Cod Muraenolepis sp. BP 1.71 3 High 3.46 As above Guideline 5 As above Low
1.98
Teleost Slickhead Alepocephalus spp. BP 3 3 High 4.24 As above Guideline 5 As above Medium
3.16
Teleost Oreo dory Neocyttus sp. BP 3 3 High 4.24 As above Guideline 5
There has been an adequate level of observer coverage in the fishery with a minimum coverage level of 100%. Where the term ‘Not Available’ is used, this is interpreted as meaning that there have been zero interactions. As there have been ‘zero’ interactions with this species and there is a negligible likelihood of cryptic mortality; the susceptibility risk score has been reduced from 3.00 to 1.00.
Medium 3.16

Taxonomic G
roup
Com
mon N
ame
Scientific Nam
e
Role in Fishery*
Productivity
Susceptibility
Level 2 ERA
Risk
Category Score
Current and Planned
Managem
ent/ A
ssessment
Level 2 ERA
R
esidual Risk
Guideline(s) A
pplied
Justification
Level 2 ERA
R
esidual Risk
Score
Teleost Southern flounder Achiropsetta sp. (grey) BP 2.43 3 High 3.86 As above Guideline 5 As above Low
2.63
Teleost Southern flounder Mancopsetta sp. BP 2.86 3 High 4.14 As above Guideline 5 As above Medium
3.16
Teleost Spangled trouble-shouter Astronesthes sp. BP 3 3 High 4.24 As above Guideline 5 As above Medium
3.16
Teleost Viper fish Chauliodus sloani BP 3 3 High 4.24 As above Guideline 5 As above Medium
3.16
Teleost Blobfish Ebinania sp. BP 3 3 High 4.24 As above Guideline 5
There has been a 100%level of observer coverage in the fishery. Due to the 100% observer coverage in the sub-Antarctic fisheries, instances where the catch level is estimated as being less than an average of one specimen per year for the four year period is also interpreted as being zero catch in the application of Guideline 5.
Medium 3.16
Teleost Morid Cod Paralaemonema sp. BP 3 3 High 4.24 As above Guideline 5 As above Medium
3.16
Teleost Football fish Himantolophus sp. BP 3 3 High 4.24 As above Guideline 5
There has been an adequate level of observer coverage in the fishery with a minimum coverage level of 100%. Where the term ‘Not Available’ is used, this is interpreted as meaning that there have been zero interactions. As there have been ‘zero’ interactions with this species and there is a negligible likelihood of cryptic mortality; the
Medium 3.16

Taxonomic G
roup
Com
mon N
ame
Scientific Nam
e
Role in Fishery*
Productivity
Susceptibility
Level 2 ERA
Risk
Category Score
Current and Planned
Managem
ent/ A
ssessment
Level 2 ERA
R
esidual Risk
Guideline(s) A
pplied
Justification
Level 2 ERA
R
esidual Risk
Score
susceptibility risk score has been reduced from 3.00 to 1.00. As above
Teleost Dreamer fish Oneirodes sp. BP 3 3 High 4.24 As above Guideline 5 As above Medium
3.16
Teleost Scaleless dragonfish Melanostomias sp. BP 2.43 3 High 3.86 As above Guideline 5 As above Low
2.63
Invertebrate Jellyfish Periphylla periphylla DI 2.86 1.67 High 3.31
For the Macquarie Island Toothfish Fishery a total bycatch limit of 200 tonnes applies for all finfish species (excluding Patagonian toothfish), crabs, sharks, skates and rays per season. If the 200 tonne finfish bycatch limit is reached during the season the fishery will be closed.
Guideline 5
Ubiquitous species. There has been a 100%level of observer coverage in the fishery. For the purposes of this Residual Risk Assessment, minimal levels of catch in the sub-Antarctic fisheries are interpreted as meaning an average of less than 10kg per year over a four year period (i.e. ≤ 40kg) for invertebrate species therefore the catch of 34 kg of this species is considered minimal and as there is a negligible likelihood of cryptic mortality, the susceptibility risk score has been reduced from 1.67 to 1.50.
Medium 3.02
Marine bird Wandering albatross Diomedea exulans TEP 2.57 3 High 3.95
There has been an adequate level of observer coverage in the fishery. CCAMLR prescribes a minimum level of 100%. There has been no reported
Guideline 5
There has been a 100%level of observer coverage in the fishery. As there have been ‘zero’ interactions with this species and there is a negligible likelihood of cryptic mortality; but a
Medium 2.76

Taxonomic G
roup
Com
mon N
ame
Scientific Nam
e
Role in Fishery*
Productivity
Susceptibility
Level 2 ERA
Risk
Category Score
Current and Planned
Managem
ent/ A
ssessment
Level 2 ERA
R
esidual Risk
Guideline(s) A
pplied
Justification
Level 2 ERA
R
esidual Risk
Score
TEP interaction with fishing gear for this species since the fishery started in 1994.
high susceptibility score, the susceptibility risk score has been reduced from 3 to 1.
Marine mammal Spectacled porpoise Australophocoena dioptica TEP 2.86 1.44 High 3.20 As above Guideline 5 As above Medium
3.03
Marine mammal Hector’s beaked whale Mesoplodon hectori TEP 2.86 1.30 High 3.14 As above Guideline 5 As above Medium
3.03 *Role in Fishery – TA (target), TB (target bait), BP (byproduct), DI (discard/bycatch), TEP (threatened, endangered or protected).

An expert override has been applied to the following species which were identified as high risk in the level 2 assessment. As a result they are now classified as a medium or low risk
Taxonomic G
roup
Com
mon N
ame
Scientific Nam
e
Role in Fishery*
Productivity
Susceptibility
Level 2 ERA
Risk
Category Score
Current and Planned
Managem
ent/ A
ssessment
Level 2 ERA
R
esidual Risk
Guideline(s) A
pplied
Justification
Level 2 ERA
R
esidual Risk
Score
Invertebrate Subantarctic king crab Lithodes murrayi BP 2.71 3 High 4.05 None Expert
override
Ubiquitous distribution. The Marine Protected Area is 162,000 km2 compared to the main trawl grounds in Aurora Trough (130 km2). Habitat and species distributions are represented in the MPA.
Medium
Invertebrate Gorgonian sea fan Gorgonaceae BP 3 3 High 4.24 None
Expert override Guideline 9
The Marine Protected Area is 162,000 km2 compared to the main trawl grounds in Aurora Trough (130 km2). Habitat and species distributions are represented in the MPA.
Medium
Invertebrate Gorgans head seastar Gorgonocephalidae BP 3 3 High 4.24 None
Expert override Guideline 9
As above Medium

Taxonomic G
roup
Com
mon N
ame
Scientific Nam
e
Role in Fishery*
Productivity
Susceptibility
Level 2 ERA
Risk
Category Score
Current and Planned
Managem
ent/ A
ssessment
Level 2 ERA
R
esidual Risk
Guideline(s) A
pplied
Justification
Level 2 ERA
R
esidual Risk
Score
Invertebrate Sponges Porifera – undifferentiated BP 3 2.33 High 3.80 None
Expert override Guideline 9
The Marine Protected Area is 162,000 km2 compared to the main trawl grounds in Aurora Trough (130 km2). Habitat and species distributions are represented in the MPA.
Low
Invertebrate Squid Onykia ingens BP 2.86 2.33 High 3.31 None Expert
override
Ubiquitous distribution (BRS). The Marine Protected Area is 162,000 km2 compared to the main trawl grounds in Aurora Trough (130 km2). Habitat and species distributions are represented in the MPA.
Medium
Chondrichthyan Southern sleeper shark Somniosus antarcticus DI 2.57 3 High 3.95 None
Expert override (AAD/CSIRO)
Assessment in 2002 indicated that impacts at present catch rates were not
Medium

Taxonomic G
roup
Com
mon N
ame
Scientific Nam
e
Role in Fishery*
Productivity
Susceptibility
Level 2 ERA
Risk
Category Score
Current and Planned
Managem
ent/ A
ssessment
Level 2 ERA
R
esidual Risk
Guideline(s) A
pplied
Justification
Level 2 ERA
R
esidual Risk
Score
likely to be serious risk to sleeper sharks. Ubiquitous distribution (BRS). The Marine Protected Area is 162,000 km2 compared to the main trawl grounds in Aurora Trough (130 km2). Habitat and species distributions are represented in the MPA.
Invertebrate Tube anemone, black and thorny corals Hexacorallia DI 3 3 High
4.24 None Expert override Guideline 9
The Marine Protected Area is 162,000 km2 compared to the main trawl grounds in Aurora Trough (130 km2). Habitat and species distributions are represented in the MPA.
Medium

27
Table 4 Summary of Level 2 PSA Residual Risk Results
Component Changed from high to medium
Changed from high to low
Changed from medium to low High Residual Risk Medium Residual
Risk Low Residual
Risk Target 1 0 0 0 1 0 Target Bait 0 0 0 0 0 0 Bycatch (discard) 3 0 0 0 3 0 Byproduct 34 7 0 0 34 7 TEP 3 0 0 0 3 0 Total 41 7 0 0 41 7
28
4. CONCLUSION The purpose in applying the Level 2 PSA residual risk guidelines was to take into account additional information and to ensure that the assessment was refined appropriately. Refinements were considered in either increasing or reducing the risk as appropriate.
Overall the most common guidelines used to assess residual risk were Guidelines 5 and 9. This is because the Macquarie Island Toothfish Fishery has 100% observer coverage, there were minimal to zero observed interactions with several species and the limited area (130 km2) of the main trawl fishing ground (Aurora Trough) compared to the area (162,000 km2) of the Marine Protected Area established under the National Representative System of Marine Protected Areas. Guideline 6 was used once where a Total Allowable Catch (TAC) has been developed for the species based upon scientific assessment and the fishery is compliant with the measure.
The residual risk process brings the ERA assessment up-to-date with most of the current management initiatives within the fishery. Using the results presented here, an appropriate management strategy will be developed to address the high priority species as part of the ERM framework.
29
GLOSSARY Activity Refers to any fishing activity.
Actual risk The real risk posed for a species from fishing activities.
Attribute A general term for a set of properties relating to the productivity or susceptibility of a particular unit of analysis.
Availability Used in Level 2 PSA assessment to calculate the impact on an ecological component due to a fishing activity. Considers overlap of fishing effort with a species distribution.
Bycatch That part of fisher’s catch which is returned to the sea either because it has no commercial value or regulations preclude it from being retained and;
that part of the catch that does not reach the deck of the fishing vessel but is affected by the interaction with the fishing gear.
Byproduct A non-target species captured in a fishery, that has value to the fisher and be retained for sale.
Catch limit The vessel catch limit is a limit on the quantity each individual vessel can land per trip or short period of time.
Component The marine ecosystem is broken down into five components for the risk assessment: target species (TA); byproduct (BI) and bycatch species (DI); threatened, endangered and protected species (TEP); habitats; and ecological communities.
Effort The total fishing gear in use for a specified period of time.
Encounterability Used in Level 2 PSA assessment to calculate the impact on an ecological component due to a fishing activity. Considers the likelihood that a species will encounter fishing gear that is deployed within the geographic range of that species (based on two attributes: adult habitat and bathymetry).
EPBC Act Environment Protection and Biodiversity Conservation Act (Cth) 1999
ERA Ecological risk assessment for the effects of fishing as developed by AFMA and CSIRO.
ERM Framework Ecological risk management process outlined by AFMA.
False negative Species assessed to be low risk when they are actually high risk.
False positive Species assessed to have a high risk when they are actually low risk
Fishery A related set of fish harvesting activities regulated by an authority (e.g. South-East Trawl Fishery).
Gear The equipment used for fishing, e.g. gillnet, Danish seine, pelagic longline, midwater trawl, purse seine, trap etc.

30
Level 1 The level of the ERA assessment which includes a qualitative assessment of scale, intensity, consequence analysis (SICA).
Potential risk Possible risk as a result of fishing activities
Post Capture Mortality Used in Level 2 PSA assessment to calculate the impact on an ecological component due to a fishing activity. Considers the condition and subsequent survival of a species that is captured and released (or discarded).
Precautionary The approach whereby, if there is uncertainty about the risk, risk is assumed to be high, unless there is advice to the contrary.
PSA Productivity susceptibility analysis for Level 2 assessment of the ecological assessment.
Productivity This determines the rate at which the unit can recover after potential depletion or damage by the fishing.
Level 2 PSA Residual Risk In the context of this document residual risk means the residual risk
after the Level 2 PSA assessment.
Scoping A general step in an ERA or the first step in the ERAEF involving the identification of the fishery history, management, methods, scope and activities.
Selectivity Used in Level 2 PSA assessment to calculate the impact on an ecological component due to a fishing activity. Considers the potential of the gear to capture or retain species.
SICA Scale, intensity, consequence analysis for the Level 1 assessment.
Spatial management Fisheries management that encompasses spatial arrangements such as depth closures or area closures.
Susceptibility Used in Level 2 PSA assessment to calculate the impact on an ecological component due to a fishing activity. The extent of the impact due to the fishing activity, determined by the affect of the fishing activities on the unit.
Unit The entities for which attributes are scored in the Level 2 analysis. For example, the units of analysis for the Target Species component are individual “species”.

31
APPENDIX A - SUMMARY OF PRODUCTIVITY AND SUSCEPTIBILITY SCORING Productivity The productivity of a unit determines the rate at which the unit can recover after potential depletion or damage by fishing. The productivity score is the average of the following attributes:
1. Average age of species at maturity;
2. Average size of species at maturity;
3. Average maximum age of species;
4. Average maximum size of species;
5. Fecundity of species;
6. Reproductive strategy of species; and
7. Trophic level: organisms position in the food chain. Susceptibility Susceptibility is the extent of the impact on an ecological component due to a fishing activity. The susceptibility score is the product of the following attributes:
1. Availability: considers overlap of fishing effort with a species distribution;
2. Encounterability: considers the likelihood that a species will encounter fishing gear that is deployed within the geographic range of that species (based on two attributes: adult habitat and bathymetry);
3. Selectivity: considers the potential of the gear to capture or retain species; and
4. Post Capture Mortality: considers the condition and subsequent survival of a species that is captured and released (or discarded).
Based on the Level 2 results, if a unit is assessed at low risk from fishing, the rationale is documented and it is not assessed at a higher level. For units assessed at medium or high risk, management arrangements to mitigate the risks are to be further investigated and implemented. If there are no planned or agreed management arrangements, the assessment moves to Level 3 (for more detail, refer to Hobday et al., 2007).

32
REFERENCES Hobday, A.J., Smith, A, Webb, H., Daley, R., Wayte, S., Bulman, C., Dowdney, J., Williams, A., Sporcic, M., Dambacher, J., Fuller, M., Walker, T., 2007, Ecological Risk Assessment for Effects of Fishing: Methodology, Report Ro4/1072, Australian Fisheries Management Authority, Canberra.
Standards Australia, 2004, Australian/New Zealand Standard: Risk Management, Third Edition, Standards Australia International Ltd, Sydney, and Standards New Zealand, Wellington.

33
Attachment 1
Additional information used in preparing the residual risk reports for Antarctic fisheries Commission for the Conservation of Antarctic Marine Living Resources
AFMA is responsible for the day to day management of the Australia’s two sub-Antarctic fisheries: the Heard Island and McDonald Islands (HIMI) Fishery and the Macquarie Island Toothfish Fishery (MITF). Both fisheries are managed in accordance with arrangements determined by the Commission for the Conservation of Antarctic Marine Living Resources (CCAMLR).
CCAMLR is responsible for managing a regime for the conservation of Antarctic marine living resources under the Convention on the Conservation of Antarctic Marine Living Resources (the Convention) which was established under the Antarctic Treaty System in 1980. The need for a regime arose in response to concern about the Antarctic ecosystem, and a desire to avoid the overexploitation that had occurred in fisheries in many other regions.
The Convention area and jurisdiction covers approximately 32.9 million square kilometres (see map at Figure 1) within the area south of 60º South and up to the Antarctic Convergence, which form part of the Antarctic marine ecosystem. The Antarctic Convergence is a significant feature where colder polar waters meet more temperate waters to the north and forms an effective biological barrier to most Southern Ocean species.
Figure 1: CCAMLR statistical areas

34
CCAMLR develops internationally agreed management measures for the sub-Antarctic and Antarctic regions, including waters covering the HIMI Fishery. AFMA requires that fisheries in waters adjacent to the CCAMLR area, which includes Macquarie Island, are managed in a complementary manner to the Conservation Measures requirements, and has incorporated a number of measures that exceed the CCAMLR requirements.
CCAMLR was the first international regional agreement to stipulate a precautionary ecosystem management approach. This approach requires that management considers the effects of any harvesting on dependant and associated species, not just the target species, and that ecological relationships be maintained.
CCAMLR’s approach to the conservation of Antarctic marine living resources is defined by Article II of the Convention. From the principles outlined in Article II, two central concepts have evolved to guide CCAMLR in carrying out its management responsibilities, namely:
1. Management strives to follow a ‘precautionary’ approach. This means that CCAMLR collects the data it can, then weighs up the extent and effect of the uncertainties and gaps in such data before making a management decision. The approach aims to minimise the risk of long-term adverse effects rather than delaying decisions until all necessary data are available.
2. Management also follows an ‘ecosystem’ approach. Ideally, this takes into account all the delicate and complex relationships between organisms (of all sizes) and physical processes (such as currents and sea temperature) that constitute the Antarctic marine ecosystem.
CCAMLR’s ecosystem approach therefore not only focuses on regulating fishing for certain species, it also aims to ensure that fishing does not impact adversely on other species that are related to, or dependent on, the target species. Information on predators, prey and the environment are collected simultaneously and submitted to the CCAMLR Working Group on Ecosystem Monitoring and Management for the preparation of advice to the Scientific Committee. This information is then incorporated into the management arrangements for each Statistical Division.
For example, while icefish harvesting is regulated and monitored directly, CCAMLR also endeavours to monitor the effect which harvesting may exert on species that either eat icefish or which are themselves eaten by icefish as predators (eg: krill). CCAMLR therefore sets precautionary catch limits for icefish to take account of the needs of associated species and to preserve the ecological sustainability of all the species concerned.
CCAMLR draws on five main sources to improve data collection: fisheries catch and effort statistics; biological information and data on by-catches of fish and ecologically related species
(eg: benthic invertebrates) in commercial fisheries; seabirds and marine mammals caught during commercial operations and collected
by national and international scientific observers; biological information collected during scientific and fishery-independent surveys;
and biological information on krill and dependent species collected as part of the
CCAMLR Ecosystem Monitoring Program.

35
The assessments of fish stocks are undertaken in accordance with a precautionary approach endorsed by CCAMLR in the mid 1990s. The objective of this approach is to maintain a stock at a proportion of its pre-exploitation abundance such that:
escapement of the spawning stock must be sufficient to avoid the likelihood of declining recruitment; and
abundance under exploitation must maintain a sufficient resource for the needs of dependant species (usually predators).
When these two objectives are articulated for a particular species they give rise to biological reference points that form the basis for decision rules (see Table 1 which shows the process for the target species in the HIMI Fishery). The decision rules provide the foundation for incorporating uncertainties regarding population parameters and stock status into assessments of fishing strategies designed to meet the objectives. The biological reference points for each of the target species include a minimum escapement of spawning biomass. This escapement allows not only for reproduction, but also for trophic interactions within the food web.
The diagram in Figure 2 outlines the approach adopted for the management of sub-Antarctic fisheries.
Observer coverage
Two observers are deployed for every trip on all vessels operating in sub-Antarctic and Antarctic fisheries. This situation is unique for a Commonwealth managed fishery and has resulted in a very comprehensive data collection on all target and bycatch species. 100% observer coverage has enabled most of the bycatch to be identified and weighed which has provided a complete picture of fishing operations. The quantities of species identified are therefore very accurate.
AFMA’s observer program has collected information on the landed catch from over 90% of the trawl shots and longline sets undertaken in the HIMI Fishery and MITF since operations began in 1997 and 1994 respectively. Fisheries scientists from AAD and CSIRO have worked closely with the observers, masters and crew since the Fishery commenced to ensure that this data set is an accurate reflection of fishing activity.
Observers are trained in bycatch quantification methodology and also receive training and identification guides from AAD, which enable them to identify most bycatch species and retain samples of any unknown or unidentified species.
The observers undertake the collection of information on all bycatch on a shot by shot basis. The vessel’s crew assist by setting aside any bycatch mixed in with the target species so that the observers can partition it by species, count and weigh it, as well as undertake biological sampling or analyses of particular species.
The breadth of data collected on target and bycatch species in logbooks and by observers in the HIMI Fishery and MITF exceeds CCAMLR standards. Observers also collect extensive biological samples from target and bycatch species so scientists can better understand the biology of these species. The collection of otoliths for example is essential in the development of length-at-age keys needed to convert length frequency data into age density information needed in the stock assessment model.
Some species, such as sleeper sharks, are difficult to handle so weight estimates are made following scientific assessments provided by AAD or CSIRO.

36
Table 1. Steps used in calculating yield for target species
Objective Method(s) used for each target species Patagonian toothfish Mackerel icefish
Estimate year class strengths of recruits to the Fishery
Annual estimates of year-class strength at age four obtained by decomposing length-density data from the random stratified trawl surveys into age classes using statistical routines (Constable et al 2006)
Each year, the different age classes are projected forward 35 years using an estimate of natural mortality, fishing mortality, growth
Estimates of year-class strength at ages two, three and four on Heard Island Plateau obtained by decomposing length-density data from random stratified trawl surveys into age classes using statistical routines (de la Mare 1994)
Growth and natural mortality estimates
Estimates of modified von Bertalanffy growth parameters are derived from age at length and tag recapture length density information (Candy et al 2006) Natural mortality rates are estimated based on empirical relationships between natural mortality and growth rates extrapolated across other fish stocks, and a value agreed at WG-FSA • relies on age verification from otolith
studies to develop age-length keys
Derived primarily from length density information. Some otoliths are still collected however there is no consensus within CCAMLR on a technique for reading otoliths
Other biological and Fishery parameters determined
Obtained from: • length at maturity information from
sampling – although mainly based on other CCAMLR data given the lack of mature fish caught in the Fishery
• standardised catch rate time series • fishery selectivity estimated within the
model for different sub-fisheries • catch weighted length frequency
information from surveys • information on removals factored in,
including IUU catch
Obtained from • length at maturity information • catch weighted length frequency
information from pre-recruit surveys
• additional information on spatial separation of stocks may be used to update fishing selectivity functions
• information on removals factored in
Biological reference points • That the probability that spawning biomass will fall below 20% of the pre exploitation level over the 35 year projection period must not exceed 0.1; and
• the median escapement for the Fishery of the spawning biomass shall not be less than 50% over a 35 year projection
noting that lower figure derived from these calculations is taken as the TAC.
• That the probability that spawning biomass will fall below 20% of the pre exploitation level over the two year projection period must not exceed 0.1; and
• the median escapement for the Fishery of the spawning biomass shall not be less than 75% over a two year projection
noting that lower figure derived from these calculations is taken as the TAC
Method used by AAD to calculate yield
CCAMLR decision rules implemented in CASAL (Bull et al 2005)
Short-term assessment based on the principles of the GYM (de la Mare et al. 1998)
SARAG Domestic review of assessment Domestic review of assessment Assessment completed for WG-FSA
Submitted by the Australian delegation Submitted by the Australian delegation
WG-FSA recommends to the CCAMLR Scientific Committee
TAC by area/sub-area/gear type TAC by area/sub-area/gear type
CCAMLR annual meeting TACs, closures and other measures set out in Conservation Measures
TACs, closures and other measures set out in Conservation Measures
SARAG and SouthMAC SARAG reviews CCAMLR TACs SouthMAC endorses TACs to AFMA Commission
SARAG reviews CCAMLR TACs SouthMAC endorses TACs to AFMA Commission
AFMA Commission Approves TACs, allocated as ITQ SFRs Approves TACs, allocated as ITQ SFRs

Annual consideration of fishing controls (SARAG-SouthMAC-AFMA Board; CCAMLR)
Evaluate and advise on fisheries and habitat/ecosystem effects- target species – precautionary catch limits (accounting for uncertainty)- decision rules and reference points (ecosystem approach)- by-catch – strategy progression – avoidance, mitigation, by-catch level (not expected to be taken each year)
Fisheries Operations Controls (FOC)
Fisheries Assessment Plan (FAP)(Research and Data Collection)
Open areas
Designated activitiesSeason Operations
Observe by-catchand other specified data
Compare trigger
Shot
Designated Actionsin FOC
Fishing area
higher lower
Move
Research
Closed Areas
No fishingFAP requirements
Boat limit (3) and Gear restrictionsObservers 100% x 2Haul by haul data – vessel + observersIndependent research time - 20 days
HIMI marine reserveHIMI Conservation Zones
Under active review:HIMI Conservation ZonesDeep water habitatsDistribution of by-catch speciesBy-catch strategies (skates)
Research support by AAD:Observer program supportDatabase managementStock assessmentsFish and fisheries researchMarine mammal & seabird bycatch mitigationEcosystem and conservation research
Figure 2

38
In trawl operations the observers also regularly inspect the meshes of the net for entangled fish and other general bycatch, and these specimens are then added to bycatch gleaned from the fish pounds into which the contents of the trawl net’s codend is emptied.
The data collected on bycatch composition and abundance is then entered onto an onboard database, which integrates trawl shot information, shot by shot total catch estimates, target species biological data and bycatch information.
Interpretation of Guideline 5
Guideline 5 of the residual risk guidelines is ‘at risk in regards to level of interaction/capture with a zero or negligible level of susceptibility’. Given there is 100% observer coverage in sub-Antarctic fisheries the following rules have been applied where there have been minimal catch levels of bycatch species:
where the catch level is less than an average of one specimen per year during the four year assessment period a zero catch has been applied;
for invertebrate species – minimal level is interpreted as where the average catch over the four year assessment period is less than 10 kilograms per year;
for teleost species – minimal level is interpreted as where the average catch over the four year assessment period is less than 50 kilograms per year; and
for chondrichthyan species – minimal level is interpreted as where the average catch over the four year assessment period is less than 100 kilograms per year.
Measures to limit the take of fish bycatch
Management of the HIMI Fishery and MITF has been directed at addressing target species sustainability, bycatch mitigation and sustainability issues and the predator/prey relationships between the target and bycatch species (including mammals and seabirds).
Information on bycatch is collected in two ways:
1. the master of the vessel is required to record estimates of bycatch; and.
2. AFMA authorised observers quantify the composition of the bycatch.
Observers have collected comprehensive independent data on bycatch. Table 2 shows the percentage of fish bycatch in the total catch weight.
Fishery Fish bycatch (% of total catch weight)
HIMI trawl 0.65%
HIMI longline 9.16%
MITF demersal trawl 9.95%
Table 2: Percentage of fish bycatch

39
There is a range of output and input controls in place to ensure catches of bycatch species remain within sustainable limits:
Catch limits
The prohibition on targeting bycatch species in the HIMI Fishery and MITF is the central measure in place to keep catches of bycatch species at sustainable levels. Catch limits for target and bycatch species are set by AFMA taking into account CCAMLR’s recommendations (in the case of the HIMI Fishery), and specifically incorporate provisions for escapement of the target species to meet requirements of predator species such as mammals and seabirds.
In the HIMI Fishery stock assessments are carried out on a range of bycatch species to ensure their sustainability, and limits set through CCAMLR, AFMA, the Sub-Antarctic Resource Assessment Group (SARAG) and the Sub-Antarctic Fisheries Management Advisory Committee (SouthMAC).
In the HIMI Fishery and MITF there are bycatch limits in place which limit the amount of bycatch that can be taken for all species.
In the HIMI Fishery the following catch limits apply to specific bycatch fish species:
Macrourus spp 360 tonnes
Unicorn icefish (Channichthys rhinoceratus) 150 tonnes
Skates and Rays (Bathyraja spp.) 120 tonnes
Grey rockcod (Lepidonotothen squamifrons) 80 tonnes
All other species 50 tonnes (for each species)
In the MITF the following arrangements apply to the bycatch of fish species:
200 tonnes for all bycatch species combined, with a 50 tonnes limit for any one species
If a precautionary limit is reached, the directed Fishery in which it occurs is closed for the remainder of the season, so there is a strong incentive for industry to avoid catching bycatch species.
Other measures
Other measures in place to avoid capture and mortality of fish bycatch species include:
minimum quota holdings to ensure no more than three boats can operate in the fisheries at any one time;
regulations under the Management Plans state that the mesh-size of the trawl nets used must not be less than 120 mm. These requirements, while primarily designed to reduce the catch of under size target species, also reduces the take of small bycatch species;
limits exists on minimum bobbin diameter and rubber disc sizes to reduce the bycatch of sessile organisms and reduce benthic impacts;
sharks and skates can be returned to the sea under the Management Plans. Observers and crew try to return these animals quickly and many of these are expected to survive, and tagging programs are in place to help evaluate this.

40
move on provisions apply to all fish bycatch species in the HIMI Fishery. These provisions prevent vessels accumulating catches of bycatch species caught as a result of aggregations of these species coinciding with commercial quantities of target species. The provision is triggered if the catch for a trawl shot or longline set exceeds either one tonne or two tonnes (depending on the bycatch species taken). The fishing vessel is required to move at least five nautical miles of the location where the bycatch exceeded the limit for a period of at least five days.
Measures to limit the take of seabird and marine mammal bycatch
There are also a range of measures in place to limit interactions with seabirds and marine mammals. The measures include:
the discharge of offal is prohibited (other than in emergency circumstances) and this reduces the attractiveness of the fished areas to bycatch species which might otherwise be attracted by fish waste making them more susceptible to capture in subsequent fishing operations. All offal and retained bycatch are either turned into fish meal, or frozen and stored on board. The release of tagged live fish, skates, sharks and crabs is permitted;
in longline operations - using integrated weight line, paired streamer lines, brickle curtains and seasonal closures all designed to avoid seabirds attending the baits;
in midwater trawl operations - no midwater trawling occurs during the period 1 February to 31 March each year;
minimising of lighting on fishing boats to reduce the risk of seabirds colliding with boats;
restrictions on plastic packaging bands, avoiding any possible impact these bands may have on wild animals;
a requirement that all plastic is burned and that plastic residue must not be discarded at sea to avoid wild animals having any interactions with plastic;
a restriction on the discharge of poultry products or brassicas to avoid the introduction of avian diseases and non-native plants;
adoption of strict limits on the number of seabirds that may be incidentally taken in longline operations in the HIMI Fishery and MITF.
Fishers are required to submit detailed reports of each wildlife interaction within 24 hours of the occurrence. Each report must also include a detailed response to the wildlife interaction which must be implemented immediately by the fisher to minimise the likelihood of similar interactions. The reports are submitted by AFMA to the Protected Species Unit at the Department of the Environment, Water, Heritage and the Arts (DEWHA).
Marine protected areas There are significant areas of the exclusive economic zone (EEZ) around HIMI and Macquarie Island have been set aside as marine protected areas, which have been established under the National Representative System of Marine Protected Areas (NRSMPA).
The majority of the EEZ around HIMI and Macquarie Island are not trawled because it is unsuitable trawl ground, due largely to the excessive depth. Of the areas that are shallow enough to trawl, operators tend to concentrate on areas that are known to hold assemblages of the target species.

41
No fishing is permitted within the HIMI Marine Reserve and management arrangements stipulate an additional one nautical mile buffer zone around the Reserve region of each Island. The HIMI Marine Reserve is one of the world’s largest protected marine reserve and provides representative ecosystem protection across the physiological classifications, setting aside over 39% of all waters shallower than 1000 metres in the EEZ. In the HIMI Fishery an assessment of the Conservation Zones is currently progressing which may result in further areas being set aside as marine protected areas.
It is estimated that around 28% of the fishable area is protected as part of the HIMI Marine Reserve.
The Macquarie Island Marine Park comprises almost one third of the EEZ around Macquarie Island and contains one of the world’s largest ‘no take’ areas. The Aurora Trough sector is the main trawl ground where the majority of the catch is taken and covers a total of 130 square kilometres. The Marine Park covers 162,000 square kilometres, from a total EEZ area of 476,000 square kilometres.
In the Fisheries Research and Development Corporation (FRDC) project ‘Ecological sustainable development of the fishery for Patagonian toothfish (Dissostichus eleginoides) around Macquarie Island: population parameters, population assessment and ecological interactions’ completed in 2001 it was stated that the vast majority of fish bycatch is of common and widespread species and fishing harvest rates are not considered a threat to their populations either locally or globally. While some invertebrate types may be vulnerable to fishing operations, these are predominantly found outside the established fishing grounds where fishing effort is low (He et al, 2001).
The FRDC has approved a four year project (commenced 1 July 2006) to investigate ‘Demersal fishing interactions with marine benthos in the Australian EEZ of the Southern Ocean: an assessment of the vulnerability of benthic habitats to damage by demersal gears’. The development of underwater camera technology which can be attached to the fishing gear (trawl, longline and pot) is a key aim of the project.
Interpretation of guideline 9 Guideline 9 of the residual risk guidelines is ‘management arrangements relating to seasonal, spatial and depth closures’. This guideline has been applied to a number of species in recognition that they were established under the NRSMPA. The marine protected areas were selected on the basis of their conservation values, the unique features of the benthic and pelagic environments and as representative marine habitats in the area.
This is considered to be representative of the habitats and species distribution found in the region. In combination with the limited seasonality and distribution of fishing activity it is considered that the established marine protected areas fulfil the criteria set out in guideline 9.