Residential Sales Report - December 2011
19
A RESEARCH TOOL PROVIDED BY THE AUSTIN BOARD OF REALTORS® December 2011 Quick Facts Residential Sales Report - 1.3% Change in Median Sales Price There's no way to be certain what 2012 will bring. However, a few things do seem clear enough to make some assessments. First, 2011 was not the recovery year it was expected to be. It was yet another “transition year” for most. Second, multi-decade low mortgage rates and suppressed home prices coalesced to form an attractive purchase environment. And buyers did just what their name implies. This has driven down inventory levels in many locales, which—thirdly—nudged the market balance toward equilibrium. Here's how the - 22.5% Change in Inventory + 2.6% Change in Closed Sales Market Overview 2 New Listings 3 Pending Sales 4 Closed Sales 5 Days On Market Until Sale 6 Median Sales Price 7 Average Sales Price 8 9 Housing Affordability Index 10 Inventory of Homes for Sale 11 Months Supply of Inventory 12 Data is refreshed regularly to capture changes in market activity so figures shown may be different than previously reported.•Current as of January 10, 2012. All data from ABOR Multiple Listing Service. Powered by 10K Research and Marketing. Click on desired metric to jump to that page. final month of 2011 concluded the year. New Listings in the Austin region decreased 11.9 percent to 1,582. Pending Sales were up 21.4 percent to 1,413. Inventory levels shrank 22.5 percent to 7,758 units, extending the signature trend of 2011. Prices were fairly stable. The Median Sales Price decreased 1.3 percent to $186,450. Days on Market decreased 8.7 percent to 84 days. Absorption rates improved as Months Supply of Inventory was down 28.8 percent to 4.2 months. Ultimately, the upcoming spring market should be a major tell about the future direction of housing. Sellers are seeing multiple-offer situations; buyers are seeing sub-4.0 percent loans; supply-demand trends are more balanced. When it gets down to it, that's a stable foundation and a far cry from 2009. While the fundamentals are better, the foreclosure situation and political unknowns remain wildcards. For now, enjoy the fresh canvas. Percent of List Price Received Team Price Real Estate http://www.teamprice.com 512-524-6608 7320 N Mo-Pac Ste 305 Austin TX 78731
-
Upload
team-price-real-estate -
Category
Real Estate
-
view
238 -
download
2
description
Transcript of Residential Sales Report - December 2011

A RESEARCH TOOL PROVIDED BY THE AUSTIN BOARD OF REALTORS®
December 2011 Quick Facts
Residential Sales Report
- 1.3%
Change inMedian Sales Price
There's no way to be certain what 2012 will bring. However, a few things do seem clear enough to make some assessments. First, 2011 was not the recovery year it was expected to be. It was yet another “transition year” for most. Second, multi-decade low mortgage rates and suppressed home prices coalesced to form an attractive purchase environment. And buyers did just what their name implies. This has driven down inventory levels in many locales, which—thirdly—nudged the market balance toward equilibrium. Here's how the
- 22.5%
Change inInventory
+ 2.6%
Change inClosed Sales
Market Overview 2New Listings 3Pending Sales 4Closed Sales 5Days On Market Until Sale 6Median Sales Price 7Average Sales Price 8
9Housing Affordability Index 10Inventory of Homes for Sale 11Months Supply of Inventory 12
Data is refreshed regularly to capture changes in market activity so figures shown may be different than previously reported.•Current as of January 10, 2012. All data from ABOR Multiple Listing Service. Powered by 10K Research and Marketing.
Click on desired metric to jump to that page.
y g qfinal month of 2011 concluded the year.
New Listings in the Austin region decreased 11.9 percent to 1,582. Pending Sales were up 21.4 percent to 1,413. Inventory levels shrank 22.5 percent to 7,758 units, extending the signature trend of 2011.
Prices were fairly stable. The Median Sales Price decreased 1.3 percent to $186,450. Days on Market decreased 8.7 percent to 84 days. Absorption rates improved as Months Supply of Inventory was down 28.8 percent to 4.2 months.
Ultimately, the upcoming spring market should be a major tell about the future direction of housing. Sellers are seeing multiple-offer situations; buyers are seeing sub-4.0 percent loans; supply-demand trends are more balanced. When it gets down to it, that's a stable foundation and a far cry from 2009. While the fundamentals are better, the foreclosure situation and political unknowns remain wildcards. For now, enjoy the fresh canvas.
Percent of List Price Received
Team Price Real Estate http://www.teamprice.com 512-524-6608
7320 N Mo-Pac Ste 305 Austin TX 78731

Market OverviewKey market metrics for the current month and year-to-date.
All data comes from the ABOR Multiple Listing Service. Provided by the Austin Board of REALTORS®. Powered by 10K Research and Marketing. | Click for Cover Page | 2
6.0
180 + 12.3%
- 22.5%
- 28.8%
7,758
4.2
161
--
-- --
--
--Months Supplyof Homes for Sale
Inventory of Homes for Sale
- 1.3% $188,000 $189,000
- 0.2%
- 8.7% 74 80 + 9.0%
+ 0.5%
+ 1.2% 93.2% 93.0%
- 12.0%
1,164 1,413 + 21.4% 20,121 21,916 + 8.9%
34,7421,795 1,582 - 11.9% 39,466
1,573 1,614 + 2.6% 20,062
New Listings
Pending Sales
Closed Sales
91.5% 92.5%
Housing Affordability Index
Days on Market Until Sale
Median Sales Price
Average Sales Price
Percent of OriginalList Price Received
$245,024
21,261 + 6.0%
160
10,005
92 84
178 + 10.6%
--
$245,565 $250,518 + 2.0%
$189,000 $186,450
$243,232 - 0.7%
12-2008 12-2009 12-2010 12-2011
12-2008 12-2009 12-2010 12-2011
12-2008 12-2009 12-2010 12-2011
12-2008 12-2009 12-2010 12-2011
12-2008 12-2009 12-2010 12-2011
12-2008 12-2009 12-2010 12-2011
12-2008 12-2009 12-2010 12-2011
12-2008 12-2009 12-2010 12-2011
12-2008 12-2009 12-2010 12-2011
12-2008 12-2009 12-2010 12-2011
Team Price Real Estate http://www.teamprice.com 512-524-6608
7320 N Mo-Pac Ste 305 Austin TX 78731

New Listings A count of the properties that have been newly listed on the market in a given month.
MonthPrior Year
Current Year
+ / –
January 3,318 2,785 -16.1%
February 3,493 2,669 -23.6%
March 4,679 3,971 -15.1%
April 4,960 3,755 -24.3%
May 3,464 3,545 +2.3%
June 3,796 3,551 -6.5%
July 3,674 3,164 -13.9%
August 2,978 2,702 -9.3%
September 2,683 2,484 -7.4%
October 2,543 2,482 -2.4%
November 2,083 2,052 -1.5%
December 1,795 1,582 -11.9%
12-Month Avg 3,289 2,895 -12.0%
All data comes from the ABOR Multiple Listing Service. Provided by the Austin Board of REALTORS®. Powered by 10K Research and Marketing. | Click for Cover Page | 3
1,969 1,795
1,582
2009 2010 2011
December
1,000
1,500
2,000
2,500
3,000
3,500
4,000
4,500
5,000
5,500
1-2004 1-2005 1-2006 1-2007 1-2008 1-2009 1-2010 1-2011
Historical New Listing Activity
38,067 39,466
34,742
2009 2010 2011
Year To Date
-12.0% -8.8% -11.9% +3.7%
Team Price Real Estate http://www.teamprice.com 512-524-6608
7320 N Mo-Pac Ste 305 Austin TX 78731

Pending Sales A count of the properties on which contracts have been accepted in a given month.
MonthPrior Year
Current Year
+ / –
January 1,479 1,451 -1.9%
February 1,795 1,570 -12.5%
March 2,429 2,043 -15.9%
April 2,872 2,107 -26.6%
May 1,443 2,257 +56.4%
June 1,659 2,191 +32.1%
July 1,640 2,107 +28.5%
August 1,527 1,872 +22.6%
September 1,397 1,706 +22.1%
October 1,423 1,663 +16.9%
November 1,293 1,536 +18.8%
December 1,164 1,413 +21.4%
12-Month Avg 1,677 1,826 +8.9%
All data comes from the ABOR Multiple Listing Service. Provided by the Austin Board of REALTORS®. Powered by 10K Research and Marketing. | Click for Cover Page | 4
1,108 1,164
1,413
2009 2010 2011
December
1,000
1,500
2,000
2,500
3,000
3,500
1-2004 1-2005 1-2006 1-2007 1-2008 1-2009 1-2010 1-2011
Historical Pending Sales Activity
21,129 20,121
21,916
2009 2010 2011
Year To Date
+8.9% +5.1% +21.4% -4.8%
Team Price Real Estate http://www.teamprice.com 512-524-6608
7320 N Mo-Pac Ste 305 Austin TX 78731
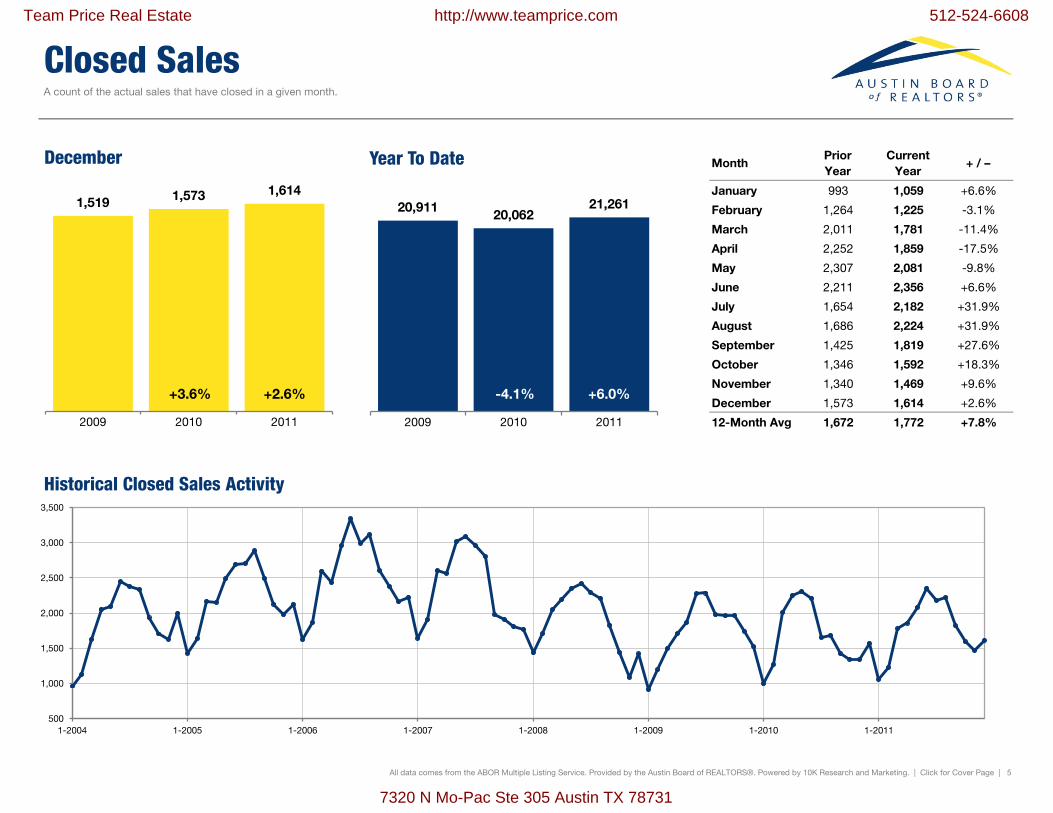
Closed Sales A count of the actual sales that have closed in a given month.
MonthPrior Year
Current Year
+ / –
January 993 1,059 +6.6%
February 1,264 1,225 -3.1%
March 2,011 1,781 -11.4%
April 2,252 1,859 -17.5%
May 2,307 2,081 -9.8%
June 2,211 2,356 +6.6%
July 1,654 2,182 +31.9%
August 1,686 2,224 +31.9%
September 1,425 1,819 +27.6%
October 1,346 1,592 +18.3%
November 1,340 1,469 +9.6%
December 1,573 1,614 +2.6%
12-Month Avg 1,672 1,772 +7.8%
All data comes from the ABOR Multiple Listing Service. Provided by the Austin Board of REALTORS®. Powered by 10K Research and Marketing. | Click for Cover Page | 5
1,519 1,573 1,614
2009 2010 2011
December
500
1,000
1,500
2,000
2,500
3,000
3,500
1-2004 1-2005 1-2006 1-2007 1-2008 1-2009 1-2010 1-2011
Historical Closed Sales Activity
20,911 20,062 21,261
2009 2010 2011
Year To Date
+6.0% +3.6% +2.6% -4.1%
Team Price Real Estate http://www.teamprice.com 512-524-6608
7320 N Mo-Pac Ste 305 Austin TX 78731

Days on Market Until Sale Average number of days between when a property is listed and when an offer is accepted in a given month.
MonthPrior Year
Current Year
+ / –
January 79 88 +11.9%
February 72 93 +28.6%
March 69 92 +32.9%
April 66 81 +22.3%
May 62 76 +22.2%
June 67 72 +8.3%
July 70 74 +5.8%
August 72 77 +7.1%
September 77 78 +0.6%
October 88 80 -9.1%
November 86 79 -8.3%
December 92 84 -8.7%
12-Month Avg 74 80 +9.0%
All data comes from the ABOR Multiple Listing Service. Provided by the Austin Board of REALTORS®. Powered by 10K Research and Marketing. | Click for Cover Page | 6
79
92 84
2009 2010 2011
December
40
50
60
70
80
90
100
1-2004 1-2005 1-2006 1-2007 1-2008 1-2009 1-2010 1-2011
Historical Days on Market Until Sale
76 74 80
2009 2010 2011
Year To Date
+9.0% +15.6% -8.7% -2.7%
Team Price Real Estate http://www.teamprice.com 512-524-6608
7320 N Mo-Pac Ste 305 Austin TX 78731

Median Sales Price Median price point for all closed sales, not accounting for seller concessions, in a given month.
MonthPrior Year
Current Year
+ / –
January $175,000 $184,500 +5.4%
February $180,745 $185,000 +2.4%
March $178,000 $182,000 +2.2%
April $185,000 $189,900 +2.6%
May $186,000 $192,000 +3.2%
June $198,000 $198,000 0.0%
July $211,555 $190,000 -10.2%
August $194,000 $191,500 -1.3%
September $188,731 $185,000 -2.0%
October $190,000 $188,000 -1.1%
November $179,500 $184,000 +2.5%
December $189,000 $186,450 -1.3%
12-Mo. Median $188,000 $189,000 +0.5%
All data comes from the ABOR Multiple Listing Service. Provided by the Austin Board of REALTORS®. Powered by 10K Research and Marketing. | Click for Cover Page | 7
$186,000 $189,000 $186,450
2009 2010 2011
December
$140,000
$150,000
$160,000
$170,000
$180,000
$190,000
$200,000
$210,000
$220,000
1-2004 1-2005 1-2006 1-2007 1-2008 1-2009 1-2010 1-2011
Historical Median Sales Price
$185,000 $188,000 $189,000
2009 2010 2011
Year To Date
+0.5% +1.6% -1.3% +1.6%
Team Price Real Estate http://www.teamprice.com 512-524-6608
7320 N Mo-Pac Ste 305 Austin TX 78731

Average Sales Price Average sales price for all closed sales, not accounting for seller concessions, in a given month.
MonthPrior Year
Current Year
+ / –
January $233,052 $241,053 +3.4%
February $233,103 $237,568 +1.9%
March $230,812 $241,053 +4.4%
April $228,668 $261,609 +14.4%
May $236,487 $259,972 +9.9%
June $265,235 $262,654 -1.0%
July $275,446 $255,611 -7.2%
August $257,321 $250,399 -2.7%
September $241,609 $244,758 +1.3%
October $255,409 $247,876 -2.9%
November $243,559 $243,327 -0.1%
December $245,024 $243,232 -0.7%
12-Month Avg $245,565 $250,518 +2.0%
All data comes from the ABOR Multiple Listing Service. Provided by the Austin Board of REALTORS®. Powered by 10K Research and Marketing. | Click for Cover Page | 8
$248,772 $245,024 $243,232
2009 2010 2011
December
$180,000
$190,000
$200,000
$210,000
$220,000
$230,000
$240,000
$250,000
$260,000
$270,000
$280,000
1-2004 1-2005 1-2006 1-2007 1-2008 1-2009 1-2010 1-2011
Historical Average Sales Price
$236,398 $245,565 $250,518
2009 2010 2011
Year To Date
+ 2.0% - 1.5% - 0.7% + 3.9%
Team Price Real Estate http://www.teamprice.com 512-524-6608
7320 N Mo-Pac Ste 305 Austin TX 78731

Percent of Original List Price Received
MonthPrior Year
Current Year
+ / –
January 93.1% 91.6% -1.7%
February 93.5% 92.3% -1.3%
March 94.4% 92.6% -1.9%
April 94.8% 93.4% -1.4%
May 94.8% 93.4% -1.4%
June 94.1% 93.8% -0.3%
July 93.1% 93.5% +0.4%
August 92.4% 93.2% +0.8%
September 91.9% 92.9% +1.1%
October 91.2% 93.0% +2.0%
November 91.3% 92.8% +1.7%
December 91.5% 92.5% +1.2%
12-Month Avg 93.2% 93.0% -0.2%
All data comes from the ABOR Multiple Listing Service. Provided by the Austin Board of REALTORS®. Powered by 10K Research and Marketing. | Click for Cover Page | 9
Percentage found when dividing a property’s sales price by its original list price, then taking the average for all properties sold in a given month, not accounting for seller concessions.
93.1% 91.5% 92.5%
2009 2010 2011
December
91.0%
92.0%
93.0%
94.0%
95.0%
96.0%
97.0%
98.0%
99.0%
1-2004 1-2005 1-2006 1-2007 1-2008 1-2009 1-2010 1-2011
Historical Percent of Original List Price Received
93.4% 93.2% 93.0%
2009 2010 2011
Year To Date
-0.2% -1.8% +1.2% -0.1%
Team Price Real Estate http://www.teamprice.com 512-524-6608
7320 N Mo-Pac Ste 305 Austin TX 78731

Housing Affordability Index
MonthPrior Year
Current Year
+ / –
January 162 168 +4.1%
February 157 167 +6.3%
March 160 171 +7.1%
April 154 166 +7.7%
May 154 168 +8.9%
June 149 165 +10.4%
July 144 170 +18.2%
August 157 174 +10.7%
September 161 181 +12.6%
October 161 177 +10.2%
November 170 182 +7.0%
December 160 180 +12.3%
12-Month Avg 157 172 +9.6%
This index measures housing affordability for the region. An index of 120 means the median household income was 120% of what is necessary to qualify for the median-priced home under prevailing interest rates. A higher number means greater affordability.
All data comes from the ABOR Multiple Listing Service. Provided by the Austin Board of REALTORS®. Powered by 10K Research and Marketing. | Click for Cover Page | 10
151 160
180
2009 2010 2011
December
120
130
140
150
160
170
180
190
1-2004 1-2005 1-2006 1-2007 1-2008 1-2009 1-2010 1-2011
Historical Housing Affordability Index
152 161
178
2009 2010 2011
Year To Date
+10.6% +6.2% +12.3% +6.2%
Team Price Real Estate http://www.teamprice.com 512-524-6608
7320 N Mo-Pac Ste 305 Austin TX 78731

Inventory of Homes for Sale The number of properties available for sale in active status at the end of a given month.
MonthPrior Year
Current Year
+ / –
January 10,509 10,088 -4.0%
February 11,170 10,274 -8.0%
March 12,198 11,169 -8.4%
April 13,096 11,844 -9.6%
May 13,776 12,058 -12.5%
June 14,341 12,134 -15.4%
July 14,638 11,876 -18.9%
August 13,959 11,217 -19.6%
September 13,240 10,487 -20.8%
October 12,407 9,953 -19.8%
November 11,338 9,144 -19.4%
December 10,005 7,758 -22.5%
12-Month Avg 12,556 10,667 -14.9%
All data comes from the ABOR Multiple Listing Service. Provided by the Austin Board of REALTORS®. Powered by 10K Research and Marketing. | Click for Cover Page | 11
9,870 10,005
7,758
2009 2010 2011
December
8,000
9,000
10,000
11,000
12,000
13,000
14,000
15,000
1-2004 1-2005 1-2006 1-2007 1-2008 1-2009 1-2010 1-2011
Historical Inventory of Homes for Sale
-22.5% +6.2%
Team Price Real Estate http://www.teamprice.com 512-524-6608
7320 N Mo-Pac Ste 305 Austin TX 78731

Months Supply of Inventory The inventory of homes for sale at the end of a given month, divided by the average monthly pending sales from the last 12 months.
MonthPrior Year
Current Year
+ / –
January 5.9 6.0 +1.6%
February 6.2 6.2 +0.3%
March 6.6 6.9 +4.5%
April 6.8 7.6 +11.9%
May 7.4 7.4 +0.5%
June 7.8 7.3 -7.5%
July 8.2 6.9 -15.1%
August 8.0 6.4 -19.3%
September 7.8 5.9 -23.6%
October 7.4 5.6 -25.0%
November 6.8 5.1 -25.3%
December 6.0 4.2 -28.8%
12-Month Avg 7.1 6.3 -10.9%
All data comes from the ABOR Multiple Listing Service. Provided by the Austin Board of REALTORS®. Powered by 10K Research and Marketing. | Click for Cover Page | 12
5.6 6.0
4.2
2009 2010 2011
December
3
4
5
6
7
8
9
1-2004 1-2005 1-2006 1-2007 1-2008 1-2009 1-2010 1-2011
Historical Months Supply of Inventory
-22.5% +6.2%
Team Price Real Estate http://www.teamprice.com 512-524-6608
7320 N Mo-Pac Ste 305 Austin TX 78731

A RESEARCH TOOL PROVIDED BY THE AUSTIN BOARD OF REALTORS®
December 2011 Quick Facts
$125,000 and Below 1,501 to 2,000 sq. ft.
Pending Sales 2Days on Market Until Sale 3Median Sales Price 4
5Inventory of Homes for Sale 6Months Supply of Inventory 7
Current as of January 10, 2012. All data from ABOR Multiple Listing Service. Powered by 10K Research and Marketing.
Housing Supply Overview
+ 21.3% + 9.3%+ 11.3%
Click on desired metric to jump to that page.
Price Range With Strongest Sales:
Home Size With Strongest Sales:
Property Type With Strongest Sales:
Single-Family
Percent of Original List Price Received
Team Price Real Estate http://www.teamprice.com 512-524-6608
7320 N Mo-Pac Ste 305 Austin TX 78731

Pending Sales A count of properties on which offers have been accepted. Based on a rolling 12-month total.
By Price Range 12-2010 12-2011 Change 12-2010 12-2011 Change 12-2010 12-2011 Change
$125,000 and Below 3,632 4,404 + 21.3% 3,021 3,838 + 27.0% 607 560 - 7.7%
$125,001 to $175,000 5,042 5,141 + 2.0% 4,536 4,640 + 2.3% 504 497 - 1.4%
$175,001 to $250,000 4,661 4,924 + 5.6% 4,260 4,482 + 5.2% 398 441 + 10.8%
$250,001 to $400,000 4,205 4,547 + 8.1% 3,899 4,150 + 6.4% 303 395 + 30.4%
$400,001 to $750,000 2,009 2,241 + 11.5% 1,889 2,105 + 11.4% 119 135 + 13.4%
$750,001 and Above 572 659 + 15.2% 552 631 + 14.3% 20 27 + 35.0%
All Price Ranges 20,121 21,916 + 8.9% 18,157 19,846 + 9.3% 1,951 2,055 + 5.3%
By Square Feet 12-2010 12-2011 Change 12-2010 12-2011 Change 12-2010 12-2011 Change
1,500 sq. ft. and Below 5,599 5,939 + 6.1% 4,157 4,464 + 7.4% 1,433 1,470 + 2.6%
1,501 to 2,000 sq. ft. 5,240 5,831 + 11.3% 4,884 5,437 + 11.3% 356 391 + 9.8%
2,001 to 3,000 sq. ft. 6,119 6,638 + 8.5% 5,971 6,455 + 8.1% 146 177 + 21.2%
3,001 sq. ft. and Above 3,163 3,508 + 10.9% 3,145 3,490 + 11.0% 16 17 + 6.3%
All Square Footage 20,121 21,916 + 8.9% 18,157 19,846 + 9.3% 1,951 2,055 + 5.3%
All data comes from the ABOR Multiple Listing Service. Provided by the Austin Board of REALTORS®. Powered by 10K Research and Marketing. | Click for Cover Page | 2
All Properties Single-Family Homes Condos
3,632
5,042 4,661
4,205
2,009
572
4,404
5,141 4,924
4,547
2,241
659
$125,000 and Below $125,001 to $175,000 $175,001 to $250,000 $250,001 to $400,000 $400,001 to $750,000 $750,001 and Above
By Price Range 12-2010 12-2011
5,599 5,240
6,119
3,163
5,939 5,831
6,638
3,508
1,500 sq. ft. and Below
1,501 to 2,000 sq. ft.
2,001 to 3,000 sq. ft.
3,001 sq. ft. and Above
By Square Feet 12-2010 12-2011
+ 21.3% + 2.0% + 5.6% + 11.5% + 15.2% + 6.1% + 8.5% + 10.9% + 8.1% + 11.3%
Team Price Real Estate http://www.teamprice.com 512-524-6608
7320 N Mo-Pac Ste 305 Austin TX 78731

Days on Market Until Sale Average number of days between when a property is listed and when an offer is accepted. Based on a rolling 12-month average.
By Price Range 12-2010 12-2011 Change 12-2010 12-2011 Change 12-2010 12-2011 Change
$125,000 and Below 64 74 + 16.3% 64 73 + 13.7% 62 82 + 32.3%
$125,001 to $175,000 65 78 + 19.4% 65 78 + 20.0% 71 81 + 14.0%
$175,001 to $250,000 73 80 + 9.4% 72 79 + 10.7% 89 87 - 1.8%
$250,001 to $400,000 80 81 + 0.9% 78 79 + 1.8% 108 97 - 9.8%
$400,001 to $750,000 86 84 - 1.5% 84 83 - 1.4% 105 98 - 7.1%
$750,001 and Above 124 119 - 4.2% 125 119 - 4.5% 99 107 + 8.3%
All Price Ranges 74 80 + 9.0% 73 79 + 9.0% 80 87 + 9.3%
By Square Feet 12-2010 12-2011 Change 12-2010 12-2011 Change 12-2010 12-2011 Change
1,500 sq. ft. and Below 64 74 + 16.4% 61 71 + 16.8% 71 82 + 15.6%
1,501 to 2,000 sq. ft. 69 78 + 13.4% 66 77 + 15.9% 106 97 - 8.4%
2,001 to 3,000 sq. ft. 77 80 + 4.5% 76 79 + 4.4% 105 106 + 0.6%
3,001 sq. ft. and Above 93 94 + 1.0% 93 94 + 0.7% 85 154 + 81.6%
All Square Footage 74 80 + 9.0% 73 79 + 9.0% 80 87 + 9.3%
All data comes from the ABOR Multiple Listing Service. Provided by the Austin Board of REALTORS®. Powered by 10K Research and Marketing. | Click for Cover Page | 3
All Properties Single-Family Homes Condos
64 65 73
80 86
124
74 78 80 81 84
119
$125,000 and Below $125,001 to $175,000 $175,001 to $250,000 $250,001 to $400,000 $400,001 to $750,000 $750,001 and Above
By Price Range 12-2010 12-2011
64 69
77
93
74 78 80
94
1,500 sq. ft. and Below
1,501 to 2,000 sq. ft.
2,001 to 3,000 sq. ft.
3,001 sq. ft. and Above
By Square Feet 12-2010 12-2011
+ 16.3% + 19.4% + 9.4% - 1.5% - 4.2% + 16.4% + 4.5% + 1.0% + 0.9% + 13.4%
Team Price Real Estate http://www.teamprice.com 512-524-6608
7320 N Mo-Pac Ste 305 Austin TX 78731

Median Sales Price
By Square Feet 12-2010 12-2011 Change 12-2010 12-2011 Change 12-2010 12-2011 Change
1,500 sq. ft. and Below $130,000 $128,000 - 1.5% $129,500 $124,500 - 3.9% $137,050 $146,000 + 6.5%
1,501 to 2,000 sq. ft. $163,000 $160,000 - 1.8% $160,000 $157,500 - 1.6% $226,000 $226,000 0.0%
2,001 to 3,000 sq. ft. $231,000 $228,500 - 1.1% $230,000 $226,500 - 1.5% $335,000 $305,900 - 8.7%
3,001 sq. ft. and Above $400,000 $400,000 0.0% $400,000 $400,000 0.0% $816,740 $572,500 - 29.9%
All Square Footage $188,000 $189,000 + 0.5% $191,810 $191,500 - 0.2% $159,000 $166,222 + 4.5%
All data comes from the ABOR Multiple Listing Service. Provided by the Austin Board of REALTORS®. Powered by 10K Research and Marketing. | Click for Cover Page | 4
Median price point for all closed sales, not accounting for seller concessions. Based on a rolling 12-month median.
All Properties Single-Family Homes Condos
$130,000 $163,000
$231,000
$400,000
$128,000 $160,000
$228,500
$400,000
1,500 sq. ft. and Below 1,501 to 2,000 sq. ft. 2,001 to 3,000 sq. ft. 3,001 sq. ft. and Above
By Square Feet 12-2010 12-2011
$188,000 $191,810
$159,000
$189,000 $191,500
$166,222
All Properties Single-Family Homes Condos
By Property Type 12-2010 12-2011
- 0.2% + 4.5% - 1.5% - 1.8% + 0.5% - 1.1% 0.0%
Team Price Real Estate http://www.teamprice.com 512-524-6608
7320 N Mo-Pac Ste 305 Austin TX 78731

Percent of Original List Price Received
By Price Range 12-2010 12-2011 Change 12-2010 12-2011 Change 12-2010 12-2011 Change
$125,000 and Below 91.3% 90.4% - 1.0% 90.8% 90.1% - 0.8% 93.9% 92.5% - 1.5%
$125,001 to $175,000 94.5% 94.0% - 0.5% 94.6% 94.0% - 0.6% 94.5% 94.5% + 0.0%
$175,001 to $250,000 94.0% 93.8% - 0.2% 94.1% 93.8% - 0.3% 93.2% 93.6% + 0.4%
$250,001 to $400,000 93.4% 93.9% + 0.5% 93.4% 93.9% + 0.5% 93.0% 93.9% + 0.9%
$400,001 to $750,000 92.5% 93.2% + 0.8% 92.4% 93.1% + 0.8% 94.4% 94.3% - 0.1%
$750,001 and Above 88.8% 89.9% + 1.2% 88.7% 89.8% + 1.2% 92.6% 92.7% + 0.1%
All Price Ranges 93.2% 93.0% - 0.2% 93.2% 93.0% - 0.2% 93.8% 93.6% - 0.2%
By Square Feet 12-2010 12-2011 Change 12-2010 12-2011 Change 12-2010 12-2011 Change
1,500 sq. ft. and Below 93.2% 92.5% - 0.8% 92.9% 92.1% - 0.9% 94.0% 93.7% - 0.3%
1,501 to 2,000 sq. ft. 93.7% 93.3% - 0.5% 93.8% 93.3% - 0.6% 92.7% 93.5% + 0.9%
2,001 to 3,000 sq. ft. 93.5% 93.5% + 0.0% 93.5% 93.5% + 0.1% 94.1% 92.7% - 1.5%
3,001 sq. ft. and Above 91.9% 92.6% + 0.7% 91.9% 92.6% + 0.7% 91.7% 93.1% + 1.5%
All Square Footage 93.2% 93.0% - 0.2% 93.2% 93.0% - 0.2% 93.8% 93.6% - 0.2%
Percentage found when dividing a property’s sales price by its original list price, then taking the average for all properties sold, not accounting for seller concessions. Based on a rolling 12-month average.
All data comes from the ABOR Multiple Listing Service. Provided by the Austin Board of REALTORS®. Powered by 10K Research and Marketing. | Click for Cover Page | 5
All Properties Single-Family Homes Condos
91.3%
94.5% 94.0%
93.4%
92.5%
88.8%
90.4%
94.0% 93.8% 93.9% 93.2%
89.9%
$125,000 and Below $125,001 to $175,000 $175,001 to $250,000 $250,001 to $400,000 $400,001 to $750,000 $750,001 and Above
By Price Range 12-2010 12-2011
93.2%
93.7% 93.5%
91.9%
92.5%
93.3% 93.5%
92.6%
1,500 sq. ft. and Below
1,501 to 2,000 sq. ft.
2,001 to 3,000 sq. ft.
3,001 sq. ft. and Above
By Square Feet 12-2010 12-2011
- 1.0% - 0.5% - 0.2% + 0.8% + 1.2% - 0.8% + 0.0% + 0.7% + 0.5% - 0.5%
Team Price Real Estate http://www.teamprice.com 512-524-6608
7320 N Mo-Pac Ste 305 Austin TX 78731

Inventory of Homes for Sale The number of properties available for sale in active status at the end of the most recent month. Based on one month of activity.
By Price Range 12-2010 12-2011 Change 12-2010 12-2011 Change 12-2010 12-2011 Change
$125,000 and Below 1,948 1,368 - 29.8% 1,622 1,115 - 31.3% 320 245 - 23.4%
$125,001 to $175,000 2,216 1,524 - 31.2% 1,981 1,349 - 31.9% 230 174 - 24.3%
$175,001 to $250,000 2,087 1,585 - 24.1% 1,832 1,417 - 22.7% 249 160 - 35.7%
$250,001 to $400,000 1,937 1,615 - 16.6% 1,690 1,435 - 15.1% 243 175 - 28.0%
$400,001 to $750,000 1,107 1,071 - 3.3% 999 995 - 0.4% 102 74 - 27.5%
$750,001 and Above 710 595 - 16.2% 675 559 - 17.2% 33 33 0.0%
All Price Ranges 10,005 7,758 - 22.5% 8,799 6,870 - 21.9% 1,177 861 - 26.8%
By Square Feet 12-2010 12-2011 Change 12-2010 12-2011 Change 12-2010 12-2011 Change
1,500 sq. ft. and Below 2,713 1,929 - 28.9% 1,928 1,363 - 29.3% 775 554 - 28.5%
1,501 to 2,000 sq. ft. 2,442 1,749 - 28.4% 2,178 1,556 - 28.6% 261 187 - 28.4%
2,001 to 3,000 sq. ft. 2,847 2,358 - 17.2% 2,720 2,255 - 17.1% 115 99 - 13.9%
3,001 sq. ft. and Above 2,003 1,721 - 14.1% 1,973 1,696 - 14.0% 26 20 - 23.1%
All Square Footage 10,005 7,758 - 22.5% 8,799 6,870 - 21.9% 1,177 861 - 26.8%
All data comes from the ABOR Multiple Listing Service. Provided by the Austin Board of REALTORS®. Powered by 10K Research and Marketing. | Click for Cover Page | 6
All Properties Single-Family Homes Condos
1,948
2,216 2,087
1,937
1,107
710
1,368 1,524 1,585 1,615
1,071
595
$125,000 and Below $125,001 to $175,000 $175,001 to $250,000 $250,001 to $400,000 $400,001 to $750,000 $750,001 and Above
By Price Range 12-2010 12-2011
2,713
2,442
2,847
2,003 1,929 1,749
2,358
1,721
1,500 sq. ft. and Below
1,501 to 2,000 sq. ft.
2,001 to 3,000 sq. ft.
3,001 sq. ft. and Above
By Square Feet 12-2010 12-2011
- 29.8% - 31.2% - 24.1% - 3.3% - 16.2% - 28.9% - 17.2% - 14.1% - 16.6% - 28.4%
Team Price Real Estate http://www.teamprice.com 512-524-6608
7320 N Mo-Pac Ste 305 Austin TX 78731

Months Supply of Inventory
By Price Range 12-2010 12-2011 Change 12-2010 12-2011 Change 12-2010 12-2011 Change
$125,000 and Below 6.4 3.7 - 42.1% 6.4 3.5 - 45.9% 6.3 5.3 - 17.0%
$125,001 to $175,000 5.3 3.6 - 32.6% 5.2 3.5 - 33.4% 5.5 4.2 - 23.3%
$175,001 to $250,000 5.4 3.9 - 28.1% 5.2 3.8 - 26.5% 7.5 4.4 - 42.0%
$250,001 to $400,000 5.5 4.3 - 22.9% 5.2 4.1 - 20.2% 9.6 5.3 - 44.8%
$400,001 to $750,000 6.6 5.7 - 13.3% 6.3 5.7 - 10.6% 10.3 6.6 - 36.0%
$750,001 and Above 14.9 10.8 - 27.3% 14.7 10.6 - 27.6% 14.9 12.2 - 17.7%
All Price Ranges 6.0 4.2 - 28.8% 5.8 4.2 - 28.6% 7.2 5.0 - 30.6%
By Square Feet 12-2010 12-2011 Change 12-2010 12-2011 Change 12-2010 12-2011 Change
1,500 sq. ft. and Below 5.8 3.9 - 33.0% 5.6 3.7 - 34.2% 6.5 4.5 - 30.3%
1,501 to 2,000 sq. ft. 5.6 3.6 - 35.6% 5.4 3.4 - 35.8% 8.8 5.7 - 34.8%
2,001 to 3,000 sq. ft. 5.6 4.3 - 23.7% 5.5 4.2 - 23.3% 9.5 6.7 - 29.0%
3,001 sq. ft. and Above 7.6 5.9 - 22.5% 7.5 5.8 - 22.5% 13.0 10.6 - 18.6%
All Square Footage 6.0 4.2 - 28.8% 5.8 4.2 - 28.6% 7.2 5.0 - 30.6%
The inventory of homes for sale at the end of the most recent month, based on one month of activity, divided by the average monthly pending sales from the last 12 months.
All data comes from the ABOR Multiple Listing Service. Provided by the Austin Board of REALTORS®. Powered by 10K Research and Marketing. | Click for Cover Page | 7
All Properties Single-Family Homes Condos
6.4 5.3 5.4 5.5
6.6
14.9
3.7 3.6 3.9 4.3
5.7
10.8
$125,000 and Below $125,001 to $175,000 $175,001 to $250,000 $250,001 to $400,000 $400,001 to $750,000 $750,001 and Above
By Price Range 12-2010 12-2011
5.8 5.6 5.6
7.6
3.9 3.6
4.3
5.9
1,500 sq. ft. and Below
1,501 to 2,000 sq. ft.
2,001 to 3,000 sq. ft.
3,001 sq. ft. and Above
By Square Feet 12-2010 12-2011
- 42.1% - 32.6% - 28.1% - 13.3% - 27.3% - 33.0% - 23.7% - 22.5% - 22.9% - 35.6%
Team Price Real Estate http://www.teamprice.com 512-524-6608
7320 N Mo-Pac Ste 305 Austin TX 78731