Residential Ducts Duct Sealing, Cooling Coil Airflow, Fan ... · PDF...
58
CODES AND STANDARDS ENHANCEMENT INITIATIVE (CASE) Residential Ducts – Duct Sealing, Cooling Coil Airflow, Fan Watt Draw, and Measured Static Pressure 2013 California Building Energy Efficiency Standards California Utilities Statewide Codes and Standards Team October 2011 This report was prepared by the California Statewide Utility Codes and Standards Program and funded by the California utility customers under the auspices of the California Public Utilities Commission. Copyright 2011 Pacific Gas and Electric Company, Southern California Edison, SoCalGas, SDG&E. All rights reserved, except that this document may be used, copied, and distributed without modification. Neither PG&E, SCE, SoCalGas, SDG&E, nor any of its employees makes any warranty, express of implied; or assumes any legal liability or responsibility for the accuracy, completeness or usefulness of any data, information, method, product, policy or process disclosed in this document; or represents that its use will not infringe any privately-owned rights including, but not limited to, patents, trademarks or copyrights
Transcript of Residential Ducts Duct Sealing, Cooling Coil Airflow, Fan ... · PDF...

CODES AND STANDARDS ENHANCEMENT INITIATIVE (CASE)
Residential Ducts –
Duct Sealing, Cooling Coil Airflow, Fan Watt
Draw, and Measured Static Pressure
2013 California Building Energy Efficiency Standards
California Utilities Statewide Codes and Standards Team October 2011
This report was prepared by the California Statewide Utility Codes and Standards Program and funded by the California utility customers under the auspices of the California Public Utilities Commission.
Copyright 2011 Pacific Gas and Electric Company, Southern California Edison, SoCalGas, SDG&E.
All rights reserved, except that this document may be used, copied, and distributed without modification.
Neither PG&E, SCE, SoCalGas, SDG&E, nor any of its employees makes any warranty, express of implied; or assumes any legal liability or
responsibility for the accuracy, completeness or usefulness of any data, information, method, product, policy or process disclosed in this document;
or represents that its use will not infringe any privately-owned rights including, but not limited to, patents, trademarks or copyrights

Page 2
2013 California Building Energy Efficiency Standards October 2011
Table of Contents
1. Purpose ........................................................................................................................ 5
2. Overview ....................................................................................................................... 6
2.1 Part I Cooling Coil Airflow and Fan Watt Draw ........................................................................6
2.2 Part II Residential Duct Sealing ...............................................................................................13
3. Methodology............................................................................................................... 22
3.1 Part I Cooling Coil Airflow and Fan Watt Draw ......................................................................22
3.1.1 Data Collection ..................................................................................................................22
3.1.2 Energy and Cost Savings ...................................................................................................25
3.1.3 Cost Data Collection ..........................................................................................................25
3.1.4 Lifecycle Cost Calculation .................................................................................................25
3.1.5 Statewide Savings Estiamtes..............................................................................................26
3.2 Part II – Duct Sealing ...............................................................................................................26
3.2.1 Data Collection ..................................................................................................................26
3.2.2 Energy and Cost Savings ...................................................................................................28
3.2.3 Cost Data Collection ..........................................................................................................29
3.2.4 Lifecycle Cost Calculation .................................................................................................29
3.2.5 Statewide Savings Estimates ..............................................................................................29
4. Analysis and Results ................................................................................................. 30
4.1 Part I - Cooling Coil Airflow and Fan Watt Draw ...................................................................30
4.1.1 Field Survey Data Summary ..............................................................................................30
4.1.2 Development of Proposed Measures .................................................................................30
4.1.3 Energy and Cost Savings ...................................................................................................33
4.1.4 Cost-effectiveness ..............................................................................................................36
4.1.5 Modeling Rules and Algorithms ........................................................................................38
4.1.6 Statewide Savings Estimates ..............................................................................................38
4.2 Part II - Duct Sealing ................................................................................................................39
4.2.1 Field Survey Data Summary ..............................................................................................39
4.2.2 Energy and Cost Savings ...................................................................................................41
4.2.3 Statewide Savings Estimates ..............................................................................................43
4.2.4 Cost-effectiveness ..............................................................................................................44
4.2.5 Modeling Rules or Algorithms ..........................................................................................44

Page 3
2013 California Building Energy Efficiency Standards October 2011
5. Recommended Language for the Standards Document, ACM Manuals, and the Reference Appendices ....................................................................................................... 45
5.1 Standards Document .................................................................................................................45
5.2 Part I – Cooling Coil Airflow and Fan Watt Draw ...................................................................45
5.3 Part II – Duct Sealing ...............................................................................................................47
5.4 ACM Manuals ..........................................................................................................................49
6. Bibliography and Other Research ............................................................................ 55
7. Appendices ................................................................................................................ 56
7.1 Residential Construction Forecast Details ................................................................................56
7.1.1 Citation ...............................................................................................................................57
7.1.2 Environmental Impact Assumptions ..................................................................................58
Table of Figures
Figure 1. Cooling airflow average external static pressure ................................................................... 23
Figure 2. Cooling coil airflow before and after improvements ............................................................ 23
Figure 3. Normalized Sensible EER Improvement............................................................................... 24
Figure 4. Duct Leakage by Building Type (ECO Final Report) ........................................................... 27
Figure 5. Duct Leakage Rate for Apartment and Town Houses (ECO Final Report) .......................... 28
Figure 6. Building prototype characteristics ......................................................................................... 33
Figure 7. Sizing for flex duct return and grill according to ACCA guidelines ..................................... 34
Figure 8. Return system meaurements for R-6 flex duct, according to ACCA guidelines ................... 34
Figure 9. Return system meaurements for R-8 flex duct, according to ACCA guidelines ................... 35
Figure 10. Return system meaurements for R-6 and R-8 flex ducts, according to the proposed return
sizing table...................................................................................................................................... 36
Figure 11. Calculated incremental costs by climate zone and design guidelines ................................. 37
Figure 12. Calculated energy savings and dollar/KTDV by climate zone ........................................... 37
Figure 13. Calculated airflow and fann watt draw statewide energy savings by climate zone, and total
........................................................................................................................................................ 39
Figure 14. Duct Leakage by Building Type.......................................................................................... 40
Figure 15. Duct Leakage Rate for Apartment and Town Houses (ECO Final Report) ........................ 41
Figure 16. Calculated energy savings comparison between Package D and witout Package D duct
sealing, by climate zone ................................................................................................................. 42

Page 4
2013 California Building Energy Efficiency Standards October 2011
Figure 17. Calculated duct sealing statewide savings estimates by climate zone, and total................. 44
Figure 18. Residential construction forecast for 2014, in total dwelling units ..................................... 57

Page 5
2013 California Building Energy Efficiency Standards October 2011
1. Purpose The purpose of this CASE study was to evaluate four related approaches to improving HVAC system
performance in residential homes:
1. Duct testing,
2. System static pressure,
3. Cooling coil airflow, and
4. Fan watt draw.
CASE study Res 12 used the field research from a Public Interest Energy Research Program project,
Efficiency Characteristics and Opportunities of New California Homes, to evaluate how these four
approaches could be used to improve residential HVAC performance. This evaluation was used to
determine how these approaches could be used with the Building Energy Efficiency Standards and
make proposed recommendations for 2013 Building Energy Efficiency Standards.

Page 6
2013 California Building Energy Efficiency Standards October 2011
2. Overview
2.1 Part I Cooling Coil Airflow and Fan Watt Draw
a. Measure
Title
Residential Ducts: Measured Cooling Coil Airflow and Fan Watt Draw
b.
Description
Newly constructed residential buildings with ducted heating and cooling systems in
all climate zones would have mandatory minimum cooling coil airflow and fan
watt draw requirements with two options available for compliance. Option 1: the
return duct(s) and return grill(s) must be sized according to the Return System Sizing
Table. Option 2: the cooling coil air flow and fan watt draw must meet minimum
measured values with HERS verification.
HVAC Alterations in residential buildings that include new or replacement duct
systems would have the same mandatory minimum cooling coil airflow and fan watt
draw requirements. The same two compliance options for newly constructed home
would be available for HVAC Alterations.
For both newly constructed homes and HVAC alterations, heating only systems
would be exempt from these mandatory measures.
c. Type of
Change
Mandatory Measure - The proposed change would add two mandatory measures:
Measured Cooling Coil Airflow and Fan Watt Draw
Compliance Option - The change would remove these two measures from the list of
existing compliance options for meeting the Standards using the performance
approach.
Modeling - The change would modify the calculation procedures or assumptions used
in making performance calculations.
The proposed change modifies but does not expand the scope of the Standards. Both
measures are part of the 2008 Residential Energy Standards. The proposed changes
move the two measures from the Prescriptive (Component Package D) to Mandatory
Measures.
The following Standards documents would need to be modified: Building Energy
Efficiency Standards, ACM, and Residential Compliance Manual.
In each of the documents, the description of these two measures would need to be
referenced in the Mandatory Measure sections instead of the Prescriptive section. The
measures would remain as HERS verification items, so modifications to the Reference
Appendices are not required.

Page 7
2013 California Building Energy Efficiency Standards October 2011
d. Energy
Benefits
The Energy Benefits are based on improving the HVAC system performance in the
base case house by increasing airflow from 300 to 350 cfm/ton and reducing fan watt
draw from .80 to .58 watt/cfm. Increasing airflow delivers more heating and cooling
energy to the home compared to the base case home. Reducing fan watt draw reduces
electricity usage during fan operation. The per unit (HVAC system) and per
prototype building saving are the same.
Climate Zone
Airflow 350 cfm/ton & Fan Watt Draw .58
watts/cfm
Electricity Savings Demand
Savings (kw)
Natural Gas Savings TDV
Electricity Savings
TDV Gas Savings
(kwh/yr) (Therms/yr)
1 Per HVAC System & Per Prototype
Building
148 0.00 -9 0.00 0.42
2 163 0.07 -7 1.02 0.51
3 95 -0.04 -4 0.58 0.25
4 163 -0.03 -4 1.70 0.46
5 105 0.00 -4 0.00 0.47
6 95 -0.04 -2 1.55 0.15
7 53 0.10 0 1.28 0.05
8 158 0.24 -2 2.87 0.12
9 243 0.36 -2 4.63 0.15
10 291 0.42 -3 5.27 0.13
11 506 0.52 -7 8.20 0.34
12 282 0.32 -7 4.53 0.37
13 527 0.55 -6 8.15 0.33
14 454 0.47 -8 6.74 0.11
15 994 0.81 -1 13.98 -2.99
16 322 0.25 -14 3.18 0.45
Averages 287.4 0.25 -5.0 3.98 0.08

Page 8
2013 California Building Energy Efficiency Standards October 2011
The savings from these measures results in the following statewide first year savings:
Airflow (350 cfm/ton) & Fan Watt Draw (.58 w/cfm)
Climate
Zone
Total Electric
Energy Savings
(GWh)
Total Gas Energy
Savings
(MMtherms )
Total TDV
Savings (Kbtu/yr)
1 0.06 -0.0034 159
2 0.19 -0.0082 1,798
3 0.12 -0.0049 1,016
4 0.44 -0.0108 5,806
5 0.05 -0.0021 245
6 0.11 -0.0024 2,020
7 0.11 0.0000 2,870
8 0.31 -0.0039 5,878
9 0.55 -0.0045 10,846
10 2.57 -0.0265 47,779
11 1.63 -0.0226 27,567
12 2.76 -0.0684 47,907
13 3.65 -0.0415 58,656
14 0.74 -0.0131 11,227
15 1.91 -0.0019 21,156
16 0.48 -0.0210 5,445
Total 15.70 -0.24 250,375

Page 9
2013 California Building Energy Efficiency Standards October 2011
e. Non-
Energy
Benefits
The study that is the basis of the recommendations in this CASE study, Efficiency
Characteristics and Opportunities of New California Homes, showed low airflow
and high fan watt draw to be common problems in newly constructed homes. Both of
these conditions lead to increased run times for HVAC equipment and longer times to
cool homes after the A/C equipment is turned on.
Improving airflow will decrease system run times which should result in reduced
maintenance cost and longer life of equipment.

Page 10
2013 California Building Energy Efficiency Standards October 2011
f. Environmental Impact
Material Increase (I), Decrease (D), or No Change (NC): (All units are lbs/year)
Mercury Lead Copper Steel Plastic Others
Fiberglass
Insulation
Per Unit
Measure1 (Flex
Duct Return,
Filter Grill &
Filter)
NC NC NC 6 .25 9
Per Prototype
Building2
NC NC NC 6 .25 9
1. Type of unit: per HVAC system (flex duct, filter grill, fiberglass filter)
2. For description of prototype buildings refer to Methodology section below.
Water Consumption:
On-Site (Not at the Powerplant)
Water Savings (or Increase)
(Gallons/Year)
Per Unit Measure1 0
Per Prototype
Building2
0
1. Type of unit: per HVAC system (flex duct, filter grill, fiberglass filter)
2. For description of prototype buildings refer to Methodology section below.
Water Quality Impacts:
Potential increase (I), decrease (D), or no change (NC) in contamination compared to the basecase
assumption, including but not limited to: mineralization (calcium, boron, and salts), algae or bacterial
buildup, and corrosives as a result of PH change.
Mineralization
(calcium, boron, and
salts
Algae or Bacterial
Buildup
Corrosives as a
Result of PH
Change
Others
Impact (I, D, or NC) NC NC NC NC
Comment on reasons for
your impact assessment
Measures require larger duct sizes for return ducts, filter grills and filters: but no impact on water
quality.

Page 11
2013 California Building Energy Efficiency Standards October 2011
g.
Technology
Measures
The proposed measures do not require or encourage a particular technology. The
proposed changes required improved HVAC system design and installation. The
improvements in the HVAC system design use existing technology, existing
materials, and existing installation skills.
When using the measured airflow and fan watt draw approach, the designer/builder
can make improvements in both the supply and return sides of the distribution system
to ensure 350 cfm/ton airflow and .58 watt/cfm fan watt draw. If the designer/builder
opts to use the return system sizing tables, larger return ducts and filter grills will be
used. Using either method there is no change in the type of materials, installation
skills or system technology.
If the installing contractor opts to use the airflow and fan watt draw measurement
method, the installing contractor will need equipment to measure both the airflow and
wattage. This equipment is readily available and contractors already commonly use
flow hoods to measure airflow. The equipment to measure fan watt draw is easy to
use and readily available for under $100 (Watts Up brand watt meter).
Useful Life, Persistence, and Maintenance:
The life, frequency of replacement, and maintenance procedures related to the
proposed changes are the same as current practice. Since only the size of the ducts
and return grills are being affected, this will not affect the life, replacement or
maintenance procedures.
h.
Performance
Verification
of the
Proposed
Measure
The proposed changes have two compliance options, one option requires HERS
verification and the other option requires building department inspection.
The HERS verification (airflow measure and fan watt draw) are current HERS
verifications measures: new specifications for the HERS verification are not required.
Field verifications can be performed using the guidelines currently provided in the
Reference Appendices. Field verification is essential to ensure that the HVAC system
is operating within the design specifications.
Building department field inspection will be required when the installing contractor
opts to use the Return Duct and Grill Sizing Table. Building department field
inspectors will need to be trained on the inspection criteria for the Return Duct and
Grill Sizing Table. This training could be part of the typical training that is provided
to building department during each code cycle change. The proposed changes will
require that return duct size and filter grill size be indicated on documentation
provided to building inspectors prior to their field inspection.

Page 12
2013 California Building Energy Efficiency Standards October 2011
i. Cost Effectiveness
Proposed Measures Move the following two measures from the Prescriptive Requirements to
Mandatory Measures: Airflow 350 cfm/ton & Fan Watt Draw .58 watts/cfm
a b c d e f g
Measure
Name
Meas
ure
Life
(Year
s)
Additional
Costs1– Current
Measure Costs
(Relative to
Base case)
Additional Cost2–
Post-Adoption
Measure Costs
(Relative to Base
case)
PV of
Additional3
Maintenanc
e Costs
(Savings)
(Relative to
Base case)
PV of4
Energy
Cost
Savings
– Per
Proto
Building
(PV$)
LCC Per Prototype
Building
Airflow
350
cfm/ton
& Fan
Watt
Draw
.58
w/cfm
($) ($) (PV$) ($)
Per
Unit
Per
Proto
Buildi
ng
Per Unit
Per
Proto
Building
Per
Unit
Per
Prot
o
Bld
g
(c+e)-f (d+e)-f
Based on
Current
Costs
Based on
Post-
Adoptio
n Costs
CLZ 1 30 $192 $192 $192 $192 $0 $0 $196 -$4 -$4
CLZ 2 30 $197 $197 $197 $197 $0 $0 $715 -$518 -$518
CLZ 3 30 $192 $192 $192 $192 $0 $0 $388 -$196 -$196
CLZ 4 30 $197 $197 $197 $197 $0 $0 $1,009 -$812 -$812
CLZ 5 30 $197 $197 $197 $197 $0 $0 $220 -$23 -$23
CLZ 6 30 $192 $192 $192 $192 $0 $0 $794 -$602 -$602
CLZ 7 30 $192 $192 $192 $192 $0 $0 $621 -$429 -$429
CLZ 8 30 $197 $197 $197 $197 $0 $0 $1,397 -$1,200 -$1,200
CLZ 9 30 $197 $197 $197 $197 $0 $0 $2,233 -$2,036 -$2,036
CLZ 10 30 $197 $197 $197 $197 $0 $0 $2,522 -$2,325 -$2,325
CLZ 11 30 $308 $308 $308 $308 $0 $0 $3,989 -$3,681 -$3,681
CLZ 12 30 $197 $197 $197 $197 $0 $0 $2,289 -$2,092 -$2,092
CLZ 13 30 $308 $308 $308 $308 $0 $0 $3,961 -$3,653 -$3,653
CLZ 14 30 $340 $340 $340 $340 $0 $0 $3,200 -$2,860 -$2,860
CLZ 15 30 $340 $340 $340 $340 $0 $0 $6,535 -$6,195 -$6,195
CLZ 16 30 $204 $204 $204 $204 $0 $0 $1,696 -$1,492 -$1,492
1. Additional costs are detailed in the Analysis and Results.
2. Post Adoption Measure Costs – The post adoption measure cost is the same as the additional cost since no
new materials, techniques or technologies are used for the proposed changes.
3. Maintenance Costs – There are no maintenance cost for the proposed changes.
4. Energy Cost Savings - the PV of the energy savings are calculated using the method described in the 2013
LCC Methodology report.

Page 13
2013 California Building Energy Efficiency Standards October 2011
j. Analysis
Tools
The proposed measures are Mandatory Measures so analysis tools are not required:
measure would not be subject to whole building performance trade-offs.
k.
Relationship
to Other
Measures
No other measures are impacted by these proposed changes.
2.2 Part II Residential Duct Sealing
a. Measure
Title
Residential Ducts: Sealed and Tested Ducts
b.
Description
The proposed change would move sealed and tested ducts from a prescriptive measure
(Prescriptive Standards / Component Packages) both for newly constructed residential
buildings and alterations in residential buildings to a mandatory measure.
The currently leakage rates, application rules and exceptions would continue as
specified in the 2008 Building Energy Efficiency Standards and Reference
Appendices.

Page 14
2013 California Building Energy Efficiency Standards October 2011
c. Type of
Change
Describe how the measure or change would be addressed in the California Building
Energy Efficiency Standards, e.g., is the proposed change likely to be a mandatory
measure, prescriptive requirement, or compliance option? Would it change the way
that trade-off calculations are made? The following describes the types of changes in
more detail:
Mandatory Measure - The proposed change would add one mandatory measure:
Duct Sealing
Compliance Option - The change would remove one measure from the list of existing
compliance options for meeting the Standards using the performance approach.
Modeling - The change would modify the calculation procedures or assumptions used
in making performance calculations.
The proposed change modifies but does not expand the scope of the Building Energy
Efficiency Standards. The measure is part of the 2008 Residential Energy Standards:
The proposed change moves the measure from the Prescriptive (Component Package
D) to Mandatory Measures.
The following Standards documents would need to be modified: Building Energy
Efficiency Standards, ACM, and Residential Compliance Manual.
In each of the documents, the description of the measure would need to be referenced
in the Mandatory Measure sections instead of the Prescriptive section. The measures
would remain as HERS verification items, so modifications to the Reference
Appendices would not be required.

Page 15
2013 California Building Energy Efficiency Standards October 2011
d. Energy
Benefits
The Energy Benefits are based on improving the HVAC system performance in the
base case house by comparing the prototype house modeled to Prescriptive Package D
to the prototype house without duct sealing and testing. The per unit (HVAC system)
and per prototype building saving are the same.
Climate Zone
Duct Sealing and
Testing
Electricity
Savings Demand
Savings
(kw)
Natural Gas
Savings TDV
Electricity
Savings
TDV Gas
Savings (kwh/yr) (Therms/yr)
1 Per HVAC System &
Per Prototype Bldg 58.0 0.00 46.0 0.00 3.36
2 90.0 0.12 37.0 1.78 2.76
3 56.0 0.08 24.0 1.14 1.81
4 110.0 0.18 27.0 2.09 2.02
5 104.0 0.00 28.0 0.00 2.01
6 95.0 0.17 10.0 2.05 0.77
7 58.0 0.13 3.0 1.62 0.22
8 153.0 0.25 7.0 3.13 0.56
9 253.0 0.40 12.0 1.19 0.89
10 818.0 1.36 13.0 16.94 1.34
11 556.0 0.67 36.0 10.30 2.68
12 264.0 0.51 35.0 6.82 2.59
13 580.0 0.65 32.0 10.08 2.33
14 543.0 0.79 42.0 10.88 3.07
15 1329.0 1.55 5.0 22.94 0.33
16 301.0 0.45 66.0 5.97 4.84
Averages 335.5 0.5 26.4 6.1 2.0

Page 16
2013 California Building Energy Efficiency Standards October 2011
The savings from this measure results in the following statewide first year savings:
Duct Sealing and Testing
Climate
Zone
Total Electric Energy
Savings (GWh)
Total Gas Energy
Savings
(MMtherms )
Total TDV Savings
(Kbtu/yr)
1 0.02 0.02 1,270
2 0.11 0.04 5,335
3 0.07 0.03 3,611
4 0.30 0.07 11,048
5 0.05 0.01 1,049
6 0.11 0.01 3,350
7 0.13 0.01 3,971
8 0.30 0.01 7,255
9 0.57 0.03 4,720
10 7.24 0.12 161,741
11 1.79 0.12 41,899
12 2.58 0.34 92,002
13 4.01 0.22 85,840
14 0.89 0.07 22,864
15 2.56 0.01 44,795
16 0.45 0.10 16,215
Total 21.18 1.21 506,963

Page 17
2013 California Building Energy Efficiency Standards October 2011
e. Non-
Energy
Benefits
Duct sealing reduces the introduction of outside air into the duct system and the
home. Leaks in the duct system usually increase the air imbalance in a house,
increasing infiltration. Return system duct leaks draw air into the duct system from
the location of the return ducts such as the attic or garage. Air being drawn from the
attic or garage usually will have undesirable particulates or vapors from chemicals
stored in garages or fumes from cars engines when the car motor is started with the
car in the garage.

Page 18
2013 California Building Energy Efficiency Standards October 2011
f. Environmental Impact
Material Increase (I), Decrease (D), or No Change (NC): (All units are lbs/year)
Mercury Lead Copper Steel Plastic Others
Fiberglass
Insulation
Per Unit Measure1
(HVAC system)
NC NC NC NC NC NC
Per Prototype
Building2
NC NC NC NC NC NC
3. Specify the type of unit: per HVAC system.
4. For description of prototype buildings refer to Methodology section below.
Water Consumption:
On-Site (Not at the Powerplant)
Water Savings (or Increase)
(Gallons/Year)
Per Unit Measure1 0
Per Prototype
Building2
0
3. Specify the type of unit per HVAC system.
4. For description of prototype buildings refer to Methodology section below.
Water Quality Impacts:
Potential increase (I), decrease (D), or no change (NC) in contamination compared to the base case
assumption, including but not limited to: mineralization (calcium, boron, and salts), algae or bacterial
buildup, and corrosives as a result of PH change.
Mineralization
(calcium, boron, and
salts
Algae or Bacterial
Buildup
Corrosives as a
Result of PH
Change
Others
Impact (I, D, or NC) NC NC NC NC
The measure requires that contractors seal duct systems but there is no impact on water quality.

Page 19
2013 California Building Energy Efficiency Standards October 2011
g.
Technology
Measures
The proposed measure does not require or encourage a particular technology.
Contractors will use supplies and materials that are readily available at the HVAC
supply houses. Duct sealing techniques use the same skills that installers currently
use to install HVAC systems.
Useful Life, Persistence, and Maintenance:
There is no change in the useful life, persistence or maintenance of the duct system
due to sealing the duct system. Duct sealing has been used in California for over ten
years at this time without any reported adverse impacts on useful life, persistence or
maintenance.
h.
Performance
Verification
of the
Proposed
Measure
The proposed change will use the same leakage rates, verification procedures and
exceptions as currently specified in the Standards and Reference Appendices. HERS
verification will be required as described in the Reference Appendices.

Page 20
2013 California Building Energy Efficiency Standards October 2011
ii. Cost Effectiveness
a b c d e f g
Measure
Name
Measu
re Life
(Years
)
Additional
Costs1– Current
Measure Costs
(Relative to Base
case)
Additional
Cost2– Post-
Adoption
Measure Costs
(Relative to Base
case)
PV of
Additional3
Maintenance
Costs (Savings)
(Relative to Base
case)
PV of4
Energy
Cost
Savings
– Per
Proto
Building
(PV$)
LCC Per Prototype
Building
Duct
Sealing
and
Testing
($) ($) (PV$) ($)
Per
Unit
Per
Proto
Bldg
Per
Unit
Per
Proto
Bldg
Per
Unit
Per
Proto
Bldg
(c+e)-f (d+e)-f
Based on
Current
Costs
Based on
Post-
Adoptio
n Costs
CLZ 1 30 $800 $800 $700 $700 $0 $0 $1,569 -$769 -$869
CLZ 2 30 $800 $800 $700 $700 $0 $0 $2,121 -$1,321 -$1,421
CLZ 3 30 $800 $800 $700 $700 $0 $0 $15,391 -$14,591 -$14,691
CLZ 4 30 $800 $800 $700 $700 $0 $0 $1,920 -$1,120 -$1,220
CLZ 5 30 $800 $800 $700 $700 $0 $0 $939 -$139 -$239
CLZ 6 30 $800 $800 $700 $700 $0 $0 $1,317 -$517 -$617
CLZ 7 30 $800 $800 $700 $700 $0 $0 $859 -$59 -$159
CLZ 8 30 $800 $800 $700 $700 $0 $0 $1,724 -$924 -$1,024
CLZ 9 30 $800 $800 $700 $700 $0 $0 $2,840 -$2,040 -$2,140
CLZ 10 30 $800 $800 $700 $700 $0 $0 $8,539 -$7,739 -$7,839
CLZ 11 30 $800 $800 $700 $700 $0 $0 $6,063 -$5,263 -$5,363
CLZ 12 30 $800 $800 $700 $700 $0 $0 $3,919 -$3,119 -$3,219
CLZ 13 30 $800 $800 $700 $700 $0 $0 $5,797 -$4,997 -$5,097
CLZ 14 30 $800 $800 $700 $700 $0 $0 $6,516 -$5,716 -$5,816
CLZ 15 30 $800 $800 $700 $700 $0 $0 $10,869 -$10,069 -$10,169
CLZ 16 30 $800 $800 $700 $700 $0 $0 $5,049 -$4,249 -$4,349

Page 21
2013 California Building Energy Efficiency Standards October 2011
1. Additional cost: The additional cost used for the cost effectiveness analysis was $600 incremental
cost for duct sealing and $200 for HERS verification. This value is slightly lower (by $60) than the
value used for the 2008 Standards. Duct sealing has become a more common process reducing the
cost both by the installing contractor and the HERS rater. Utility incentive programs have been able
to increase duct sealing in both newly constructed homes and existing homes for less than $600.
A HERS rater survey yielded a state wide average cost for duct testing of $320 if duct sealing was the
sole verification measure, both newly constructed and alterations. The cost is substantially lower
when multiple HERS measures are verified. Four of the largest rater firms in the state charge a flat
fee per house for all HERS verifications. In this case the average cost of one HERS measure, such as
duct testing, is less than $100. This is a wide disparity in costs, but since the number of HERS
measures per home will likely be increasing, a mid-range cost seems reasonable. The mid-range
value used for this study was $200.
2. Post Adoption Measure Cost: The post adoption measure cost for the installing contractor was
reduced to $500 per system. For newly constructed homes, the competitive nature of the bidding
process continues to drive down the cost of a standard installation procedure. For alterations, the cost
will continue to be higher than newly constructed but as contractors and crew member become more
familiar with the process, the time required to seal the duct system will continue to decrease.
j. Analysis
Tools
The proposed measures are Mandatory Measures so analysis tools are not required:
measure would not be subject to whole building performance trade-offs.
k.
Relationship
to Other
Measures
No other measures are impacted by these proposed changes.

Page 22
2013 California Building Energy Efficiency Standards October 2011
3. Methodology
3.1 Part I Cooling Coil Airflow and Fan Watt Draw
For a number of years, there have been concerns that the performance of HVAC systems in both
existing homes and newly constructed homes is below the potential of the systems due to the design
and installation of the HVAC system. The California Building Energy Efficiency Standards (Title 24)
began addressing duct leakage over ten years ago and in subsequent code cycles included other
performance based measures to improve HVAC system efficiency. CASE Study Res 12 builds on this
basis by addressing duct sealing, cooling coil airflow, fan watt draw and system static pressure.
3.1.1 Data Collection
The research foundation for CASE Study Res 12 is a California Energy Commission and the
California Investor Owned Utilities funded Public Interest Energy Research Program project:
Efficiency Characteristics and Opportunities of New California Homes (ECO). The field research,
analysis and final report of the ECO project provide the foundation for three CASE studies. For this
CASE study, the pertinent research findings, tables and graphs from the ECO Final Report are
referenced as appropriate.
The ECO Project had two phases. In Phase One, 80 recently built homes in California were selected
and surveyed. The survey included measuring HVAC system characteristics and performance. There
were three findings from the ECO project that are most important for this CASE study: homes with
ducted HVAC system had low cooling coil airflow, high fan watt draw, and the predominate cause of
the low airflow was excessively high resistance in the return
In Phase Two, ten homes out of the original 80 homes were selected for follow-up field work. In
these ten homes, HVAC system repairs were made to improve system performance. A table of the
repairs is shown below.
House Number
Description of Improvements
4 Increased return size: 20" x 20" x 16" to 20" x 30" x 16" + 10
8 Added a second return
10 Added a second return
17 Moved return closer, added second return duct, new motor
24 Added third return, increased duct size from 16" to 18"
25 Added a second return
27 Increased return size: 14" x 25" x 14" to 20" x 30" x 16"
47 Added a second return
74 Air flow improvement: opened return air passage
77 Air flow improvement: fan speed, open grilles

Page 23
2013 California Building Energy Efficiency Standards October 2011
As noted from the table of improvements, the repairs focused on improving the return side of the
HVAC system. This decision was based on the measured static pressure values in the test homes.
Figure 13 from the ECO final report (shown below) shows that approximately half of the total static
pressure in the average system was in the return. This indicates that improvements to the return side
of the system are imperative to improving overall performance.
Figure 1. Cooling airflow average external static pressure
In eight out of the ten homes where improvement were performed, the return duct system was
enlarged or an additional return duct was installed. The figure below shows cooling coil airflow in
the ten homes in Phase Two before and after the improvements. The average system improved 35%,
from 266 cfm to 359 cfm of cooling coil airflow. This improvement shows that the potential impact
from improvements to the return side of the HVAC distribution system.
Figure 2. Cooling coil airflow before and after improvements

Page 24
2013 California Building Energy Efficiency Standards October 2011
Figure 28 from the ECO final report (shown below) shows the percentage improvement of normalized
sensible EER improvement in the ten homes in Phase Two of the project. The table shows an average
improvement of 24%. This demonstrates that overall system performance can be significantly
improved by reducing return side resistance (static pressure), thus increasing cooling coil airflow and
overall system performance.
Figure 3. Normalized Sensible EER Improvement
Phase Two of the ECO Project is the basis of the recommendations for this CASE study. One goal of
performing the improvements to the ten homes was to measure the potential improvement to HVAC
systems using standard materials and standard installation skills; but applied with improved design
criteria and improved installation techniques. The project shows the potential for improving airflow
and system performance solely, when necessary, by addressing the return side of the airflow system.
This is not to dismiss the importance of the supply side, nor to discourage good overall duct design.
The challenge lies with the numerous design consideration on the supply side that makes simplifying
the ACCA guidelines unreasonable. But simplifying and creating tables for the return side is
reasonable. The proposed return system sizing table is based on the findings in the ten homes of the
potential to improve overall system performance, even when the supply side is not designed to ACCA
guidelines.
CASE Study Res 12 was also charged with reviewing the potential for establishing a maximum static
pressure requirement for ducted HVAC systems. High system static pressure has long been
recognized as an indication of excessive resistance in the duct system resulting in low airflow and
high fan watt draw. Contractors and engineers that trouble shooting HVAC systems commonly
measure static pressure to help identify problems within the system.
The rationale for establishing a maximum static pressure requirement was that installers and designers
would improve system design to meet the requirement and system performance would improve. But
static pressure is only a symptom of system problems not the direct cause of the problems. The direct
cause is poor system design and or installation.

Page 25
2013 California Building Energy Efficiency Standards October 2011
Thus, the decision was made to address the problems of low airflow and high fan watt draw directly
by establishing mandatory requirements airflow and fan watt draw but not for static pressure. This
achieves the exact same result as establishing a static pressure requirement but with easier and more
direct measurements. Currently there is no industry standard for measuring static pressure that can be
referred. Nor is there a large group of experienced contractors ready to start measuring system static
pressure. Although measuring static pressure is a tool that is used in the HVAC industry, many
installers have never measured static pressure. Neither is there experience to know that the results can
be consistently duplicated between the installing contractor and a third party verifier.
For each of these reasons, the determination to establish the airflow and fan watt draw requirements
achieves all of the desired results without any of the challenges of establishing a new verification
requirement.
3.1.2 Energy and Cost Savings
Costs were calculated through collection of costs estimates for materials for return duct, return filter
grills, and return filters for both systems designed to ACCA guidelines and systems designed to the
proposed Return System Sizing Table. Cost effectiveness was calculated using the 2008 LCC
Methodology prepared for the CEC by AEC.1
3.1.3 Cost Data Collection
Cost data collection was achieved through a combination of quotes from HVAC supply houses, prices
from retails stores, and prices from on-line sales. Labor cost was set at $60/hour for incremental time
of on-site installers ($60/hour was established in the ECO project). All labor is additional time on site
so does not include travel time or travel expenses.
HERS verification costs varies with the number of HERS measures being verified. When there is
only one HERS measure the cost of verification is higher per measure than when there are multiple
measures. When cooling coil airflow and fan watt draw are specified, there will always be at least
one other HERS measure, Duct Leakage, to be verified. The HERS verification cost that was used
assumed multiple HERS verifications resulting in a lower per measure verification cost.
3.1.4 Lifecycle Cost Calculation
Lifecycle cost analysis was calculated using methodology explained in the California Energy
Commission report Life Cycle Cost Methodology 2008 California Building Energy Efficiency
Standards, written by Architectural Energy Corporation, using the following equation:
∆LCC = ∆C – (PVTDV*∆TDV)
Where:
1 Architectural Energy Corporation, Life Cycle Cost Methodology 2008 California Building Energy Efficiency Standards, October 21, 2005.

Page 26
2013 California Building Energy Efficiency Standards October 2011
∆LCC change in lifecycle cost, ($/sqft)
∆C cost premium associated with the measure, ($/sqft)
PVTDV present value of a TDV unit (30-year), ($)
∆TDV TDV energy savings
A 30-year lifecycle was used for the LCC methodology. LCC calculations were completed for the
Prototype D building.
3.1.5 Statewide Savings Estiamtes
The statewide energy savings associated with the proposed measures will be calculated by
multiplying the per unit estimate with the statewide estimate of new construction in 2014. Details on
the method and data source of the residential construction forecast are in 7.1.
3.2 Part II – Duct Sealing
The proposed modification to the Residential Building Energy Standards is to make duct sealing a
mandatory measure. Duct sealing and testing has been part of the Residential Energy Standards
since the 1998 code cycle. For the 1998 code it was a compliance option and in 2005 it was
included in Prescriptive Package D. It has been shown to be cost effective in previous code cycles
and again is shown to be cost effective in this CASE study.
3.2.1 Data Collection
The research foundation for this portion of CASE Study Res 12 is the same as discussed earlier in
this report: Efficiency Characteristics and Opportunities of New California Homes (ECO).
The ECO Final Report shows duct leakage in the 80 homes in Phase One of the field research.
The homes are groups by occupancy type.

Page 27
2013 California Building Energy Efficiency Standards October 2011
Figure 4. Duct Leakage by Building Type (ECO Final Report)
Figure 23 shows that the median duct leakage for single family homes is almost exactly at the
current Title 24 standard of 6%; but there are three homes with substantially higher leakage rates.
Duct leakage for multifamily homes (apartments and townhouses) is much higher. The median
leakage for apartments is over 15% and for townhouses it is just over 10%. The ECO field team
did not review the Title 24 compliance documentation for these homes, but the duct location likely
was modeled as “ducts in conditioned space”. The duct system in multifamily homes is
commonly located in hallway soffits thereby meeting the criteria of ducts in conditioned space.
Most of the air leakage from ducts in conditioned space is assumed to be leaking from the ducts
into conditioned space. But in multifamily units this is not necessarily true. It is difficult to
visually determine if duct leakage in a multifamily dwelling unit is leaking to outside the building,
into other dwelling units or back into the subject dwelling unit. Error! Reference source not
found.5 from the ECO Final Report separates the duct leakage between total leakage and leakage
to outside.

Page 28
2013 California Building Energy Efficiency Standards October 2011
Figure 5. Duct Leakage Rate for Apartment and Town Houses (ECO Final Report)
The leakage to outside is a significant portion of the duct leakage in both apartments and town
houses. The ECO Final Report (Table 23, pg 44) shows that 72% of the apartment units had the
duct system 100% in conditioned space or in soffits. For town house, only 5% of the units had
ducts 100% in conditioned space or in soffits. This is clearly reflected in the town house graph
showing that for most units, total duct leakage and leakage to outside is very similar.
The ECO field research shows that single family homes, on the average, have very reasonable
duct leakage rates, but there are still some homes with significant duct leakage. Requiring
mandatory duct sealing and testing will have little impact on most builders but will substantially
improve duct leakage rates in the homes that currently are being built with high rates of duct
leakage.
Since duct sealing has been shown to be cost effective both in past code cycles and in this CASE
study, making it a mandatory measure will increase its impact in the coastal climate zones and in
the multifamily market. The leakage rates and exceptions would remain as currently structured in
the Reference Appendices with one exception as noted in the next paragraph.
For multifamily building, it is proposed that duct sealing be mandatory regardless of duct location.
HVAC systems with ducts 100% in conditioned space or in soffits have significant leakage to
outside which would be addressed if duct sealing and testing is a mandatory measure.
3.2.2 Energy and Cost Savings
Cost effectiveness was calculated using the 2008 LCC Methodology prepared for the CEC by AEC.2
2 Architectural Energy Corporation, Life Cycle Cost Methodology 2008 California Building Energy Efficiency Standards, October 21, 2005.

Page 29
2013 California Building Energy Efficiency Standards October 2011
3.2.3 Cost Data Collection
Duct sealing has been increasingly used by HVAC contractors over the last ten years, but the
incremental cost to perform duct sealing remains difficult to ascertain. Contractors are reluctant to
provide their actual time or cost for multiple reasons. One of the most important reasons is that most
contractors do not separate out the job time to perform duct sealing from the other tasks associated
with each part of the job. Contractors that perform careful time analysis are usually not willing to
give away their data to potential competitors.
The HERS verification cost was determined via a survey of all HERS raters and a survey of several of
the large rater firms.
The cost of sealing ducts and the HERS verification costs are not values that can be looked up in a
catalogue, but vary but contractor and job. The values used in the cost effectiveness analysis are
based current surveys and costs used in previous cost effectiveness analysis.
3.2.4 Lifecycle Cost Calculation
HMG calculated lifecycle cost analysis using methodology explained in the California Energy
Commission report Life Cycle Cost Methodology 2008 California Building Energy Efficiency
Standards, written by Architectural Energy Corporation, using the following equation:
∆LCC = ∆C – (PVTDV*∆TDV)
Where:
∆LCC change in lifecycle cost, ($/sqft)
∆C cost premium associated with the measure, ($/sqft)
PVTDV present value of a TDV unit (30-year), ($)
∆TDV TDV energy savings
A 30-year lifecycle was used for the LCC methodology. LCC calculations were completed for the
Prototype D building.
3.2.5 Statewide Savings Estimates
The statewide energy savings associated with the proposed measures will be calculated by
multiplying the per unit estimate with the statewide estimate of new construction in 2014. Details on
the method and data source of the residential construction forecast are in 7.1.

Page 30
2013 California Building Energy Efficiency Standards October 2011
4. Analysis and Results
4.1 Part I - Cooling Coil Airflow and Fan Watt Draw
4.1.1 Field Survey Data Summary
As described in Section 3 of this report, CASE Study Res 12 draws from the Efficiency
Characteristics and Opportunities of New California Homes (ECO) project for both its field findings
and recommendations.
The ECO Project Phase One findings that address this CASE study are: (see the original report for a
complete listing of all Findings)
“The average air conditioner performed well below expectations with low airflow across the indoor
coils averaging 322 CFM per ton of cooling capacity.”
“The split system air conditioner evaporators drew an average 650 watts per 1000 CFM of
airflow.”
“Only 28% of the systems tested met the 2008 California Title 24 Standards for cooling airflow and
fan power. The predominant cause of low airflow in these units was excessively high return system
static pressure (including the filter).”
In Phase Two, ten homes were selected from the original group of 80. Upgrades were made to the
HVAC systems in those ten homes and additional cooling system tests were performed. The relevant
Finding from Phase II is listed below:
“Repairs/upgrades on the nine units in Phase Two resulted in an average efficiency improvement
of 24%”
“The most common and successful repair was reducing the flow resistance of the return duct
system between the house and the furnace/air conditioner.”
The improvements to the HVAC systems in Phase Two increased cooling coil airflow by 35% over
the existing conditions and improved normalized EER at the unit by 24%. The findings from the
ECO Final Report indicating the condition of existing HVAC systems and the potential for improved
system performance via reasonable system enhancements are the bias for the proposed
recommendations from this CASE study.
4.1.2 Development of Proposed Measures
The proposed recommendations for Part I of this CASE study are to provide two options to improve
cooling coil airflow and fan watt draw. Option 1 is a mandatory measure for 350 cfm/ton cooling coil
airflow minimum and .58 watts/cfm fan watt draw maximum. Option 2 is to size the return air system
according to the Return System Sizing Table.
The ECO project shows that there is substantial room for improvement in the both airflow and fan
watt draw with new HVAC systems. This CASE study studied the findings from the ECO project,
and in consultation with the ECO project team, developed the proposed recommendations.

Page 31
2013 California Building Energy Efficiency Standards October 2011
High static pressure is a “symptom” of poor HVAC system design: HVAC systems typically have low
airflow and high fan watt draw because of high static pressure. Setting a static pressure standard
would address this symptom, but only indirectly. It is much more direct to set a mandatory standard
for airflow and fan watt draw rather than trying to control airflow and fan watt draw by setting a
standard for static pressure. Measuring airflow and fan watt draw in installed system is easily
performed; both contractors and HERS raters are familiar with the procedure. To establish a new
procedure for static pressure measurements would be more challenging since the industry, at the
present time, does not commonly measure static pressure.
In the 2008 Building Energy Standards, airflow and fan watt draw are prescriptive requirements in
climate zones 10 – 15 but are not required in the other climate zones. Informal discussions with HERS
raters indicate that airflow and fan watt draw are not commonly used HERS measures in newly
constructed homes. Changing the required airflow and fan watt draw from prescriptive to mandatory
measures will have the immediate impact of improving two of the deficiencies that the ECO project
found in HVAC systems. Thus, the recommendation is to make minimum airflow and maximum fan
watt draw mandatory measures for heating and cooling systems.
The 2008 Building Energy Standards established the levels of 350 cfm/ton air flow and .58 watts/cfm
fan watt draw. These 2008 Standard levels were based on survey data of HVAC fan motors and the
minimum required airflow for proper air conditioner operation. It was determined at that time that
nearly any fan motor could meet the criteria with a properly designed duct system. It is recommended
that the 2013 Standards used the same airflow and fan watt draw standards, but make them mandatory
measures.
Realizing that builder and HVAC contractors are sometimes reluctant to rely upon a standard that
cannot be measured until after the system is installed and functional, a second option for compliance
was developed that avoids that challenge. The second option is a set of return duct and filter grill
sizing tables that can be used in lieu of measuring airflow or fan watt draw. Return systems installed
using the return system sizes in the proposed tables, have a reasonable expectation that both the
airflow and fan watt draw specifications will be met. Airflow and fan watt draw measures will not be
required if the return system sizing tables are used, rather building inspectors would verify that the
correctly sized duct and filter grills are installed.
The ECO Final Report Section 4.2 Discussion states, “This study showed the primary driver of the
low airflow is the restrictive nature of the return system.” The ECO project measured static pressure
in the homes in their study: specifically the measurements included the static pressure in the supply
ducts, return system and the cooling coil. The ECO report shows that approximately 50% of the total
static pressure in the average system is attributed to the return system including the filter.
The proposed sizing tables address only return duct and grill sizing, not supply systems. There are
too many variables with supply ducts to create a simple sizing table. But return systems are typically
straightforward enough that sizing tables are reasonable. The ECO Final Project Report Section 4.2.2
Table 25: Prescriptive Return Systems, describes the field experience and findings from Phase Two of
the project and discusses the development of the return system sizing tables. The return system sizing
tables are designed to result in a maximum static pressure drop in the return system of 0.0375 IWC.
The proposed return system sizing tables in this CASE study are based on sizes developed in the ECO
project, Table 25.

Page 32
2013 California Building Energy Efficiency Standards October 2011
The proposed return duct and filter grill sizes are larger than ACCA guidelines since the sizing tables
only address the return system. If an HVAC system is designed to ACCA standards for both supply
and return, the airflow and fan watt draw likely will meet the proposed airflow and fan watt draw
specifications. However, since the tables only address the return system, the return system must be
oversized to compensate for the potential of an undersized supply. Another reason for the larger
proposed duct sizes is that the field survey found that return systems commonly have restrictions such
as excessive bends, compression of the duct and restrictions at the entry to the furnace/air handler
blower compartment. Each of these factors reduces airflow below what is typically expected through
that particular size flex duct.
The proposed return system size tables are shown below. Separate tables are provided for systems
with a single return and systems with multiple returns.
Single Return
Tons Nominal Airflow
Return Duct Size (inches)
Return Grill Gross Area
1.5 600 16 500 sq. in.
2 800 18 600 sq. in.
2.5 1000 20 800 sq. in.
3 1200
Multiple returns required
3.5 1400
4 1600
5 2000
Multiple Return Systems
Nominal Capacity
(Tons)
Return # 1 Return # 2 Return Grills Gross Area Duct Size
(inches) Duct Size (inches)
1.5 12 10 500 sq. in.
2 14 12 600 sq. in.
2.5 14 14 800 sq. in.
3 16 14 900 sq. in.
3.5 16 16 1000 sq. in.
4 18 18 1200 sq. in.
5 20 20 1500 sq. in.

Page 33
2013 California Building Energy Efficiency Standards October 2011
The proposed airflow standard of 350 cfm/ton minimum and fan watt draw of .58 watt/cfm maximum
would apply in the following situations:
a. Newly constructed single family and multifamily homes in all climate zones when a
ducted heated and cooling system is installed. Heating only systems are exempt. Applies to both split
systems and package systems.
b. HVAC alterations when there is a ducted heating and cooling system if a completely
new duct system is installed or the entire existing duct system is replaced. Heating only systems are
exempt. Applies to both split systems and package systems.
4.1.3 Energy and Cost Savings
The table below presents the prototype building used to calculate energy benefits, environmental
impacts, and cost effectiveness.
Occupancy
Type
Area
(Square Feet)
Number of Stories Other Notes
Prototype 1
Single
Family,
Residential
2700 2 This is the default prototype D as
found in the new CALRES tool and
also as described in the 2008 Title 24
ACM.
Figure 6. Building prototype characteristics
A multi-step process was used to determine the incremental cost of return systems sized according to
the Return Sizing Table compared to systems sized to ACCA guidelines. The process is described
below with the tables used in the calculations.
1. A return duct and return filter grill sizing table was developed based on ACCA guidelines.
ACCA does not provide specific duct sizes, rather it provides a methodology to calculate the
duct sizes based on system parameters. The following table was developed based on typical flex
duct systems located in vented attics, following the ACCA guidelines.
Flex Duct Return - ACCA Guidelines
Nominal Capacity
(Tons)
Return Duct Size (inches)
Return Grill Gross Area
(sq. in.)
Example Grill Size (inches)
1.5 14 400 20 X 20
2 16 480 24 X 20
2.5 16 600 30 X 20
3 18 720 36 X 20

Page 34
2013 California Building Energy Efficiency Standards October 2011
3.5 18 800 40 X 20
4 20 800 40 X 20
5 2 - 16" 1124 2 - 30 & 20
Figure 7. Sizing for flex duct return and grill according to ACCA guidelines
2. The costs of the materials for a return system sized according to the ACCA guideline were
secured. The cost was calculated for both R-6 and R-8 flex duct.
3. Three HVAC supply houses were contacted to secure contractor prices for flex duct and return
filter grills. Supply houses often time have different prices depending on the volume of
business they do with a contractor; we requested the mid-range price. The prices from the
supply houses were averaged.
4. The three HVAC supply houses that were contacted for prices do not currently stock R-4.2
flex duct. The quoted price for R-4.2 duct was approximately the same as R-6 flex duct since
it had to be special ordered. Thus, costs were only calculated for R-6 and R-8 flex ducts. In
the three climate zones where R-4.2 duct insulation is the current prescriptive standard, the
costs for R-6 flex duct were used.
5. The prices for 2” MERV 8 pleated filters were secured from three sources: HVAC supply
houses, retail stores and the internet. Since filters are consumer products they are readily
available at retail stores and over the internet in addition to HVAC supply houses.
6. 30% contractor markup was added to material costs to approximate typical contractor pricing.
Return System Built to ACCA Sizing Guidelines w/ R-6 Flex Duct
Nominal Capacity
(tons)
Duct Size (inches)
Duct Cost (R-
6)
Return Grill
2" Filter Grill
2" Filter
Material Cost
Material Cost w/
30% markup
1.5 14 $51.18 20x20 $18.01 $10.42 $79.61 $103.49
2 16 $59.53 25x20 $19.35 $10.97 $89.85 $116.80
2.5 16 $59.53 30x20 $23.63 $14.00 $97.16 $126.30
3 18 $68.83 36x20 $35.00 $18.10 $121.93 $158.51
3.5 18 $68.83 40x20 $45.00 $24.12 $137.95 $179.33
4 20 $84.74 40x20 $45.00 $24.12 $153.86 $200.02
5 2 - 16's
$119.05 2 - 30 x
20 $47.26 $28.00 $194.31 $252.61
Figure 8. Return system meaurements for R-6 flex duct, according to ACCA guidelines

Page 35
2013 California Building Energy Efficiency Standards October 2011
Return System Built to ACCA Sizing Guidelines w/ R-8 Flex Duct
Nominal Capacity
(tons)
Duct Size (inches)
Duct Cost (R-
8)
Return Grill
2" Filter Grill
2" Filter
Material Cost
Material Cost w/
30% markup
1.5 14 $65.82 20x20 $18.01 $10.42 $94.25 $122.53
2 16 $78.65 25x20 $19.35 $10.97 $108.98 $141.67
2.5 16 $78.65 30x20 $23.63 $14.00 $116.28 $151.17
3 18 $93.09 36x20 $35.00 $18.10 $146.19 $190.05
3.5 18 $93.09 40x20 $45.00 $24.12 $162.21 $210.87
4 20 $119.27 40x20 $45.00 $24.12 $188.39 $244.91
5 2 - 16's
$157.31 2 - 30 x
20 $47.26 $28.00 $232.57 $302.34
Figure 9. Return system meaurements for R-8 flex duct, according to ACCA guidelines
7. Two similar tables were developed based on the Proposed Return System Sizing table that
includes larger ducts, larger filter grills and larger filters.
8. If the system includes multiple returns, additional labor cost was included to allow for the time
to install the second return duct and filter grill.
9. The same process that was used to calculated the cost of the system sized to ACCA guidelines
was used to secure these costs and the same 30% contractor markup was applied to the
materials.
Return Air System Built to Proposed Return Sizing Table w/ R-6 Ducts
Nominal Capacity
(tons)
Duct Size (inches)
Duct Cost (R-
6)
Return Grill
2" Filter Grill
2" Filter
Material Cost
Material Cost w/
30% markup
Incremental Labor Cost @ $60/hr
Duct & Grill Cost
1.5 16 $59.53 20x25 $19.35 $10.97 $89.85 $116.80 $0.00 $116.80
2 18 $68.83 20x30 $23.63 $18.10 $110.56 $143.73 $0.00 $143.73
2.5 14 & 14 $102.36 2 -
20x20 $36.02 $20.84 $159.22 $206.99 $120.00 $326.99
3 16 & 14 $110.71 20x30 &
15x20 $41.64 $24.63 $176.98 $230.07 $120.00 $350.07
3.5 16 & 16 $119.05 2 -
25x20 $38.70 $21.94 $179.70 $233.61 $120.00 $353.61
4 18 & 18 $137.65 2 -
30x20 $47.26 $28.00 $212.91 $276.79 $120.00 $396.79
5 2 - 18's &
14 $188.83
2 - 30x20 &
15x20 $65.27 $38.63 $292.73 $380.55 $180.00 $560.55

Page 36
2013 California Building Energy Efficiency Standards October 2011
Return Air System Built to Proposed Return Sizing Table w/ R-8 Ducts
Nominal Capacity
(tons)
Duct Size (inches)
Duct Cost (R-
6)
Return Grill
2" Filter Grill
2" Filter
Material Cost
Material Cost w/
30% markup
Incremental Labor Cost @ $60/hr
Duct & Grill Cost
1.5 16 $78.65 20x25 $19.35 $10.97 $108.98 $141.67 $0.00 $141.67
2 18 $93.09 20x30 $23.63 $18.10 $134.82 $175.27 $0.00 $175.27
2.5 14 & 14 $131.65 2 -
20x20 $36.02 $20.84 $188.51 $245.06 $120.00 $365.06
3 16 & 14 $144.48 20x30 &
15x20 $41.64 $24.63 $210.75 $273.97 $120.00 $393.97
3.5 16 & 16 $157.31 2 -
25x20 $38.70 $21.94 $217.95 $283.34 $120.00 $403.34
4 18 & 18 $186.18 2 -
30x20 $47.26 $28.00 $261.44 $339.87 $120.00 $459.87
5 2 - 18's &
14 $252.00
2 - 30x20 &
15x20 $65.27 $38.63 $355.90 $462.67 $180.00 $642.67
Figure 10. Return system meaurements for R-6 and R-8 flex ducts, according to the proposed
return sizing table
4.1.4 Cost-effectiveness
The incremental cost was calculated for installing a return air system sized according to the proposed
requirements compared to a return system sized to ACCA guidelines. The system costs included the
current duct insulation R-value and the size of the A/C system for the prototype house for each
climate zone. The load calculations from the CalRes computer simulations were used as the basis for
the air conditioning equipment size selection. The A/C size is smaller than typical common practice
but larger than best practice as advised by whole house performance contractors.
Incremental Cost
Climate Zone
Duct R-Value
(2008 T-24)
System Size
(nominal tons)
Cost for Return Air System Installed
According to ACCA Guidelines
Cost for Return Air System Installed
Accorded to Proposed Return Duct Table
Incremental Cost (materials & labor) Based on System Size and Duct R-
Value
1 6 3 $159 $350 $192
2 6 4 $200 $397 $197
3 6 3 $159 $350 $192
4 6 4 $200 $397 $197
5 6 4 $200 $397 $197
6 4.2 3 $159 $350 $192
7 4.2 3 $159 $350 $192

Page 37
2013 California Building Energy Efficiency Standards October 2011
8 4.2 4 $200 $397 $197
9 6 4 $200 $397 $197
10 6 4 $200 $397 $197
11 6 5 $253 $561 $308
12 6 4 $200 $397 $197
13 6 5 $253 $561 $308
14 8 5 $302 $643 $340
15 8 5 $302 $643 $340
16 8 3 $190 $394 $204
Figure 11. Calculated incremental costs by climate zone and design guidelines
Once the incremental cost of the systems sized to the proposed Return Sizing Table was completed,
the energy cost savings was calculated. The 2013 CALRES software was used to calculate the energy
cost saving per system/building.
The prototypical building was modeled in each climate zone with the 2008 Package D measures:
except airflow was set at 300 cfm and fan watt draw was set at .80 watts/cfm. The prototypical
building was then modeled in each climate zone, again with the same Package D set of measures:
except this time airflow was set at 350 cfm/ton airflow and the fan watt draw was set at .58 watt/cfm.
The savings were calculated based on the dollar/KTDV value provided for the LCC analysis.
Climate Zone
TDV KBtu/sf-yr
Total Airflow 300 cfm/ton Fan watt
draw .80 watts/cfm
Airfow 350 cfm/ton Fan Watt
Draw .58 watts/cfm
Savings
1 49.31 48.89 0.42 $196
2 62.83 61.30 1.53 $715
3 43.10 42.27 0.83 $388
4 62.41 60.25 2.16 $1,009
5 39.87 39.40 0.47 $220
6 45.52 43.82 1.70 $794
7 35.17 33.84 1.33 $621
8 60.03 57.04 2.99 $1,397
9 87.12 82.34 4.78 $2,233
10 100.70 95.30 5.40 $2,522
11 152.86 144.32 8.54 $3,989
12 105.51 100.61 4.90 $2,289
13 150.36 141.88 8.48 $3,961
14 139.59 132.74 6.85 $3,200
15 214.07 200.08 13.99 $6,535
16 109.43 105.80 3.63 $1,696
Figure 12. Calculated energy savings and dollar/KTDV by climate zone

Page 38
2013 California Building Energy Efficiency Standards October 2011
The cost-effectiveness varies considerably by climate zone, with the proposed measures being
barely cost-effective in the mild climate zones. The proposed recommendations only apply when
air conditioning is installed in a home. The proposed recommendations are not cost-effective for
homes with heating only HVAC systems, so heating only systems are not included in the
recommendations.
In the hot climate zones the proposed recommendations are very cost-effective, which is
completely expected by measures that improve air conditioning system efficiency.
4.1.5 Modeling Rules and Algorithms
The modeling rules and algorithms used for the proposed changes are currently used in the
modeling software. No additional changes or modifications will be required.
The ability to model higher airflow or lower fan watt draw would continue to be compliance
options as allowed in the 2008 Energy Standards.
4.1.6 Statewide Savings Estimates
The total statewide energy savings potential for this measure are shown in the table below.
Airflow (350 cfm/ton) & Fan Watt Draw (.58 w/cfm)
Climate
Zone
Total Electric
Energy Savings
(GWh)
Total Gas Energy
Savings
(MMtherms )
Total TDV
Savings (Kbtu/yr)
1 0.06 -0.0034 159
2 0.19 -0.0082 1,798
3 0.12 -0.0049 1,016
4 0.44 -0.0108 5,806
5 0.05 -0.0021 245
6 0.11 -0.0024 2,020
7 0.11 0.0000 2,870
8 0.31 -0.0039 5,878
9 0.55 -0.0045 10,846
10 2.57 -0.0265 47,779

Page 39
2013 California Building Energy Efficiency Standards October 2011
11 1.63 -0.0226 27,567
12 2.76 -0.0684 47,907
13 3.65 -0.0415 58,656
14 0.74 -0.0131 11,227
15 1.91 -0.0019 21,156
16 0.48 -0.0210 5,445
Total 15.70 -0.24 250,375
Figure 13. Calculated airflow and fann watt draw statewide energy savings by climate zone, and
total
4.2 Part II - Duct Sealing
4.2.1 Field Survey Data Summary
The Efficiency Characteristics and Opportunities of New California Homes (ECO) project
provided the field research and analysis used for this CASE study. The ECO project measured the
duct leakage in each of the homes with duct systems that were part of the study. The ECO Final
Report Figure 23 (shown below) shows duct leakage in the 80 homes subdivided according to
building type.

Page 40
2013 California Building Energy Efficiency Standards October 2011
Figure 14. Duct Leakage by Building Type
Duct leakage for single family homes shows a median value very close to the current Title 24
standard of 6% leakage. While most of the homes are very close to the 6% standard, three homes
have substantially higher leakage rates. While these values are lower than the current untested
duct leakage values of 22% for homes built since 2001, the three homes with higher leakage rates
still indicate room for improvement in duct sealing and testing.
Duct leakage for multifamily homes (apartments and townhouses) is higher than for single family
homes. The median leakage for apartments is over 15% and for townhouses it is just over 10%.
The ECO field team did not review the Title 24 compliance documentation for these homes. But
for the apartment units, it is reasonable to assume most of the duct system was modeled with
“ducts in conditioned space”. The duct systems were usually located in hallway soffits that meet
the criteria of the ducts being in conditioned space, which is very common in apartment buildings.
When ducts are located in conditioned space, the modeling assumption is that most of the air
leakage from ducts is leaking into conditioned space. But in multifamily units this is not
necessarily true. It is difficult to visually determine if duct leakage in a multifamily dwelling unit
is leaking to outside the building, into other dwelling units or back into the dwelling unit. Error!
Reference source not found. from the ECO Final Report separates the duct leakage between total
leakage and leakage to outside.

Page 41
2013 California Building Energy Efficiency Standards October 2011
Figure 15. Duct Leakage Rate for Apartment and Town Houses (ECO Final Report)
The ECO Final Report Table 23 (pg 44) shows that 72% of the apartment units had the duct
system 100% in conditioned space or in soffits. For town house, only 5% of the units had ducts
100% in conditioned space or in soffits. This is clearly reflected in the town house graph showing
that for most units, total duct leakage and leakage to outside is very similar.
The graph for apartment duct leakage shows that even when the ducts are in conditioned space,
much of the duct leakage continues to be leakage to outside.
The ECO field research shows that single family homes, on the average, have very reasonable
duct leakage rates, but there are still some homes with significant duct leakage. Requiring
mandatory duct sealing and testing will have little impact on most builders but will substantially
improve duct leakage rates in the homes that currently are being built with high rates of duct
leakage.
Since duct sealing has been shown to be cost effective both in past code cycles and in this CASE
study, making it a mandatory measure will increase its impact in the coastal climate zones and in
the multifamily market. The leakage rates and exceptions would remain as currently structured in
the Reference Appendices with one exception as noted in the next paragraph.
For multifamily building, it is proposed that duct sealing be mandatory regardless of duct location.
HVAC systems with ducts 100% in conditioned space or in soffits have significant leakage to
outside which would be addressed if duct sealing and testing is a mandatory measure.
4.2.2 Energy and Cost Savings
The 2013 CalRes software was used to model the prototypical house using the algorithm that is
already in the software for duct sealing. The prototypical house was modeled in each climate
zone according to 2008 Prescriptive Package D which includes duct leakage at 6% (8% within the
calculation). The prototypical house was then rerun without duct leakage being selected, setting
the duct leakage rate at 22% since the house was built post 2001.

Page 42
2013 California Building Energy Efficiency Standards October 2011
The second column below is the TDV kBtu/sf-yr values of the prototypical house modeled to
prescriptive package D for each climate zone. The third column has one change in the computer
model, duct testing is not included. The fourth column shows the difference (savings) between
the conditions and the next column shows the value of the energy savings.
Climate Zone
TDV Kbtu/sf-yr
Total Package D Design
Package D without Duct
Sealing Savings
1 45.95 49.31 3.36 $1,569
2 57.24 61.78 4.54 $2,121
3 10.15 43.1 32.95 $15,391
4 58.3 62.41 4.11 $1,920
5 37.86 39.87 2.01 $939
6 42.7 45.52 2.82 $1,317
7 33.33 35.17 1.84 $859
8 53.85 57.54 3.69 $1,724
9 76.86 82.94 6.08 $2,840
10 82.42 100.7 18.28 $8,539
11 123.91 136.89 12.98 $6,063
12 87.13 95.52 8.39 $3,919
13 122.24 134.65 12.41 $5,797
14 112.36 126.31 13.95 $6,516
15 162.9 186.17 23.27 $10,869
16 98.62 109.43 10.81 $5,049
Figure 16. Calculated energy savings comparison between Package D and witout Package D
duct sealing, by climate zone
The additional cost used for the cost effectiveness analysis was $600 incremental cost for duct
sealing and $200 for HERS verification. This value is slightly lower (by $60) than the value used
for the 2008 Standards.
Securing duct sealing cost is difficult for a variety of reasons. Contractors commonly do not have
hard values or were not willing to provide costs. Informally several contractors were asks if $600
is a reasonable estimate of the cost of sealing ducts including the cost of the duct test. For newly
constructed, the answer was always yes. For existing homes, the answer was, usually but there are
always exceptions. When ask if the cost of duct testing had declined and would continue to
decline and it becomes more common, a majority of contractors agreed.

Page 43
2013 California Building Energy Efficiency Standards October 2011
Duct sealing in newly constructed homes is straightforward in most cases. The cost for sealing
ducts in existing homes is much more variable due to all the variations that occur in existing
homes.
A HERS rater survey yielded a state wide average cost for duct leakage verification of $320 if
duct sealing was the sole verification measure, both for newly constructed and alterations. This is
the cost for a verified unit, excluding the potential economy of sampling. The cost is substantially
lower when multiple HERS measures are verified. Four of the largest rater firms in the state
charge a flat fee per house for all HERS verifications. In this case the average cost of one HERS
measure, such as duct testing, is less than $100. This is a wide disparity in costs, but given that
sampling reduces the verification cost, and the number of HERS measures per home is likely to
increase, a mid-range cost seems reasonable. The mid-range value used for this study was $200.
The post adoption measure cost for the installing contractor was reduced to $500 per system. For
newly constructed homes, the competitive nature of the bidding process continues to drive down
the cost of a standard installation procedure. For alterations, the cost will continue to be higher
than newly constructed but as contractors and crew member become more familiar with the
process, the time required to seal the duct system will continue to decrease.
4.2.3 Statewide Savings Estimates
The total statewide energy savings potential for this measure are shown in the table below.
Duct Sealing and Testing
Climate
Zone
Total Electric Energy
Savings (GWh)
Total Gas Energy
Savings
(MMtherms )
Total TDV Savings
(Kbtu/yr)
1 0.02 0.02 1,270
2 0.11 0.04 5,335
3 0.07 0.03 3,611
4 0.30 0.07 11,048
5 0.05 0.01 1,049
6 0.11 0.01 3,350
7 0.13 0.01 3,971
8 0.30 0.01 7,255
9 0.57 0.03 4,720
10 7.24 0.12 161,741

Page 44
2013 California Building Energy Efficiency Standards October 2011
11 1.79 0.12 41,899
12 2.58 0.34 92,002
13 4.01 0.22 85,840
14 0.89 0.07 22,864
15 2.56 0.01 44,795
16 0.45 0.10 16,215
Total 21.18 1.21 506,963
Figure 17. Calculated duct sealing statewide savings estimates by climate zone, and total
4.2.4 Cost-effectiveness
Results of the cost-effectiveness analysis are presented in Section 2 of this report. The measure is
cost-effective in all climate zones. Climate zones 5 (central coast) and 7 (San Diego) are the two
climate zones with lowest level of cost effectiveness. This is reasonable and to be expected since
these very mild climate zones have minimal heating or cooling. But since duct sealing is cost
effective even in the mildest climates in California, it is very cost effective in the other climate
zones. This is a strong statement of the rationale for making duct testing a mandatory measure.
4.2.5 Modeling Rules or Algorithms
The modeling rules and algorithms used for the proposed changes are currently used in the
modeling software. No additional changes or modifications will be required.

Page 45
2013 California Building Energy Efficiency Standards October 2011
5. Recommended Language for the Standards Document,
ACM Manuals, and the Reference Appendices
5.1 Standards Document
5.2 Part I – Cooling Coil Airflow and Fan Watt Draw
Section 150(m)11
11. Ducted split system central air conditioners and ducted split system heat pumps shall meet
either of the following.
A. Simultaneously demonstrate, in every zonal control mode, an airflow equal to or
greater than 350 CFM/ton of nominal cooling capacity and a fan watt draw equal to or less
than 0.58 W/CFM as specified in Reference Residential Appendix RA3
B. The return duct(s) and return grill shall be sized in accordance with Table 150-D or
Table 150-E
Table 150-D Return System Sizing Table
Single Return
Tons Return Duct Size (inches)
Return Grill Gross Area
1.5 16 500 sq. in.
2 18 600 sq. in.
2.5 20 800 sq. in.
3
Multiple returns required 3.5
4
5
Table 150-D Return System Sizing Table
Multiple Return Systems
Nominal Capacity
(Tons)
Return # 1
Return # 2 Return Grills Gross
Area Duct Size (inches)
Duct Size (inches)
1.5 12 10 500 sq. in.

Page 46
2013 California Building Energy Efficiency Standards October 2011
2 14 12 600 sq. in.
2.5 14 14 800 sq. in.
3 16 14 900 sq. in.
3.5 16 16 1000 sq. in.
4 18 18 1200 sq. in.
5 20 20 1500 sq. in.
Section 151(f)
7. Space heating and space cooling. All space heating and space cooling equipment shall
comply with minimum Appliance Efficiency Regulations as specified in Sections 110 through 112
and meet the requirements of subsections A and B:
A. When refrigerant charge measurement or charge indicator display is shown as required by
TABLE 151-B , TABLE 151-C or TABLE 151-D, ducted split system central air conditioners and
ducted split system heat pumps shall:
i. Have temperature measurement access holes (TMAH) saturation temperature measurement
sensors (STMS), and proper refrigerant charge confirmed through field verification and diagnostic
testing in accordance with procedures set forth in the Reference Residential Appendix RA3.2; or ii.
Be equipped with a charge indicator display (CID) clearly visible to the occupant. The display shall
demand attention when the air conditioner fails to meet the requirements contained in Reference Joint
Appendix JA6.2. The display shall be constantly visible and within one foot of the thermostat.
Systems equipped with a CID shall meet the requirements of Residential Field Verification and
Diagnostic Test Procedures of Reference Residential Appendix RA3.4 and the specifications of
Reference Joint Appendix JA6.
B. When airflow and fan watt draw is shown as required by TABLE 151-B TABLE 151-C or
TABLE 151-D, dDucted split system central air conditioners and ducted split system heat pumps
shall:
i. Central forced air system fans shall simultaneously demonstrate, in every zonal control mode,
an airflow equal to or greater than 350 CFM/ton of nominal cooling capacity and a fan watt draw
equal to or less than 0.58 W/CFM as specified in Reference Residential Appendix RA3; and
ii. Have a hole for the placement of a static pressure probe (HSPP) or a permanently installed
static pressure probe (PSPP) in the supply plenum downstream of the air conditioning evaporator coil.
The size, location, and labeling shall meet the requirements specified in Reference Residential
Appendix RA3.3.
Section 152(b)1.G (change current section G to H and current section H to I)
G. 11. Ducted split system central air conditioners and ducted split system heat pumps shall
meet either of the following.

Page 47
2013 California Building Energy Efficiency Standards October 2011
A. Simultaneously demonstrate, in every zonal control mode, an airflow equal to or
greater than 350 CFM/ton of nominal cooling capacity and a fan watt draw equal to or less
than 0.58 W/CFM as specified in Reference Residential Appendix RA3
B. The return duct(s) and return grill shall be sized in accordance with Table 150-D or
Table 150-E
5.3 Part II – Duct Sealing
Section 150
(m) Air-distribution System Ducts, Plenums, and Fans.
1. CMC compliance. All air-distribution system ducts and plenums, including, but not limited to,
mechanical closets and air-handler boxes, shall be installed, sealed and insulated to meet the
requirements of the CMC Sections 601, 602, 603, 604, 605 and Standard 6-5, incorporated herein
by reference. Portions of supply-air and return-air ducts and plenums shall either be insulated to a
minimum installed level of R-4.2 (or any higher level required by CMC Section 605) or be
enclosed entirely in conditioned space. Connections of metal ducts and the inner core of flexible
ducts shall be mechanically fastened. Openings shall be sealed with mastic, tape, or other duct-
closure system that meets the applicable requirements of UL 181, UL 181A or UL 181B or
aerosol sealant that meets the requirements of UL 723. If mastic or tape is used to seal openings
greater than 1/4 inch, the combination of mastic and either mesh or tape shall be used.
Building cavities, support platforms for air handlers, and plenums defined or constructed with
materials other than sealed sheet metal, duct board or flexible duct shall not be used for
conveying conditioned air. Building cavities and support platforms may contain ducts. Ducts
installed in cavities and support platforms shall not be compressed to cause reductions in the
cross-sectional area of the ducts.
Duct systems shall be sealed, as confirmed through field verification and diagnostic testing, in
accordance with procedures specified in the Reference Appendices.
Note: Requirements for duct sealing do not apply to buildings with space conditioning systems
that have no ducts.
Section 151
10. Space conditioning ducts. All ducts shall either be in conditioned space or be insulated to a
minimum installed level as specified by TABLE 151-B, TABLE 151-C or TABLE 151-D and
meet the minimum mandatory requirements of Section 150(m).
When duct sealing is shown as required by TABLE 151-B, TABLE 151-C or TABLE 151-D.
dDuct systems shall be sealed, as confirmed through field verification and diagnostic testing, in
accordance with procedures specified in the Reference Residential Appendix RA3.
NOTE: Requirements for duct sealing and duct insulation in Tables 151-B, 151-C, and 151-D do
not apply to buildings with space conditioning systems that have no ducts.

Page 48
2013 California Building Energy Efficiency Standards October 2011
NOTE: Requirements for duct sealing and duct insulation in Tables 151-B, 151-C, and 151-D do
not apply to buildings with space conditioning systems that have no ducts.
Section 152
D. When more than 40 feet of new or replacement space-conditioning ducts are installed in
unconditioned space, the new ducts shall meet the requirements of Section 150(m) and the duct
insulation requirements of Package D Section 151(f)10. If ducts are installed in climate zones 2,
9, 10, 11, 12, 13, 14, 15, or 16, tThe duct system shall be sealed, as confirmed through field
verification and diagnostic testing in accordance with procedures for duct sealing of existing duct
systems as specified in the Reference Residential Appendix RA3, to meet one of the following
requirements:
i. If the new ducts form an entirely new duct system directly connected to the air handler, the
measured duct leakage shall be less than 6 percent of fan flow and meet the airflow requirements
of Reference Residential Appendix RA3; or
ii. If the new ducts are an extension of an existing duct system, the combined new and existing
duct system shall meet one of the following requirements:
a. The measured duct leakage shall be less than 15 percent of system fan flow; or
b. The measured duct leakage to outside shall be less than 10 percent of system fan flow; or
c. The duct leakage shall be reduced by more than 60 percent relative to the leakage prior to the
installation of the new ducts and a visual inspection, including a smoke test, shall demonstrate
that all accessible leaks have been sealed; or
d. If it is not possible to meet the duct sealing requirements of subsection a, b, or c, all accessible
leaks shall be sealed and verified through a visual inspection and a smoke test by a certified
HERS rater.
EXCEPTION to Section 152(b)1Dii: Existing duct systems that are extended, which are
constructed, insulated or sealed with asbestos.
E. In climate zones 2, 9, 10, 11, 12, 13, 14, 15, and 16, wWhen a space-conditioning system is
altered by the installation or replacement of space-conditioning equipment (including
replacement of the air handler, outdoor condensing unit of a split system air conditioner or heat
pump, cooling or heating coil, or the furnace heat exchanger) the duct system that is connected to
the new or replacement space-conditioning equipment shall be sealed, as confirmed through field
verification and diagnostic testing in accordance with procedures for duct sealing of existing duct
systems as specified in the Reference Residential Appendix RA3, to one of the following
requirements.
i. The measured duct leakage shall be less than 15 percent of system fan flow; or
ii. The measured duct leakage to outside shall be less than 10 percent of system fan flow; or
iii. The measured duct leakage shall be reduced by more than 60 percent relative to the measured
leakage prior to the installation or replacement of the space conditioning equipment and a visual
inspection, including a smoke test, shall demonstrate that all accessible leaks have been sealed; or
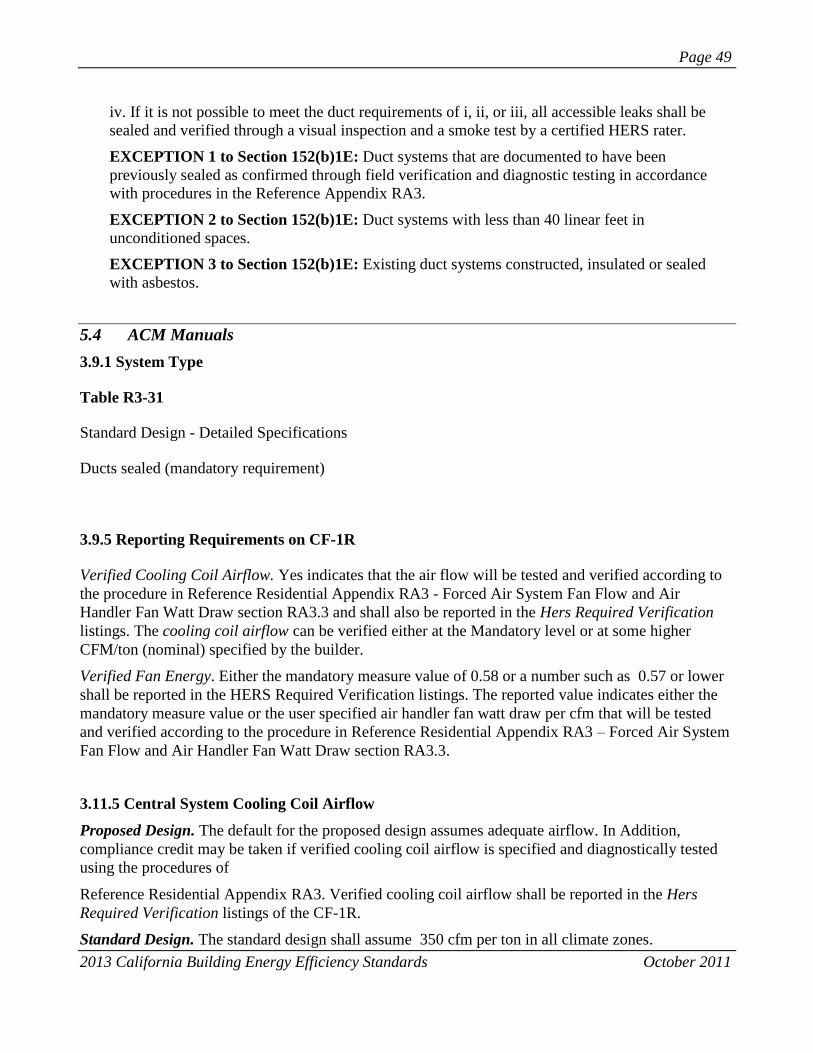
Page 49
2013 California Building Energy Efficiency Standards October 2011
iv. If it is not possible to meet the duct requirements of i, ii, or iii, all accessible leaks shall be
sealed and verified through a visual inspection and a smoke test by a certified HERS rater.
EXCEPTION 1 to Section 152(b)1E: Duct systems that are documented to have been
previously sealed as confirmed through field verification and diagnostic testing in accordance
with procedures in the Reference Appendix RA3.
EXCEPTION 2 to Section 152(b)1E: Duct systems with less than 40 linear feet in
unconditioned spaces.
EXCEPTION 3 to Section 152(b)1E: Existing duct systems constructed, insulated or sealed
with asbestos.
5.4 ACM Manuals
3.9.1 System Type
Table R3-31
Standard Design - Detailed Specifications
Ducts sealed (mandatory requirement)
3.9.5 Reporting Requirements on CF-1R
Verified Cooling Coil Airflow. Yes indicates that the air flow will be tested and verified according to
the procedure in Reference Residential Appendix RA3 - Forced Air System Fan Flow and Air
Handler Fan Watt Draw section RA3.3 and shall also be reported in the Hers Required Verification
listings. The cooling coil airflow can be verified either at the Mandatory level or at some higher
CFM/ton (nominal) specified by the builder.
Verified Fan Energy. Either the mandatory measure value of 0.58 or a number such as 0.57 or lower
shall be reported in the HERS Required Verification listings. The reported value indicates either the
mandatory measure value or the user specified air handler fan watt draw per cfm that will be tested
and verified according to the procedure in Reference Residential Appendix RA3 – Forced Air System
Fan Flow and Air Handler Fan Watt Draw section RA3.3.
3.11.5 Central System Cooling Coil Airflow
Proposed Design. The default for the proposed design assumes adequate airflow. In Addition,
compliance credit may be taken if verified cooling coil airflow is specified and diagnostically tested
using the procedures of
Reference Residential Appendix RA3. Verified cooling coil airflow shall be reported in the Hers
Required Verification listings of the CF-1R.
Standard Design. The standard design shall assume 350 cfm per ton in all climate zones.

Page 50
2013 California Building Energy Efficiency Standards October 2011
Cooling Coil Airflow CFM/ton The efficiency of an air conditioning system is affected by airflow
across the cooling (evaporator) coil. Cooling coil airflow is specified in cubic feet per minute per
nominal ton (cfm/ton) as specified by the manufacturer. Cooling airflow is the flow achieved under
normal air conditioning operation.
Table R3-35 – Airflow Criteria
Note: All airflows are for the fan set at the speed used for air conditioning.
Test and Condition Cooling airflow (Wet Coil)
Default Cooling Airflow 350 cfm/ton
Flow needed for a valid refrigerant charge test 300 cfm/ton (See Note 1)
Verified cooling coil airflow 350 + cfm/ton Mandatory or specified by
compliance software user
Note 1. In lieu of airflow measurements, the system can pass the temperature split test documented in
Reference Residential Appendix RA3.2.2.7.
3.11.7 Fan Energy
Proposed Design. The compliance software shall allow the user to specify whether or not the
proposed design will take credit for reduced fan watts. The credit for reduced fan watts shall be
reported in the Special Features Inspection Checklist on the CF-1R. The proposed design default shall
be 0.58 W/cfm. Lower numbers may be used when specified by the compliance software user.
Standard Design. The standard design shall be modeled with 0.58 W/cfm.
For systems with low fan watts and prescriptive cooling coil airflow or greater as verified using the
procedures of Reference Residential Appendix RA3, credit may be taken for reduced fan energy in
computer software calculations. This credit is applied if the actual installed fan watts/cfm are less than
to the standard design value of 0.58 W/cfm. The watt draw and airflow must be certified by the
installer and verified by a HERS rater using the procedure in Reference Residential Appendix RA3.
Fan watts and adequate airflow must be measured simultaneously. The air handler airflow measured
simultaneously must meet or exceed the prescriptive cooling coil airflow or greater criteria.
3.12.1 Air Distribution Ducts
Proposed Design. Compliance software shall be able to model the basic types of HVAC distribution
systems and locations listed in Table R3-30. As a default, for ducted systems HVAC ducts and the air
handler are located in the attic. Proposed HVAC systems with a duct layout and design on the plans
may locate the ducts in the crawlspace or a basement if the layout and design specify that all of the
supply registers are located in the floor or within two feet of the floor, and show the appropriate
locations for the ducts. Otherwise, the default location is the attic as shown in Table R3-12. If all
supply registers are at the floor, but the building has both a crawlspace and a basement, the duct

Page 51
2013 California Building Energy Efficiency Standards October 2011
location may be taken as a floor area weighted average of the duct efficiencies of a crawlspace and a
basement. If the modeled duct location is not in the attic, the compliance software shall specify that
all supply registers for the building are located in the floor or within two feet of the floor, and this
shall be noted in the Special Features Inspection Checklist of the CF-1R.
Proposed HVAC systems with a complete duct design, including the duct layout and design on the
plans, may allocate duct surface area in more detail in the compliance software model but the
distribution of duct surface areas by location shall appear on the Hers Required Verification list of the
CF-1R. The HERS rater shall verify the existence of duct design and layout and the general
consistency of the actual HVAC distribution system with the design.
The compliance software shall allow users to specify if they will be using diagnostic testing of HVAC
distribution efficiency of a fully-ducted system during the construction of the building to confirm the
modeling of improved HVAC distribution efficiency measures. The default shall be that no diagnostic
testing will be done. Duct efficiency credits may not be taken and diagnostic testing may not be done
on any HVAC system that uses nonducted building cavities such as plenums or platform returns, to
convey conditioned air unless they are defined or constructed with sealed sheet metal or duct board
Building cavities, including support platforms, may contain ducts. If the user does not select
diagnostic testing, the compliance software shall require users to input at least two (2) basic
parameters to determine HVAC distribution efficiency: the total conditioned floor area of the building
as specified above and the R-value of the duct insulation which may be defaulted to the minimum
duct insulation requirements. Additional data may be required to determine seasonal distribution
system efficiency. The default input parameters are presented in Chapter 3. If the user specifies
diagnostic testing to be performed during construction, the compliance software shall prompt the user
to enter the data described Section 3.12.7, Seasonal Distribution System Efficiency and shall report all
required measurements and the features used to achieve higher HVAC distribution efficiencies in the
Hers Required Verification listings on the CF-1R. When the user chooses diagnostic testing, the
diagnostic testing shall be performed as described in Reference Residential Appendix RA3. The duct
leakage factors in Table R3-39 shall be used when Low Leakage Air Handlers or Low Leakage Ducts
in Conditioned Space are specified.
Standard Design. The standard heating and cooling system for central systems is modeled with non-
designed air distribution ducts located in an attic space, with the duct leakage factor for sealed and
tested new duct systems (see Table R3-39) and a radiant barrier in climate zones where required by
Package D. The standard design duct insulation is determined by the Package D specifications for the
applicable climate zone. The standard design building is assumed to have the same number of stories
as the proposed design for purposes of determining the duct efficiency. HVAC distribution system
efficiencies shall be calculated using the algorithms and equations in Chapter of this manual for both
the proposed design and the standard design. The standard design calculation shall use the default
values of that procedure. For non-central HVAC systems, the standard design shall have no ducts.
3.12.2 Building Information and Defaults
The compliance software shall use values for the parameters in Table R3-36 to calculate duct
efficiencies. Standard design values and proposed design defaults are also shown. Proposed designs
may claim credit for other values using the procedures in the following sections.

Page 52
2013 California Building Energy Efficiency Standards October 2011
Table R3-36 – Duct Efficiency Input Parameters and Defaults
Parameter Standard Design Value Proposed Design Default
1. Duct Location Ducts in the attic Ducts in the attic
2. Insulation level of ducts Package D requirement Mandatory Minimum Requirement
3. The surface area of ducts 27% of conditioned floor area (CFA) for supply duct surface area; 5%
CFA for return duct surface area in single story dwellings and 10%
CFA for return duct surface area in dwellings with two or more stories.
4. The leakage level Sealed and tested. Sealed and tested
5. Attic radiant barrier. Yes in climate zones where required by Package D, otherwise No
No radiant barrier
3.16.4 Duct Sealing in Additions and Alterations
§152establishes mandatory requirements for duct sealing in additions, establishes mandatory
requirements for duct sealing for installation of new and replacement duct systems and duct sealing
for installation of new and replacement space conditioning equipment. Table R3-39 provides Duct
Leakage Factors for modeling of sealed and tested new duct systems, sealed and tested existing duct
systems, and untested duct systems built prior to and after June 1, 2001. Reference Appendix RA3
provides procedures for duct leakage testing and RACM Table RA3.1.2 provides duct leakage tests
and leakage criteria for sealed and tested new duct systems and sealed and tested existing duct
systems. These requirements, factors, procedures, tests and criteria apply to performance compliance
for duct sealing in Additions and Alterations.
Condition Proposed Design Standard Design
Additions Served by
Entirely New Duct Systems The proposed design shall be
sealed and tested new duct systems
.
The standard design shall be
sealed and tested new duct
systems.
Additions Served by
Extensions of Existing
Duct Systems

Page 53
2013 California Building Energy Efficiency Standards October 2011
The proposed design shall be either 1) sealed and tested new duct
systems, if the total combined existing plus new duct system meets the
leakage requirements for tested and sealed new duct systems; 2) sealed
and tested existing duct systems, if the total combined existing plus new
duct system meets the leakage requirements for tested and sealed
existing duct systems; 3) untested duct systems in homes built after
June 1, 2001; or 4) untested duct systems in homes built prior to June 1,
2001.
The standard design shall be
sealed and tested existing duct
systems.
Alterations with Mandatory
Duct Sealing Requirements when Entirely
New Duct Systems are Installed
The proposed design shall be either 1) sealed and tested new duct
systems; 2) untested duct systems built after June 1, 2001; or 3)
untested duct systems in homes built prior to June 1, 2001.
The Mandatory Alteration
Requirement is sealed and tested
new duct systems. Determine
the standard design by the standard design rules in
Section 3.16.4.
Alterations with Manadory
Duct Sealing Requirements when Existing
Duct Systems are extended or replaced
or when new or replacement air
conditioners are installed
The proposed design shall be either 1) sealed and tested new duct
systems, if the total combined existing plus new duct system meets the
leakage requirements for tested and sealed new duct systems; 2) sealed
and tested existing duct systems, if the total combined existing plus new
duct system meets the leakage requirements for tested and sealed
existing duct systems; 3) untested duct systems built after June 1, 2001;
or 3) untested duct systems in homes built prior to June 1, 2001.
Prescriptive Alteration
Requirement is sealed and tested
existing duct systems. Determine
the standard design by the
standard design rules in Section
3.16.4.

Page 54
2013 California Building Energy Efficiency Standards October 2011

Page 55
2013 California Building Energy Efficiency Standards October 2011
6. Bibliography and Other Research List and describe each of the research studies, reports, and personal communications that provide
background for this research. Identify all resources that have been pursued to further this measure.
Identify all “experts” that were involved in further developing the change, all research and analysis
reports and documents that were reviewed, and all industry standards that were consulted (e.g.,
ASTM, UL, ASHRAE test procedures, etc.). Include research that is underway that addresses the
measure/change. Indicate if data or information will be produced in time to be used in this update of
the Standards.
Proctor, John, Rick Chitwood, Bruce A. Wilcox. (Proctor Engineering Group, Ltd., Chitwood Energy
Management, Bruce A. Wilcox). 2011. Efficiency Characteristics and Opportunities of New
California Homes. California Energy Commission. Publication number: CEC-XXX-2010-XXX

Page 56
2013 California Building Energy Efficiency Standards October 2011
7. Appendices
7.1 Residential Construction Forecast Details The Residential construction forecast dataset is data that is published by the California Energy
Commission’s (CEC) demand forecast office. This demand forecast office is charged with calculating
the required electricity and natural gas supply centers that need to be built in order to meet the new
construction utility loads. Data is sourced from the California Department of Finance and California
Construction Industry Research Board (CIRB) building permits. The Department of Finance uses
census years as independent data and interpolates the intermediate years using CIRB permits.
CASE stakeholders expressed concern that the Residential forecast was inaccurate compared with
other available data (in 2010 CEC forecast estimate is 97,610 new units for single family and the
CIRB estimate is 25,526 new units). In response to this discrepancy, HMG revised the CEC
construction forecast estimates. The CIRB data projects an upward trend in construction activity for
2010-2011 and again from 2011-2012. HMG used the improvement from 2011-2012 and extrapolated
the trend out to 2014. The improvement from 2011-2012 is projected to be 37%. Instead of using the
percent improvement year on year to generate the 2014 estimate, HMG used the conservative value of
the total units projected to be built in 2011-2012 and added this total to each subsequent year. This is
the more conservative estimate and is appropriate for the statewide savings estimates. Based on this
trend, the new construction activity is on pace to regain all ground lost by the recession by 2021. The
multi-family construction forecasts are consistent between CEC and CIRB and no changes were made
to the multi-family data.
Residential New Construction Estimate (2014)
Single Family
Multi-family
Low Rise
Multi-family
High Rise
CZ 1 378 94 -
CZ 2 1,175 684 140
CZ 3 1,224 863 1,408
CZ 4 2,688 616 1,583
CZ 5 522 269 158
CZ 6 1,188 1,252 1,593
CZ 7 2,158 1,912 1,029
CZ 8 1,966 1,629 2,249
CZ 9 2,269 1,986 2,633
CZ 10 8,848 2,645 1,029
CZ 11 3,228 820 81

Page 57
2013 California Building Energy Efficiency Standards October 2011
CZ 12 9,777 2,165 1,701
CZ 13 6,917 1,755 239
CZ 14 1,639 726 -
CZ 15 1,925 748 -
CZ 16 1,500 583 -
Total 47,400 18,748 13,845
Figure 18. Residential construction forecast for 2014, in total dwelling units
The demand generation office publishes this dataset and categorizes the data by demand forecast
climate zones (FCZ). These 16 climate zones are organized by the generation facility locations
throughout California, and differ from the Title 24 building climate zones (BCZ). HMG has
reorganized the demand forecast office data using 2000 Census data (population weighted by zip
code) and mapped FCZ and BCZ to a given zip code. The construction forecast data is provided to
CASE authors in BCZ in order to calculate Title 24 statewide energy savings impacts. Though the
individual climate zone categories differ between the demand forecast published by the CEC and the
construction forecast, the total construction estimates are consistent; in other words, HMG has not
added to or subtracted from total construction area.
The demand forecast office provides two (2) independent data sets: total construction and decay rate.
Total construction is the sum of all existing dwelling units in a given category (Single family, Multi-
family low rise and Multi-family high rise). Decay rate is the number of units that were assumed to be
retrofitted, renovated or demolished. The difference in total construction between consecutive years
(including each year’s decay rate) approximates the new construction estimate for a given year.
In order to further specify the construction forecast for the purpose of statewide energy savings
calculation for Title 24 compliance, HMG has segmented all multi-family buildings into low rise and
high rise space (where high rise is defined as buildings 4 stories and higher). This calculation is based
on data collected by HMG through program implementation over the past 10 years. Though this
sample is relatively small (711), it is the best available source of data to calculate the relative
population of high rise and low rise units in a given FCZ.
Most years show close alignment between CIRB and CEC total construction estimates, however the
CEC demand forecast models are a long-term projection of utility demand. The main purpose of the
CEC demand forecast is to estimate electricity and natural gas needs in 2022, and this dataset is much
less concerned about the inaccuracy at 12 or 24 month timeframe.
It is appropriate to use the CEC demand forecast construction data as an estimate of future years
construction (over the life of the measure), however to estimate next year’s construction, CIRB is a
more reliable data set.
7.1.1 Citation
“Res Construction Forecast by BCZ v4”; Developed by Heschong Mahone Group with data sourced
September, 2010 from Sharp, Gary at the California Energy Commission (CEC)

Page 58
2013 California Building Energy Efficiency Standards October 2011
7.1.2 Environmental Impact Assumptions
The environment impacts arise from using larger sizes of flexible HVAC system ducts for the return
air system and larger return filter grill. Larger ducts and filter grill increase usage of three materials:
steel, plastic and fiberglass insulation. Steel is used in the wire helix within the flex duct to provide
rigidity and is also used in the filter grill. Plastic is used in the outside vapor barrier around the flex
duct. Fiberglass insulation is used to insulate the ducts and to create the filter used in the filter grill.
The incremental amounts of materials for a return air system designed to ACCA guidelines were
compared to the materials for a return air system sized according to the proposed return system table.
For instance, a 4-ton system designed to ACCA guidelines uses a 20” return ducts with a 40” x 20”
return grill. A 4-ton system using the proposed return system table uses 2-18” ducts and 2 – 30” x
20” return grills. The amounts of materials by weight in each system were determined and the
incremental weight of the proposed system was calculated.
The incremental weight of each of the three materials is listed in the environmental impact table “f” in
Section 2.