Resetting the regional economic development strategy David Powell, CEO of PTP.
61
Resetting the regional economic development strategy David Powell, CEO of PTP
-
Upload
rudolf-page -
Category
Documents
-
view
214 -
download
0
Transcript of Resetting the regional economic development strategy David Powell, CEO of PTP.

Resetting the regional economic development
strategyDavid Powell, CEO of PTP

How is the economy?
National- Terrible (D & F)
Local- Pretty Good (C)
Business- Even Better (B-C)

U.S. Chamber Small Business Survey
84%
8%8%
54%
27%19%
14%
25%
61%
Headed in Right DirectionOff on Wrong DirectionNot Sure
U.S. Economy
Local Economy
Your Business
Source: U.S. Chamber Small Business Survey, July 2011

Another year of muddling through? Global Weakness
Threatens to undermine US exports Wide variations from continent to continent Europe likely in a recession; China’s growth is slowing
Foreclosure Problem Housing will continue to languish Foreclosures will hold down prices, sales & new construction
Lackluster Job Market Jobs will be added but at a rate too slow to make a dent Only marginal improvement in personal income expected Problem for consumers (especially in gas prices continue to rise!)
Government Belt-Tightening Budget cutting will keep subtracting from growth Congress’s acrimony & propensity for last minute deals will continue
to weigh on business & consumer confidence
4

Are we experiencing a reset?

Unprecedented lack of confidence in Washington
Deloitte survey found >80% of business executives indicated “uncertainty” and “over-regulation” as material reasons for not adding jobs in the U.S.

United States in the Global Economy

Impact of the “Great Recession”Difference in Real GDP/Person 2007-2012
-5% -3% -3% -1%
4%10%
14%
34%
51%
-20%
-10%
0%
10%
20%
30%
40%
50%
60%
UnitedKingdom
UnitedStates
France Japan Germany Russia Brazil India China
Source: The Economist, The World in 2012

GDP Growth 2011
1.7%
-0.6%
9.2%
2.3%1.4% 1.8%
7.6%
3.0%4.0%
-5%
-3%
-1%
1%
3%
5%
7%
9%
US Japan China Canada Euro Area Austrialia India Brazil Russia
Source: Economist Jan 21, 2011
USA Growth in 2012 Projected-
1.1% to 2.0%

Budget Balance as % of GDP 2011
-8.7% -8.3%
-1.8%
-4.0% -4.1%-2.6%
-5.4%
-2.7%-0.8%
-15%
-13%
-11%
-9%
-7%
-5%
-3%
-1%
1%
3%
5%
US Japan China Canada Euro Area Austrialia India Brazil Russia
Source: Economist Jan 21, 2011
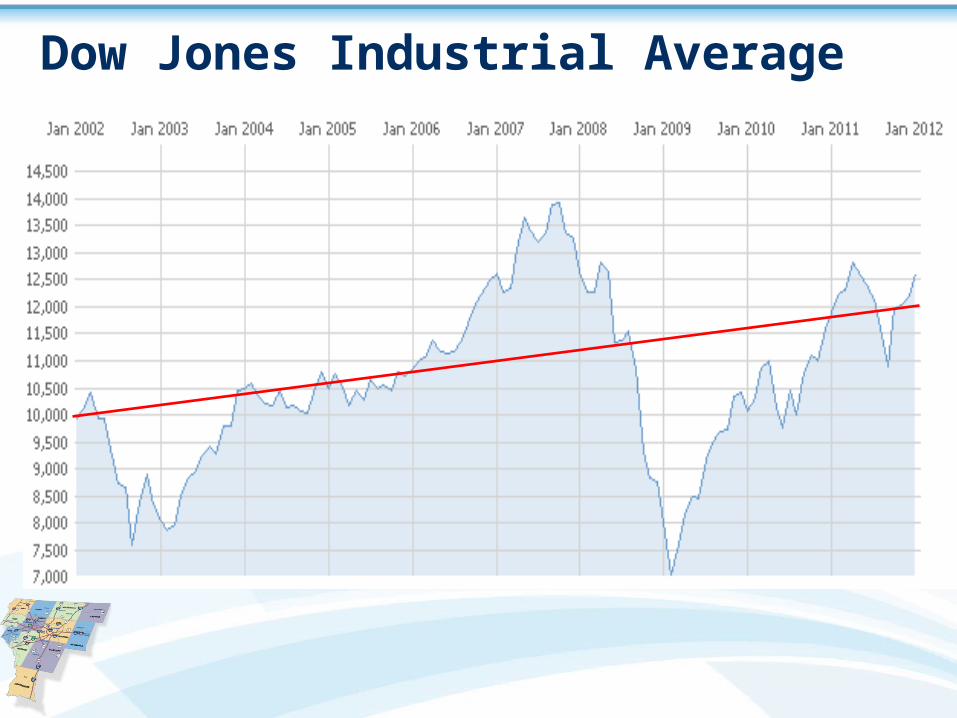
Dow Jones Industrial Average

USA Total Nonfarm Payroll
0
20,000
40,000
60,000
80,000
100,000
120,000
140,000
1961 1064 1968 1972 1976 1980 1984 1988 1992 1996 2000 2004 2008
Source: BLS, Jan 2012
In thousands

Employment Monthly Net Change Jan 2000- 2011
-800
-600
-400
-200
0
200
400
600
2000 2006 2011
Jobs
Source: BLS Jan 2012
125,000 Jobs/Mo. To keep pace with population growth in the USIn thousands
The best year in the last decade averaged
208,000 additional jobs per month…12 years

Unemployment SummaryDecember 2011
13.8%
8.7%7.7%
4.1%
0%
2%
4%
6%
8%
10%
12%
14%
Less thanHS
HS Grad SomeCollege
BA Plus
National unemployment rate in December, 8.5%, down from 9.4% in December 2010
For Men over 20, 8.0%, down from 9.4%
For Women over 20, 7.9%, down from 8.1%
For 16-19 year olds, 23.1%, down from 25.2%
For Whites (7.5%), Blacks (15.8%), Hispanics (11.0%)
Source: BLS Jan 2012
Unemployment Rate By Education

Population Growth
Last decade US population grew at the lowest rate
since the great depression

Population Growth

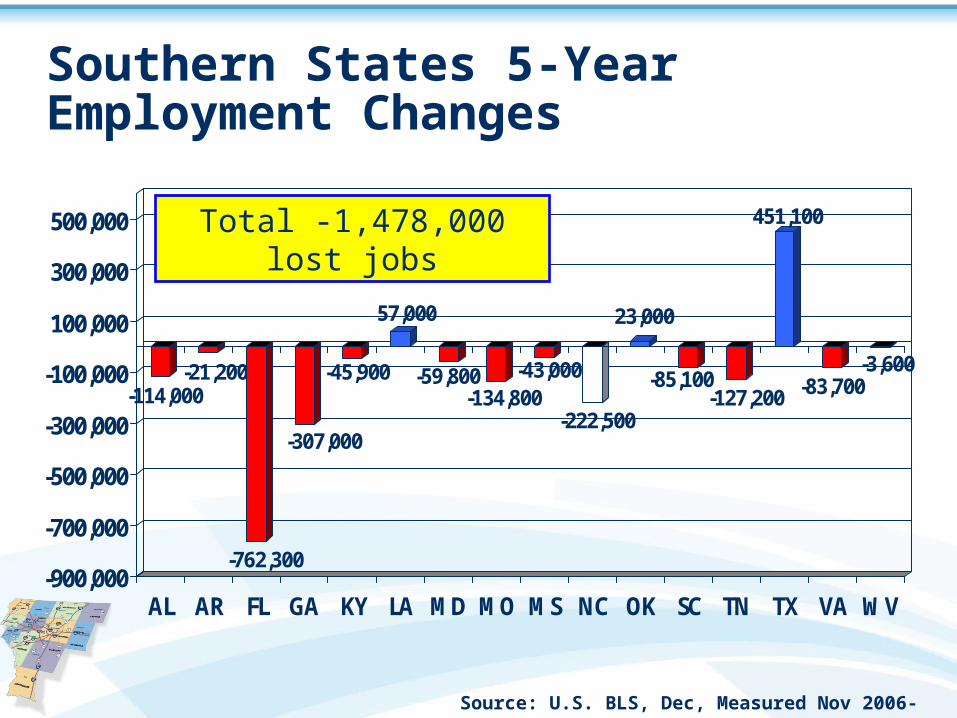
Southern States 5-Year Employment Changes
-114,000-21,200
-762,300
-307,000
-45,900
57,000
-59,800-134,800
-43,000
-222,500
23,000
-85,100-127,200
451,100
-83,700-3,600
-900,000
-700,000
-500,000
-300,000
-100,000
100,000
300,000
500,000
AL AR FL GA KY LA MD MO MS NC OK SC TN TX VA WV
Source: U.S. BLS, Dec, Measured Nov 2006- Nov 2011
Total -1,478,000 lost jobs

Southern States 5-Year Employment Changes
-5.7%
-1.8%
-9.5%
-7.5%
-2.5%
3.0%
-2.3%
-4.9%-3.8%
-5.4%
1.5%
-4.4%-4.6%
4.4%
-2.2%-0.5%
-12%
-10%
-8%
-6%
-4%
-2%
0%
2%
4%
6%
AL AR FL GA KY LA MD MO MS NC OK SC TN TX VA WV
Source: U.S. BLS, Dec, Measured Nov 2006- Nov 2011

Southern States 1-Year Employment Changes
0.2%0.6%
1.4%
-0.5%
1.2%
2.6%
0.7%
0.1%
1.0%
0.4%
2.8%
1.8%
1.2%
2.2%
0.5%
0.8%
-2%
-1%
0%
1%
2%
3%
AL AR FL GA KY LA MD MO MS NC OK SC TN TX VA WV
Source: U.S. BLS, Dec, Measured Nov 2010- Nov 2011

Southern States 1-Year Employment Changes
3,000 7,400
98,100
-20,300
20,600
46,700
18,3001,400
10,500 19,600
43,00032,700 32,400
226,000
16,900 6,000
-50,000
0
50,000
100,000
150,000
200,000
250,000
AL AR FL GA KY LA MD MO MS NC OK SC TN TX VA WV
Source: U.S. BLS, Dec, Measured Nov 2006- Nov 2011
Total +562,300 gained jobs
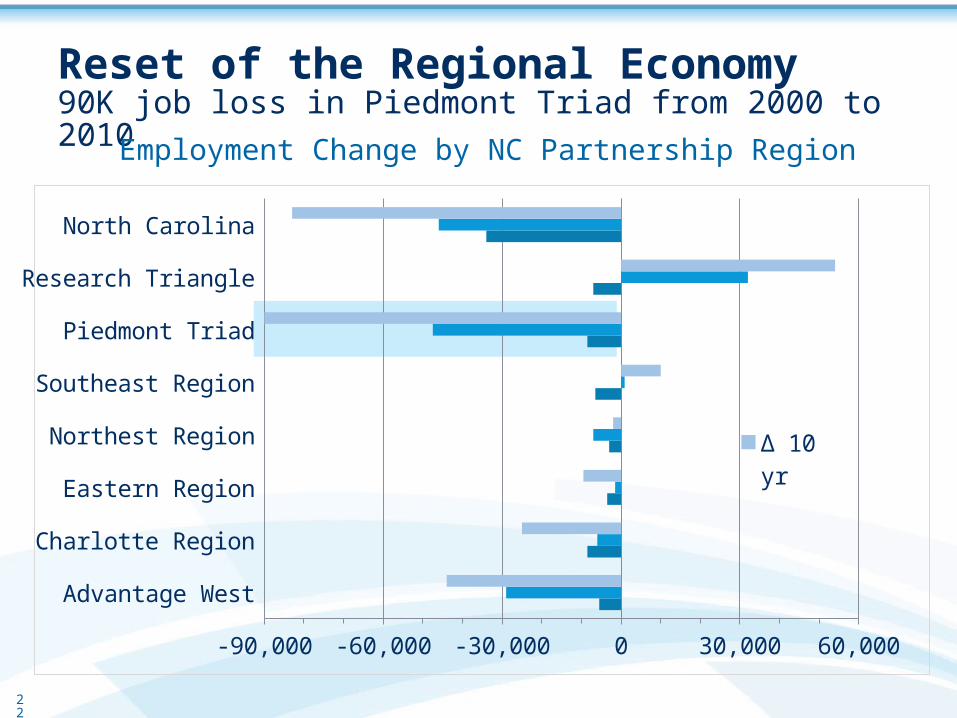
Reset of the Regional Economy90K job loss in Piedmont Triad from 2000 to 2010
22
Employment Change by NC Partnership Region
Advantage West
Charlotte Region
Eastern Region
Northest Region
Southeast Region
Piedmont Triad
Research Triangle
North Carolina
-90,000 -60,000 -30,000 0 30,000 60,000
∆ 10 yr∆ 5 yr∆ 1 yr

Percentage Unemployment By Year By County1990- November 2011
0%
2%
4%
6%
8%
10%
12%
14%
Alamance Forsyth Guilford Davidson Randolph
Source: NCESC
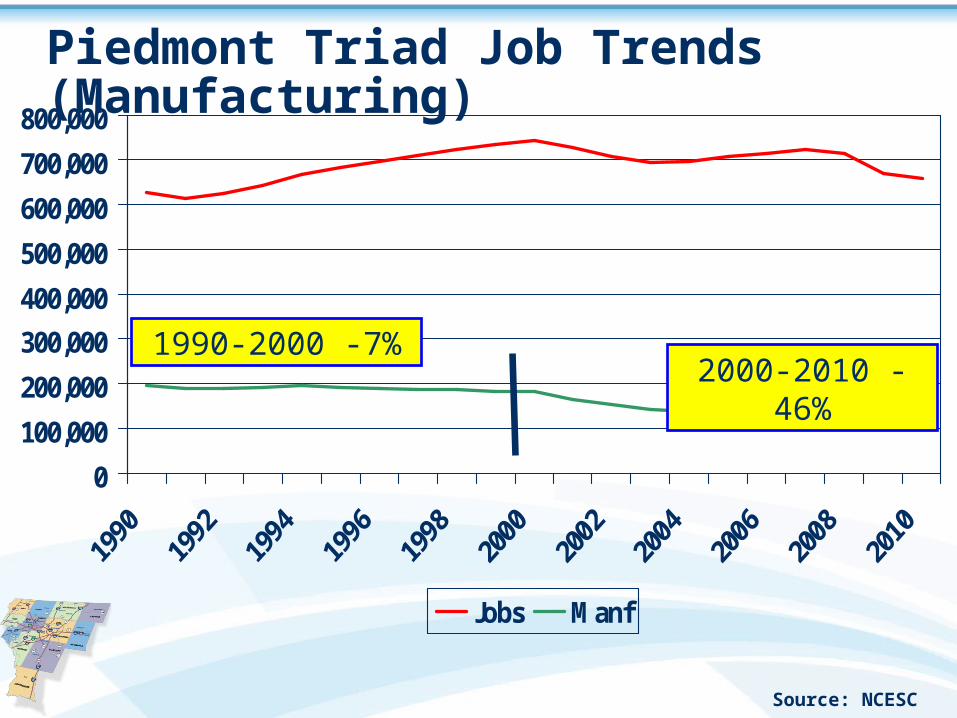
Piedmont Triad Job Trends (Manufacturing)
0
100,000
200,000
300,000400,000
500,000
600,000
700,000
800,000
Jobs Manf
1990-2000 -7%2000-2010 -46%
Source: NCESC

Piedmont Triad Manufacturing Job Shifts 1990-2010
-38,222
-19,625 -19,084
-3,550 -2,737
431 1,651 207
-50,000
-40,000
-30,000
-20,000
-10,000
0
10,000
Textiles
Apparel
Furniture
Comp/Elect
Elec/Appl
Food
Plast/Rub
Transport
Source: NCESC

North Carolina Metro Job Growth Nov 2010 to Nov 2011
0.2% 0.2%
-0.2%
0.5%
2.4%
0.2%
2.1%
0.7%
-1.5% -1.3%
1.9%
-1.0%-1.5%
2.7%
-4%
-3%
-2%
-1%
0%
1%
2%
3%
4%
Ashville
Burlington
Charlotte
Durham
Fayettenille
Goldsboro
Greensboro
Greenville
Hickory
Jacksonville
Raleigh
Rocky Mount
Wilm
ington
Winston Salem
Source: Garner Economics LLC Jan 2012

% Employment Growth Last 12 MonthsNov 2010-Nov 2011
1.1%
0.4%
1.1%
0.3%
0.9%
2.2%
1.5%
0%
1%
1%
2%
2%
3%
Advantage West Charlotte Eastern Northeast Southeast Piedmont Triad ResearchTriangle
Every PTP County More People Employed in Nov
2011 than in 2010
Source: NCESC

Annual Population Growth
0.0%
0.5%
1.0%
1.5%
2.0%
2.5%
3.0%
2005-2006 2006-2007 2007-2008 2008-2009 2009-2010 2010-2011
USA NC
Source: Brookings Jan 20, 2012

Annual Population % Change Rates2001-2010
0.0%
0.5%
1.0%
1.5%
2.0%
2.5%
3.0%
2001 2002 2003 2004 2005 2006 2007 2008 2009 2010
Greensboro Winston-Salem National
Source: U.S. Bureau Intercensal Population Estimates, SYNEVA Economics, Nov 2011

Solutions

Four Interconnected Processes
EconomicDevelopment
Market Readiness
Organizational Context
Workforce Pipeline
Business Environment
Factors
• Reciprocating System
• Non-Economic Factors

Resetting the Piedmont Triad Partnership
Key Issues
Economic Development
Market Readiness
Organizational Context
Workforce Pipeline
Business Environme
nt
• CEO Engagement
• Urban Collaboration
• The “PTP Region”

Collaborative Regional Model
High Point Partners
Winston Salem Alliance
PiedmontTriad Partnership
GreensboroPartnership
Shared StrategyLeveraged Resources
Joint Fundraising

Piedmont Triad Region(as determined by the State of NC)

Piedmont TriadEconomic Developer’sCouncil (PTEDC)
Manages marketing, working with our 13 local economic development organizations
MARKETING LEADERSHIP
Piedmont Triad Partnership
Promotes the region and its assets through marketing and outreach to potential relocation candidates
CEO leadership group made up of top regional business investors
Contributes expertise, funding and influence to catalytic projects in key sectors of opportunity
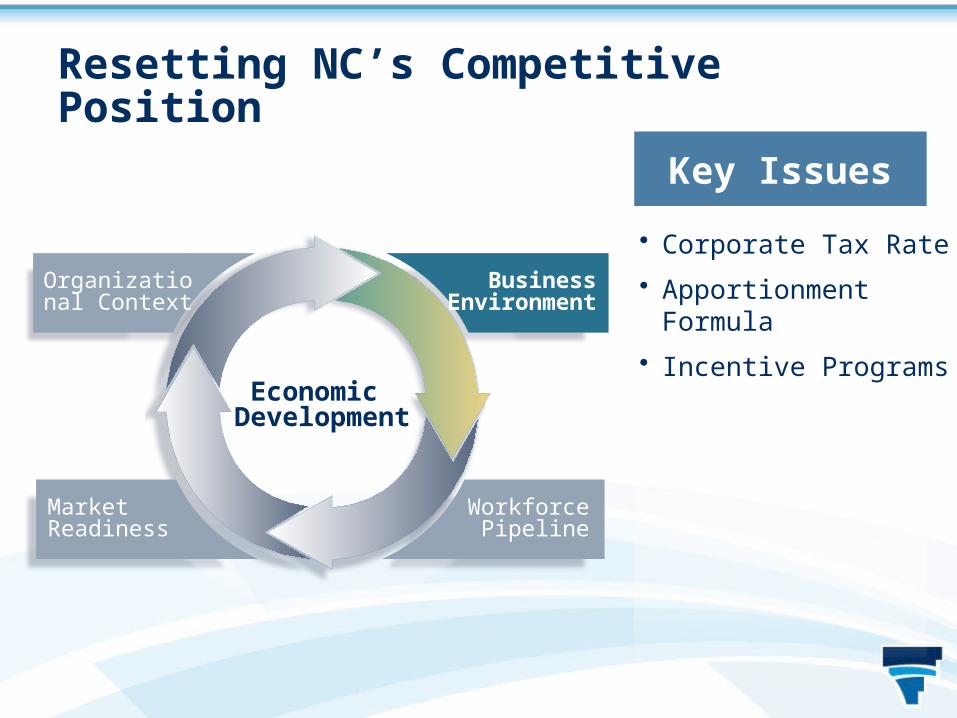
Resetting NC’s Competitive Position
Key Issues
Economic Development
Market Readiness
Organizational Context
Workforce Pipeline
Business Environme
nt
• Corporate Tax Rate
• Apportionment Formula
• Incentive Programs
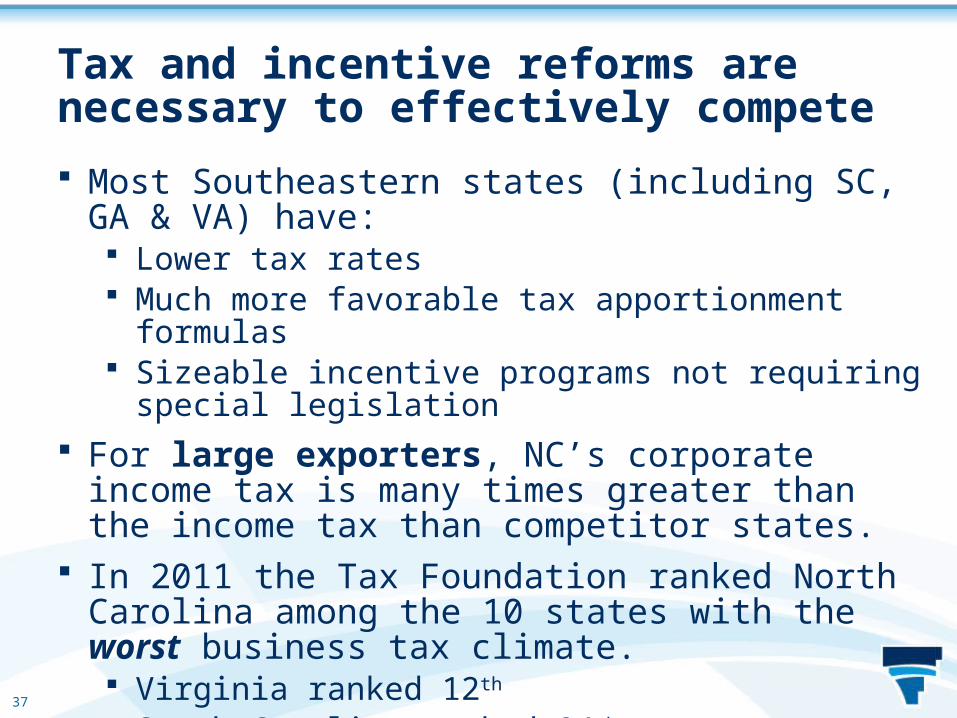
Tax and incentive reforms are necessary to effectively compete
Most Southeastern states (including SC, GA & VA) have: Lower tax rates Much more favorable tax apportionment formulas Sizeable incentive programs not requiring special legislation
For large exporters, NC’s corporate income tax is many times greater than the income tax than competitor states.
In 2011 the Tax Foundation ranked North Carolina among the 10 states with the worst business tax climate. Virginia ranked 12th
South Carolina ranked 24th
37

U.S. Exports 2000-2011
$-
$20,000
$40,000
$60,000
$80,000
$100,000
$120,000
$140,000
$160,000
$180,000
$200,000
2000Feb
2000Sep
2001Apr
2001Nov
2002Jun
2003Jan
2003Aug
2004Mar
2004Oct
2005May
2005Dec
2006Jul
2007Feb
2007Sep
2008Apr
2008Nov
2009Jun
2010Jan
2010Aug
2011Mar
2011Oct
42% Increase since 2009
Source: BEA Jan 2012

NC Exports as a % of GMP- 2010
5.7% 5.6%4.6%
7.5%
1.5%2.6%
12.0%
8.1%
10.7%
3.4%
13.5%
8.1% 7.5%
0%
2%
4%
6%
8%
10%
12%
14%
Ashville
Burlington
Charlotte
Durham
Fayetteville
Goldsboro
Greensboro
Greenville
Hickory
Raleigh
Rocky Mount
Wilm
ington
Winston Salem
Source: US Metro Economies. HIS Insight, Jan 2012
PTP 2005 to 2010
Greensboro/HP- 10.5% to 12.0%
Winston-Salem- 5.9% to 7.5%
Burlington- 2.5% to 5.6%

Competitor states have discretionary programs for large scale economic development projects
Adding to their advantage, our competitor states have established discretionary grant programs allowing them to make large upfront cash grants. Based on the project’s projected rate of return Without the necessity and delay of special legislation
NC has in place a mechanism for making such grants, the Site Infrastructure Development Fund (SIDF). Legislature has not appropriated any funds since it was
created to induce Merck to locate a vaccine facility in Durham County in 2003.
40

More competitive recruitment program needed for large scale economic development projects
To eliminate the disadvantages inherent in NC’s current business recruitment tools:
1. Offer upfront cash grants where individual grant decisions are made without the necessity of special legislation
2. Reduce the corporate income tax rate to the median rate in the Southeast region
3. Adopt a single sales factor corporate income tax apportionment formula
Remember: Our closest competitors have done all of these things and continue to offer tax credits and other incentives for attracting jobs and investment.
41

Resetting the Triad’s Educational Priorities
Key Issues
Economic Development
Market Readiness
Organizational Context
Workforce Pipeline
Business Environme
nt
• Skills Gap
• STEM Pipeline
• Aviation Workforce
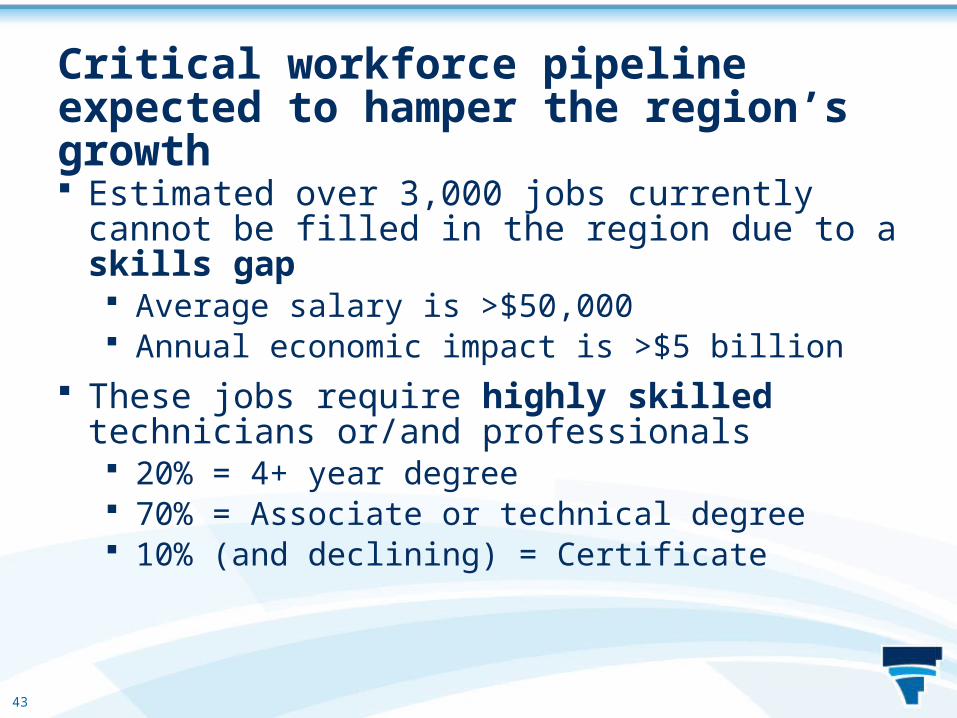
Critical workforce pipeline expected to hamper the region’s growth
Estimated over 3,000 jobs currently cannot be filled in the region due to a skills gap Average salary is >$50,000 Annual economic impact is >$5 billion
These jobs require highly skilled technicians or/and professionals 20% = 4+ year degree 70% = Associate or technical degree 10% (and declining) = Certificate
43

Educational Attainment-% BA plus
24%
26%32%
23%
27%24% 24%
30%27%
41%
31%
0%
10%
20%
30%
40%
50%
Piedmont Triad
Birmingham
Charlotte
Greenville/Spartan
Jacksonville
Louisville
Mem
phis
Nashville
VA Beach
Raliegh/Durham
Richmond
Source: US Census, 2009, PTP Research

Goal: Unite education and training efforts for careers in logistics and distribution to prepare and maintain a superior workforce
Managed by Guilford Technical Community College in partnership with Davidson County Community College, Forsyth Technical Community College, and Randolph Community College.
(NCCGL)
45

TriSTEMScience, Technology, Engineering & Mathematics
Goal: Raise the number of graduates in the region (from <7,000 to >20,000) Connect existing STEM
programming, by distributing the ‘best practices’ of programs to all school systems
Involve private businesses in STEM education program input and execution
Direct grant and foundation funding
46

Specialized Training Centers for Advanced Manufacturing
Goal: Provide world class training to increase the availability of skilled workers to support a decision to expand or relocate Establish a collaboration between
private sector and region’s universities and community colleges
Devise an innovative mechanism to raise the competitive position by offering training to any employer or student in the state of NC
47
“ATEC Example” - Aviation Training and Education Center

Resetting the Triad’s Economic Drivers
Key Issues
Economic Development
Market Readiness
Organizational Context
Workforce Pipeline
Business Environme
nt
• New Industrial Base
• PTI Airport
• Industrial Product

Competitive Mega Sites
PACCARSeverCorr
Toyota
Dow Corning/ HemlockVolkswagen
AvailableOccupied

Mega Site: Location Requirements
Site must be large (between 1,000 to 3,300 acres) Site must be served by rail Site must be adjacent to interstate or 4-lane controlled
access highway Site must be in an attainment area Site must be available for immediate use Site must be eligible for expedited permitting Site must have reasonable access to commercial airport Labor must be available and capable of being trained
50

Mega Site: Location Requirements
Exceptional training facilities must be provided Site must be located in areas of low levels of unionization Site must be located in area with right-to-work laws Utilities must be provided within 18 months Site must be provide to end user at no cost Site must be located in a favorable tax environment
51

Four Interconnected Processes
EconomicDevelopment
Market Readiness
Organizational Context
Workforce Pipeline
Business Environment
Benchmarks
• Volkswagen (TN)
• Mercedes Benz (AL)
• Boeing 787 (SC)

Volkswagen Assembly Plant, Chattanooga, TN
Project Scope: Jobs: 2,000 direct Investment: $1.4 billion Incentives: $577.4 million ($289,000/job) Site: 1,350 acres
Announced in 2008; opened in May 2011 Most recent recruitment of an automotive assembly
plant Represents high water mark in incentive dollars offered
for an automotive assembly plant
53

Volkswagen Assembly Plant, Chattanooga, TNIncentive Package
$200 MM: Super jobs tax credits of $5,000 per job per year for up to 20 years.
$81 MM: Estimated value of 1,350 acres provided to VW at no cost.
$100 MM: Property tax abatements over a 10 year period.
$156.4 MM: Training costs, road, rail and utility improvements, low interest loans, grants and additional tax credits.
$40 MM: Specialized training facilities and programs Total: $577.4 million
54

VW Incentive Justification“Didn’t want to lose another one. . .”
Alabama also had a finalist site in the VW competition. Alabama offered $385MM in incentives – the largest
package Alabama had ever offered for an automotive plant.
Tennessee’s VW package was more than $190MM greater than Alabama’s offer.
On a cash flow basis: For each dollar spent on a one time basis, the state and
local governments will receive $1 in new tax revenues annually for 30 years
Results in a net cash benefit to Tennessee of $526.9 million and $557 million for the local governments
55

Mercedes Benz Assembly Plant, Vance, Alabama
Project Scope: Jobs: 1,500 Investment: $300 Million Incentive: $253 Million ($160,000/job) Site: 1,000 acres
In 1993, Alabama offered a then unheard of $253MM in incentives.
Mercedes’ initial investment was $300MM. Invested an additional $80 MM in 1998 Invested an additional $2 Billion in 2011 Created an additional 1,500 jobs since 1993
56
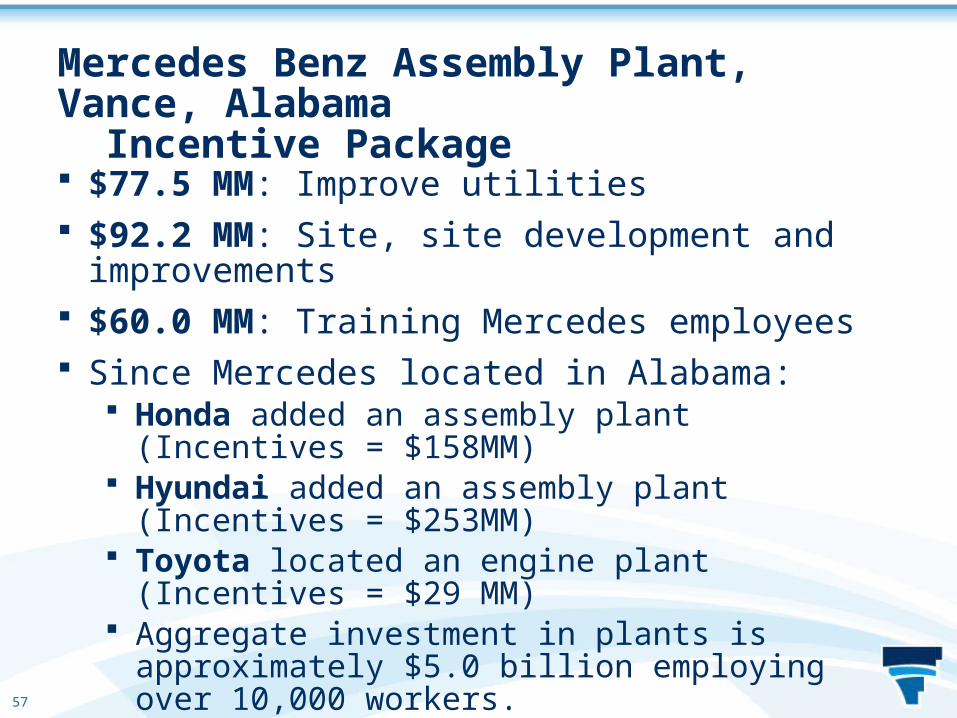
Mercedes Benz Assembly Plant, Vance, AlabamaIncentive Package
$77.5 MM: Improve utilities $92.2 MM: Site, site development and improvements $60.0 MM: Training Mercedes employees Since Mercedes located in Alabama:
Honda added an assembly plant (Incentives = $158MM) Hyundai added an assembly plant (Incentives = $253MM) Toyota located an engine plant (Incentives = $29 MM) Aggregate investment in plants is approximately $5.0
billion employing over 10,000 workers.
57

Boeing 787 Dreamliner Plant North Charleston, SC
SC officials have refused to quantify Estimated by the Charleston Post and Courier, to exceed
$900 million and quite likely exceed $1 billion. Boeing’s investment is variously reported to be between
$750 million and $1.025 billion. The plant is reported to involve the creation of 3,800
direct jobs and 5,971 additional indirect jobs.
58

$361.8MM: Principal and interest on General Obligation Economic Development Bonds
$306MM: Property tax abatements (Fee-In-Lieu) $150MM: Sales tax exemptions $33MM: Training Total: $850,839,350 Tax credits and other grants will easily increase the total
package to an amount in excess of $900 million
59
Boeing 787 Dreamliner Plant North Charleston, SCIncentive Package

Estimated Impacts from a mid-sized Automotive Assembly Plant
Impact Value
Employment 9,526
Labor Income $642,752,280
Value Added $1,274,430,596
Output $4,271,237,688
Total State & Local Taxes $101,708,714
Property Taxes $25,148,418
Sales Taxes $32,631,225
Income Taxes $18,442,011
Other Taxes $25,487,060
Source: UNC-G Bryan School of Business

In conclusion. . .
EconomicDevelopment
Market Readiness
Organizational Context
Workforce Pipeline
Business Environment
Priorities
• Catalytic Projects
• Tax & Incentive Reform
• Specialized Centers
• Industrial Product