Reservoir Simulation Study. Reservoir Drive Mechanisms and Energy Plot Has Gas-Oil Contact and...
16
Reservoir Simulation Study
-
Upload
cecilia-wheeler -
Category
Documents
-
view
247 -
download
4
Transcript of Reservoir Simulation Study. Reservoir Drive Mechanisms and Energy Plot Has Gas-Oil Contact and...

Reservoir Simulation Study
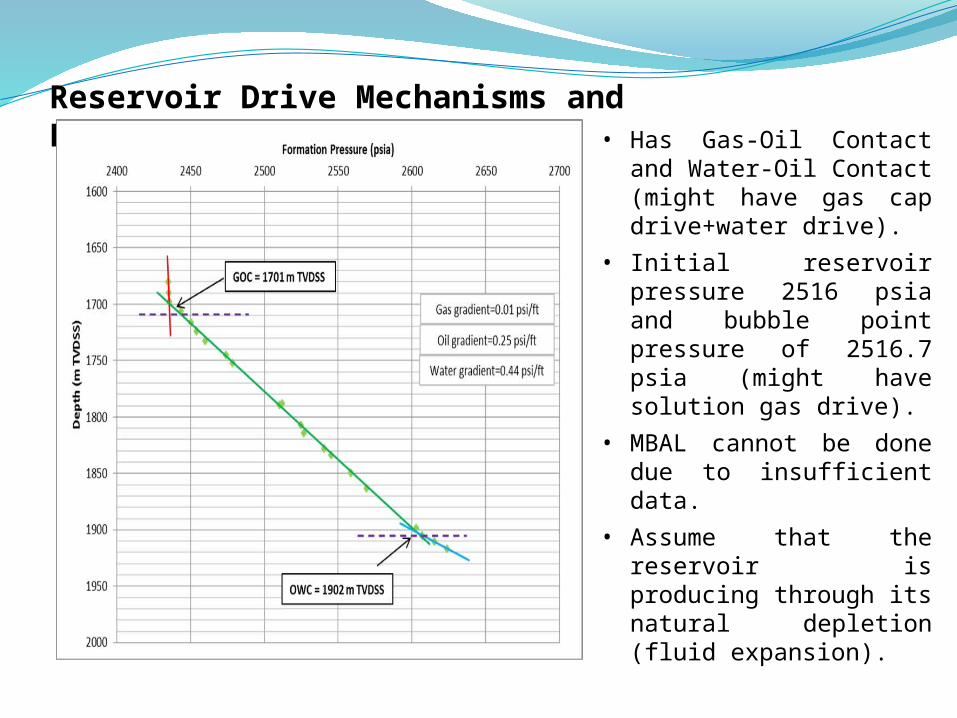
Reservoir Drive Mechanisms and Energy Plot• Has Gas-Oil Contact and
Water-Oil Contact (might have gas cap drive+water drive).
• Initial reservoir pressure 2516 psia and bubble point pressure of 2516.7 psia (might have solution gas drive).
• MBAL cannot be done due to insufficient data.
• Assume that the reservoir is producing through its natural depletion (fluid expansion).

3D Geological Static Model Export3D static model was developed using PETREL 2012
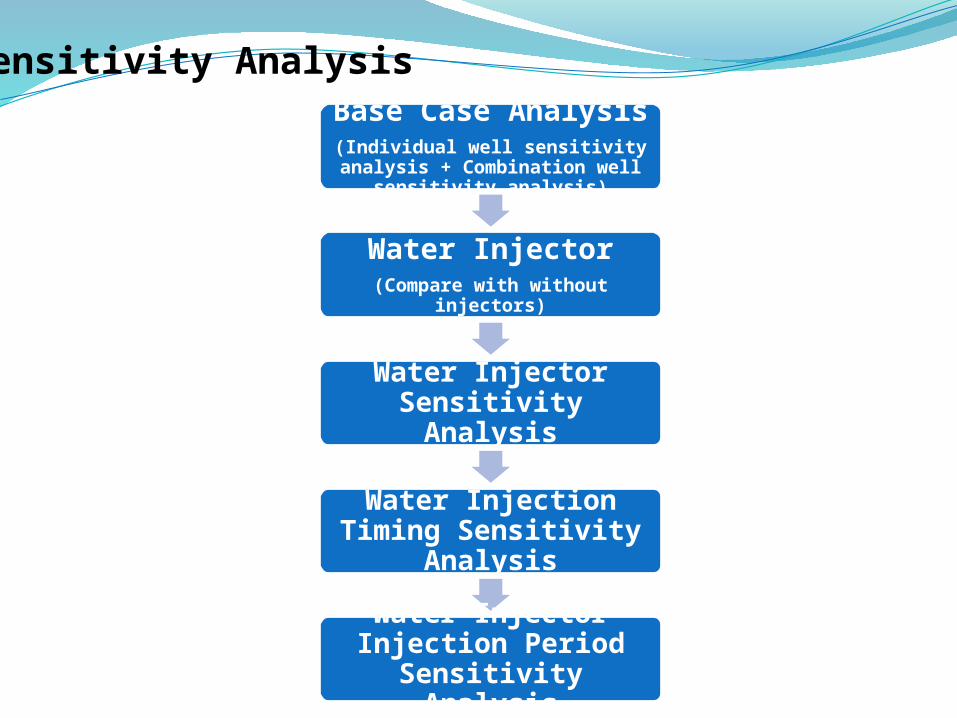
Base Case Analysis(Individual well sensitivity analysis +
Combination well sensitivity analysis)
Water Injector(Compare with without injectors)
Water Injector Sensitivity Analysis
Water Injection Timing Sensitivity Analysis
Water Injector Injection Period Sensitivity Analysis
Sensitivity Analysis
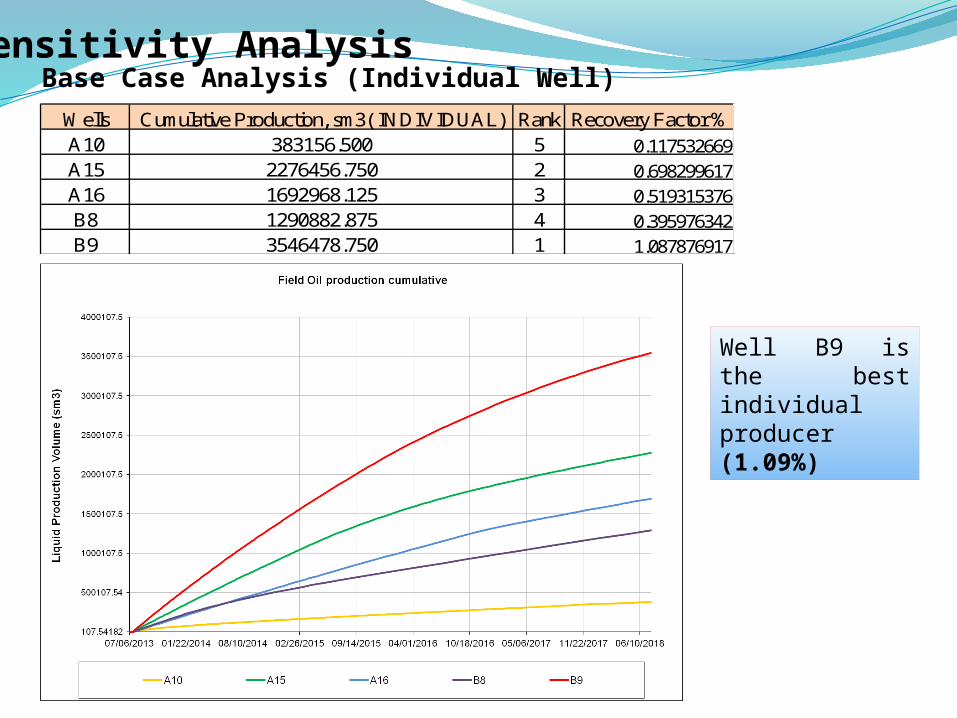
Sensitivity AnalysisBase Case Analysis (Individual Well)
Wells Cumulative Production, sm3( INDIVIDUAL) Rank Recovery Factor %A10 383156.500 5 0.117532669A15 2276456.750 2 0.698299617A16 1692968.125 3 0.519315376B8 1290882.875 4 0.395976342B9 3546478.750 1 1.087876917
Well B9 is the best individual producer (1.09%)
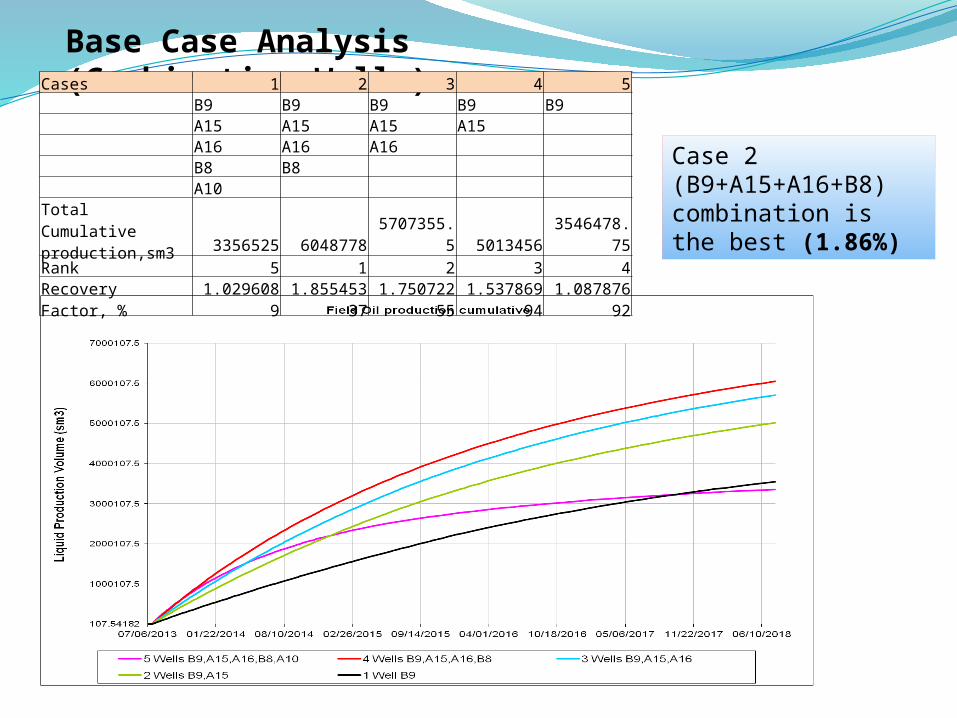
Case 2 (B9+A15+A16+B8) combination is the best (1.86%)
Base Case Analysis (Combination Wells)Cases 1 2 3 4 5 B9 B9 B9 B9 B9 A15 A15 A15 A15 A16 A16 A16 B8 B8 A10
Total Cumulative production,sm3 3356525 6048778 5707355.5 5013456 3546478.75Rank 5 1 2 3 4Recovery Factor, % 1.0296089 1.85545337 1.75072255 1.53786994 1.08787692
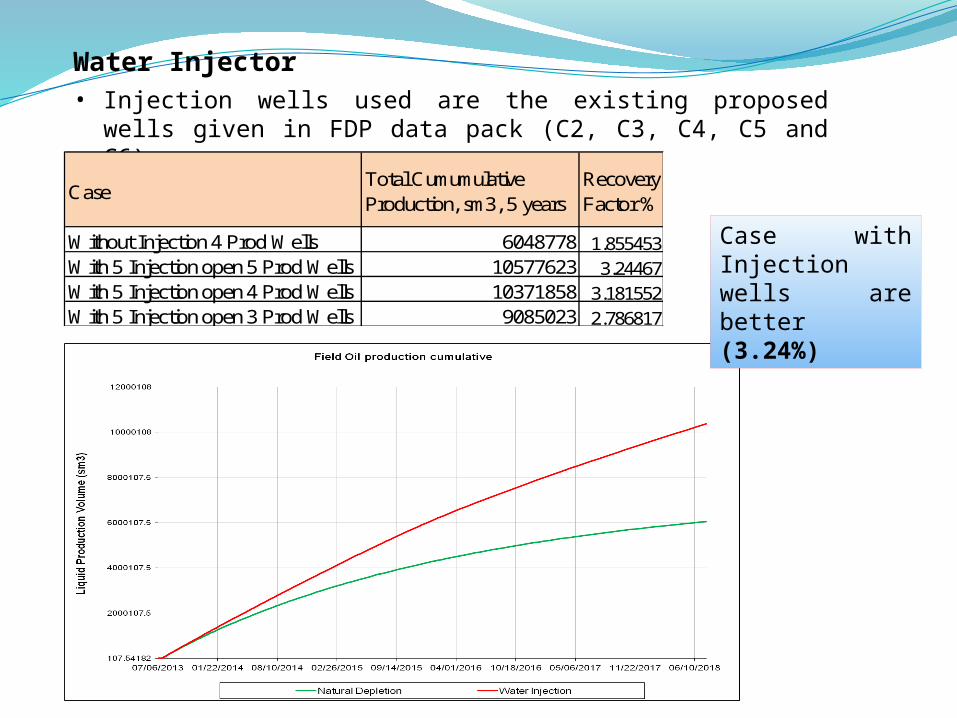
Water Injector• Injection wells used are the existing proposed wells given in FDP data pack
(C2, C3, C4, C5 and C6).
CaseTotal Cumumulative Production, sm3, 5 years
Recovery Factor %
Without Injection 4 Prod Wells 6048778 1.855453With 5 Injection open 5 Prod Wells 10577623 3.24467With 5 Injection open 4 Prod Wells 10371858 3.181552With 5 Injection open 3 Prod Wells 9085023 2.786817
Case with Injection wells are better (3.24%)
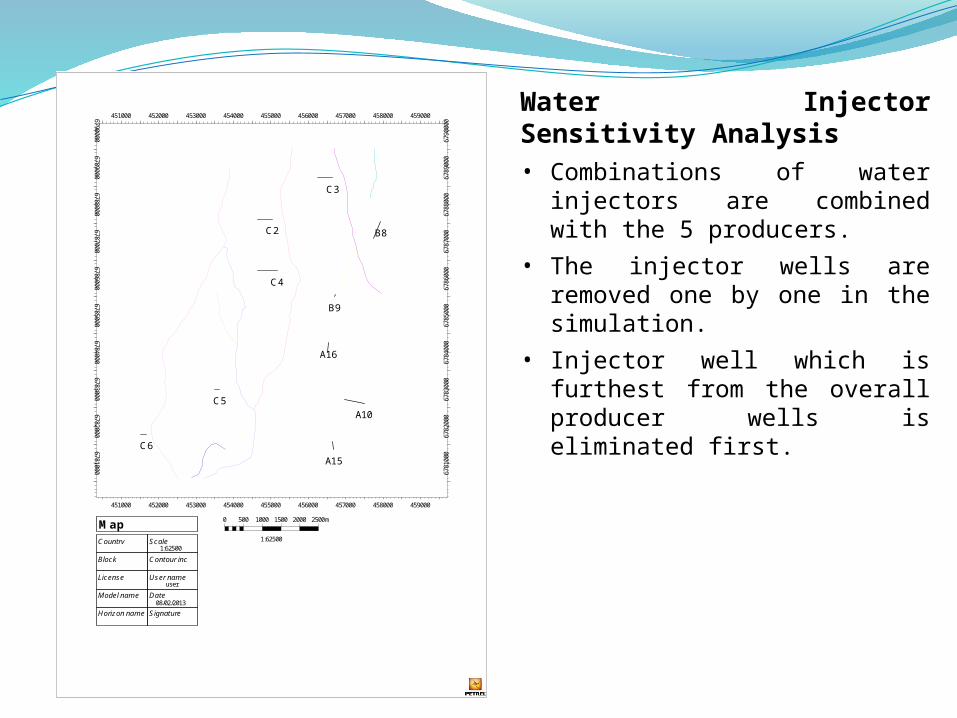
Water Injector Sensitivity Analysis• Combinations of water injectors are
combined with the 5 producers.• The injector wells are removed one by
one in the simulation.• Injector well which is furthest from the
overall producer wells is eliminated first.
A10
A15
A16
B8
B9
C2
C3
C4
C5
C6
451000 452000 453000 454000 455000 456000 457000 458000 459000
451000 452000 453000 454000 455000 456000 457000 458000 459000
67810006782000
67830006784000
67850006786000
67870006788000
67890006790000
6781000
6782000
6783000
6784000
6785000
6786000
6787000
6788000
6789000
6790000
0 500 1000 1500 2000 2500m
1:62500
MapCountry Scale
1:62500
Block Contour inc
License User nameuser
Model name Date08/02/2013
Horizon name Signature
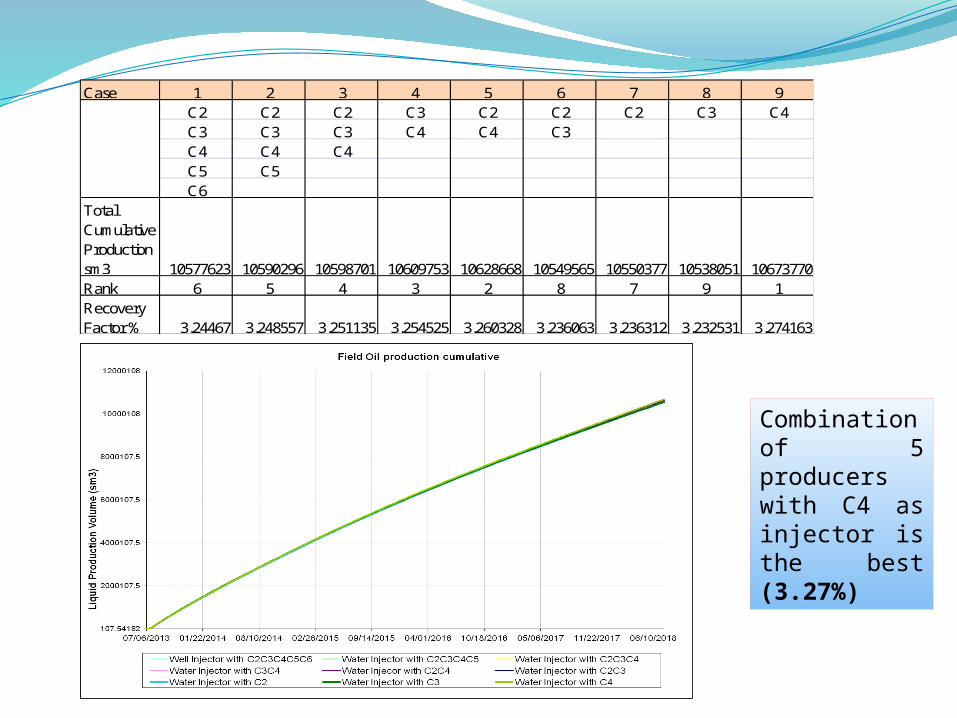
Case 1 2 3 4 5 6 7 8 9C2 C2 C2 C3 C2 C2 C2 C3 C4C3 C3 C3 C4 C4 C3C4 C4 C4C5 C5C6
Total Cumulative Production sm3 10577623 10590296 10598701 10609753 10628668 10549565 10550377 10538051 10673770Rank 6 5 4 3 2 8 7 9 1Recovery Factor % 3.24467 3.248557 3.251135 3.254525 3.260328 3.236063 3.236312 3.232531 3.274163
Combination of 5 producers with C4 as injector is the best (3.27%)
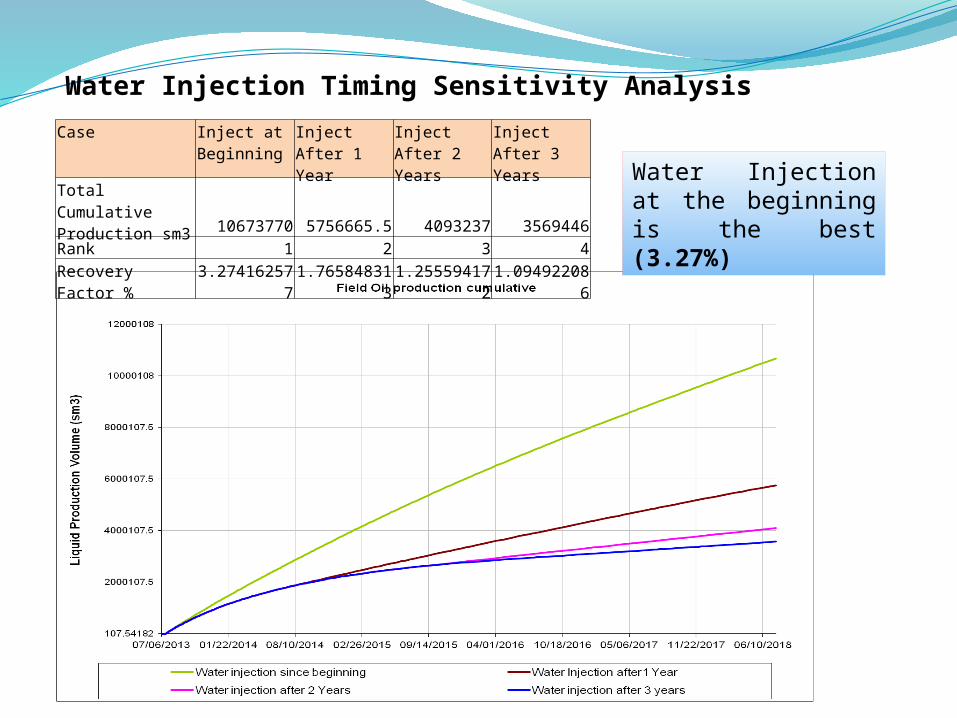
Water Injection Timing Sensitivity Analysis
Water Injection at the beginning is the best (3.27%)
Case Inject at Beginning
Inject After 1 Year
Inject After 2 Years
Inject After 3 Years
Total Cumulative Production sm3 10673770 5756665.5 4093237 3569446
Rank 1 2 3 4
Recovery Factor % 3.274162577 1.765848313 1.255594172 1.094922086
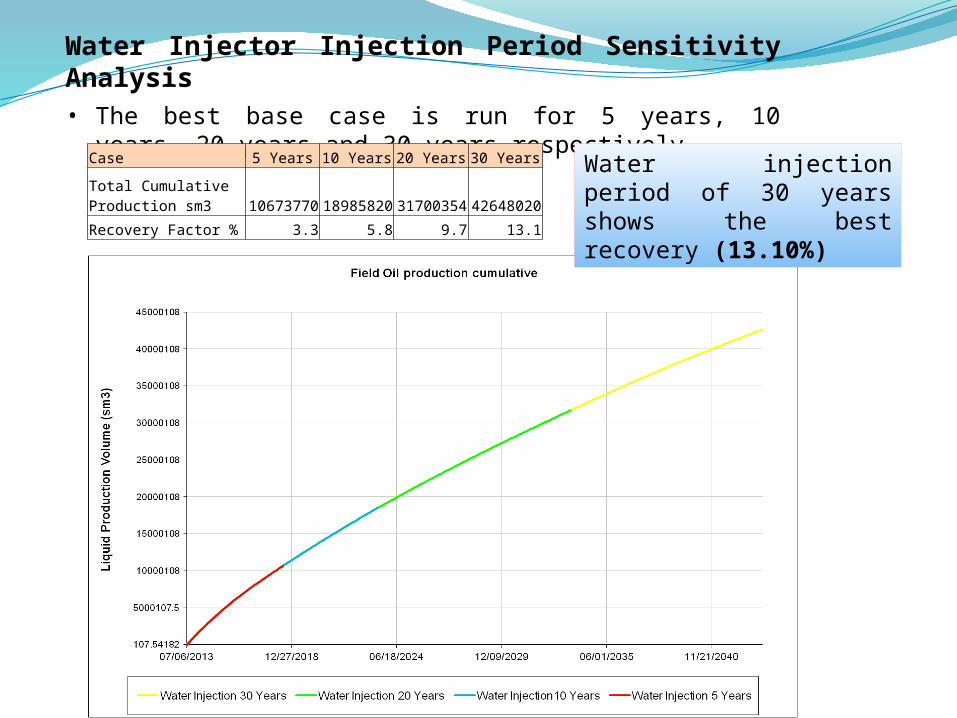
Water Injector Injection Period Sensitivity Analysis• The best base case is run for 5 years, 10 years, 20 years and 30 years
respectively.
Water injection period of 30 years shows the best recovery (13.10%)
Case 5 Years 10 Years 20 Years 30 Years
Total Cumulative Production sm3 10673770 18985820 31700354 42648020
Recovery Factor % 3.3 5.8 9.7 13.1
Reservoir Simulation Conclusion• The recovery factor of the field is expected to increase as the time period
increases.• Due to time constraint for this project, the case is only run up till 30 years. • To get more recovery from the field, more wells need to be drilled and analysis
is be made.
For a field with 0.326 Billion standard cubic meter of oil, producing via water injection for 30 years with a recovery factor of 13.10% is considered very outstanding for a 5 wells producer.
Back-Up RE
Purpose
i. Analyzing the performance of the reservoir, the potential reserve that can be recovered with the desired and most feasible recovery method.
ii. Additional assurance in making a decision in reservoir management plan.
Objectives
i. To propose the most economical and feasible field development plan or strategy based of on the recovery factor and long term sustainability of the reservoir.
ii. To predict the future performance and production profile of the field.
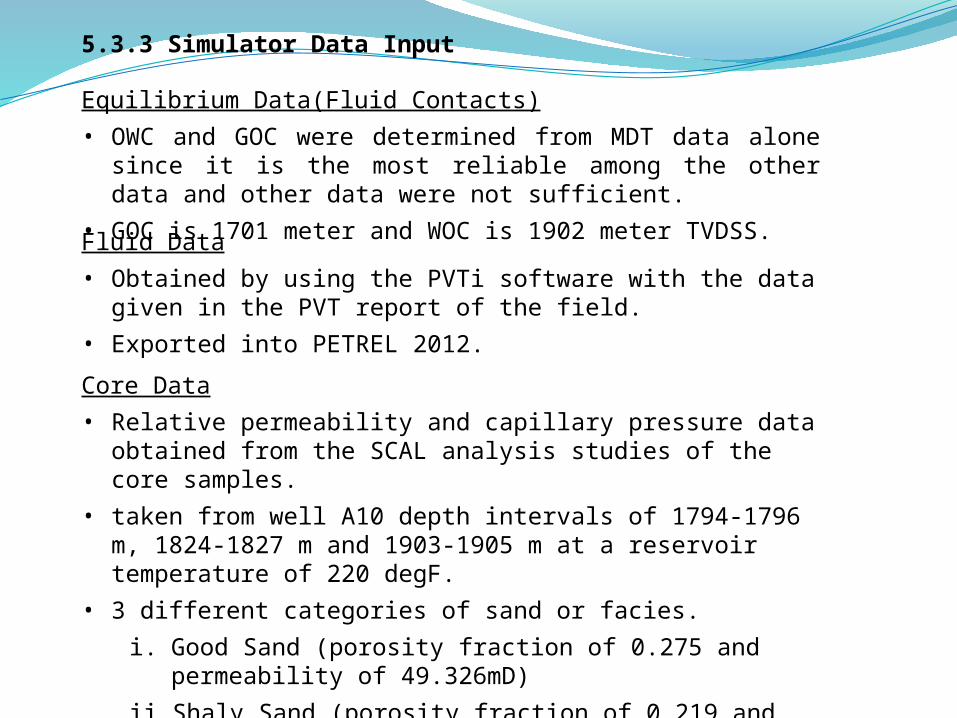
5.3.3 Simulator Data Input
Equilibrium Data(Fluid Contacts)• OWC and GOC were determined from MDT data alone since it is the
most reliable among the other data and other data were not sufficient.• GOC is 1701 meter and WOC is 1902 meter TVDSS.
Fluid Data• Obtained by using the PVTi software with the data given in the PVT report
of the field.• Exported into PETREL 2012.
Core Data• Relative permeability and capillary pressure data obtained from the SCAL
analysis studies of the core samples.• taken from well A10 depth intervals of 1794-1796 m, 1824-1827 m and
1903-1905 m at a reservoir temperature of 220 degF.• 3 different categories of sand or facies.
i. Good Sand (porosity fraction of 0.275 and permeability of 49.326mD)
ii. Shaly Sand (porosity fraction of 0.219 and permeability of 16 mD)
iii. Fair Sand (porosity fraction of 0.26 and permeability of 239.4 mD).
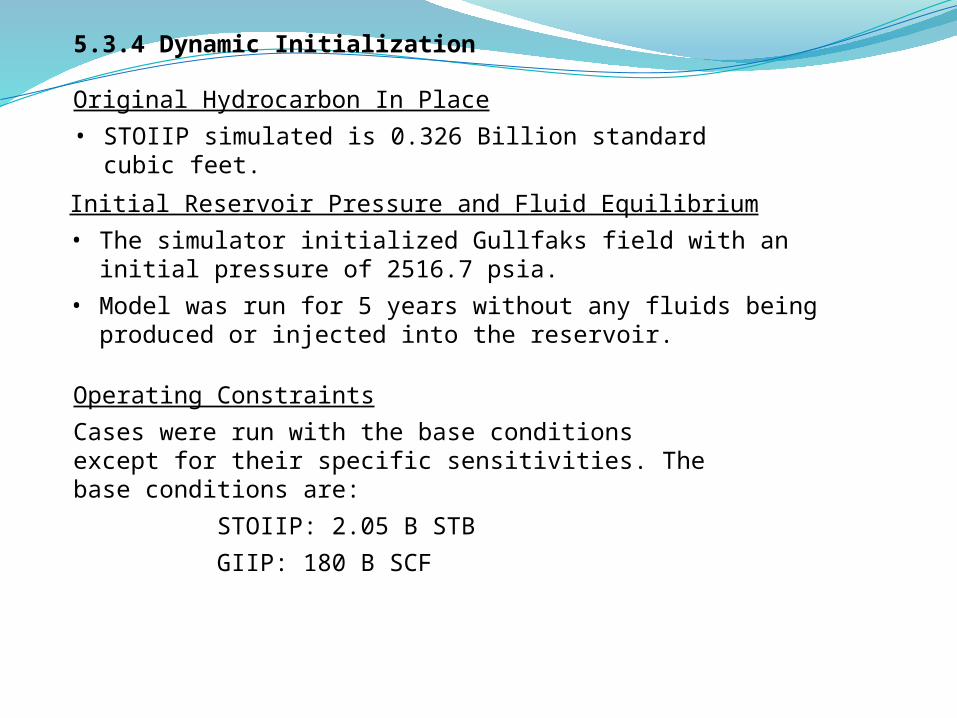
5.3.4 Dynamic Initialization
Original Hydrocarbon In Place
• STOIIP simulated is 0.326 Billion standard cubic feet.
Initial Reservoir Pressure and Fluid Equilibrium
• The simulator initialized Gullfaks field with an initial pressure of 2516.7 psia.
• Model was run for 5 years without any fluids being produced or injected into the reservoir.
Operating Constraints
Cases were run with the base conditions except for their specific sensitivities. The base conditions are:
STOIIP: 2.05 B STB
GIIP: 180 B SCF