Reservoir Model for Calculating Natural Sand Bypassing and ... · PDF fileERDC/CHL CHETN-IV-39...
15
ERDC/CHL CHETN-IV-39 March 2002 Reservoir Model for Calculating Natural Sand Bypassing and Change in Volume of Ebb-Tidal Shoals, Part I: Description by Nicholas C. Kraus PURPOSE: The Coastal and Hydraulics Engineering Technical Note (CHETN) herein provides information on a mathematical model developed to calculate natural sand bypassing and change in volume of ebb-tidal shoals. Subsequent CHETN’s in this series will describe the interface and generalizations of the model to cover flood-tidal shoals, inlet-entrance channel, and other morphologic features at inlets. BACKGROUND: An inlet is an opening through a landmass that hydraulically connects a large body of water such as an ocean or sea to a smaller body of water such as a bay or lagoon. The ebb and flood currents generated by the tide (or by seiching in the case of large lakes and inland seas) redistribute sediment transported toward the inlet channel by the wave-generated longshore current. The dynamic balance of the various sediment-transporting mechanisms creates morphologic features such as shown for in Figure 1 for Shinnecock Inlet, on Long Island, NY. The picture was taken on a calm day, and the various sand bodies around the inlet can be seen through the water. Interpreted sediment-transport pathways among the sand bodies or morphologic features are drawn in Figure 2. On this coast, longshore transport is directed strongly to the west (to the left in Figure 2). Sediment (predominantly sand) moving to the west reaches the updrift attachment bar (labeled “A. Bar”) and can deposit on the shore, move into the inlet channel, or move out onto the updrift bypassing bar. Attachment bars (also called weldment or tie-in areas) typically protrude from the shore and connect the bypassing bars to the beach. If sand moves into the channel, it can either remain there, possibly to be dredged, or be transported by the tidal current to the ebb shoal or the flood shoal. Bypassing bars connect the attachment bars to the ebb shoal and are created primarily by wave action and wave-induced currents. Sand moving from the bypassing bar can reach the ebb shoal, from where it can stay on the shoal, move offshore, move into the channel, or continue bypassing the inlet and go to the downdrift bypassing bar. From the downdrift bypassing bar, transported sand can continue on the large downdrift attachment bar and to the beaches on either side of it. Typically, sand transported alongshore reaches the inlet channel, from where it is jetted toward the flood shoal or the ebb shoal by the tidal current. As seen in Figure 2, it is possible that sand can move cyclically around the inlet, such as back and forth between the flood and ebb shoals via the channel or around the ebb shoal, downdrift bypassing bar, beach, channel, and back to the ebb shoal. Ebb shoals store sand and serve as a conduit for sand bypassing around inlets. Bypassing to the downdrift beach occurs according to the state of maturity of the shoal, wave conditions, magnitude of the tidal prism, and other factors. Not all inlets bypass sand as described for Shinnecock Inlet. FitzGerald, Kraus, and Hands (2001) describe other morphologic types of inlets and bypassing mechanisms. Recently, Gaudiano and Kana (2001) quantified bypassing at inlets in South Carolina that tend to move
Transcript of Reservoir Model for Calculating Natural Sand Bypassing and ... · PDF fileERDC/CHL CHETN-IV-39...

ERDC/CHL CHETN-IV-39 March 2002
Reservoir Model for Calculating Natural Sand Bypassing and Change in Volume of Ebb-Tidal Shoals, Part I: Description
by Nicholas C. Kraus
PURPOSE: The Coastal and Hydraulics Engineering Technical Note (CHETN) herein provides information on a mathematical model developed to calculate natural sand bypassing and change in volume of ebb-tidal shoals. Subsequent CHETN’s in this series will describe the interface and generalizations of the model to cover flood-tidal shoals, inlet-entrance channel, and other morphologic features at inlets. BACKGROUND: An inlet is an opening through a landmass that hydraulically connects a large body of water such as an ocean or sea to a smaller body of water such as a bay or lagoon. The ebb and flood currents generated by the tide (or by seiching in the case of large lakes and inland seas) redistribute sediment transported toward the inlet channel by the wave-generated longshore current. The dynamic balance of the various sediment-transporting mechanisms creates morphologic features such as shown for in Figure 1 for Shinnecock Inlet, on Long Island, NY. The picture was taken on a calm day, and the various sand bodies around the inlet can be seen through the water. Interpreted sediment-transport pathways among the sand bodies or morphologic features are drawn in Figure 2. On this coast, longshore transport is directed strongly to the west (to the left in Figure 2). Sediment (predominantly sand) moving to the west reaches the updrift attachment bar (labeled “A. Bar”) and can deposit on the shore, move into the inlet channel, or move out onto the updrift bypassing bar. Attachment bars (also called weldment or tie-in areas) typically protrude from the shore and connect the bypassing bars to the beach. If sand moves into the channel, it can either remain there, possibly to be dredged, or be transported by the tidal current to the ebb shoal or the flood shoal. Bypassing bars connect the attachment bars to the ebb shoal and are created primarily by wave action and wave-induced currents. Sand moving from the bypassing bar can reach the ebb shoal, from where it can stay on the shoal, move offshore, move into the channel, or continue bypassing the inlet and go to the downdrift bypassing bar. From the downdrift bypassing bar, transported sand can continue on the large downdrift attachment bar and to the beaches on either side of it. Typically, sand transported alongshore reaches the inlet channel, from where it is jetted toward the flood shoal or the ebb shoal by the tidal current. As seen in Figure 2, it is possible that sand can move cyclically around the inlet, such as back and forth between the flood and ebb shoals via the channel or around the ebb shoal, downdrift bypassing bar, beach, channel, and back to the ebb shoal. Ebb shoals store sand and serve as a conduit for sand bypassing around inlets. Bypassing to the downdrift beach occurs according to the state of maturity of the shoal, wave conditions, magnitude of the tidal prism, and other factors. Not all inlets bypass sand as described for Shinnecock Inlet. FitzGerald, Kraus, and Hands (2001) describe other morphologic types of inlets and bypassing mechanisms. Recently, Gaudiano and Kana (2001) quantified bypassing at inlets in South Carolina that tend to move

Report Documentation Page Form ApprovedOMB No. 0704-0188
Public reporting burden for the collection of information is estimated to average 1 hour per response, including the time for reviewing instructions, searching existing data sources, gathering andmaintaining the data needed, and completing and reviewing the collection of information. Send comments regarding this burden estimate or any other aspect of this collection of information,including suggestions for reducing this burden, to Washington Headquarters Services, Directorate for Information Operations and Reports, 1215 Jefferson Davis Highway, Suite 1204, ArlingtonVA 22202-4302. Respondents should be aware that notwithstanding any other provision of law, no person shall be subject to a penalty for failing to comply with a collection of information if itdoes not display a currently valid OMB control number.
1. REPORT DATE MAR 2002
2. REPORT TYPE N/A
3. DATES COVERED -
4. TITLE AND SUBTITLE Reservoir Model for Calculating Natural Sand Bypassing and Change inVolume of Ebb-Tidal Shoals, Part I: Description (ERDC/CHL CHETN-IV-39)
5a. CONTRACT NUMBER
5b. GRANT NUMBER
5c. PROGRAM ELEMENT NUMBER
6. AUTHOR(S) Kraus, Nicholas C.
5d. PROJECT NUMBER
5e. TASK NUMBER
5f. WORK UNIT NUMBER
7. PERFORMING ORGANIZATION NAME(S) AND ADDRESS(ES) US Army Corps of Engineers, Engineer Research and DevelopmentCenter, Coastal and Hydraulics Laboratory, Vicksburg, MS
8. PERFORMING ORGANIZATIONREPORT NUMBER
9. SPONSORING/MONITORING AGENCY NAME(S) AND ADDRESS(ES) 10. SPONSOR/MONITOR’S ACRONYM(S)
11. SPONSOR/MONITOR’S REPORT NUMBER(S)
12. DISTRIBUTION/AVAILABILITY STATEMENT Approved for public release, distribution unlimited
13. SUPPLEMENTARY NOTES The original document contains color images.
14. ABSTRACT The Coastal and Hydraulics Engineering Technical Note (CHETN)provides information on amathematical model developed to calculate natural sand bypassing and change in volume of ebb-tidalshoals. Subsequent CHETNs in this series will describe the interface and generalizations of the model tocover flood-tidal shoals, inlet-entrance channel, and other morphologic features at inlets.
15. SUBJECT TERMS
16. SECURITY CLASSIFICATION OF: 17. LIMITATION OF ABSTRACT
UU
18. NUMBEROF PAGES
14
19a. NAME OFRESPONSIBLE PERSON
a. REPORT unclassified
b. ABSTRACT unclassified
c. THIS PAGE unclassified
Standard Form 298 (Rev. 8-98) Prescribed by ANSI Std Z39-18

ERDC/CHL CHETN-IV-39 March 2002
sand around them in discrete events once every several years, rather than continuously. Carr and Kraus (2001) describe asymmetries in inlet morphology based upon the nomenclature given in the present CHETN. Kraus (1998) develops a model for the minimum inlet channel cross section based upon a balance between sand brought to an inlet by the longshore transport and the scouring action of the tide. This CHETN presents a simple model developed to describe growth of tidal inlet features and natural sand bypassing based upon knowledge typically available to or estimated by the coastal engineer. Continuous bypassing is assumed.
Figure 1. Morphologic features at Shinnecock Inlet
2

ERDC/CHL CHETN-IV-39 March 2002
Figure 2. Sediment-transport pathways at Shinnecock Inlet
RESERVOIR MODEL: The reservoir model is based on the conservation of sand volume, ability of the engineer to identify sediment pathways, existence of an equilibrium volume of morphologic features, and a “reservoir assumption” that is described in the following paragraphs. Bypassing bars grow in the direction of predominant transport, similar to growth of a spit. At inlets with left- and right-directed longshore transport or with a small tidal prism, two large bypassing bars can emerge from the ebb shoal, creating a nearly concentric halo about the inlet entrance. As the bypassing bar merges with the shore, an attachment bar is created, thereby transporting sand to the beach. At this point in evolution of the ebb-shoal complex, substantial bypassing of sand can occur. Inlet Morphology and Pathways: The ebb-shoal complex is defined as consisting of the ebb shoal proper, one or two ebb-shoal bypassing bars (depending on the balance between left- and right-directed longshore transport), and one or two attachment bars. These features are shown schematically in Figure 3. The model distinguishes between the ebb-tidal shoal proper (hereafter, ebb shoal), typically located in the confine of the ebb-tidal jet, and the ebb-shoal bypassing bar (hereafter, bypassing bar) that grows toward shore from the ebb shoal, principally by the transport of sediment alongshore by wave action. In this figure, for the model discussed in the next section, only sediment pathways indicated by solid arrows with numbers are discussed. Other potential pathways as indicated with dashed lines are omitted. Previous authors (e.g., Walton and Adams 1976) combined the ebb shoal and the bar(s) protruding from it into one feature referred to as the ebb shoal. For the reservoir model, the shoal and bypassing bars are distinguished because of the different formation processes. When an inlet forms, a shoal first becomes apparent within the confines of the inlet ebb jet. Bypassing bars form later by sediment transported off the shoal through the action of breaking waves and wave-induced longshore current (tidal and wind-induced currents can also play a role). Also, a bar cannot form without a sufficient sediment source, similar to the growth of a spit from a sediment source (Kraus 1999). In simplified applications of the model, however, the ebb shoal and bypassing bar could be considered as a unit.
3

ERDC/CHL CHETN-IV-39 March 2002
QL
Updrift Barrier Is.
Flood Shoal
Inlet
Bay
Ocean
QR
Bypassing Bar
Ebb Shoal
Downdrift Barrier Is.
Attach.
Qin
2
34
1
PB. B
ar
Attach.
QL
Updrift Barrier Is.
Flood Shoal
Inlet
Bay
Ocean
QR
Bypassing Bar
Ebb Shoal
Downdrift Barrier Is.
Attach.Attach.
Qin
2
34
1
PB. B
ar
Attach.
Figure 3. Definition sketch for idealized inlet morphology and simplified sediment pathways.
In this figure, sand is bypassed from left to right in the order of the numbers shown
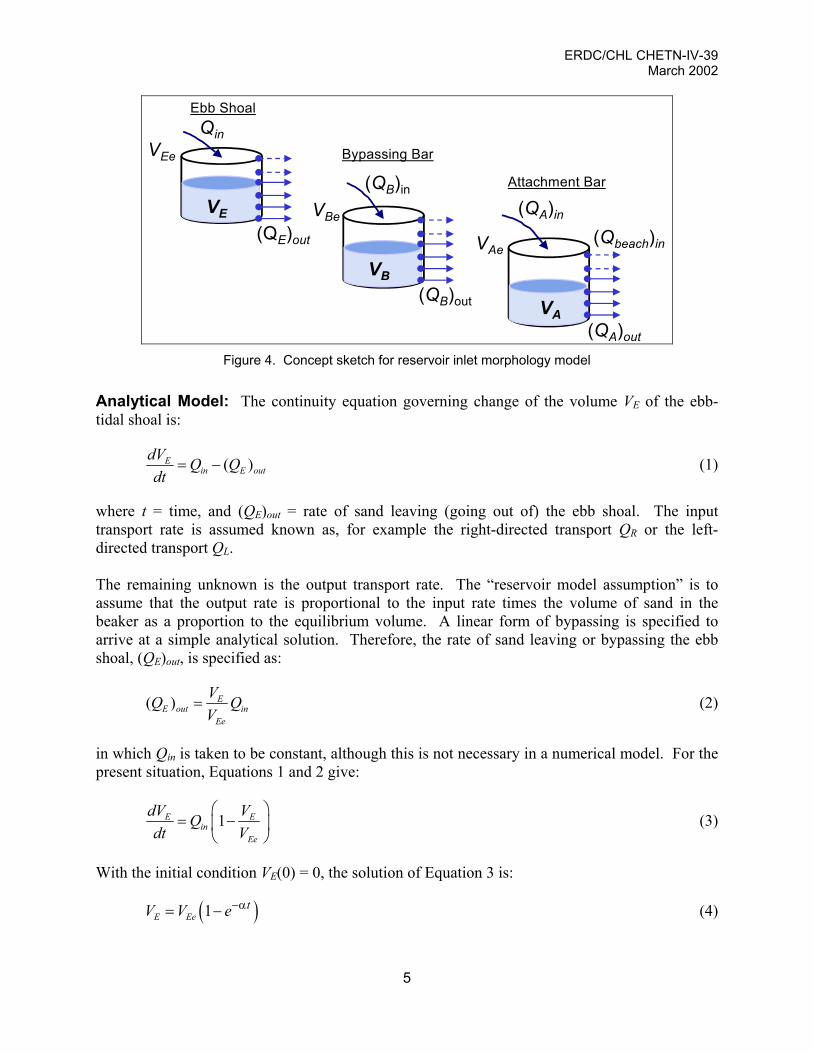
The ebb-shoal complex described in the preceding section is represented mathematically by analogy to a series of reservoirs or beakers, as shown in Figure 4. Sand is brought to the ebb shoal at a rate Qin, equivalent to the right-directed transport QR in Figure 3. Also, the volume VE in the ebb shoal at any time tends to increase while possibly “leaking” or bypassing some amount of sand to create a downdrift bypassing bar. The manner and rate at which sand leaks to the next reservoir depends on assumptions described in the following paragraph. The volume of sand in the shoal (reservoir) can increase until it reaches an equilibrium volume VEe (the subscript e denoting equilibrium) according to the hydrodynamic conditions. Sand leaks to the bypass bar from inception of the shoal, and after equilibrium is achieved (the reservoir is full), all sand brought to the ebb shoal is bypassed in the direction of transport at the particular time. Similarly, the bypassing bar volume VB grows as it is supplied with sediment by the littoral drift and the ebb shoal, with some of its material leaking (bypassing) to the downdrift attachment bar. After the bypassing bar reaches equilibrium volume VBe, all sand supplied to it is contributed to the volume of the attachment bar VA. The attachment bar transfers sand to the adjacent beaches. After it reaches its equilibrium volume VAe, all sand supplied to it by the bar is bypassed. The model thus requires values of the input and output rates of transport from each feature, and their respective equilibrium volumes.
4
ERDC/CHL CHETN-IV-39 March 2002
VEeQin
VE
(QB)in
VBe(QE)out
(QB)out
VAe
(QA)in
(QA)out
(Qbeach)in
Ebb Shoal
Bypassing Bar
Attachment Bar
VB
VA
Figure 4. Concept sketch for reservoir inlet morphology model
Analytical Model: The continuity equation governing change of the volume VE of the ebb-tidal shoal is:
( )Ein E out
dV Q Qdt
= − (1)
where t = time, and (QE)out = rate of sand leaving (going out of) the ebb shoal. The input transport rate is assumed known as, for example the right-directed transport QR or the left-directed transport QL. The remaining unknown is the output transport rate. The “reservoir model assumption” is to assume that the output rate is proportional to the input rate times the volume of sand in the beaker as a proportion to the equilibrium volume. A linear form of bypassing is specified to arrive at a simple analytical solution. Therefore, the rate of sand leaving or bypassing the ebb shoal, (QE)out, is specified as:
( ) EE out in
Ee
VQ QV
= (2)
in which Qin is taken to be constant, although this is not necessary in a numerical model. For the present situation, Equations 1 and 2 give:
1E Ein
Ee
dV VQdt V
= −
(3)
With the initial condition VE(0) = 0, the solution of Equation 3 is:
(4) ( )1E EetV V e−α= −
5

ERDC/CHL CHETN-IV-39 March 2002
in which
in
Ee
QV
α = (5)
The parameter α gives a characteristic time scale for the ebb shoal. For example, if Qin = 1×10⁵ m3/year and VEe = 2×10⁶ m3, which are representative values for a small inlet on a moderate-wave coast, then 1/α = 20 years. The shoal is predicted to reach 50 and 95 percent of its equilibrium volume after 14 and 60 years, respectively, under the constant imposed transport rate. These time frames are on the order of those associated with development of inlet ebb shoals. Equations 4 and 5 are the central results of the reservoir model. The parameter α has a physical interpretation by analogy to the model of bar bypassing introduced by Bruun and Gerritsen (1960) and reviewed by Bruun, Mehta, and Jonsson (1978). Bruun and Gerritsen (1960; see also, Bruun and Gerristsen 1959) introduced the ratio r as:
tot
PrM
= (6)
in which P = tidal prism1, and Mtot = average annual volume of littoral sediment brought to the inlet. Inlets with a value of r > 150 (approximate) tend to have stable, deep channels and are poor “bar bypassers” from updrift to downdrift, whereas inlets with r < 50 (approximate) tend toward closure and are good bar bypassers. Because the equilibrium volume of the ebb-tidal shoal has been empirically shown to be approximately linearly proportional to the tidal prism, VEe ∝ P (Walton and Adams 1976), α is therefore approximately proportional to 1/r. Following the same procedure, the reservoir model gives the volume of the bypassing bar as:
( )1 , ,in EB Be
Be in
t Q VV V e t tV Q
−β ′ ′= − β = = − (7)
and the volume of the attachment bar, as:
( )1 , ,in BA AE
AE i
t Q VV V e t tV Q
−γ ′′ ′′ ′= − γ = = −n
(8)
The coefficients β and γ function similarly to α in representing time scales of change for the bypassing bar and attachment bar, respectively. The quantities and in Equations 7 and 8 are lag times that account for a delay in development of the bypassing bar and attachment bar, respectively. After formation of an inlet, a
′t ′′t
1 The tidal prism is the total volume of water that flows into a tidal basin with a flood tide and then out again with the ebb. Typically, for inlet stability the tidal prism at spring tide or diurnal tide is considered. The diurnal tide range is defined as the difference in height between mean higher high water and mean lower low water.
6

ERDC/CHL CHETN-IV-39 March 2002
certain time is required for the bypassing bar to receive a significant amount of sand from the shoal and a longer time for the attachment bar or beach to receive sand as it moves around the inlet from the updrift side. The following results are obtained for the bypassing rate of the bar (QB)out, which is equal to the input of the attachment (QA)in, and the bypassing rate of the attachment (QA)out, which is also the bypassing rate or input to the beach, (Qbeach)in:
( ) ( )E BB inout in
Ee Be
V VQ QV V
= = AQ (9)
( ) ( )E B AA in beachout in
Ee Be Ae
V V VQ QV V V
= = Q (10)
The rate (QA)out describes the amount of sand reaching the downdrift beach as a function of time and is a central quantity in beach nourishment and shore-protection design near inlets. EXAMPLE APPLICATIONS: In this section, two applications of the reservoir model are given. These applications are considered simple because several sediment pathways have been neglected. A more comprehensive application is described by Militello and Kraus (2001), for which mining of a flood was evaluated by generalization and numerical solution of a simultaneous system of equations such as Equation 3. Example 1: Jupiter Inlet, FL. Mehta, Dombrowski, and Devine (1996) developed a numerical model for calculating the growth of an ebb shoal by computing the deposition of sediment brought by the ebb jet on a morphologic feature of fixed planar area. Of the four examples given by Mehta, Dombrowski, and Devine (1996), here the reservoir model is evaluated with the data from their first example – Jupiter Inlet, FL. This inlet opened in 1947, and several measurements of the volume of the total ebb shoal are available, plotted in Figure 5. The equilibrium volume of the total ebb shoal (ebb shoal proper and the bypassing bar) by Walton and Adams (1976) is VEe = 0.74×10⁶ m3. It is seen that the inlet has had periods of substantial deflation of the ebb shoal, as given by the group of three lower points. This rapid change in volume suggests the shoal is small in comparison to the transporting capacity of the wave forces. The value for Qin was taken from Dean and O’Brien (1987) as 1.76×10⁵m3/year (net rate from the north). The calculation is shown in Figure 5, where the dashed lines denote deviations in Qin by ±30 percent. Reasonable agreement is obtained between calculations and measurements and similar to that found by Mehta, Dombrowski, and Devine (1996). For this inlet, 1/a = 4 years, which means that the ebb shoal achieves full volume relatively quickly – implying the inlet is a good bar bypassing system (the tidal prism is weak in relation to the littoral drift). The bypassing rates calculated by the reservoir model for the total ebb shoal and the attachment bar (arbitrarily assigned the value of VAe = VEe/10) are plotted in Figure 6, where the dashed lines again denote rates calculated with Qin ±30 percent. Because of the relative small value of 1/a,
7

ERDC/CHL CHETN-IV-39 March 2002
within 20 years of formation the inlet is calculated to bypass more than 80 percent of the material that arrives to it from the north. Calculation for the other three examples given by Mehta, Dombrowski, and Devein (1996) showed similar reasonable agreement, which is satisfying because both Qin and VEe were taken from the literature.
1940 1950 1960 1970 1980 1990 20000
0.2
0.4
0.6
0.8
1
1.2
Elapsed Time, years
Nor
mal
ized
Gro
wth
of E
bb S
hoal
measured Qin + 30% Qin - 30% Qin
Figure 5. Calculated and measured growth of total ebb shoal, Jupiter Inlet
1940 1950 1960 1970 1980 1990 20000
0.1
0.2
0.3
0.4
0.5
0.6
0.7
0.8
0.9
1
Elapsed Time, years
Nor
mal
ized
Byp
ass
Rat
es o
f Ebb
Sho
al a
nd A
ttach
men
t Bar
For Qin - 30%
For Qin + 30%
Attachment Bar
Ebb Shoal
Figure 6. Calculated bypassing rate of total ebb shoal and attachment bar, Jupiter Inlet
8

ERDC/CHL CHETN-IV-39 March 2002
Example 2: Ocean City Inlet, MD. Ocean City Inlet (Figure 7) was opened by a hurricane in August 1933, and considerable information is available for this inlet (Dean and Perlin 1977; Underwood and Hiland 1995; Rosati and Ebersole 1996; Stauble 1997). Stabilization of the inlet began one month later by placement of jetties, making this relatively large inlet an ideal site to evaluate models of ebb shoal evolution. Because of the sudden and near-complete interruption of the longshore drift (net north to south), Assateague Island located to the south eroded severely (Leatherman 1984). Dean and Perlin (1977) estimated the long-term net (southward) longshore sand transport rate as between approximately 1.15×10⁵ and 1.50 ×10⁵m3/year, based on impoundment at the north jetty. Underwood and Hiland (1995) estimated the equilibrium volume of the ebb-shoal complex as between 5.8×10⁶ and 7.2 ×10⁶ m3 based on the tidal prism of 2.3×10⁷ m3 given by Dean and Perlin (1977) and calculation methods given in Walton and Adams (1976). With Mtot estimated by the upper value of net transport, one finds r ≅ 150, indicating lack of a bar across the entrance channel and good navigation. In fact, the entrance channel is rarely dredged in maintenance of a channel to 3.7 mean lower low water (mllw) (including advance and overdredging). Bathymetry survey data were available for the dates of 1929/1933 to define the pre-inlet condition, 1937, 1961/1962, 1977/1978, 1990, and a composite of various surveys conducted in 1995. Underwood and Hiland (1995) developed data sets prior to 1995, and Stauble (1997) assembled the 1995 data set from various sources for the U.S. Army Engineer District, Baltimore. The analysis made to distinguish the ebb shoal, bypassing bar, and attachment bar is given in Kraus (2000a, 2000b). Quality data sets made identification of distinct morphologic features possible.
Figure 7. Ocean City Inlet, MD, and interpretation of sediment paths
For evaluation of the analytic model, input values were specified based on coastal-processes information from the aforementioned studies, with no optimization of parameters made. The
9

ERDC/CHL CHETN-IV-39 March 2002
four required parameters were specified as Qin = 1.50×10⁵ m3/year corresponding to the upper limit of expected net longshore transport to the south, VEe = 3 ×10⁶ m3, VBe = 7×10⁶ m3, and VAe = 5×10⁵ m3. The value of VAe was arbitrarily assigned as an order-of-magnitude estimate. Calculations were made for the 100-year interval 1933-2032. The measured and calculated volumes of the ebb shoal are plotted in Figure 8, with the dashed lines calculated for values of α for Qin ± 50,000 m3/year to demonstrate sensitivity of the solution to α and to estimate the range of predictions that may be reasonably possible. The trend in the data is well reproduced by Equation 4. Although the value of Qin chosen is at the upper range for the net transport rate, this value must also account for sediment sources other than the net drift to the south. In particular, prior to 1985 when the south jetty was tightened, some sand moving north could pass through it and into the navigation channel (Dean and Perlin 1977), where a portion would be jetted offshore.
1920 1940 1960 1980 2000 2020 20400
0.5
1
1.5
2
2.5
3x 10⁶
Year
Ebb
-Sho
al V
olum
e, m
3
VEe = 3 x 10⁶ m3
Calculated Measured Calc. with Qin +/-50,000
Figure 8. Volume of ebb shoal, Ocean City Inlet
Calculated and measured volumes of the ebb shoal, bypassing bar, and attachment bar are plotted in Figure 9. The calculations exhibit lags in development of the bypassing bar and attachment bar. Based on examination of aerial photographs, Underwood and Hiland (1995) concluded that downdrift attachment had occurred by 1980, when a distinct bulge in the shoreline was seen. The data and model indicate that, although the ebb shoal has achieved equilibrium, the bypassing bar is continuing to grow, so that natural bar bypassing from north to south has not achieved its full potential for sand storage.
10

ERDC/CHL CHETN-IV-39 March 2002
1920 1940 1960 1980 2000 2020 20400
1
2
3
4
5
6x 10⁶
Year
Ebb
-Sho
al, B
ar, &
Atta
chm
ent V
olum
e, m
3
Shoal Calc. Shoal Meas. Bar Calc. Bar Meas. Attach. Calc.Attach. Meas.
Figure 9. Volumes of ebb shoal, bypassing bar, and attachment bar, Ocean City Inlet
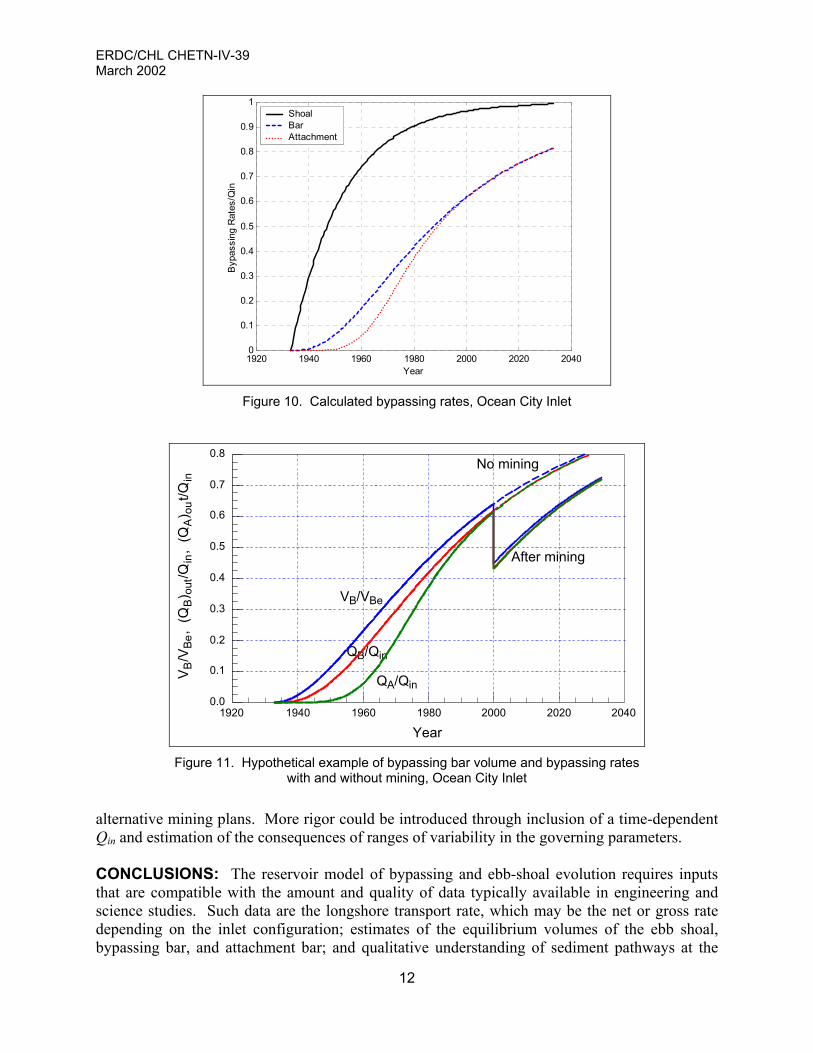
Bypassing rates calculated with the model, normalized by Qin, are plotted in Figure 10 and indicate the approach to full potential. The calculations show a substantial lag in sand reaching the bypassing and attachment bars. The bypassing rate at the attachment equals the rate of sand reaching the downdrift beach. Its magnitude shown in Figure 10 should be interpreted with caution because the equilibrium volume of the attachment is not well known. Under the given model-input parameters, in 1999 approximately 60 percent of the net transport is reaching northern Assateague Island. The analytical model was applied to calculate the recovery of the ebb-tidal shoal and change in bypassing rates at Ocean City Inlet in response to hypothetical mining of the bypassing bar. Limited quantitative work has been done to estimate the consequences of ebb-shoal mining (e.g., Mehta, Dombrowski, and Devine 1996; Cialone and Stauble 1998). Walther and Douglas (1993) reviewed the literature and applied an analytical model to three inlets in Florida to estimate recovery time of the shoal and bypassing rates. No time lag was included in their model, but it does yield different responses depending upon depth and location of the mining, factors not included in the present version of the reservoir model. For this example, one million cubic yards were removed from the bypassing bar in the year 2000, which is about 30 percent of the material comprising the bar at that time. The evolution of the bar volume and the bypassing rates from the bar and from the attachment bar to the beach is plotted in Figure 11. The volume was normalized by VBe and the bypassing rates by Qin. Mining at the year 2000 stage of development is predicted to translate the bar growth and bypassing rates approximately 20 years back in time, with the bypassing rate to the beach moving from about 0.6 to 0.45 of the potential maximum value of Qin. This example with simplified conditions is not adequate for design, but it does indicate possible applicability of the model in comparison of
11
ERDC/CHL CHETN-IV-39 March 2002
1920 1940 1960 1980 2000 2020 20400
0.1
0.2
0.3
0.4
0.5
0.6
0.7
0.8
0.9
1
Year
Byp
assi
ng R
ates
/Qin
Shoal Bar Attachment
Figure 10. Calculated bypassing rates, Ocean City Inlet
VB/VBe
QA/Qin
QB/Qin
No mining
After mining
1920 1940 1960 1980 2000 2020 2040
Year
0.0
0.1
0.2
0.3
0.4
0.5
0.6
0.7
0.8
V B/V
Be,
(QB) o
ut/Q
in,
(QA) o
ut/Q
in
Figure 11. Hypothetical example of bypassing bar volume and bypassing rates with and without mining, Ocean City Inlet
alternative mining plans. More rigor could be introduced through inclusion of a time-dependent Qin and estimation of the consequences of ranges of variability in the governing parameters. CONCLUSIONS: The reservoir model of bypassing and ebb-shoal evolution requires inputs that are compatible with the amount and quality of data typically available in engineering and science studies. Such data are the longshore transport rate, which may be the net or gross rate depending on the inlet configuration; estimates of the equilibrium volumes of the ebb shoal, bypassing bar, and attachment bar; and qualitative understanding of sediment pathways at the
12

ERDC/CHL CHETN-IV-39 March 2002
particular inlet. The model predicts a delay in sand bypassing to the downdrift beach according to the properties of the morphologic system and longshore transport rate. It is robust in that solutions are bounded. The ratio of input longshore transport rate and equilibrium volume of the morphological feature is the main parameter governing volume change and bypassing rates. Separating the ebb shoal and the bypassing bar adds conceptual and quantitative resolution by allowing bypassing bars to develop and evolve according to the properties of the waves (longshore sediment transport) and tidal prism. However, a simplified version of the model can combine these two sand bodies, as done for the Jupiter Inlet example. The model as presented in this CHETN does not account for sediment exchange between the inlet channel and flood shoal. However, it has been extended to describe such interactions (Militello and Kraus 2001) and will be described in a future CHETN in this series, after the user interface is developed. ADDITIONAL INFORMATION: Questions about this technical note can be addressed to Dr. Nicholas C. Kraus (601-634-2016; e-mail: [email protected]). For information about the Coastal Inlets Research Program, please contact the Program Manager, Dr. Kraus. This technical note should be cited as follows:
Kraus, N. C. (2002). “Reservoir model for calculating natural sand bypassing and change in volume of ebb-tidal shoals, Part I: Description,” ERDC/CHL CHETN-IV-39, U.S. Army Engineer Research and Development Center, Vicksburg, MS. http://chl.wes.army.mil/library/publications/chetn/
REFERENCES: Bruun, P., and Gerritsen, F. (1959). “Natural bypassing of sand at coastal inlets,” Journal of Waterways
and Harbors Division 85(4), 75-107.
. (1960). “Stability of tidal inlets.” North Holland Pub. Co., Amsterdam, 123 pp.
Bruun, P., Mehta, A. J., and Johnsson, I. G. (1978). “Stability of tidal inlets.” Developments in Geotechnical Engineering, 23, Elsevier, New York, 510 pp.
Carr, E. E., and Kraus, N. C. (2001). “Morphologic asymmetries at entrances to tidal inlets,” Coastal and Hydraulics Engineering Technical Note CHETN-IV-33, U.S. Army Engineer Research and Development Center, Vicksburg, MS.
Cialone, M. A., and Stauble, D. K. (1998). “Historic findings on ebb shoal mining,” Journal of Coastal Research 14(2), 537-563.
Dean, R. G., and O’Brien, M. P. (1987). “Florida’s east coast inlets: Shoreline effects and recommended action,” Report No. UFL/COEL-87/017, Coastal and Oceanographic Engineering Department, University of Florida, Gainesville, FL, 65 pp.
Dean, R. G., and Perlin, M. (1977). “Coastal engineering study of Ocean City Inlet, Maryland,” Proceedings Coastal Sediments ’77, American Society of Civil Engineers, Reston, VA, 520-540.
FitzGerald, D. M., Kraus, N. C., and Hands, E. B (2001). “Natural mechanisms of sediment bypassing at tidal inlets,” Coastal and Hydraulics Engineering Technical Note ERDC/CHL CHETN-IV-30, U.S. Army Engineer Research and Development Center, Vicksburg, MS.
13

ERDC/CHL CHETN-IV-39 March 2002
14
Gaudiano, D. J., and Kana, T. W. (2000). “Shoal bypassing in South Carolina tidal inlets: Geomorphic variables and empirical predictions for nine mesoscale inlets,” Journal of Coastal Research 17(2), 280-291.
Kraus, N. C. (1998). “Inlet cross-sectional area calculated by process-based model,” Proceedings 26th Coastal Engineering Conference, ASCE, 3,265-3,278.
. (1999). “Analytical model of spit evolution at inlets,” Proceedings Coastal Sediments ’99, ASCE, Reston, VA, 1,739-1,754.
. (2000a). “Prediction of ebb-shoal evolution and sand bypassing,” Proceedings 13th Annual National Conference on Beach Preservation Technology, Florida Shore & Beach Preservation Association, Tallahassee, FL, 268-280.
. (2000b). “Reservoir model of ebb-tidal shoal evolution and sand bypassing,” Journal of Waterway, Port, Coastal, and Ocean Engineering 126(3), 305-313.
Leatherman, S. P. (1984). “Shoreline evolution of North Assateague Island, Maryland,” Shore and Beach 52(3), 3-10.
Mehta, A. J., Dombrowski, M. R., and Devine, P. T. (1996). “Role of waves in inlet ebb delta growth and some research needs related to site selection for delta mining,” Journal of Coastal Research, Special Issue 18, 121-136.
Militello, A., and Kraus, N. C. (2001). “Shinnecock Inlet, New York, site investigation, Report 4, evaluation of flood and ebb shoal sediment source alternatives for the West of Shinnecock Interim Project, New York,” Technical Report ERDC/CHL TR-98-32, Coastal Inlets Research Program, U.S. Army Research and Development Center, Coastal and Hydraulics Laboratory, Vicksburg, MS
Rosati, J. D., and Ebersole, B. A. (1996). “Littoral impact of Ocean City Inlet, Maryland, USA,” Proceedings 25th Coastal Engineering Conference, ASCE, Reston, VA, 2,779-2,792.
Stauble, D. K. (1997). “Appendix A: Ebb and flood shoal evolution,” In: “Ocean City, Maryland, and vicinity water resources study, draft integrated feasibility report and environmental impact statement,” U.S. Army Engineer District, Baltimore, Baltimore, MD.
Underwood, S. G., and Hiland, M. W. (1995). “Historical development of Ocean City Inlet ebb shoal and its effect of Northern Assateague Island,” Report prepared for U.S. Army Engineer Waterways Experiment Station, Coastal Engineering Research Center, Vicksburg, MS, and for the National Park Service, Mid-Atlantic Region and Assateague Island National Seashore, 130 pp.
Walther, M. P., and Douglas, B. D. (1993). “Ebb shoal borrow area recovery,” Journal of Coastal Research, Special Issue 18, 221-223.
Walton, T. L., Jr., and Adams, W. D. (1976). “Capacity of inlet outer bars to store sand,” Proceedings 15th Coastal Engineering Conference, ASCE, Reston, VA, 1,919-1,937.