Reservoir Fluids Lecture 8
39
PETR 2313: Petroleum Reservoir Fluids Class 8: Sep 17, 2015 1
description
Chapter 2- Phases of the Properties of Petroleum Fluids PETR 2313
Transcript of Reservoir Fluids Lecture 8
PETR 2313: Petroleum Reservoir Fluids
Class 8: Sep 17, 2015
1
Two-‐component Mixture

Phase Diagram of Two Component Systems • Phase Rule Analysis – F = 2-‐NP+2 = 4-‐Np
– NP =1 Fmax=3 – F = 0 Np,max=4
• Thus, a 3-‐D diagram is required (T, P, x) • For convenience, one of the variables is usually fixed • Fixed T è P-‐x Diagram • Fixed P è T-‐x Diagram *Most commonly used
• Fixed x è P-‐T Diagram *Most important for petroleum engineers
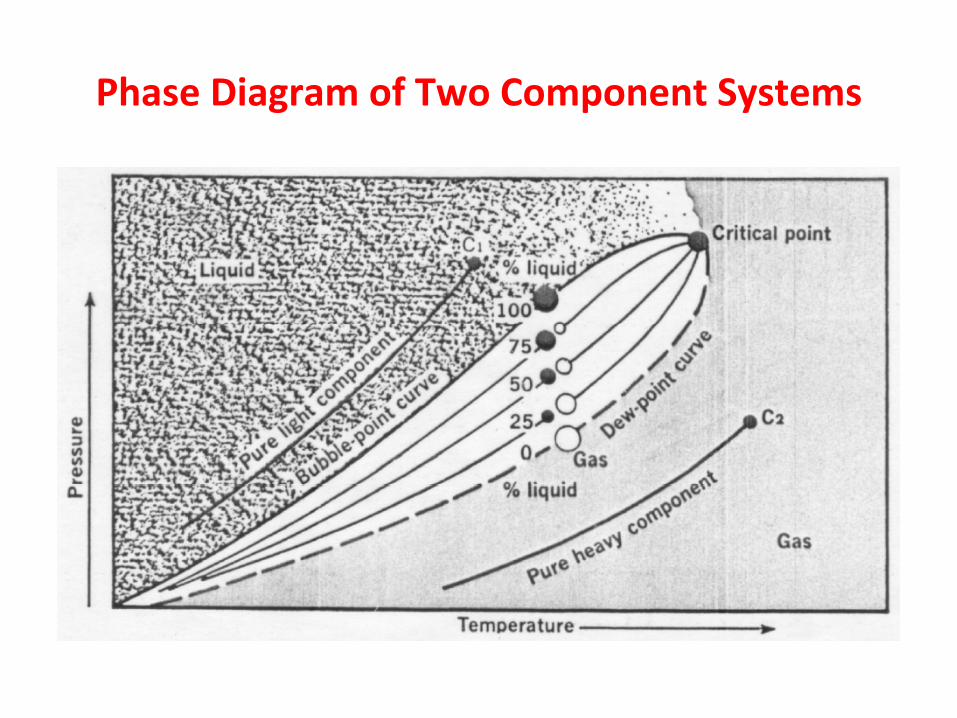
Phase Diagram of Two Component Systems

2-‐Component Mixtures • Degree of Freedom in the two phase region – F = 2+nc-‐np = 2; where nc=2, np=2 – At fixed T and P, the composiOon of liquid and gas is fixed. – At fixed T and iniOal composiOon, the fracOon of liquid and gas varies with pressure of the system.
• Bubble-‐point line and Dew-‐point line join at criOcal point • Bubble point: at which the first drop of a liquid mixture
begins to vaporize. • Dew point: at which the first drop of a gaseous mixture
begins to condense.
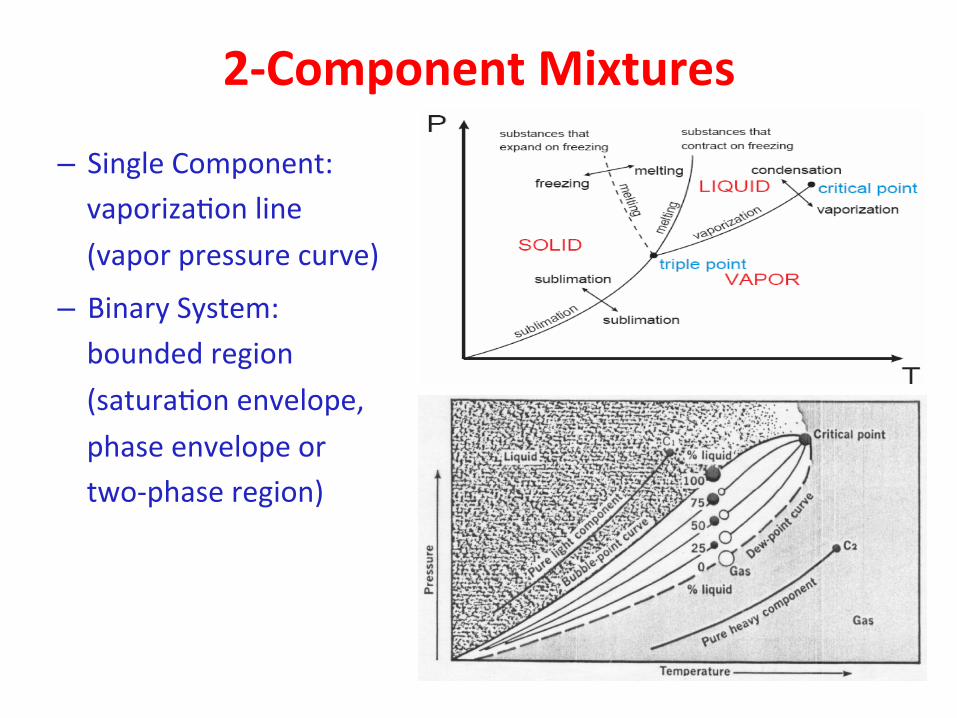
2-‐Component Mixtures
– Single Component: vaporizaOon line (vapor pressure curve)
– Binary System: bounded region (saturaOon envelope, phase envelope or two-‐phase region)

CriJcal Point • CriOcal point: at which point all properOes of the liquid and gas become idenOcal.
• For a 2-‐component mixture, liquid and gas can coexist at T and P above the criOcal point.
• OXen criOcal temperature of a mixture lies between that of the two pure components
• CriOcal pressure of a two-‐component mixture will be higher than the criOcal pressure of either component

Ethane – n-‐Heptane Mixtures

Cricondentherm and Cricondenbar
• Cricondentherm: Highest temperature on the saturaOon envelope
• Cricondenbar: Highest pressure on the saturaOon envelope
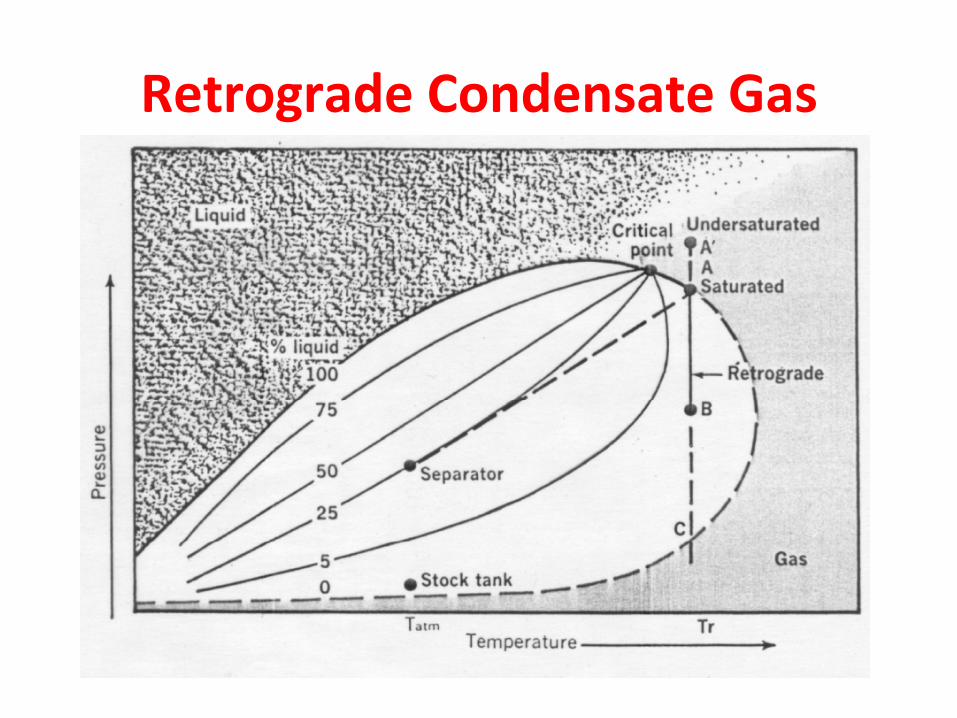
Retrograde Condensate Gas
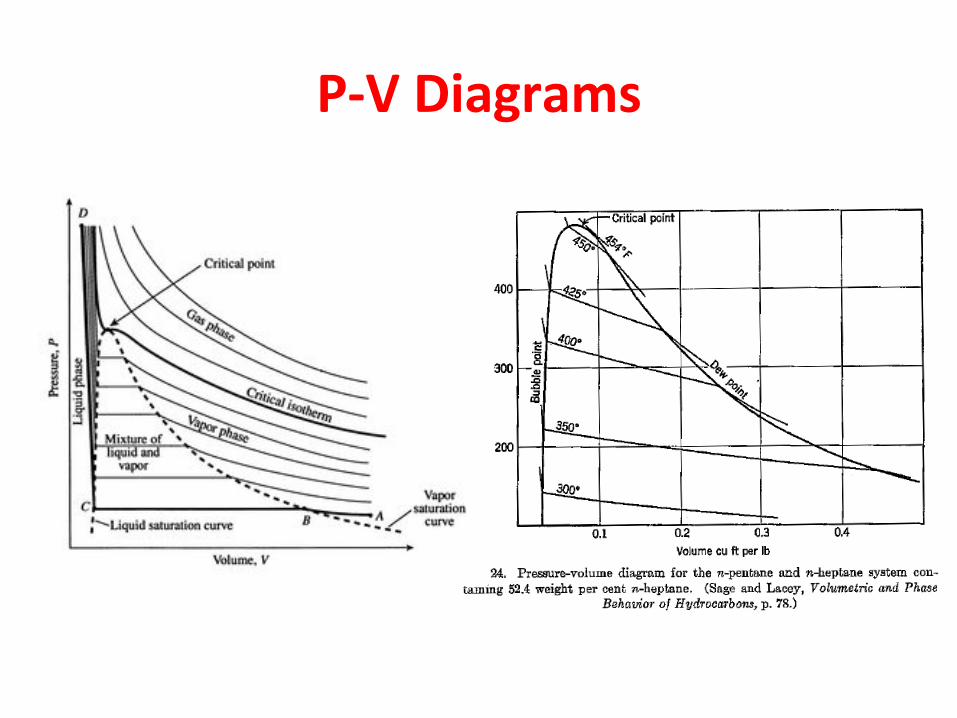
P-‐V Diagrams
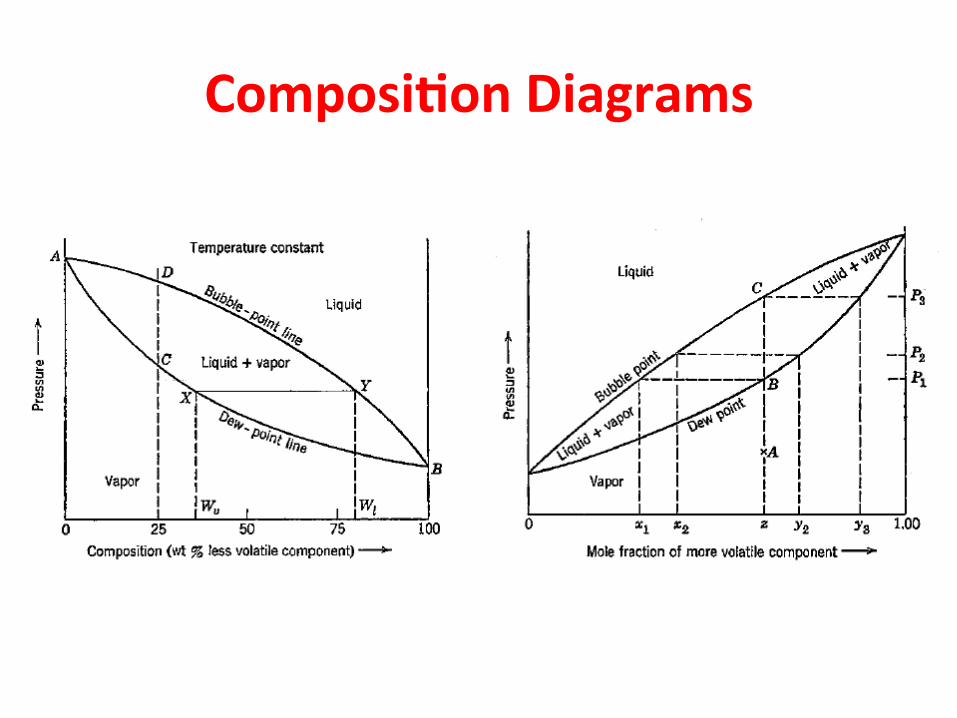
ComposiJon Diagrams

Lever Rule

Lever Rule
• Bubble-‐point line gives the composiOon of the equilibrium liquid (point 2)
• Dew-‐point line gives the composiOon of the equilibrium gas (point 3)
• The lengths of the Oe-‐lines represent the quanOOes of gas and liquid at equilibrium – Gas:
– Liquid:
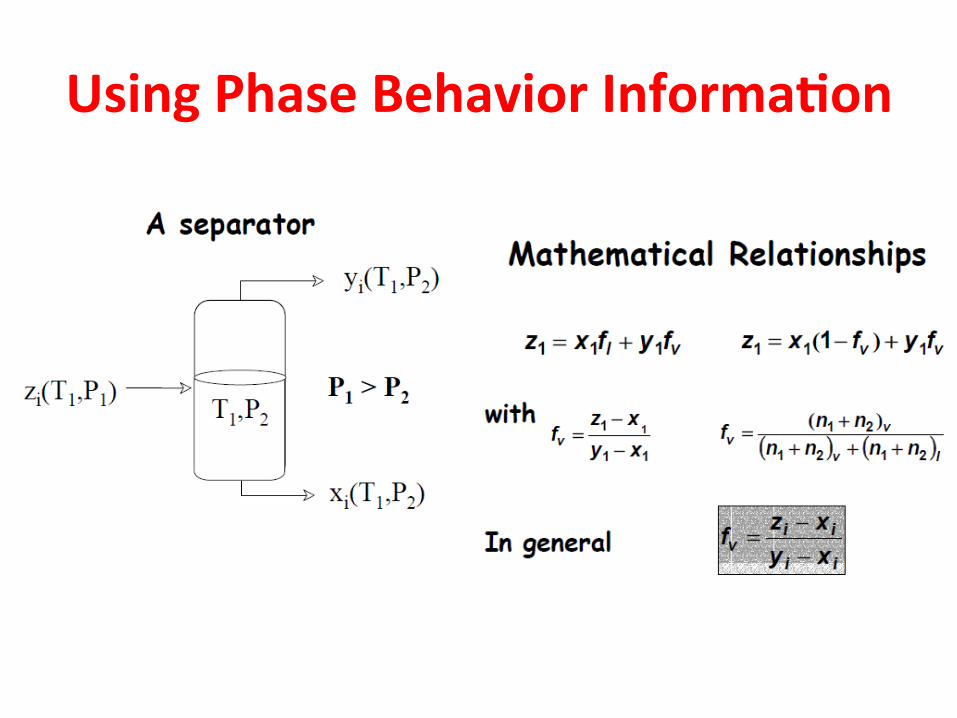
Using Phase Behavior InformaJon
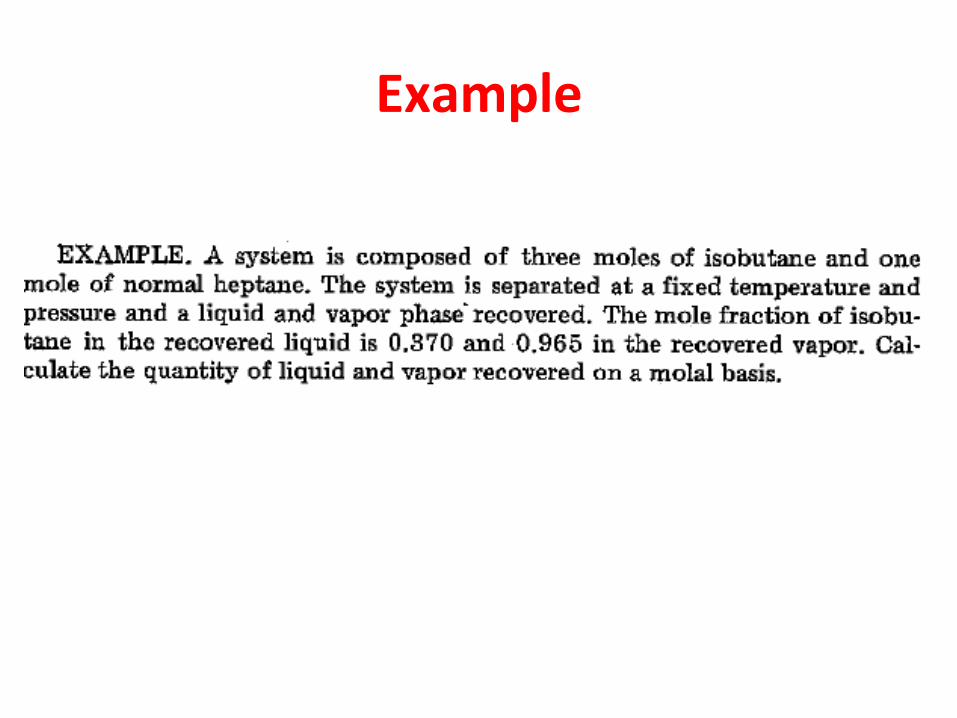
Example
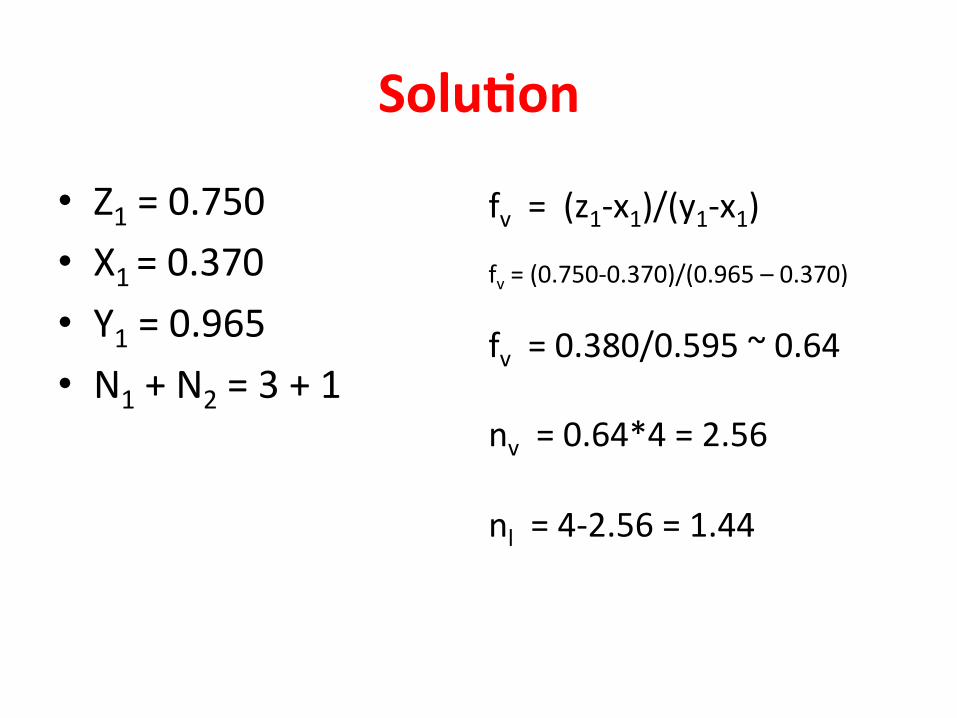
SoluJon
• Z1 = 0.750 • X1 = 0.370 • Y1 = 0.965 • N1 + N2 = 3 + 1
fv = (z1-‐x1)/(y1-‐x1) fv = (0.750-‐0.370)/(0.965 – 0.370)
fv = 0.380/0.595 ~ 0.64 nv = 0.64*4 = 2.56 nl = 4-‐2.56 = 1.44

Three-‐component Mixture

3-‐Component systems
• Phase Rule Analysis – F = 3 – Np +2 = 5 -‐ Np
– Np, max = 5 – F = 4 when Np = 1 è 4-‐D
• If T or P is fixed, F = 3 è 3-‐D • If T, P are both fixed, F = 2 è 2-‐D * Most commonly used
• F = 2 è Mole fracOons of 2 components

Phase Diagram for 3-‐Component Systems
VerOces: pure substance Sides: mixture of 2 components Length of 34: ComposiOon of A Length of 35: ComposiOon of B Length of 36: ComposiOon of C Line 21: DiluOon line
Adding B to the original mixture of A and C

Three-‐component Mixtures

3-‐D Ternary Phase Diagram, p-‐x • 3-‐D phase diagram for mixture
of C4-‐C10-‐CO2 • Temperature is fixed, F = 3 • P + 2 composiOons
• Two-‐phase region is bounded by a surface that connects binary-‐phase envelopes (CO2-‐C10 and CO2-‐C4)
• The ternary phase diagram at any pressure is a horizontal slice through the triangular prism
hip://petrowiki.org/Phase_diagrams_for_EOR_processes

MulJcomponent Mixtures • Equilibrium Oe-‐lines are
straight but not horizontal
• Point 1: mixture of C1, C3, C7 • Point 2: ComposiOon of
equilibrium gas • Point 3: ComposiOon of
equilibrium liquid • Line 13: quality of gas (lever
rule) • Line 12: quality of liquid
(lever rule)
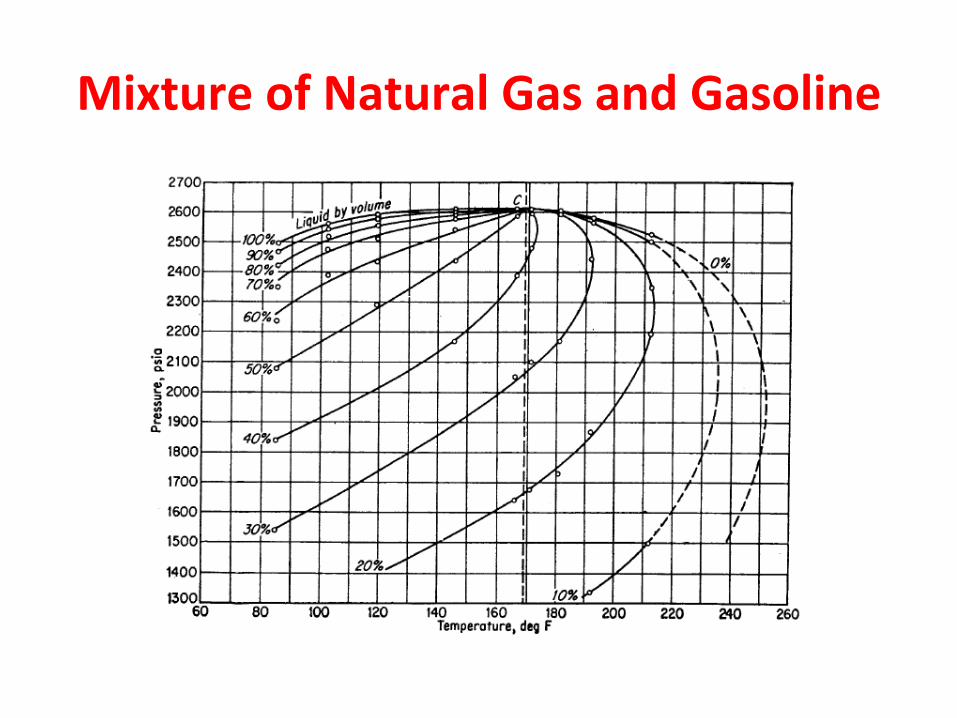
Mixture of Natural Gas and Gasoline

Phase Diagram for Reservoir Fluids
Davis et al., Trans., AIME 201,245. Copyright 1954 SPE-‐AIME Eilerts et al., U.S. Bureau of Mines, Monopra
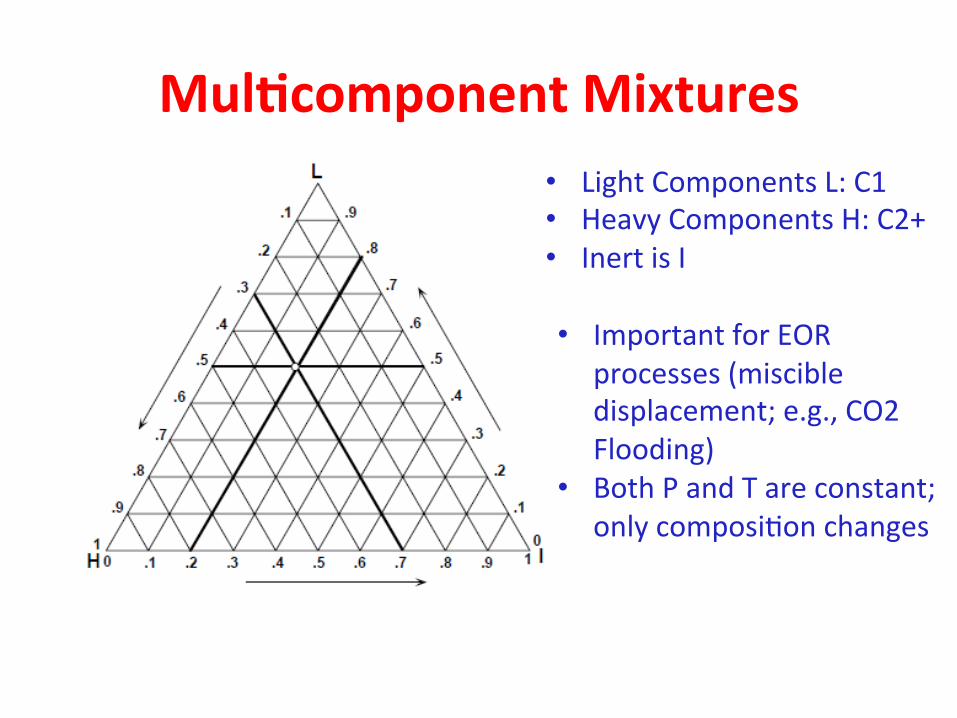
MulJcomponent Mixtures • Light Components L: C1 • Heavy Components H: C2+ • Inert is I • Important for EOR
processes (miscible displacement; e.g., CO2 Flooding)
• Both P and T are constant; only composiOon changes

Review

PvT Diagram for Water
P-‐T Diagram P-‐V Diagram
T-‐V Diagram

Single Component Pure Systems
A substance that has a fixed chemical composiOon throughout is called a pure substance Phase: A disOnct molecular arrangement that is homogenous throughout and separated from others by boundary surfaces. Solids Liquids Gases
Intensive vs. Extensive ProperOes P, V, T
Phase Changes of Water

The Phase Rule • Gibbs Phase Rule
F = 2+Nc-‐Np Where: F is the number of degree of freedom Nc is the number of components Np is the number of phases 2 represents two variables (T and P)
• For single component system – Np =1 F=2, an area on P-‐T diagram – Np =2 F=1, a curve on P-‐T diagram – Np =3 F=0, a dot on P-‐T diagram
30
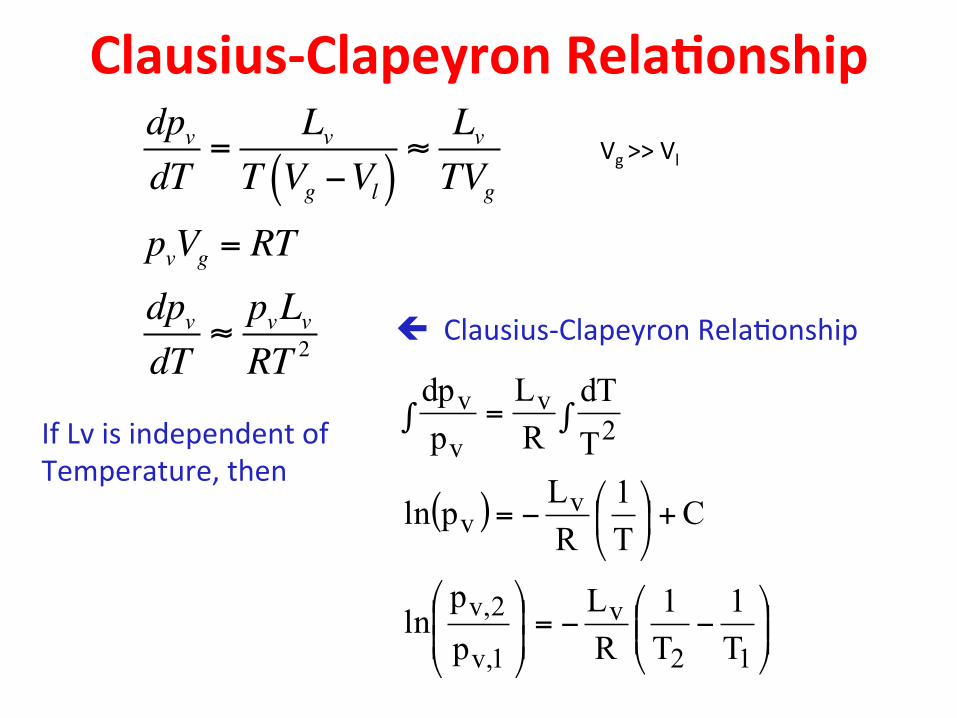
Clausius-‐Clapeyron RelaJonship dpvdT
=Lv
T Vg −Vl( )≈LvTVg
pvVg = RTdpvdT
≈pvLvRT 2
ç Clausius-‐Clapeyron RelaOonship
If Lv is independent of Temperature, then
( )
⎟⎟⎠
⎞⎜⎜⎝
⎛−−=⎟
⎟⎠
⎞⎜⎜⎝
⎛
+⎟⎠
⎞⎜⎝
⎛−=
∫ ∫=
12
v
1,v
2,v
vv
2v
v
v
T1
T1
RL
pp
ln
CT1
RLpln
TdT
RL
pdp
Vg >> Vl
Clausius-‐Clapeyron RelaJonship • AssumpOons made: – Heat of vaporizaOon is constant – The molar volume of the liquid is negligible comparing to that of the gas
Both assumpOons are invalid, near TC, the molar volume of the liquid is too large to be neglected • Thus, the vapor pressure graph usually results in a line with some curvature

Cox Charts

P-‐V Diagram with Isotherms

Phase Diagram of Two Component Systems
• Phase Rule Analysis – F = 2-‐NP+2 = 4-‐Np
– NP =1 Fmax=3 – F = 0 Np,max=4
• Thus, a 3-‐D diagram is required (T, P, x) • For convenience, one of the variables is usually fixed • Fixed T è P-‐x Diagram • Fixed P è T-‐x Diagram *Most commonly used
• Fixed x è P-‐T Diagram *Most important for petroleum engineers

Phase Diagram of Two Component Systems

Retrograde Condensate Gas
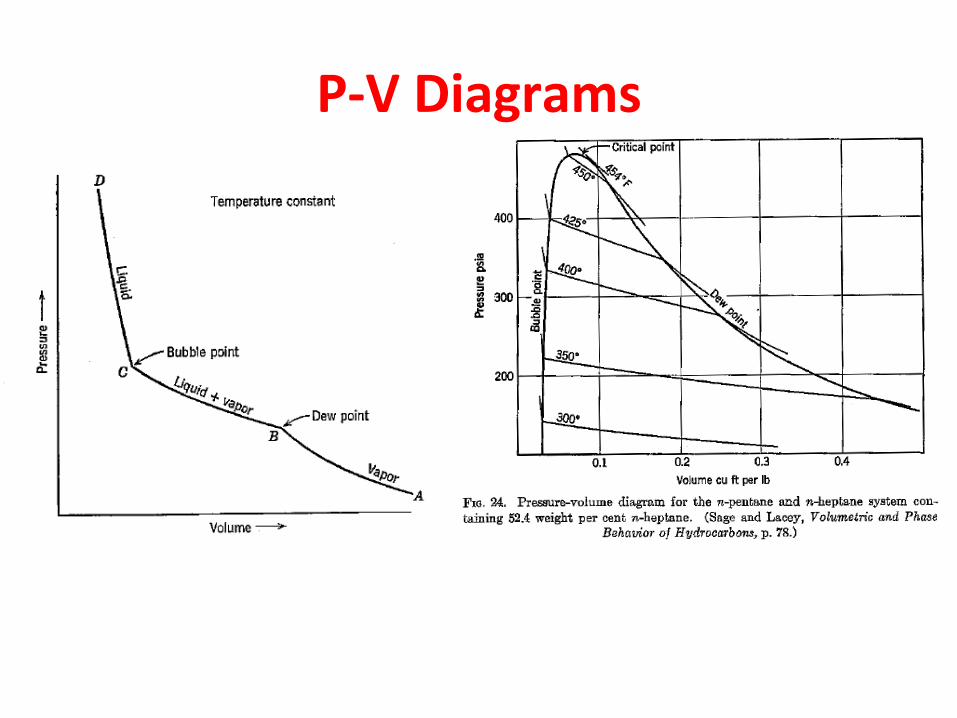
P-‐V Diagrams

ComposiJon Diagrams