Reservoir description: A synergistic approach to more ... · Reservoir description: A synergistic...
28
Geol. Soc. Malaysia, Bulletin 27, November 1990; pp. 183 - 210 Reservoir description: A synergistic approach to more accurate determination of oil and gas reserves D G BOWEN*, T KENNAIRD*, J HILL * & E J FROST** WESTERN ATLAS INTERNATIONAL INC *CORE LABORATORIES DIVISION ** ATLAS WIRELINE DIVISION Abstract: Many Oil and Gas producing companies in Asia are discovering that their major fields have significantly more recoverable reserves and oil in place than originally estimated. Inadequate Reservoir Description by traditional methods has been identified as a major contribution to this phenomenon. Presented here is a selection of possible causal factors, chosen from case histories in the area, and a practical, systematic approach to the evaluation of data normally acquired at different scales of measurement. This data includes: Processed Seismic data, Well Test data, Well Log data and Core Derived data. Particular emphasis is placed upon the synergy between these parameters in their application to Reservoir Description. INTRODUCTION Over the past several years, production decline curves and material balance data generated for several ofthe major producing fields in South-East Asia have demonstrated far greater hydrocarbon reserves than originally estimated using traditional methods. While such a discovery may be celebrated initially, it is a situation which must be quickly resolved by effective Reservoir Description since it can impact several economic variables, some of which are shown below: • decision to extend production sharing contracts • equity agreements • upgrade of production facilities • drilling infill and reservoir delineation wells • equity stock price of producing company It is apparent that reservoirs are effectively described (and therefore can be efficiently managed (Core Laboratories, 1988)) only when suitable data are a,vailable at the following levels (Amaefule et al., 1988). • Gigascopic (field level, e. g. suitably processed seismic data) • Megascopic (well level, e. g.log analysis, well testing) Presented at GSM Petroleum Geology Seminar 1989
Transcript of Reservoir description: A synergistic approach to more ... · Reservoir description: A synergistic...

Geol. Soc. Malaysia, Bulletin 27, November 1990; pp. 183 - 210
Reservoir description: A synergistic approach to more accurate determination of oil and gas reserves
D G BOWEN*, T KENNAIRD*, J HILL * & E J FROST**
WESTERN ATLAS INTERNATIONAL INC
*CORE LABORATORIES DIVISION
** ATLAS WIRELINE DIVISION
Abstract: Many Oil and Gas producing companies in Asia are discovering that their major fields have significantly more recoverable reserves and oil in place than originally estimated.
Inadequate Reservoir Description by traditional methods has been identified as a major contribution to this phenomenon.
Presented here is a selection of possible causal factors, chosen from case histories in the area, and a practical, systematic approach to the evaluation of data normally acquired at different scales of measurement. This data includes: Processed Seismic data, Well Test data, Well Log data and Core Derived data.
Particular emphasis is placed upon the synergy between these parameters in their application to Reservoir Description.
INTRODUCTION
Over the past several years, production decline curves and material balance data generated for several ofthe major producing fields in South-East Asia have demonstrated far greater hydrocarbon reserves than originally estimated using traditional methods.
While such a discovery may be celebrated initially, it is a situation which must be quickly resolved by effective Reservoir Description since it can impact several economic variables, some of which are shown below:
• decision to extend production sharing contracts
• equity agreements • upgrade of production facilities
• drilling infill and reservoir delineation wells
• equity stock price of producing company
It is apparent that reservoirs are effectively described (and therefore can be efficiently managed (Core Laboratories, 1988)) only when suitable data are a,vailable at the following levels (Amaefule et al., 1988).
• Gigascopic (field level, e. g. suitably processed seismic data)
• Megascopic (well level, e. g.log analysis, well testing)
Presented at GSM Petroleum Geology Seminar 1989
184 D. G. BOWEN, T. KENNAIRD, J. HILL & E.J. FROST
• Macroscopic (core level, e. g. analysis of core plugs or point data)
• Microscopic (pore level, e. g. petrographic analysis)
There are basically four ways to increase the computed hydrocarbon re-serves of an oil or gas reservoir:
• increase the geometric size of the reservoir (Gigascopic)
• increase the nit pay thickness in the reservoir (Megascopic)
• increase the storage capacity of the reservoir rock (Macroscopic)
• increase the hydrocarbon pore volume of the reservoir rock (Microscopic)
Each of these represents a difference in capacity at one of the scale levels we have outlined. We intend to show how causal phenomena, and their effect on hydrocarbon reserves, can be recognized.
POTENTIAL CAUSE OF UNDER-ESTIMATION OF RESERVES
On the Gigascopic scale, inadequate delineation of the areal extent and closure of a hydrocarbon bearing structure can result in massive under-estimation of reserves. Conventional 2D seismic processing and consequent mapping may entirely fail to recognize poorer quality reservoir rock, or extensive thinly laminated sands, especially when masked in the section by thicker good quality pay zones.
On the Megascopic scale, an inability to define the true thickness ("h") in a well test, and the fact that reservoir heterogeneity and anisotropy fail to satisfy the limiting assumptions of the analysis models, can lead to poor understanding of the portion of the reservoir actually contributing to flow at the well bore. Amaefule and Keelan (1989) show that the uncertainty in well test data, when the input variables are allowed to vary by as little as 10%, is as high as 25%.
Well log data is converted to usable quantitative data through algorithms based upon physical assumptions. Anyone, or more, of the variables can be erroneous. Choice of an incorrect formation water resistivity (Rw) is one possibility. Rw can be an extremely difficult parameter to establish. Produced well water may have a different composition from actual pore water (Campbell et al., 1984). Cockcroft and Robinson (1988) show that nearly all formation waters in South East Asia are impacted by the presence of meteoric waters. These meteoric waters were either persent in the environment of deposition or hydrodynamically emplaced over geologic time.
Generally hydrocarbon-zone pore waters appear to be more saline than the underlying aquifers. Ifwell-Iog analysis utilizes a salinity which is too low (Rw too high), then the water saturation (Sw) will be overestimated and hydrocarbon reserves underestimated.
RESERVOIR DESCRIPTION: A SYNERGISTIC APPROACH 185
Suppressed values off ormation resistivity (Rt) from electriclog data can also be a contributing causal effect. Suppression can occur in . the presence of dispersed clay minerals in the formation, in which case a representative shalysand analysis must be used. In addition, if the lithology comprises thinly laminated sand-silt or sand-shale sequences, the Rt will be further suppressed by the adjacent silt or shale beds. Suppressed Rt will cause further overestimation of Sw.
If the Archie relationship is used to compute Sw, then inappropriate selection of intercept, cementation exponent and saturation exponent values ("a", "m", and "n" respectively) can be a problem. "Standard" values, still often used in log analysis, are "a" = 1.0 "m" = 2.00 and "n" = 2.00, or the Hamble equation values "a" = 0.6 "m" = 2.15 and "n" = 2.00. Laboratory data derived from the argillaceous clastic formations of South East Asia usual prove these "m" and "n" values to be too high. Use of too high values of"m" and "n" will lead to overestimation of Sw.
Conventional logging tools, applied in formations where thinly laminated bed sequences exist, can either fail to distinguish, of severely under-estimate, the bed boundaries and the Rt of thin productive sands. Subsequent bulk storage capacity (0h) will be under-estimated.
A further consequence of the "Thin Bed Effect" can be to cause overestimation of shale volume (V sh) from the logs of the producing sands due to the higher natural gamma response, slower acoustic travel times and anomalous neutron log response.
It should be noted that, in our experience, porosity determination from the logs generally matches well with core data and, therefore, does not appear to be the most dominant factor in the under-estimation of reserves in South East Asia.
Causes of under-estimation of reserves are usually associated with attempts to delineate reservoirs with only a selection of data at the Gigascopic and Megascopic scales. Macroscopic and Microscopic data are often lacking, or not applied.
OBTAINING REPRESENTATIVE DATA
Combined use of 3D seismic, vertical seismic profiling (vsp) and well test analysis is widely used today to determine the reservoir spatial boundaries. In many cases, the simple expedients of drilling deeper and testing low resistivity shows have led to more accurate delineation of the location, size and quantity of reservoirs in a field.
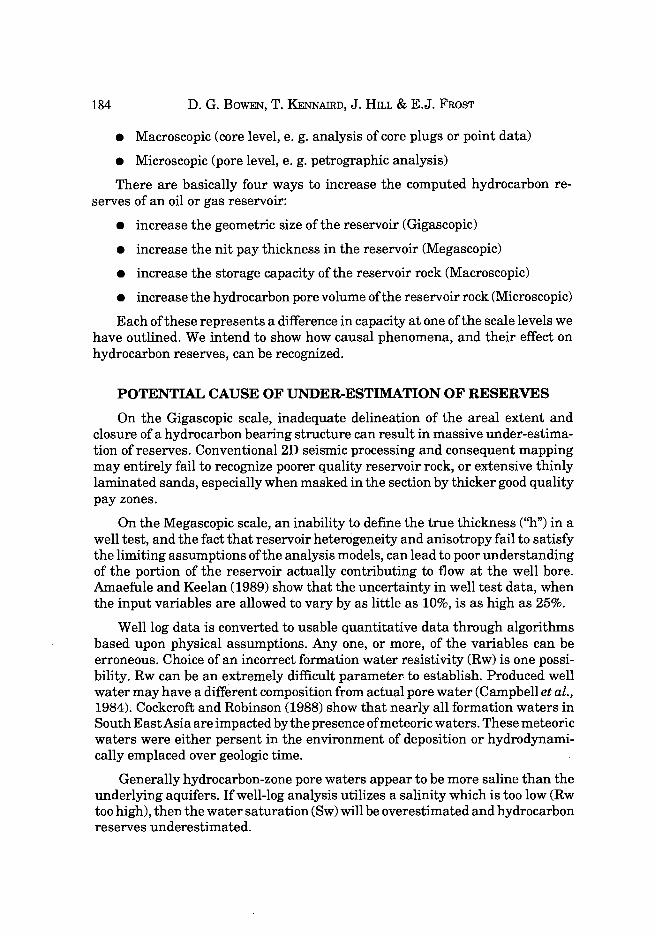
Bed thickness down to a scale of a few centimetres can now be resolved by high sampling rate (hsr) logs. Electrical and acoustical formation dip and imaging devices (Faraguna et al., 1989; Strozeski et al., 1989) can distinguish beds as small as 1 cm in thickness. Figure 1 shows a comparison of the resolution capabilities <.>f acoustic dip and acoustic imaging instruments. Certain dielectric
186 D. G. BOWEN, T. KENNAIRD, J. HILL & E.J. FROST
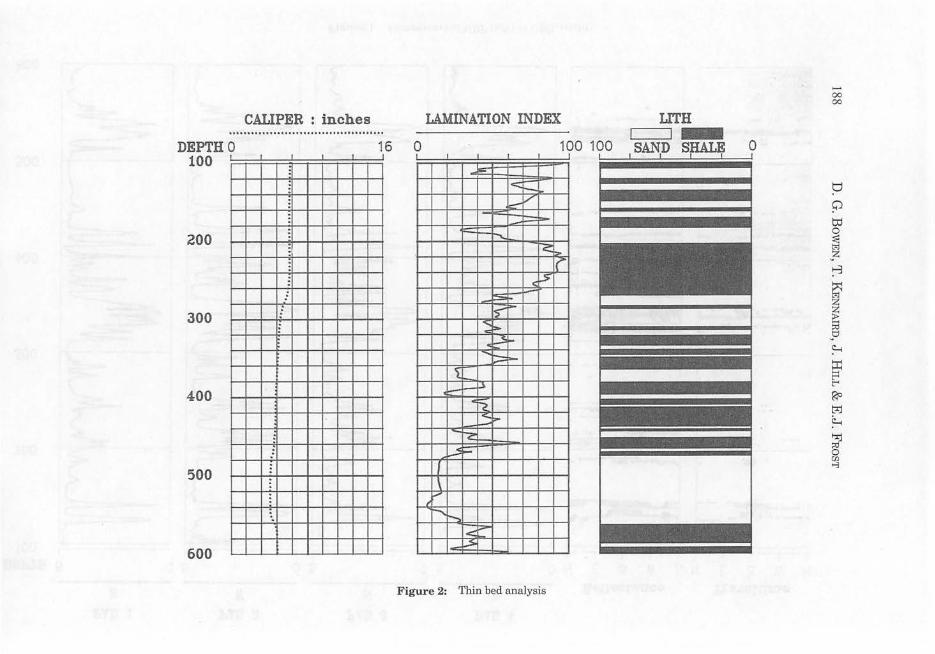
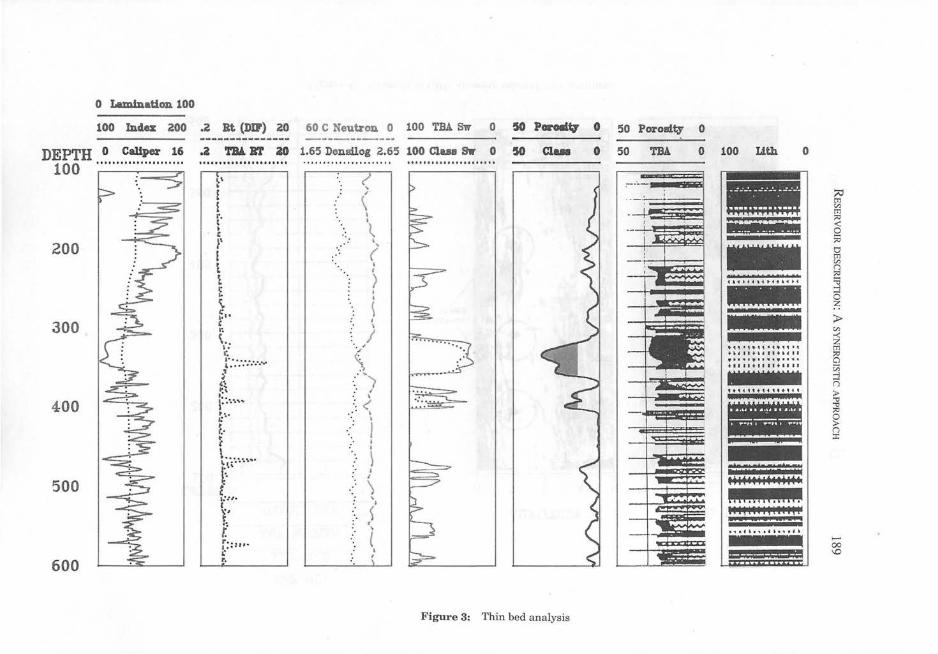
and resistivity devices can distinguish beds in the 5 cm to 8 cm range. With additional software enhancement, high resolution porosity logs can be used in beds of 10 cm to 15 cm. Such logs can be used for a complete analysis to establish hydrocarbon saturation provided the laminations are upwards of 10 cm in thickness. Figure 2 shows an example of analysis using a formation dip device to determine net sand while Figure 3 shows a complete analysis using a full suite of HSR high resolution logs.
Borehole Formation Imagery is now gaining acceptance as a device that can delineate very thin zones. In fact, a very detailed examination of the placement of sidewall cores and their actual orientation in the wellbore is available. Figure 4 shows the use of an acoustic imaging device in locating and orienting the sidewall cores taken on a previous run.
Rw values can be obtained from cores cut with bland, oil-base mud (OBM). Coring programmes of this type are in use throughout tlie region. Appendix 1 outlines the analytical details of such a programme. Several methods of direct and indirect determ.iD.ation of both Rw and Sw are discussed.
In wells drilled with oil-base muds, it is also possible to use dielectric measurements to determine the irreducible water saturation, Swi, of the formation (Eleventh European Formatipn Evaluation Symposium, 1988). The dielectric constant of fresh water is 78 and the dielectric constant of 100, 000 ppm NaCl solution is 81, as compared to a dielectric constant of around 2 for oil and 1 for gas. The dielectric constant is therefore primarily dependent on the type offluids present rather than the water salinity,
Surface tests on oil base muds exhibit very little loss of the oil-phase and, in fact, when oil base muds were introduced it was expected that they would exhibit good fluid control. However, it is now generally accepted that across permeable zones, it is the oil phase alone which invades and the fluid loss is not small, but large, resulting in deep invasion. As the oil phase invades, it displaces the original pore fluids of water and oil. The pressure differential between the mud column and the formation is normally sufficient to displace the moveable water in the water zone. Assuming no alteration of the wettability, the dielectric measurements are a direct measure on the undisplaced water. Assuming medium to deep invasion this measure ofundisplaced water is very close to the value ofSwi. In the oil leg, where water saturations are already at irreducible, the oil phase displaces formati~n oil, again resulting in a measure of irreducible water.
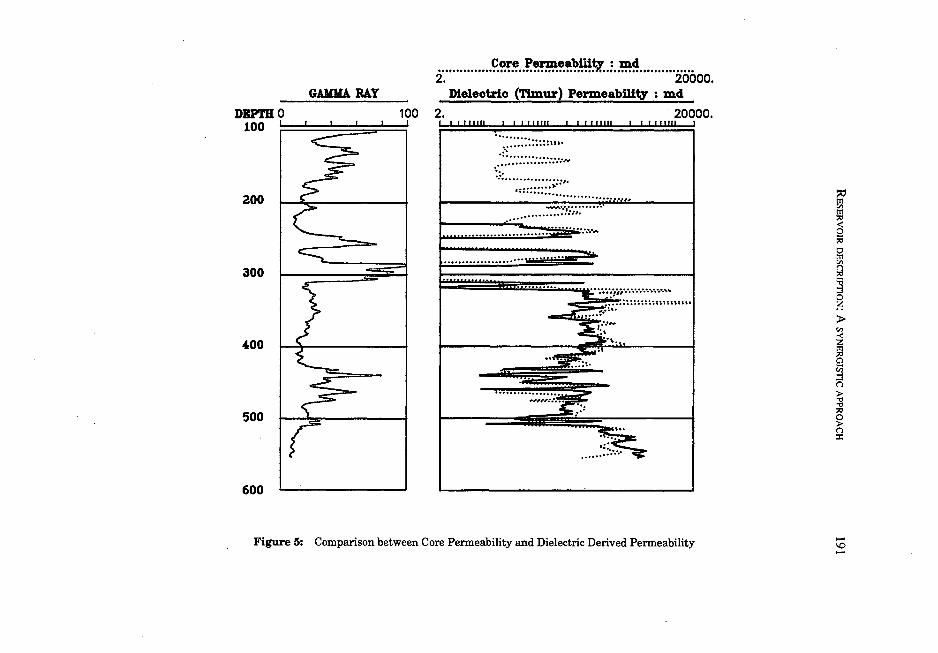
As the dielectric instruments are normally measuring the flushed zone, they can clearly identify zones of varying permeability depending on computed values of Swi. Data from the dielectric measurement of irreducible water can be easily correlated with core information to provide a reservoir transform for permeability. Figure 5 shows an example of application of this technique.
PAD 1 S
DBPTH 5 0 5
PAD a w
o 5
100 ~========~' F.' ~iiii:======1
200
300
400
500
600
PAD 3 N
o 5
PAD 4-B Reflectance
ON E S W NN Traveltime E S W N
~=====~' , , ;' :::;:;;;!::;;;;;;;;;;;;;;;:::;::;;;:! " .~ -
...
.' ".
:. ~~... f • - j ~~ __ I
. '
::: .. a., ... - ................... . r'
" '. f .roiiI"',;~_~tiIIij;-.4
Figure 1: Comparison ofUDP (left) vs CBIL (right)
-00 -.I
CALIPER : inches LAMINATION INDEX
DEPTH 0 16 0 100 100 100! d I : ~ I I I I I
~
c::: t--;:::-V
I-"" :-
200 '"'- - -...
C!:i"> I(
(..5
:s
300 5" ~ >-
,-5
;:::::: -'i
400 t:::-" i-~
~ .:::,.. -rz ~ ....
500 I \ ,.....
,...... ~
1< ::-
600 ...:~
Figure 2: Thin bed analysis
UTH
o
..... 00 00
t:!
P tJj o ~
vZ
~
~
I ~ ::r: ~ r<:o t:rj
~ "'J 1:5 en >'l
o LemlD..Uon 100
100 Index ZOO .Z at (DIP) ZO 60 C Neutron 0 100 TBA Sw 0 50 PoroIIlV 0 50 PorolllV 0
DEPTH 0 Caliper 16 100 ..................... . i »
200
300
400
500
600
.. __ ...... _ .. _------ ----------
.i 'l'BA BT act 1.65 Densllog 2.65 100 ClUII Sw 0 50 Cl ...
( ~\ • [ ! f' C }\
I l l E '\. c ~ .. c " \.: ,.
(a::::: ...... oI"
~ ,'. ~' I" I::···· .. ~ ... • t.· ~ t .. , ... · .... ·., ... · r E t::,· I \:. t. t f: : :,.. ,; P.
; , , \
\
• ~ • ( • I
) · , ~ • \
/ . , .-\ .. . ,
'1 , \
. ~ ·:.0.0
. \ , I • • \ I
I
\ , I
~ ~
t \
l , I
~
Figure 3: Thin bed analysis
o 50 TBA o
.*_.'_'- -
- I.
9 •
100 Lith o
- ;:0 m en m - .... '" -I-I Ii < Q '" - 0 m en n
~'i ~(. ~i "~i •• ~4 ~ - (5 z
I II II I » en -< z ........ , .. , ...... m + ••• I + •••• + •• I' ;0
........ I ......... 0 + ••• I + 11'1 + •• I. c;; IHqIqIq --l
n ••• i ,. + 'i"'" 4 • :>
..",
..",
'" 0 :> n :r:
t
W+I,. UI,II+I
"'''"'~"., .... UHIUHIUHI
.... f ~ ............
= = ==1 ..-00 1.0

o· .... · .. ·~~ .. MW ______ AMP ~ .... "'4000
o ------------___ AMP MED~--4doo o --------------GAMMA RAY 4000
DEPTH 0 100 I I I 130
zoo
300
400
500
600
i '\. i I I ~_ ... .. = \. I I ";17 )) 1: ~ IS:·· .. -"\ './-:. 1\ ':. 'j. '1.. •..• 'L -"
,,- .. ' i}\ ':.:
-'-T .··: , ~"" ) .'1 .' "!Y.',: (,& • 't· : J ' " ]1"';' ",,, :
f'\, ': a -·.
--.l.a '. itl\ .:' l.l~: " : \. ,,." .... ~J .', ; .. ;. . N/ , j' .;" (..
AMPIJTUDE
N s E
Figure 4: Example of CBIL showing sidewall core positions
TRAVEL TIME
....... \0 o
tj
o t::d o
~~ 1-3
~
.1 ~ ~
~ ~ I:.:rj
~
~ rn >-l
.......... , .... £~! .. ~~!~~~~ .. : .. ~~ .............. . 2. 20000.
GAIOIA. RAY Dielectric (Timur) PermeabWt,y : md
DBPTIIO 100 2. ·20000. 100 ' , -- I " I 11111 '" I "'II '" , 11111 " I II ,," I , ,
~.~.;j.:.:.:.:.:.:.:;.~.~.~.:.:;.:,.
zoo ::: ... :;;;;;;:::~:~~: ............ . ~ ...... :::!':i~:·· .. d
...................... 300
400
500
600
Figure 5: Comparison between Core Permeability and Dielectric Derived Permeability
~
! 1il
i >
I I
...... \0 ......
192 D. G. BOWEN, T. KENNAIRD, J. Hn.r. & E.J. FROST
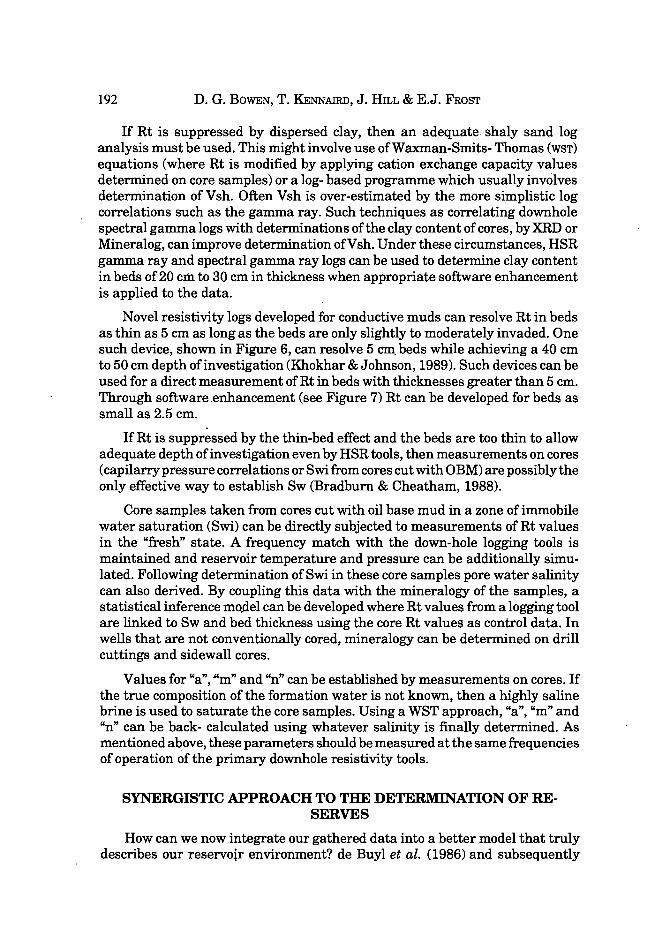
If Rt is suppressed by dispersed clay, then an adequate. shaly sand log analysis must be used. This might involve use of Waxman-Smits- Thomas (WST)
equations (where Rt is modified by applying cation exchange capacity values determined on core samples) or a log- based programme which usually involves determination ofVsh. Often Vsh is over-estimated by the more simplistic log correlations such as the gamma ray. Such techniques as correlating downhole spectral gamma logs with determinations of the clay content of cores, by XRD or Mineralog, can improve determination of V sh. Under these circumstances, HSR gamma ray and spectral gamma ray logs can be used to determine clay content in beds of20 cm to 30 cm in thickness when appropriate software enhancement is applied to the data.
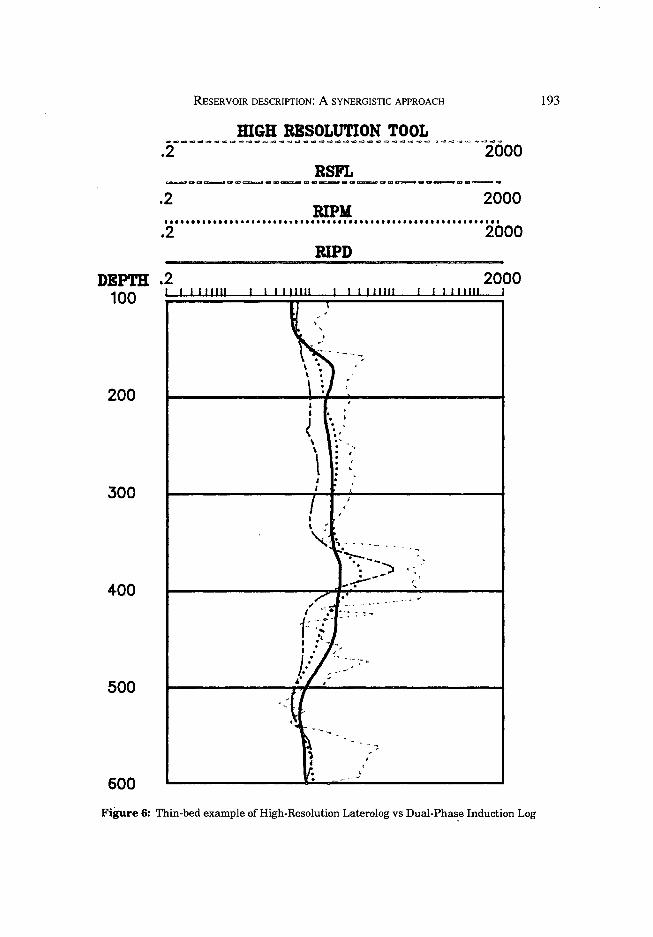
Novel resistivity logs developed for conductive muds can resolve Rt in beds as thin as 5 cm as long as the beds are only slightly to moderately invaded. One such device, shown in Figure 6, can resolve 5 cm, beds while achieving a 40 cm to 50 cm depth of investigation (Khokhar & Johnson, 1989). Such devices can be used for a direct measurement ofRt in beds with thicknesses greater than 5 cm. Through software .enhancement (see Figure 7) Rt can be developed for beds as small as 2.5 cm.
IfRt is suppressed by the thin-bed effect and the beds are too thin to allow adequate depth ofinvestigation even by HSR tools, then measurements on cores (capilarry pressure correlations or Swi from cores cut with OBM) are possibly the only effective way to establish Sw (Bradburn & Cheatham, 1988).
Core samples taken from cores cut with oil base mud in a zone of immobile water saturation (Swi) can be directly subjected to measurements ofRt values in the "fresh" state. A frequency match with the down-hole logging tools is maintained and reservoir temperature and pressure can be additionally simulated. Following determination of Swi in these core samples pore water salinity can also derived. By coupling this data with the mineralogy of the samples, a statistical inference mo.del can be developed where Rt values from a logging tool are linked to Sw and bed thickness using the core Rt values as control data. In wells that are not conventionally cored, mineralogy can be determined on drill cuttings and sidewall cores.
Values for "a", .<em" and "n" can be established by measurements on cores. If the true composition of the formation water is not known, then a highly saline brine is used to saturate the core samples. Using a WST approach, "a", "m" and "n" can be back- calculated using whatever salinity is finally determined. As mentioned above, these parameters should be measured at the same frequencies of operation of the primary downhole resistivity tools.
SYNERGISTIC APPROACH TO TIlE DETERMINATION OF RESERVES
How can we now integrate our gathered data into a better model that truly describes our reservoir environment? de Buyl et al. (1986) and subsequently
REsERVOIR DESCRIPTION: A SYNERGISTIC APPROACH 193
mGU RESOLUTION TOOL .2--_ ... _ .. ..:F ... - _ .. ...0 _ ... .., _ ...... =t __ A�O_ - - -_ ... - - - ~ 4 ... - >4 -..., -iooo RSFL
.2 2000 RIPII
•••••••••••••••••••••••••••••••••••••••••••••••••••••••••••••• . 2 2000
RIPD
DBPl'II .2 2000 100 I I '"'" ""'" ""'" , , , , ""
200 I
, I . •
~ . I . , ~I
\ ." ~ \ ~
\ I
i · • · , · 300 ,
400
500
600
Figure 6: Thin-bed example of High-Resolution Laterolog vs Dual-Phas.e Induction Log

194
DEPTH 100
200
300
400
500
600
D. G. BOWEN, T. KENNAIRD, J. HILL & E.J. FROST
CBIL Mean Amplitude TBRt
Corrected TBRt
Figure 7: Mean Acoustic Amplitude Dervied from CBIL. Thin-Bed Resistivity from TBRt Tool, and Thin-Bed Resistivity Corrected for shoulder effects Using the Mean Axoustic Amplitude to define Bedding Interfaces.

RESERVOIR DESCRIPTION: A SYNERGISTI C APPROACH 195
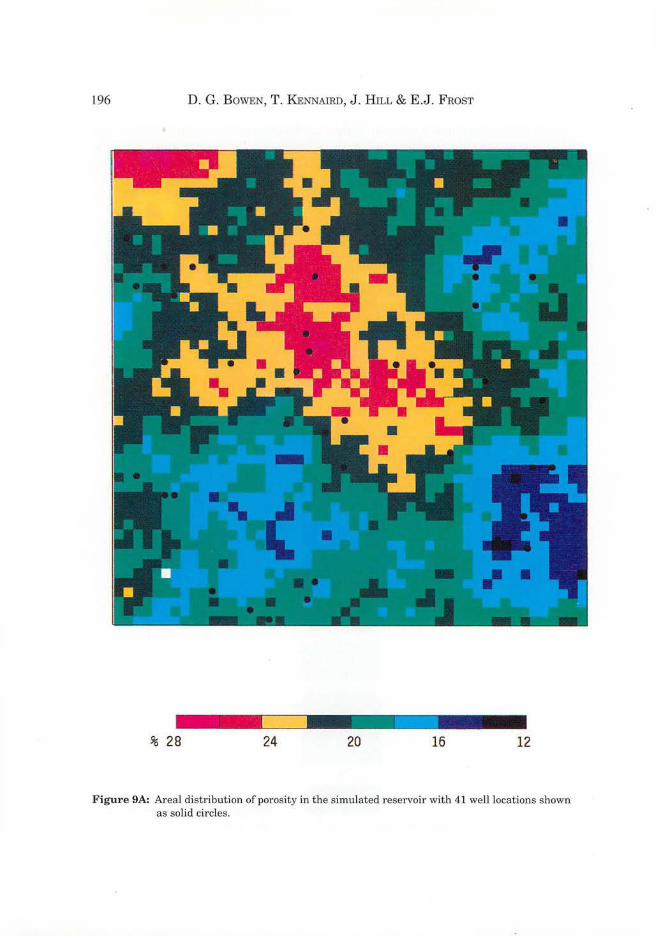
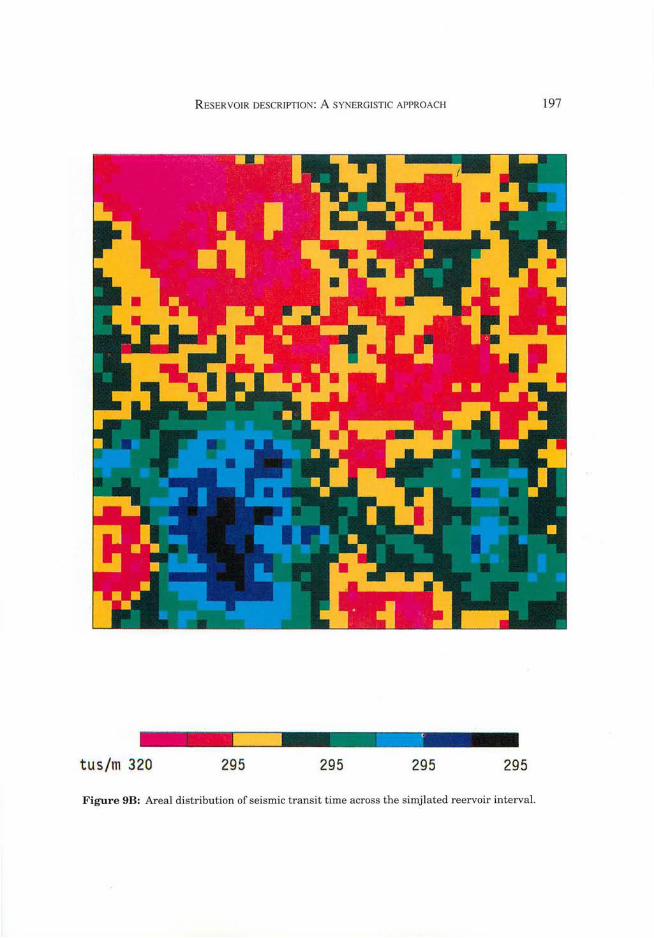
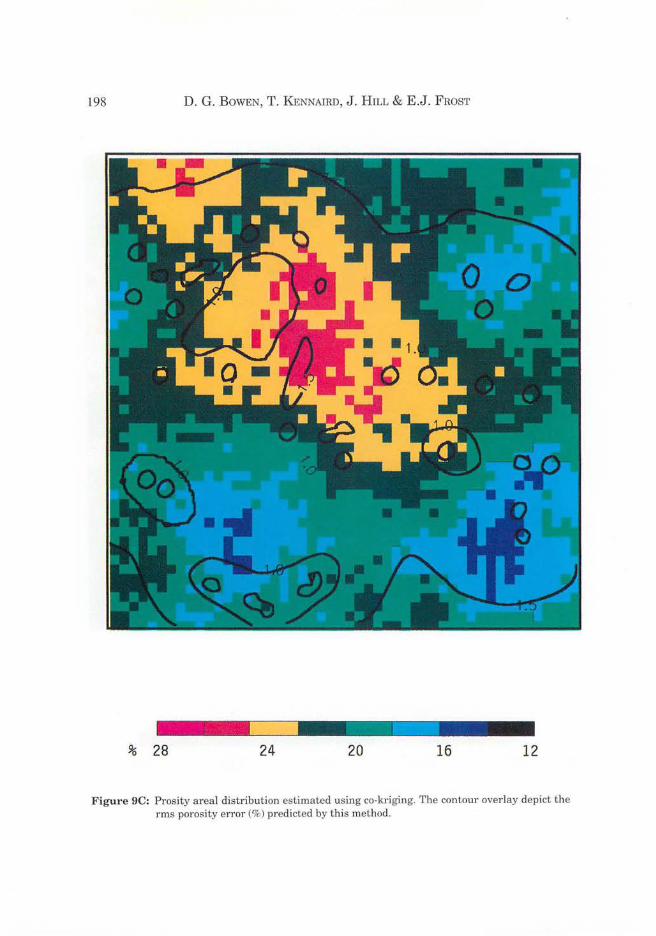
Doyen (1988) show how Reservoir Lithologic Modelling can be achieved through the integration of Macroscale core data, Megascale well log data and Gigascale 3D Seismic surveys(Figure 8). Application of these techniques in a probabilistic statistical approach, co-kriging, leads to reservoir-quality boundary mapping that matches very well with known data derived from multiple infield drilling (Figure 9)
Geological Data
Well Data
Prodllcti on Data
. ~ Section Heading
Figure 8: Reservoir Characterization Flow Chart
196 D. G. BOWEN, T. KENNAIRD, J. HILL & E.J. FROST
% 28 24 20 16 12
Figure 9A: Areal distribution of porosity in the simulated reservoir with 41 well locations shown as solid circles.
R ESERVOIR DESCRIPTION: A SYNERG ISTIC APPROACH 197
tus/m 320 295 295 295 295
Figure 9B: Areal distribut ion of seismic transit time across the simjlated reervoir interval.
198 D. G. BOWEN, T. KENNAIRD, J . HILL & E.J. FROST
% 28 24 20 16 12
Figure 9C: Prosity areal distribution estimated using co-kriging. The contour overlay depict the rms porosity error (%) predicted by this method.
RESERVOIR DESCRIPTION: A SYNERGISTIC APPROACH 199
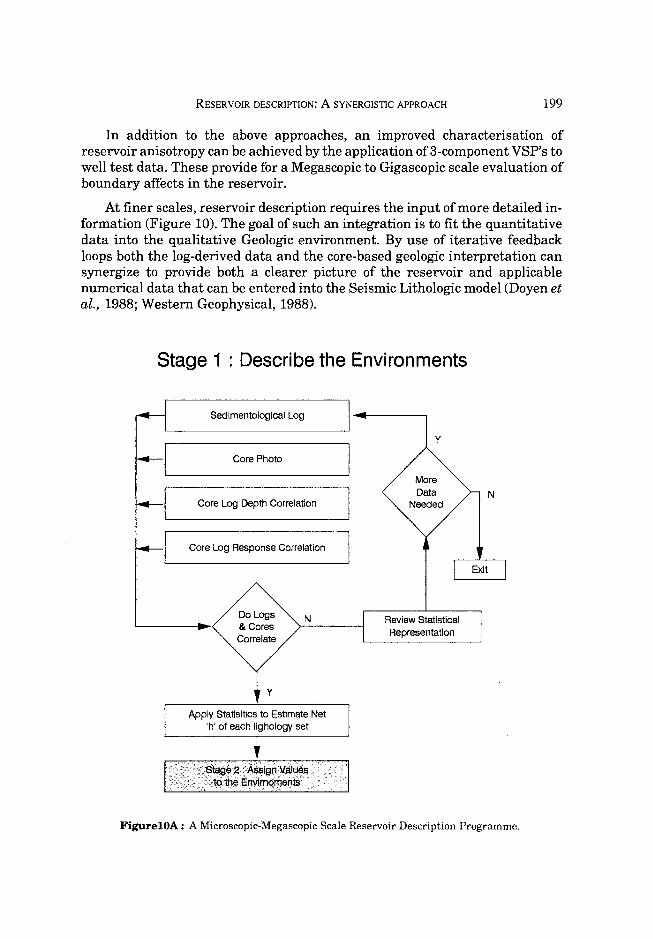
In addition to the above approaches, an improved characterisation of reservoir anisotropy can be achieved by the application of 3-component VSP's to well test data. These provide for a Megascopic to Gigascopic scale evaluation of boundary affects in the reservoir.
At finer scales, reservoir description requires the input of more detailed information (Figure 10). The goal of such an integration is to fit the quantitative data into the qualitative Geologic environment. By use of iterative feedback loops both the log-derived data and the core-based geologic interpretation can synergize to provide both a clearer picture of the reservoir and applicable numerical data that can be entered into the Seismic Lithologic model (Doyen et al., 1988; Western Geophysical, 1988).
Stage 1 Describe the Environments
Sedimentological Log
Core Photo
Core Log Depth Correlation
Core Log Response Correlation
Apply Statisitics to Estimate Net 'h' of each Jighology set
Review Statistical Representation
N
FigurelOA: A Microscopic-Megascopic Scale Reservoir Description Programme.
200 D. G. BOWEN, T. KENNAIRD, J. Hn.r. & E.J. FROST
Stage 2 . Assign Values to the Environments Make TIS of each Environment
(Cover all lithologies)
Quantltatlve Mineralogy by TIS of each lithology
Quantitative Mineralogy by Mlnnog of each lithology
Compute CEC values
Measure CEC values ~ each lithology
N
Deline Capillarity of Samples
Use Data Base from other wells
Measure laminae data from new cores by PIA
Measure Electrical Proper1les at multiple Frequencies to dellne 'a'.'m' & 'n'
Quantitative XRD to calibrate entire syatern
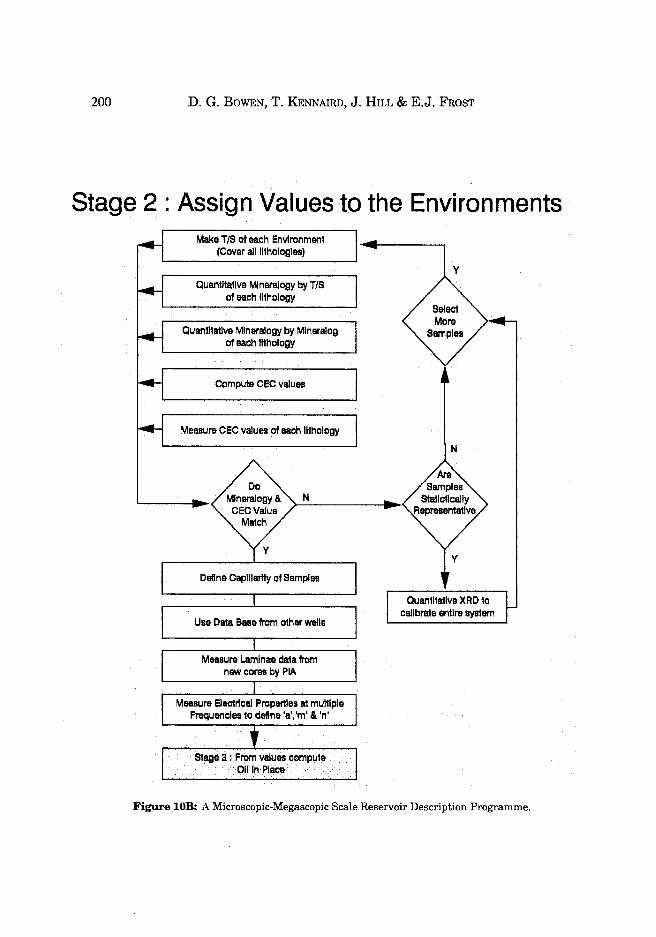
Figure lOB: A Microscopic-Megascopic Scale Reservoir Description Programme.
RESERVOIR DESCRIPTION: A SYNERGISTIC APPROACH 201
Stage 3 : From Values Compute Oil In Place
Compute Sw by Shaley-Sand Algorythm
Compute Sw from Capillary Pressures
y
N (See Appendix 2)
Review All Capillary Press Data
y
Revise Rw From Pore Water Salinity
Re-Compute Recoverable Reserves from New Oil In Place
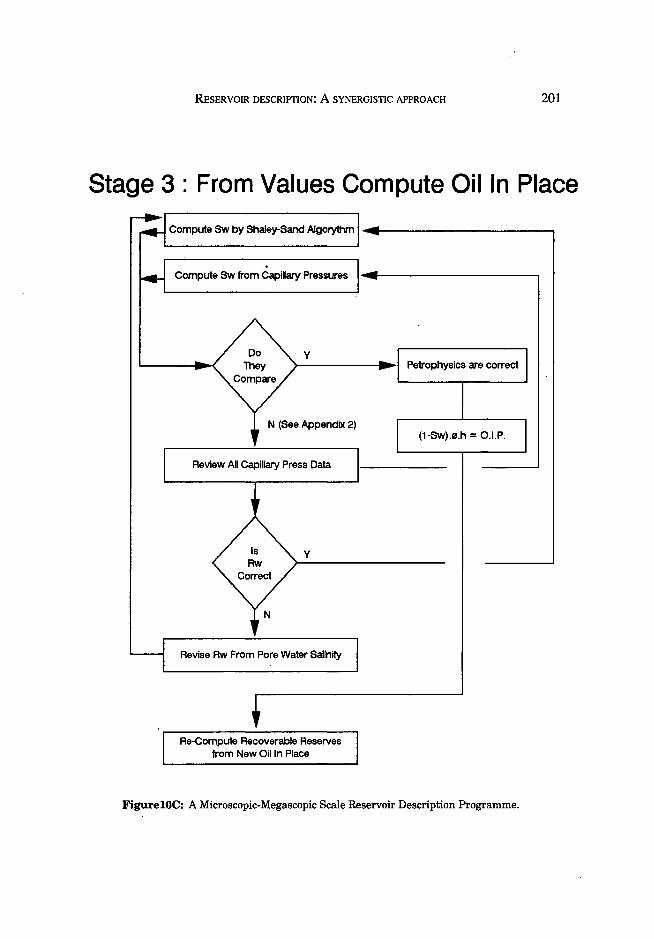
FigurelOC: A Microscopic-Megascopic Scale Reservoir Description Programme.

202 D. G. BOWEN, T. KENNAIRD, J. Hn.L & E.J. FROST
Techniques used in log analysis can be classified into two distinct categories. The first and more established is the group leading to deterministic approaches. Results are obtained by making use of pre-defined relationships, for example, equations for shale volume determine from gamma ray response. With this group,error analysis is rarely performed and the software programs are generally tailored to a subset of the measurements available on the well. In the second group, results are obtained through the use of statistical techniques and are more conducive to numerical integration of large varieties of data types. Error analysis is commonly performed, different degrees of data redundancy can be satisfactorily dealt with, and frequently they conStitute a set of "tools" which can be used with data of very different origins (i.e. wireline log measurements, laboratory core measurements and geological core descriptions).
The group of statistical programs can be further divided into two subgroups: Those which make use of explicit relationships (device response functions) and those which utilize implicit methods to derive the results. When implicit methods are used, no predetermined equations are required and the results are obtained by statistical inferences. Such techniques can be used to make inferences of numerical values such as porosity, saturation, permeability and acoustic travel time, or descriptive characteristics such as lithofacies, type of fluids to be produced and presence or absence of fracturing.
Implicit methods are unique in that they do not require an assumed model to determine the results. They also allow core data to be intermingled with log data in such a way as to use the established statistical information which can extend the core information to areas of the wellbore where no cores were cut. This is of particular advantage in reservoirs where predefined models and equations either do not work or are unknown. As an added advantage, parameters such as a, m, n, Rw can be avoided and results can be derived strictly from the statistical relations found by the software from the total data availabe. As more wells are drilled, the statistical data base can be updated and the estimates improved. Relations derived from analysis of the results can be used to quickly develop a proper reservoir model and thus assure proper interpretation of the data in the current and future wells. This evaluation can then lead to an accurate determination of parameters a, m, n, Rw along with a shaly sand Sw equation which accurately fits the reservoir and can be used in future wells.
New techniques allow for Binary Images of cores to be made to compare with bore hole imaging tool output. Since the data is digital, a quick and accurate sand-shale log can be prepared and also a total value for the thickness of net pay.
Core Data are grouped and averaged by litho-hydraulic units. These are defined on the basis of pore geometry and surface area, depositional environment and diagenetic environment. New correlating tools described byTiab et al. (1989) allow for the clear statistical correlation of this data so it can be easily integrated
RESERVOIR DESCRIPTION: A SYNERGISTIC APPROACH 203
with well log data. This in turn can be input into the Seismic Lithological model. Figures 8 and 10 demonstrate the systematic nature of these processes, and how data acquired at all scales of measurement interplay and synergise.
Recent application ofthis approach has scored dramatic successes in better description of reservoirs in Asia. At least one operator has reported computed oilin -place increased by as much as 70% over the original value.
CONCLUSION It is now apparent that, far from being "too detailed" or "too fine a scale" of
measurement, Microscopic and Macroscopic data are an integral part of Reservoir Description. When combined with modern high resolution Megascopic and Gigascopic field data, a synergistically enhanced picture of the reservoir is obtained. Application of these techniques is now explaining the apparent "overproduction" from reservoirs that original data predicted would be depleted by now. More importantly it provides quantitative data such that the quantity and value ofthe remaining hydrocarbons can be computed and better field development programmes can be used.
ACKNOWLEDGEMENTS The authors would like to thank Western Atlas International for permission
to publish this paper. We would also like to thank Peter Leong for his invaluable assistance with graphics and E John Bishop ofthe Western Geophysical division of the company for his support.
REFERENCES
Core Laboratories, 1988. "An Integrated Core Analysis Approach to Reservoir Description and Exploitation". Core Laboratories, A Division of Western Atlas International, January 1988
Amaefule J 0, Kersey D G, Marschall D M, Powell J D, Valencia L E, Keelan D K, 1988. "Reservoir Description: A Practical Synergistic Engineering and Geological Approach based on Analysis of Core Data". SPE, 63rd Annual Conference, Houston, October 2 - 5, 1988
Amaefule J 0, Keelan D K, 1989. "Stochastic Approach to Computation of Uncertainties in Petrophysical Properties". SCA 3rd Annual Conference, Louisiana 1989, Paper No. 8907.
Campbell et al, 1984. "Barrow Island Oilfield, Revisited". APEAjournal, 1984
Cockcroft P J, Robinson K M, 1984. "Chemistry of Oilfield Waters in South-East Asia and their Application to Petroleum Exploration", OSEA Conference, Singapore, 1988.
Faraguna J K, Chace D M, and Schmidt M G, 1989. " An Improved Borehole Teleview System: Image Acquisitions, Analysis and Integration". SPWLA Logging Symposium Transactions, Vol II Paper UU, 1989
Strozeski B B, Hilliker D J and Oliver D W, 1989. "Theoretical and Experimental Development of the Ultrasonic Diplog System". SPWLA Logging Symposium Transactions, Vol II Paper DD, 1989
Eleventh European Formation Evaluation Symposium, 1988. "Improved Interpretation in Oil Base 0
Mud System using the 200 Mhz Dielectric Tool". Baperz, September 14 - 16, 1988
•
204 D. G. BOWEN, T. KENNAIRD, J. HILL & E.J. FROST
Khokhar R W and Johnson W M, 1989. " A Deep Laterolog for Ultrathin Formation Evaluation". SPWLA Logging Symposium Transactions, Vol II Paper SS, 1989
Bradburn F R, Cheatham C A, 1988. "Improved Core Recovery in Laminated Sand and Shale Sequences". JPT, December 1988
de Buyl M, Guidish T, and Bell F, 1986. "Reservoir Description from Seismic Lithological Parameter Estimation". JPT, Vol 40, 475-482, 1986
Doyen P M, 1988. "Porosity from seismic data: A geostatistical approach". Geophysics Vol 53 No. 10, OctOber 1988
Doyen P M, Guidish T M, de Buyl M H, 1988. "Lithology Prediction From Seismic Data, A monteCarlo Approach". 58th Annual International SEG Meeting, Anaheim, California, October 1988
Westerp Geophysical, 1988. "Seismically Enhanced Reservoir Characterization: An Integrated Geostatistical Approach". Western Geophysical, June 1988
Tiab D, Altunbay M, Marschall D, 1989. "A New Reservoir Description Parameter". Core Laboratories, A Division of Western Atlas International, 3 October 89, Houston, Texas
Manuscript received 13th February 1990
REsERVOIR DESCRIPTION: A SYNERGISTIC APPROACH 205
APPENDIXl
Coring with Oil-Based Muds - 1
OVERVIEW PROBLEMS IN DETERMINING Sw AND Rw IN THE ASIA-PACIFIC REGION
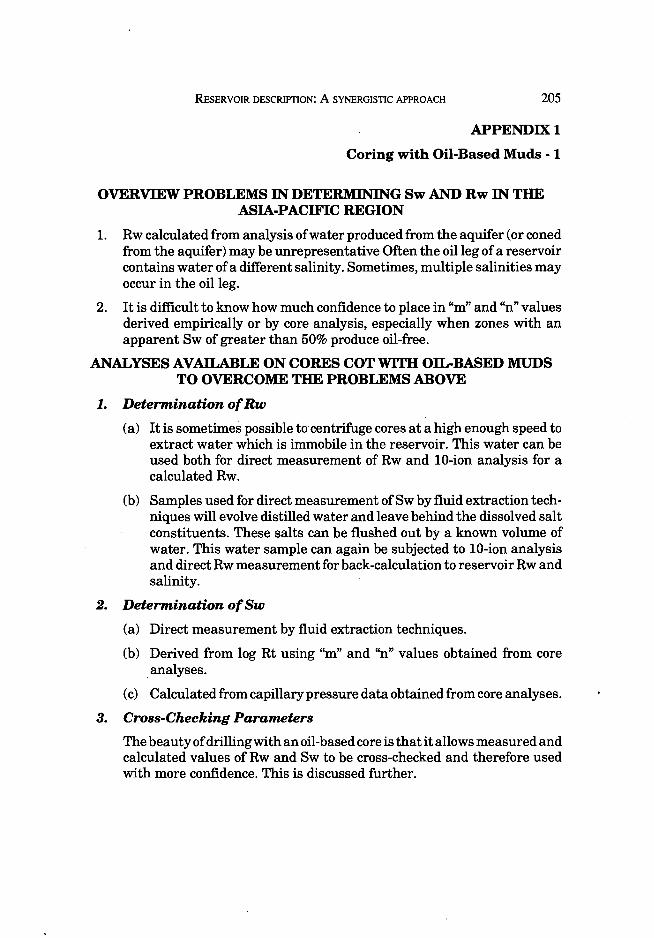
1. Rw calculated from analysis of water produced from the aquifer (or coned from the aquifer) may be unrepresentative Often the oil leg of a reservoir contains water of a different salinity. Sometimes, multiple salinities may occur in the oil leg.
2. It is difficult to know how much confidence to place in "m" and "n" values derived empirically or by core analysis, especially when zones with an apparent Sw of greater than 50% produce oil-free.
ANALYSES AVAILABLE ON CORES COT WITH OIL-BASED MUDS TO OVERCOME THE PROBLEMS ABOVE
1. Determination of Rw
(a) It is sometimes possible to centrifuge cores at a high enough speed to extract water which is immobile in the reservoir. This water can be used both for direct measurement of Rw and 10-ion analysis for a calculated Rw.
(b) Samples used for direct measurement ofSw by fluid extraction techniques will evolve distilled water and leave behind the dissolved salt constituents. These salts can be flushed out by a known volume of water. This water sample can again be subjected to 10-ion analysis and direct Rw measurement for back-calculation to reservoir Rw and salinity.
2. Determination of Sw
(a) Direct measurement by fluid extraction techniques.
(b) Derived from log Rt using "m" and "n" values obtained from core . analyses.
(c) Calculated from capillary pressure data obtained from core analyses.
3. Cross-Checking Parameters
The beauty of drilling with an oil-based core is that it allows measured and calculated values of Rw and Sw to be cross-checked and therefore used with more confidence. This is discussed further.

206 D. G. BOWEN, T. KENNAIRD, J. HILL & E.J. FROST
APPENDIXl
Coring with Oil-Based Muds - 2
CORING PROGRAMME
1. Coring Fluid
. The coring fluid should be an oil-based mud which does not contain free water. Thus immobile Sw in the core should not change in terms of quantity or composition.
In order that later special tests on the core are not affected, the oil filtrate should be as bland as possible. That is, lease crude or bliilld mineral oil, such as Mentor-26, should be used to make up the mud and the mud designed such that agents capable of altering wettability (surfactants, emulsifiers) are caught in the mud-cake and not carried with the filtrate.
Two words of caution. Firstly, excessive mud overbalance during coring may cause even "immobile" water to be flushed out of the core, particularly in the event of a wettability change. Thus it is advisable to take samples as close to the centre of the core as possible. Secondly, the aqueous part of the mud emulsion usually comprised high salinity calcium chloride which can absorb water from the formation by an osmotic process .. Therefore it is advisable to analyse cores as soon as possible after coring. Again, samples should be taken as near to the centre of the core as possible since the aqueous part of the emulsion will form part of the mud-cake with changes in Sw therefore occurring near the surface of the core initially.
2. Core Diameter
The Larger the diameter of the core, the more the likelihood of a larger central portion of the core retaining an unaltered Sw.
3. Coring Zone
For a one-time study of a reservoir, or rock-type within a reservoir, a core should be taken through the gas-cap (if present), oil-zone, transition zone and into the aquifer. The reason for this is explained in overleaf.
RESERVOIR DESCRIPTION: A SYNERGISTIC APPROACH 207
APPENDIX!
Coring with Oil-Based Muds-3
CROSS-CHECKING OF MEASURED AND CALCULATED Sw AND Rw VALUES TO ENSURE VALIDITY
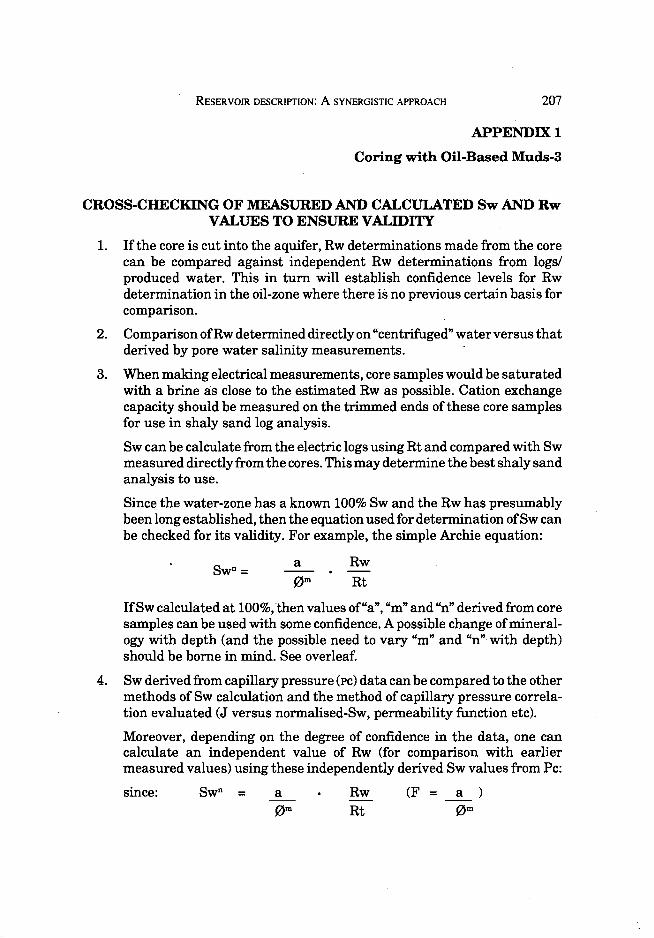
1. If the core is cut into the aquifer, Rw determinations made from the core can be compared against independent Rw determinations from logs! produced water. This in turn will establish confidence levels for Rw determination in the oil-zone where there is no previous certain basis for comparison.
2. Comparison ofRw determined directly on "centrifuged" water versus that derived by pore water salinity measurements.
3. When making electrical measurements, core samples would be saturated with a brine as close to the estimated Rw as possible. Cation exchange capacity should be measured on the trimmed ends of these core samples for use in shaly sand log analysis.
Sw can be calculate from the electric logs using Rt and compared with Sw measured directly from the cores. This may determine the best shaly sand analysis to use.
Since the water-zone has a known 100% Sw and the Rw has presumably been long established, then the equation used for determination ofSw can be checked for its validity. For example, the simple Archie equation:
a Rw -- . -Swn = 0 m Rt
IfSw calculated at 100%, 'then values of "a", "m" and Un" derived from core samples can be used with some confidence. A possible change of mineralogy with depth (and the possible need to vary "m" and "n", with depth) should be borne in mind. See overleaf.
4. Sw derived from capillary pressure (pc) data can be compared to the other methods of Sw calculation and the method of capillary pressure correlation evaluated (J versus normalised-Sw, permeability function etc).
Moreover, depending on the degree of confidence in the data, one can calculate an independent value of Rw (for comparison with earlier measured values) using these independently derived Sw values from Pc:
since: Swn = a Rw (F = a ) 0 m Rt 0 m
208 D. G. BOWEN, T. KENNAIRD, J. HILL & E.J. FROST
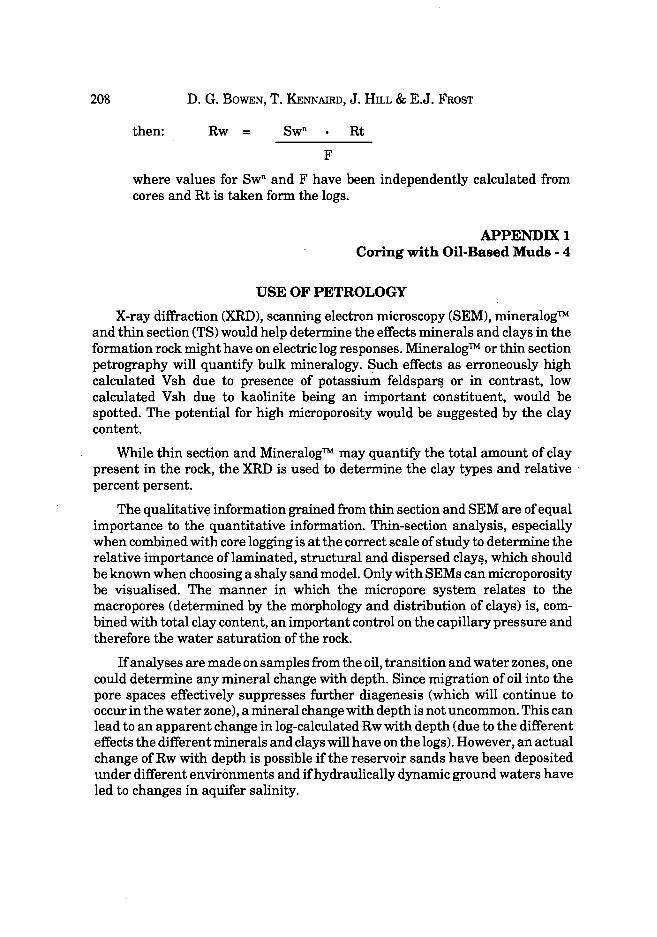
then: Rw = Rt
F
where values for SwD and F have been independently calculated from cores and Rt is taken form the logs.
APPENDIX! Coring with Oil-Based Muds - 4
USE OF PETROLOGY
X-ray diffraction (XRD), scanning electron microscopy (SEM), mineralog™ and thin section (TS) would help determine the effects minerals and clays in the formation rock might have on electric log responses. Mineralog™ or thin section petrography will quantify bulk mineralogy. Such effects as erroneously high calculated Vsh due to presence of potassium feldspar~ or in contrast, low calculated Vsh due to kaolinite being an important constituent, would be spotted. The potential for high microporosity would be suggested by the clay content.
While thin section and. Mineralog™ may quantify the total amount of clay present in the rock, the XRD is used to determine the clay types and relative . percent persent.
The qualitativ~ information grained from thin section and SEM are of equal importance to the quantitative information. Thin-section analysis, especially when combined with core logging is at the correct scale of study to determine the relative importance oflaminated, structural and dispersed clay~, which should be known when choosing a shaly sand model. Only with SEMs can microporosity be visualised. The manner in which the micropore system relates to the macropores (determined by the morphology and distribution of clays) is, combined with total clay content, an important control on the capillary pressure and therefore the water saturation of the rock.
If analyses are made on samples from the oil, transition and water zones, one could determine any mineral change with depth. Since migration of oil into the pore spaces effectively suppresses further diagenesis (which will continue to occur in the water zone), a mineral change with depth is not uncommon. This can lead to an apparent change in log-calculated Rw with depth (due to the different effects the different minerals and clays will have on the logs). However, an actual change of Rw with depth is possible if the reservoir sands have been deposited under different environments and ifhydraulically dynamic ground waters have led to changes in aquifer salinity.
RESERVOIR DESCRIPTION: A SYNERGISTIC APPROACH 209
Corelogging in conjunction with thin section studies would pick up changes in depositional environment to help verify suspected multiple salinity conditions. In addition to this, litho-type grouping allows the coherent assignment of average hydraulic properties to the reservoirs and provides for geologic modelling of oil-in -place distribution.
APPENDIX 2
NOTES RELATED TO FIGURE 10
1. When all data on porosity, permeability and environment are grouped by litho-type and capillary pressure and log derived Sw do not match, despite good statistical representation, it is usually because of one of the following:
a. Severe rock fluid interaction in capillary pressure data
b. Non-water wet reservoirs
c. Chronic problems with establishing correct Rt from the log
d. Unknown or variable Rw
Item (a) can usually be established by Petrographic and Chemical analyses.
Item (c) can be resolved by an independent review of invasion profiles mud properties and other environmental corrections.
Item (b) can be quickly reviewed by graphically entering a fractional flow curve derived from slow-rate relative permeability curves, with oil and water at reservoir conditions preferably. The entry point should be a reservoir corrected surface water cut for the zones of interest. Data yielded from this will be Sw. Then an Archie type relationship is developed for "n" where "m" is the lab derived "m*"value. Computed "n" values in excess of 3.0 suggest some oil wetting in the reservoir.
n = (log F) + (log Rw) - (log Rt)
(logSw)
Item (d) determining Rw in East and South East Asian Basins of sedimentation can be very problematic. Rw search has shown that many, ifnot all reservoirs are impacted by the presence of meteoric waters either from their deposition (connate) or carried in by hydrodynamic processes.
This results in both vertical and lateral variations in salinity or, more correctly, ionic composition. Hence it may be necessary to evaluate the salinity of interstitial fluids directly. This has been done by either the

210 D. G. BOWEN, T. KENNAIRD, J. HILL & E.J. FROST
acquisition of oil base cores or the application of both eli-electric logging tools in an oil drilled hole. Obviously both approaches would be preferable. In both cases the salinity and water content of the drilling fluid has to be strictly controlled.