Reservoir Characterization Using Intelligent Seismic...
56
Reservoir Characterization Using Intelligent Seismic Inversion Emre Artun, WVU Shahab D. Mohaghegh, WVU Jaime Toro, WVU Tom Wilson, WVU Alejandro Sanchez, Anadarko September 15, 2005 ERM 2005 Morgantown, W.V. SPE Paper # 98012
Transcript of Reservoir Characterization Using Intelligent Seismic...

Reservoir Characterization Using Intelligent Seismic Inversion
Emre Artun, WVU Shahab D. Mohaghegh, WVU
Jaime Toro, WVU Tom Wilson, WVU
Alejandro Sanchez, Anadarko
September 15, 2005
ERM 2005 Morgantown, W.V. SPE Paper # 98012
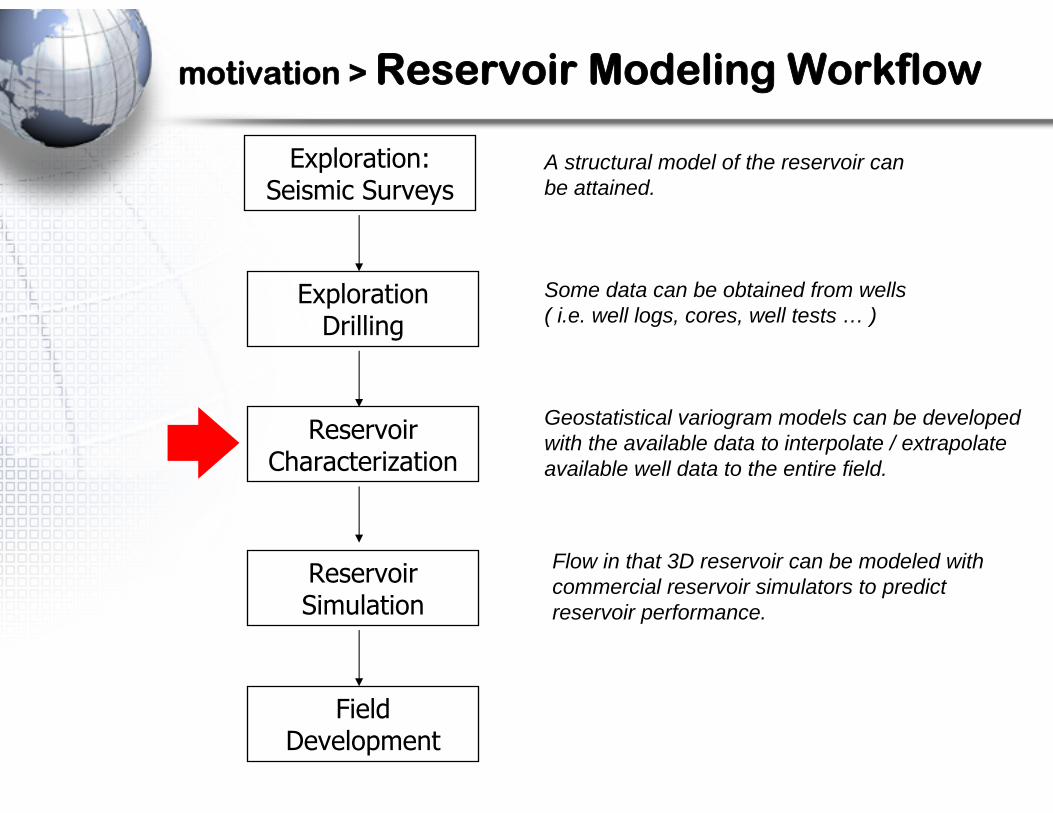
motivation > Reservoir Modeling Workflow
Exploration: Seismic Surveys
Exploration Drilling
Reservoir Characterization
Reservoir Simulation
A structural model of the reservoir can be attained.
Some data can be obtained from wells ( i.e. well logs, cores, well tests … )
Geostatistical variogram models can be developed with the available data to interpolate / extrapolate available well data to the entire field.
Flow in that 3D reservoir can be modeled with commercial reservoir simulators to predict reservoir performance.
Field Development

- Issues about the data and problems regarding data analysis must be considered carefully in reservoir characterization.
- Geostatistical models become insufficient in dealing with issues like uncertainty, large variety of scales, immense size of data, etc.
- As an alternate; our industry has realized the power of soft computing tools, which are capable of dealing with uncertainty, imprecision, and partial truth.
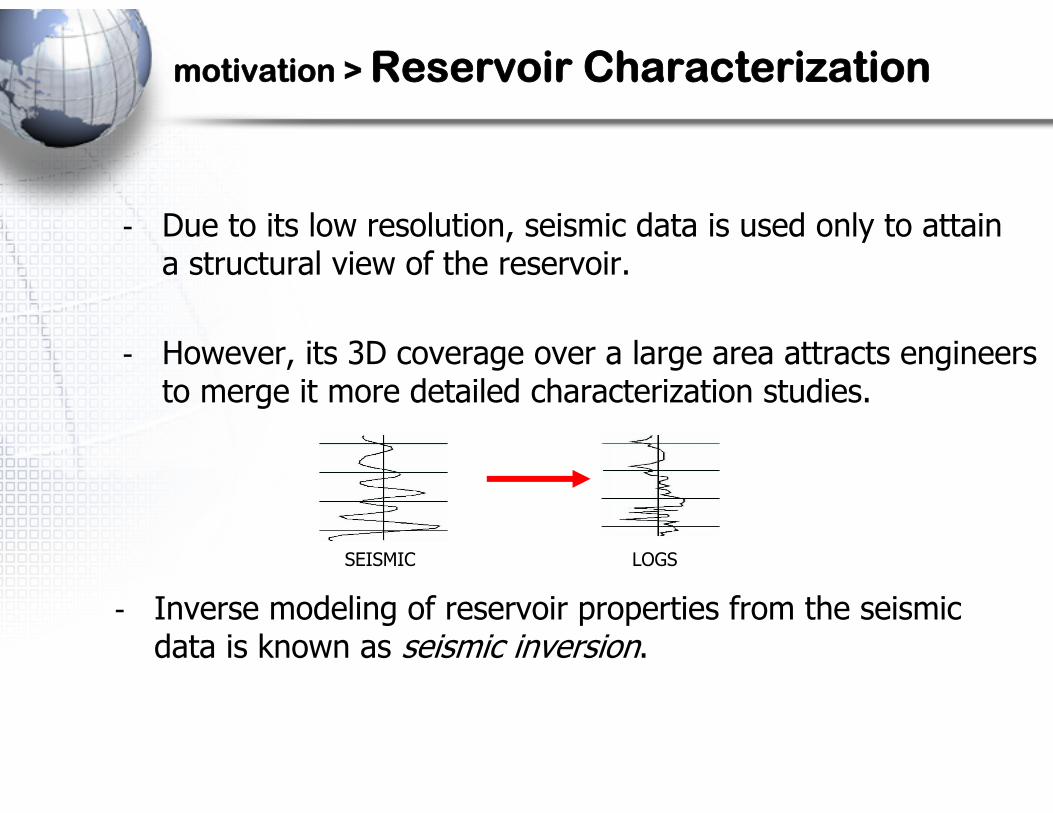
motivation > Reservoir Characterization

Ten-feet
One of inches
Fraction of inches
Integrating all different types of data in an accurate and high-resolution reservoir model
SEISMIC
WELL LOGS
CORES
motivation > Reservoir Characterization
motivation > Reservoir Characterization
- Due to its low resolution, seismic data is used only to attain a structural view of the reservoir.
- However, its 3D coverage over a large area attracts engineers to merge it more detailed characterization studies.
- Inverse modeling of reservoir properties from the seismic data is known as seismic inversion.
SEISMIC LOGS

1. Does a relationship exist between seismic data and reservoir characteristics, beyond the structural relationship?
2. If such a relationship exists, can it be extracted through the use of soft computing tools, such as artificial neural networks?
3. How that tool should be designed to develop the most reliable correlation models? i.e. neural network algorithm, number and type of seismic attributes
that should be included... etc.
Statement of the Problem

Previous Work
- In this study; vertical seismic profile (VSP) is incorporated into the study as the intermediate scale instead of cross-well seismic.
neural networkCross-well
seismic Gamma ray
logs
neural networkSurface seismic
neural networkSurface seismic
neural network
Well logs
Chawathe et. al (1997)
Reeves et. al (2002)
VSP

Vertical Seismic Profile (VSP)
VSP resolution ≈
2 * Surface seismic resolution
Source
Receivers (Geophones)
surface
- Signal receivers are located in the borehole instead of surface, both down-going and up-going signals are received.- Signal receivers are located in the borehole instead of surface, both down-going and up-going signals are received.- Signal receivers are located in the borehole instead of surface, both down-going and up-going signals are received.
Well
rock layer boundary

Statement of the Problem
- Using artificial neural networks is proposed to find a desirable correlation between well logs and seismic data. Generalized regression neural network (GRNN) algorithm is used.
- Vertical seismic profile (VSP) is incorporated into the study as the intermediate scale data.
- Another unique feature of this study was to develop and work on a synthetic model, before dealing with real data.

Two-step Correlation Methodology
Surface Seismic
Well Logs
VSP
Low frequency High frequencyMedium frequency
Step 1 Step 2
Two steps of correlation
1) Correlation of surface seismic with VSP
2) Correlation of VSP with well logs

Case 1
Synthetic Model

- The model represents the Pennsylvanian stratigraphy of the Buffalo Valley Field in New Mexico, including the gas-producing Atoka and Morrow formations.
- The geological complexity increases with depth; 0.8 – 1.124 sec. (6,600 – 9,000 ft) interval has been used.
- Surface seismic and VSP responses have been computed through a synthetic seismic line of 100 traces.
Description of the Model
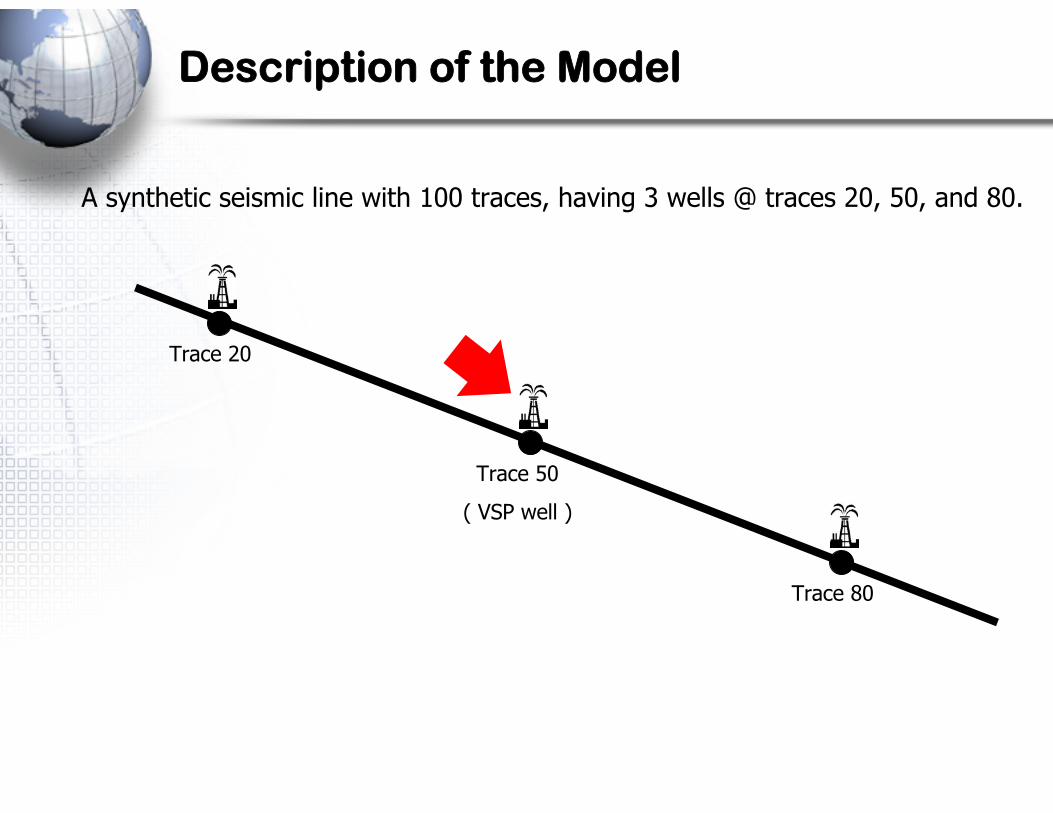
Trace 20
Trace 50
( VSP well )
Trace 80
Description of the Model
A synthetic seismic line with 100 traces, having 3 wells @ traces 20, 50, and 80.

Available Data
1. Density and acoustic velocity distributions.
2. Surface seismic and VSP responses in the form of the following seismic attributes:
- Amplitude- Average energy- Envelope- Frequency- Hilbert transform- Paraphase- Phase
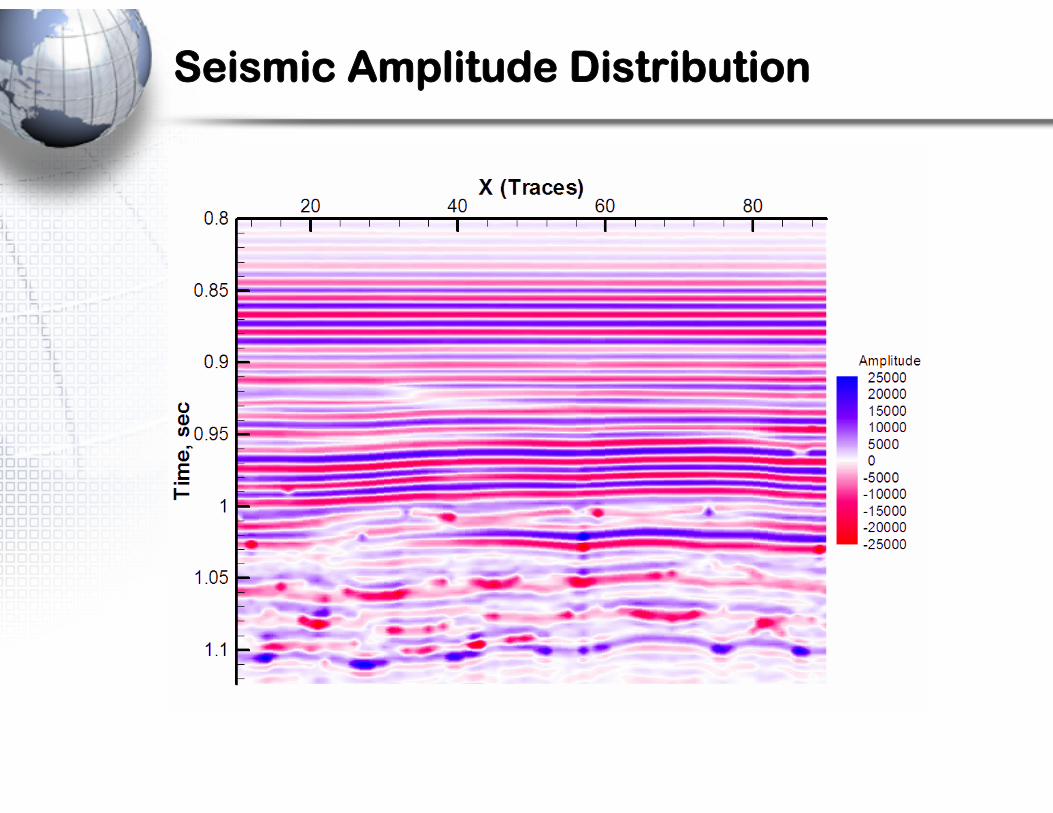
Seismic Amplitude Distribution

Case 1 – Synthetic Model
Step 1 Correlation of surface seismic with VSP
Step 2 Correlation of VSP with well logs
Step 1 Correlation of surface seismic with VSP

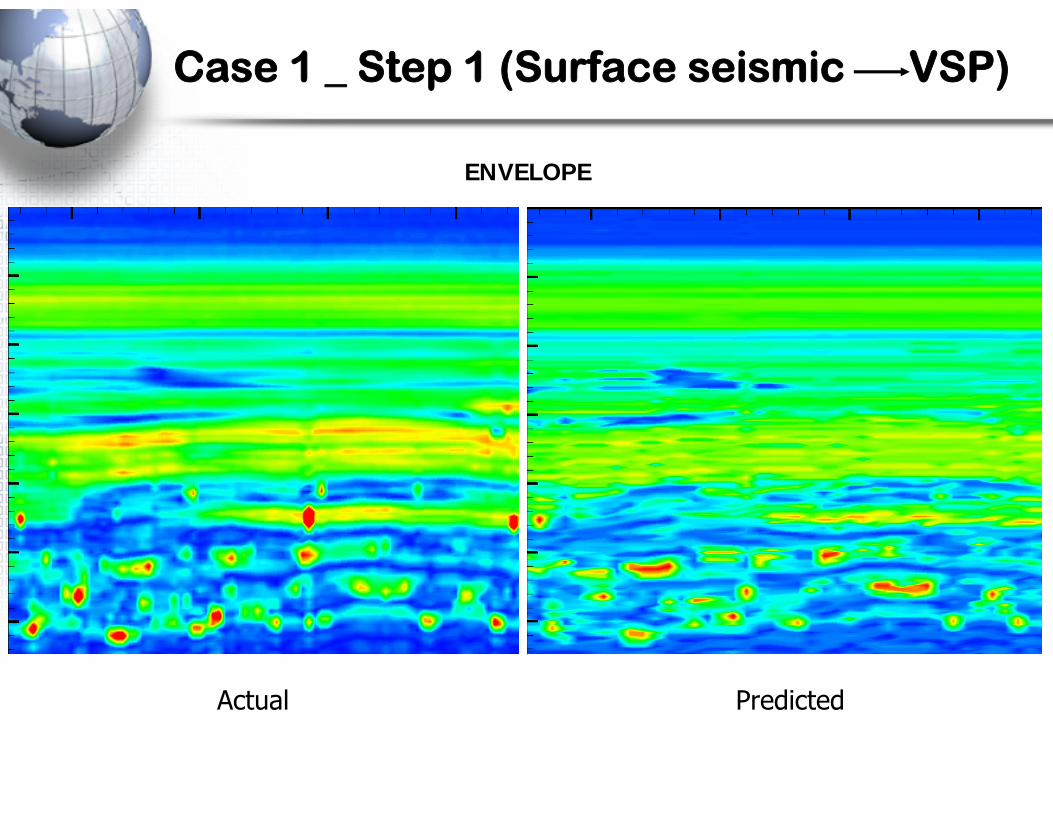
Case 1 _ Step 1 (Surface seismic VSP)
Trace 32Trace 57

Neural network design:
Case 1 _ Step 1( Surface seismic VSP)
neural network
Inputs Output
Time+
7 surface seismic
attributes
Single VSP attribute

Case 1 _ Step 1 (Surface seismic VSP)

Correlation Map
Surface Seismic
Well Logs
VSP
Step 1 Step 2
Model found
Surface Seismic
VirtualVSP
VirtualWell Logs
Seven separate prediction models have been developed for seven VSP attributes
with the data of traces 32 + 57.
Now, let’s apply these models to the other traces to have the predicted distributions.
Seven separate prediction models have been developed for seven VSP attributes
with the data of traces 32 + 57.
Now, let’s apply these models to the other traces to have the predicted distributions.

Case 1 _ Step 1 (Surface seismic VSP)
Actual Predicted
FREQUENCY

Case 1 _ Step 1 (Surface seismic VSP)
Actual Predicted
PHASE

Case 1 _ Step 1 (Surface seismic VSP)
Actual Predicted
HILBERT TRANSFORM
Case 1 _ Step 1 (Surface seismic VSP)
Actual Predicted
ENVELOPE

Correlation Map
Surface Seismic
Well Logs
VSP
Step 1 Step 2
Model found
Surface Seismic
VirtualVSP
VirtualWell Logs
Step 1 - ACCOMPLISHED !..Step 1 - ACCOMPLISHED !..
VirtualVSP

Case 1 – Synthetic Model
Step 1 Correlation of surface seismic with VSP
Step 2 Correlation of VSP with well logsStep 2 Correlation of VSP with well logs

- Density log has been selected as the target log, and data of t-50 have been used in building network models.
- Instead of using actual values, the problem was converted to a classification problem, because of observable averaged values of density log of t-50.
Case 1 _ Step 2 ( VSP Well Logs )

Class 1
ρ ≈ 1.9 g/cc
Class 2
ρ ≈ 2.3 g/cc
Class 3
ρ ≈ 2.65 g/cc
Class 1
Class 2
Class 3
Case 1 _ Step 2 ( VSP Well Logs )

Neural network design:
neural network
Inputs Outputs
Time+
7 VSP attributes
Three Classes of
Density
Case 1 _ Step 2 ( VSP Well Logs )

r2 = 0.82Class 1
ρ ≈ 1.9 g/cc
Class 2
ρ ≈ 2.3 g/cc
Class 3
ρ ≈ 2.65 g/cc
Case 1 _ Step 2 ( VSP Well Logs )

Class 1 Class 2
Class 3
Class 4
ρ ≈ 2.09 g/cc
Class 4r2 = 0.94
Case 1 _ Step 2 ( VSP Well Logs )
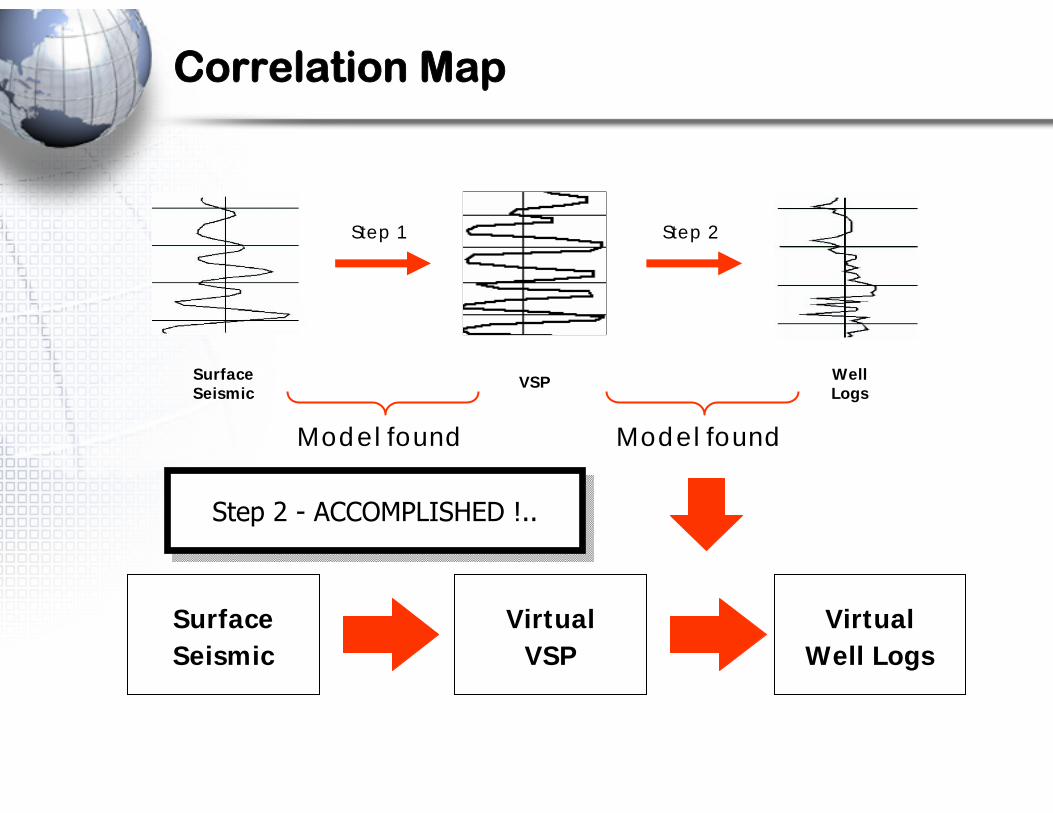
Correlation Map
Surface Seismic
Well Logs
VSP
Step 1 Step 2
Model found
Surface Seismic
VirtualVSP
VirtualWell Logs
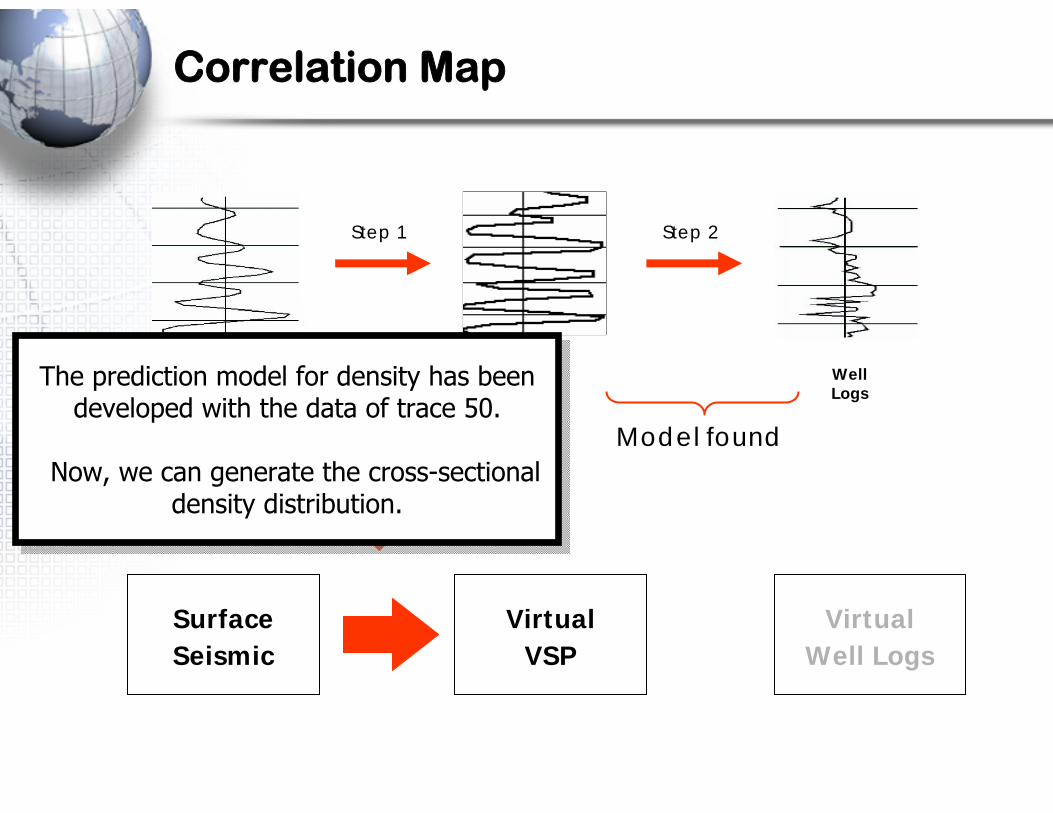
The prediction model for density has been developed with the data of trace 50.
Now, we can generate the cross-sectional density distribution.
The prediction model for density has been developed with the data of trace 50.
Now, we can generate the cross-sectional density distribution.
Model found

Actual Predicted
DENSITY
Case 1 _ Step 2 ( VSP Well Logs )

Case 1 _ Step 2 ( VSP Well Logs )

Correlation Map
Surface Seismic
Well Logs
VSP
Step 1 Step 2
Model found
Surface Seismic
VirtualVSP
VirtualWell Logs
Model found
VirtualWell Logs
Step 2 - ACCOMPLISHED !..Step 2 - ACCOMPLISHED !..

Case 2
Real CaseThe Buffalo Valley Field

The Buffalo Valley Field, New Mexico

Available Data
- Paper logs from around 40 wells within a 3D seismic survey area have been digitized.
- Only one well had a VSP survey, i.e. it’s the only well to build network models.
- Seismic data were loaned by WesternGeco; a total of 27 seismic attributes were available.

Map of Wells and Seismic Survey Area
VSP well
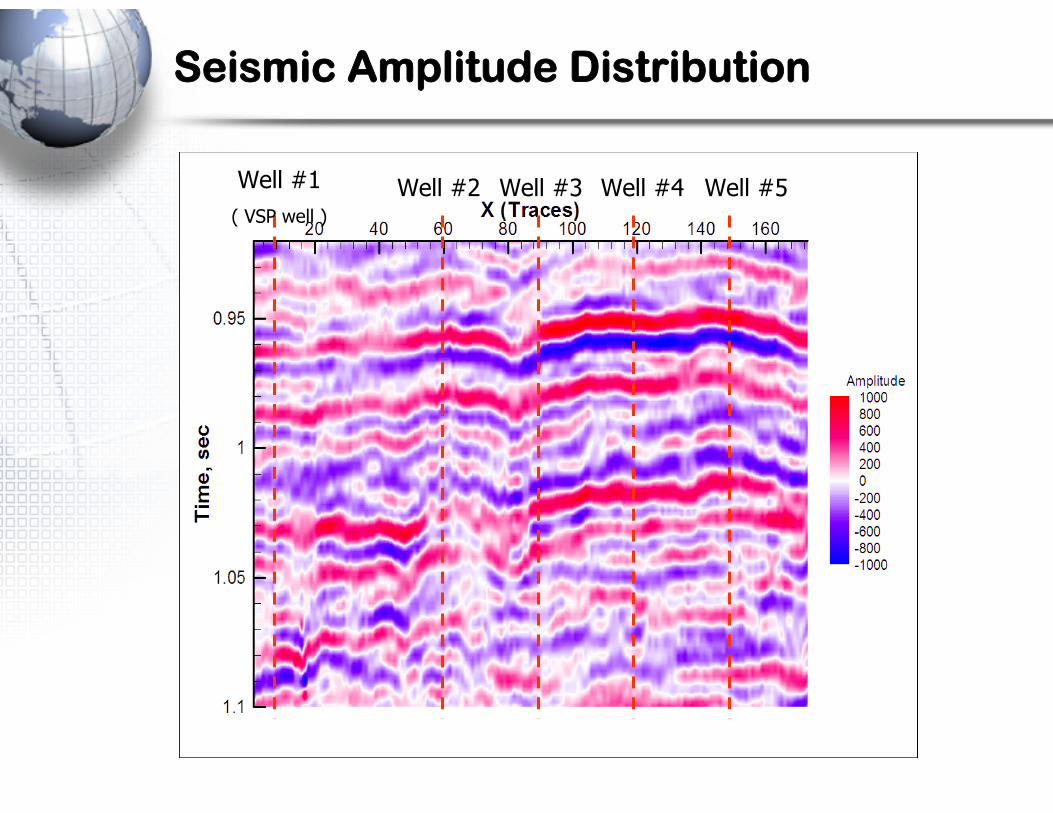
Seismic Amplitude Distribution
Well #1 ( VSP well )
Well #2 Well #3 Well #4 Well #5

Case 2 – Real Case: The B.Valley Field
Step 1 Correlation of surface seismic with VSP
Step 2 Correlation of VSP with well logs
Step 1 Correlation of surface seismic with VSP

Case 2 _ Step 1 (Surface seismic VSP)

Case 2 _ Step 1 (Surface seismic VSP)

Correlation Map
Surface Seismic
Well Logs
VSP
Step 1 Step 2
Model found
Surface Seismic
VirtualVSP
VirtualWell Logs
VirtualVSP

Case 2 – Real Case: The B. Valley Field
Step 1 Correlation of surface seismic with VSP
Step 2 Correlation of VSP with well logsStep 2 Correlation of VSP with well logs

- After a quality check of available logs, gamma ray and neutron porosity logs were selected as target logs, considering their availability, and quality.
Case 2 _ Step 2 ( VSP Well Logs )

- Data from all available wells were used in developing the neural network models.
- A ‘Key Performance Indicators’ (KPI) study was conducted to see influences of each seismic attribute on the target log.
Case 2 _ Step 2 ( VSP Well Logs )
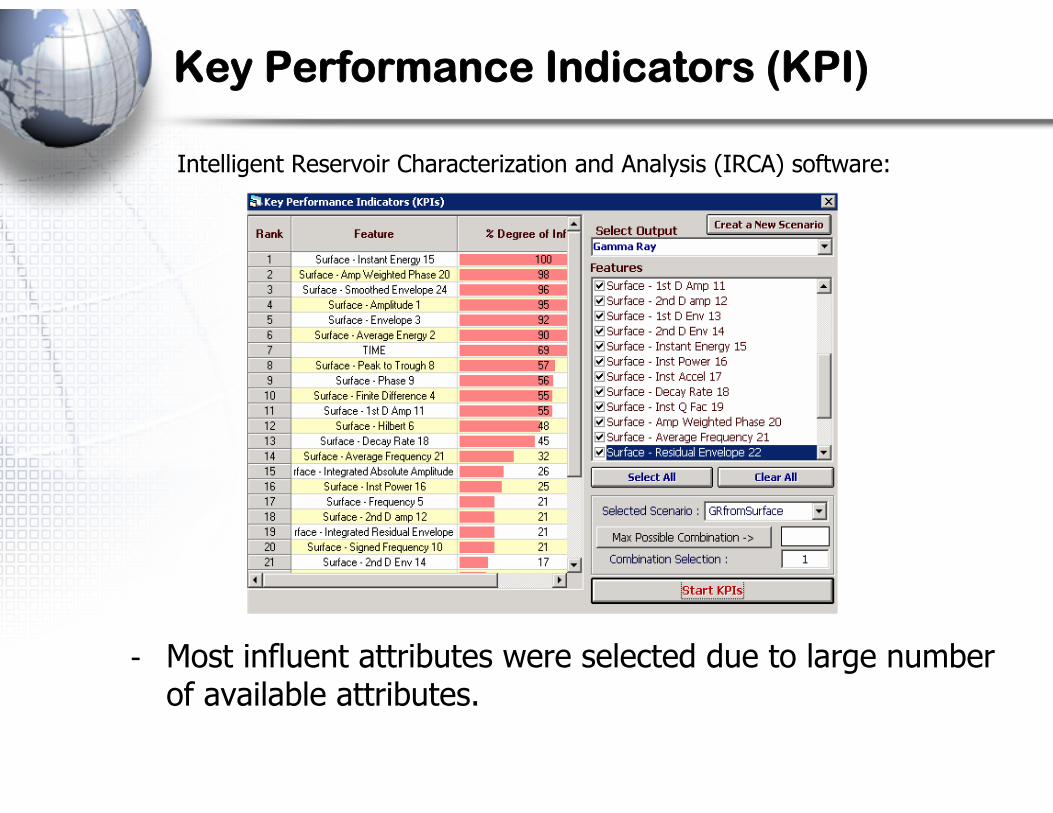
Key Performance Indicators (KPI)
Intelligent Reservoir Characterization and Analysis (IRCA) software:
- Most influent attributes were selected due to large number of available attributes.

Gamma Ray Log
Well #1 r = 0.76
Well #2 r = 0.86
Well #3 r = 0.81
Well #4 r = 0.90
Well #5 r = 0.90

Gamma Ray Log

Neutron Porosity Log
Well #1 r = 0.98
Well #2 r = 0.97

Neutron Porosity Log
Correlation Map
Surface Seismic
Well Logs
VSP
Step 1 Step 2
Model found
Surface Seismic
VirtualVSP
VirtualWell Logs
Model found
VirtualWell Logs
Step 2 - ACCOMPLISHED !..Step 2 - ACCOMPLISHED !..

Conclusions
- The proposed two-scale-step, intelligent seismic inversion methodology has been successfully developed on a synthetic model. The same methodology has then been applied to real data of the Buffalo Valley Field in New Mexico.
- Density logs for the synthetic model, and gamma ray logs for the field data have been produced from seismic data.

Conclusions
- The complex and non-linear relationships have been extracted with the power of artificial neural networks with both classification and prediction.
- A novel approach has been presented to solve an important data integration problem in reservoir characterization.
- The same methodology can be applied to a 3D seismic block to obtain 3D distributions of reservoir properties.

Acknowledgements
- This study was supported by the U.S. Department of Energy. Help and support of Mr. Thomas Mroz (project manager) is appreciated.
- Seismic data were used with the courtesy of WesternGeco.
- Mrs. Janaina Pereira’s help in digitizing well logs is also appreciated.
Acknowledgements
- This study was supported by the U.S. Department of Energy. Help and support of Mr. Thomas Mroz (project manager) is appreciated.
- Seismic data were used with the courtesy of WesternGeco.
- Mrs. Janaina Pereira’s help in digitizing well logs is also appreciated.
Reservoir Characterization Using Intelligent Seismic Inversion
ERM 2005 Morgantown, W.V. SPE Paper # 98012
September 15, 2005