RESEARCHQUALITY OUTREACH CONTINUOUSIMPROVEMENT SAFETY VISION · PDF fileToday we unveil a...
40
MISSION VISION PARTNER COLLABORATE CONTINUOUS ETHICS QUALITY NUTRITION SAFETY IMPROVEMENT RESEARCH PROTEIN COMMITMENT SUSTAINABILITY PRODUCTIVITY TRUST PROMOTION EDUCATE SOCIAL RESPONSIBILITY OUTREACH TRAINING CARE National Pork Board 2015-2020 Strategic Plan
-
Upload
nguyendiep -
Category
Documents
-
view
214 -
download
2
Transcript of RESEARCHQUALITY OUTREACH CONTINUOUSIMPROVEMENT SAFETY VISION · PDF fileToday we unveil a...

MISSION
VISIONPARTNER
COLLABORATE
CONTINUOUS
ETHICSQUALITY
NUTRITIONSAFETYIMPROVEMENT
RESEARCH
PROTEIN
COMMITMENT
SUSTAINABILITYPRODUCTIVITY
TRUST
PROMOTION
EDUCATE
SOCIAL RESPONSIBILITY
OUTREACH
TRAININGCARE
National Pork Board 2015-2020 Strategic Plan


PARTNER
COLLABORATE
CONTINUOUS
ETHICSQUALITY
NUTRITION
SAFETYIMPROVEMENTRESEARCH
PROTEIN
COMMITMENT
SUSTAINABILITYPRODUCTIVITY
TRUST
PROMOTION
EDUCATE
SOCIAL RESPONSIBILITY
OUTREACH
TRAININGCARE
October 2014
Introducing the National Pork Board’s 2020 Plan
Dear friends,
Early in 2014, the National Pork Board assembled a team of industry experts to discuss our issues, challenge our thinking and define our outlook for the next five years. This team came together at a time of great innovation, scrutiny and change for the U.S. pork industry.
It had been nearly five years since the National Pork Board last engaged in the strategic planning process. Much has changed in that time, and it was inherent that we, as a board, invest time to reassess and redefine our priorities. In 2014, we tapped our producer leaders in this process, as well as experts from across the agriculture and food production industry. Today we unveil a newly defined vision and mission to lead our organization through 2020.
I am pleased to present the outcome of our year of planning. What I am most proud of as president of the National Pork Board is that we embraced our values throughout the process. As farmers we value:
• Diversity of opinion and strive for collaboration• A foundation firmly based on the industry’s We Caresm principles• A commitment to do what’s right for people, pigs and the planet• A proactive approach in addressing emerging challenges• A focus on continuous improvement
I am excited about the future of the U.S. pork industry and our commitment to building consumer trust through transparency and driving sustainable production through a focus on efficiency, animal welfare and the environment. If we are successful on these fronts, we will grow U.S. and global consumer demand for our product.
I think you will be pleased with the outcome of this report, and I assure you that the following words are from great minds with big hearts – people who understand your business and strive every day to work collaboratively on a path of continuous improvement.
Today’s pork industry is leading the way in responding to consumers with new programs that provide greater assurance of high quality and sustainably produced pork.
Thank you for your support.
Dale NortonNational Pork Board president and a Michigan pork producer
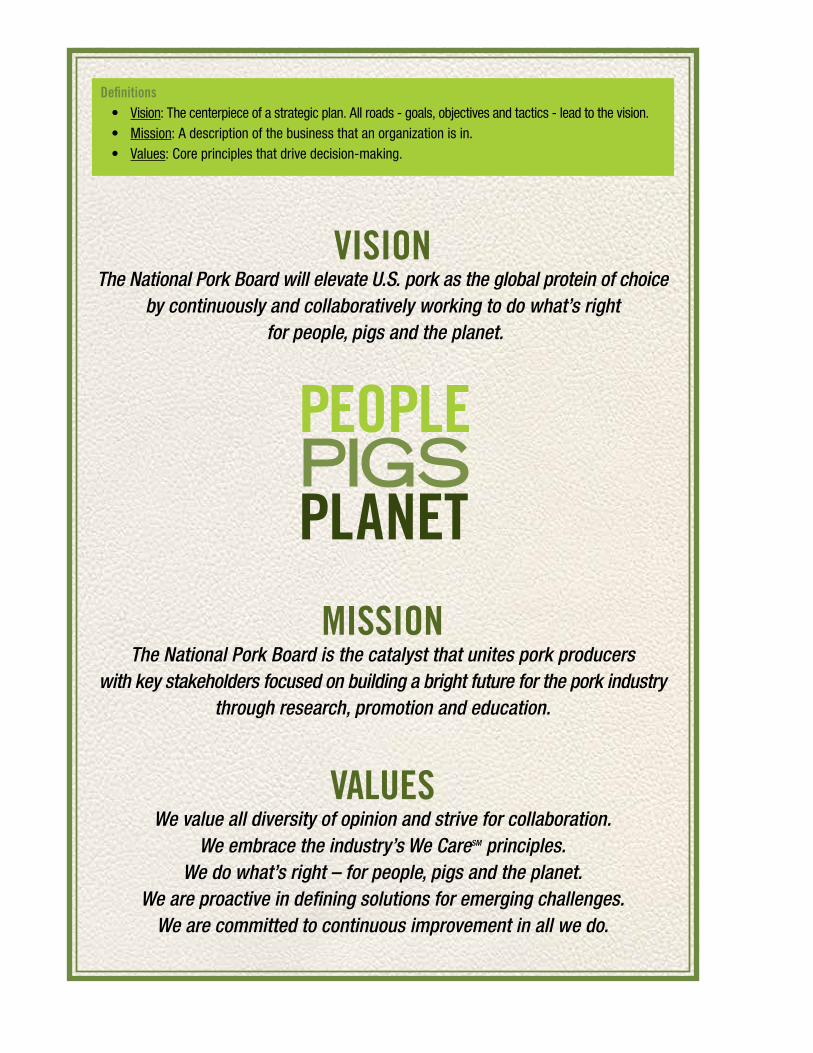
MISSIONThe National Pork Board is the catalyst that unites pork producers
with key stakeholders focused on building a bright future for the pork industry through research, promotion and education.
PARTNER
COLLABORATE
CONTINUOUS
ETHICSQUALITY
NUTRITIONSAFETYIMPROVEMENT
RESEARCH
PROTEIN
COMMITMENT
SUSTAINABILITYPRODUCTIVITY
TRUST
PROMOTION
EDUCATE
SOCIAL RESPONSIBILITY
OUTREACH
TRAININGCARE
VISIONThe National Pork Board will elevate U.S. pork as the global protein of choice
by continuously and collaboratively working to do what’s right for people, pigs and the planet.
VALUES We value all diversity of opinion and strive for collaboration.
We embrace the industry’s We Caresm principles. We do what’s right – for people, pigs and the planet.
We are proactive in defining solutions for emerging challenges. We are committed to continuous improvement in all we do.
Definitions• Vision: The centerpiece of a strategic plan. All roads - goals, objectives and tactics - lead to the vision.• Mission: A description of the business that an organization is in.• Values: Core principles that drive decision-making.

In 2009, a National Pork Board industry task force initiated a plan focused on protecting the pork industry’s latitude to operate, enhancing demand and creating global competitive advantage. In 2014, another industry task force prepared to further shape the industry’s destiny.
The 2014 task force created a plan rooted in collaboration among producers, packers, other supply-chain partners and moderate Non-Government Organizations (NGOs). Its vision: U.S. pork will be the global protein of choice by continuously and collaboratively working to do what’s right for people, pigs and the planet. As the protein of choice, the pork category will grow and increase volume domestically and abroad through creative marketing and access to emerging markets. Quality will be improved, and pork will be seen as a trusted product with great value.
A new system was put in place to shift from reacting to change to anticipating and shaping it, as well as telling the pork industry’s story. Plans were put in place to accelerate opportunities, redirect threats and/or make internal adjustments to adapt to change. The plan helped the industry make tough choices about which issues to defend and where change was needed. It relied on the collaborative approach of all stakeholders and built on the work of the Packer Processor Industry Council and Retail Advisory Committee.
By 2020, the National Pork Board will continue to work collaboratively with USDA and industry groups to manage risks and monitor diseases across the U.S. in a way that allows producers, veterinarians and the government to work together and respond. Research is increasing the industry’s productivity and ensuring its sustainability for the long term.
The industry is well regarded for providing a safe, nutritious and sustainable protein that advances consumer health, contributes to local communities and supports the people who make up the industry. New talent is flocking to the pork industry because of the opportunity it provides, and the fact that it is poised for growth.
The National Pork Board will have a system which fosters consumer confidence and trust. Consumers feel good about eating pork because they learned how to cook it properly and the industry’s practices appeal to their values. There is a greater acceptance of these production practices and an appreciation that the industry has the best interests of consumers and pigs at heart.
Tens of thousands more hog farmers will have adopted the We Caresm principles. The ethical foundations increase professionalism and address issues of concern to retail and foodservice buyers, and increasingly, to consumers. Everything the industry does is rooted in the ethical principles espoused in We Care. The story is effectively being told to a variety of stakeholders and is regarded as the gold standard for animal agriculture.
All these efforts are supported by a staff and committee structure that is aligned behind the company vision; infrastructure and resources support the goals. National Pork Board has stepped up its trust and relationships with buyers. The pork supply-chain now stands together answering critics and listening to and engaging channel partners, NGOs and consumers in civil conversations about common values, production practices and mutually beneficial solutions to issues of concern.
THE NATIONAL PORK BOARD STORY
6 | National Pork Board 2015-2020 Strategic Plan
PARTNER
COLLABORATE
CONTINUOUS
ETHICSQUALITY
NUTRITION
SAFETYIMPROVEMENTRESEARCH
PROTEIN
COMMITMENT
SUSTAINABILITYPRODUCTIVITY
TRUST
PROMOTION
EDUCATE
SOCIAL RESPONSIBILITY
OUTREACH
TRAININGCARE
TABLE OF CONTENTSDevelopment of the 2015-2020 Plan
A Vision of Success/Goals and SMART Objectives . . . . . . . . . . . . . . . . . . . . . . . . . . . . . . . . . . . . . . . . . . . . . .7
Situation and Market Analysis . . . . . . . . . . . . . . . . . . . . . . . . . . . . . . . . . . . . . . . . . . . . . . . . . . . . . . . . . . . . .9
The Task Force . . . . . . . . . . . . . . . . . . . . . . . . . . . . . . . . . . . . . . . . . . . . . . . . . . . . . . . . . . . . . . . . . . . . . . .10
The Process . . . . . . . . . . . . . . . . . . . . . . . . . . . . . . . . . . . . . . . . . . . . . . . . . . . . . . . . . . . . . . . . . . . . . . . . . 11
Summary of Inputs . . . . . . . . . . . . . . . . . . . . . . . . . . . . . . . . . . . . . . . . . . . . . . . . . . . . . . . . . . . . . . . . . . . . 12
A Look Back . . . . . . . . . . . . . . . . . . . . . . . . . . . . . . . . . . . . . . . . . . . . . . . . . . . . . . . . . . . . . . . . . . . . . . . . . 13
Implementing the Plan
Creating Alignment . . . . . . . . . . . . . . . . . . . . . . . . . . . . . . . . . . . . . . . . . . . . . . . . . . . . . . . . . . . . . . . . . . . . 14
Critical Factors for Success/Evaluation . . . . . . . . . . . . . . . . . . . . . . . . . . . . . . . . . . . . . . . . . . . . . . . . . . . . .16
Appendices
Board Retreat Summary/Staff Meeting Summary . . . . . . . . . . . . . . . . . . . . . . . . . . . . . . . . . . . . . . . . . . . . . 17
National Pork Board Program Committees at Unified Research Meeting Summary. . . . . . . . . . . . . . . . . . . . . 18
Packer Interview Summary . . . . . . . . . . . . . . . . . . . . . . . . . . . . . . . . . . . . . . . . . . . . . . . . . . . . . . . . . . . . . .19
Trade Association Interview Summary/Marketing Channel Interview Summary . . . . . . . . . . . . . . . . . . . . . . .21
NGO Interview Summary . . . . . . . . . . . . . . . . . . . . . . . . . . . . . . . . . . . . . . . . . . . . . . . . . . . . . . . . . . . . . . . .22
Pork Foresight Meeting Summary . . . . . . . . . . . . . . . . . . . . . . . . . . . . . . . . . . . . . . . . . . . . . . . . . . . . . . . . .23
Producer Survey Summary . . . . . . . . . . . . . . . . . . . . . . . . . . . . . . . . . . . . . . . . . . . . . . . . . . . . . . . . . . . . . .24
National Pork Board Continuum of Influence . . . . . . . . . . . . . . . . . . . . . . . . . . . . . . . . . . . . . . . . . . . . . . . . .26
Forcefield Analysis . . . . . . . . . . . . . . . . . . . . . . . . . . . . . . . . . . . . . . . . . . . . . . . . . . . . . . . . . . . . . . . . . . . .27
Economic Analysis . . . . . . . . . . . . . . . . . . . . . . . . . . . . . . . . . . . . . . . . . . . . . . . . . . . . . . . . . . . . . . . . . . . .30
National Pork Board 2015-2020 Strategic Plan | 7
PARTNER
COLLABORATE
CONTINUOUS
ETHICSQUALITY
NUTRITION
SAFETYIMPROVEMENTRESEARCH
PROTEIN
COMMITMENT
SUSTAINABILITYPRODUCTIVITY
TRUST
PROMOTION
EDUCATE
SOCIAL RESPONSIBILITY
OUTREACH
TRAININGCARE
A VISION OF SUCCESSAn organization’s vision is the driving force behind a strategic plan. The process of visioning answers the fundamental question: what does success look like when an organization achieves its vision? This vision can only be addressed through defining strategic goals and smart objectives and implementing tangible actions.
GOALS AND SMART OBJECTIVESThe following goals were determined to be the main focus for the National Pork Board. Each goal is supported by a series of objectives, which ideally meet the following criteria:
S: Specific/single outcomeM: MeasurableA: AchievableR: Relevant/realisticT: Time-bound
Goal: Build Consumer Trust - Working collaboratively with food-chain partners, the National Pork Board will enhance consumer trust in modern pork production by promoting producer adoption of on-farm management practices that reflect our industry’s ethical principles and by sharing our commitment to continuous improvement with consumers and key stakeholders.
1. By 2020, producers accounting for 50 percent of U.S. pig production will annually report sustainability performance metrics to a National Pork Board-sponsored sustainability measurement and reporting system.
2. By 2020, the region- and production-weighted national average carbon footprint of the U.S. swine herd will be reduced 5 percent from a 2014 baseline of 2.87 lb. CO2e/lb. live weight of pigs at the farm gate.
3. By 2020, the region- and production-weighted national average water use of the U.S. swine herd will be reduced 5 percent from a 2014 baseline of 18.66 gallons/lb. live weight of pigs at the farm gate.
4. By 2020, the public health risk of prioritized foodborne pathogens in pork will be reduced from 2015 levels, with initial focus on achieving a reduction in the sero-prevalence of Toxoplasma gondii in sows (by 10 percent) and in market hogs (by 5 percent) and a reduction in the prevalence of Salmonella spp. in pork trimmings (by 10 percent).
5. By 2020, the National Pork Board will achieve a 2 percent improvement in overall animal well-being scores as compared with 2015 PQA Plus® Site Assessment data.
6. The National Pork Board will implement an Enterprise Risk Management System (ERMS) to prevent or mitigate the industry’s prioritized threats and capitalize on its opportunities.
7. By 2020, the National Pork Board, in cooperation with food-chain partners, will continue to address public concerns related to animal care and health and will improve the perceptions of engaged consumers toward modern pork production by 10 percent, as measured by an annual tracking study.
8 | National Pork Board 2015-2020 Strategic Plan
PARTNER
COLLABORATE
CONTINUOUS
ETHICSQUALITY
NUTRITION
SAFETYIMPROVEMENTRESEARCH
PROTEIN
COMMITMENT
SUSTAINABILITYPRODUCTIVITY
TRUST
PROMOTION
EDUCATE
SOCIAL RESPONSIBILITY
OUTREACH
TRAININGCARE
Goal: Drive Sustainable Production - The National Pork Board will invest in research and producer education programs that enhance the productivity and sustainability of pork production and deliver benefits to producers, consumers and the community.
1. By 2020, the National Pork Board will develop, with key stakeholders, the identification and diagnostic tools, surveillance and mitigation strategies for the potential elimination of the top domestic swine diseases.
2. By 2020, the National Pork Board will deploy tools and programs to decrease the annual economic impact of PRRS by 20 percent, as adjusted for inflation and measured against the 2012 PRRS economic impact baseline study.
3. By 2020, the National Pork Board will build the capacity to detect and prepare for foreign, non-regulatory swine production diseases, to rapidly respond to non-regulatory and regulatory foreign animal diseases and to facilitate pork producer business continuity.
4. By 2020, the National Pork Board will expand participation in the worker safety benchmarking database from 27 percent to 50 percent of industry, with a long-term objective of reducing employee animal-handling injury rates by 15 percent.
5. Demonstrating a commitment to improving professionalism (doing the right things for the workforce and the animals workers care for), the National Pork Board will develop and deploy education and training resources that are utilized by 25 percent of the pork production industry and that serve as the basis of employee training and development programs.
6. By 2020, the National Pork Board will provide pork producers with research results, tools and information to improve the productivity of the U.S. swine herd as measured by the following and based on 2015 Industry Productivity Analysis:
a. 10 percent decrease in pre-weaning and nursery mortality, b. 10 percent improvement in caloric efficiency in grow/finish feed efficiency and c. Improvement in sow lifetime productivity from 38 pigs per sow lifetime to 42 pigs per sow lifetime.
Goal: Grow Consumer Demand - Working in concert with food-chain partners, the National Pork Board will grow domestic and international consumer demand by focusing on pork’s improved nutrition, quality and sustainability.
1. By 2020, increase pork’s U.S. market share of total real per capita meat expenditures 1 percentage point as measured by USDA retail price and disappearance data (2014 baseline data).
2. By 2020, increase pork exports through access to new markets, expand existing markets and increase export volume by 2.7 billion pounds and export value by $3.1 billion, equating to a 9 percent average annual increase in value and quantity compared with 2014 year-end data.
3. By 2020, reduce the percentage of pork loin chops scoring below the National Pork Board color score of 3 by 10 percentage points as compared with the 2012 retail baseline study (55 percent reduced to 45 percent).
4. By 2020, increase the positive perceptions of pork in a healthy diet by registered dietitians by 20 percent as compared with a 2015 baseline study that includes competitive proteins.

National Pork Board 2015-2020 Strategic Plan | 9
PARTNER
COLLABORATE
CONTINUOUS
ETHICSQUALITY
NUTRITION
SAFETYIMPROVEMENTRESEARCH
PROTEIN
COMMITMENT
SUSTAINABILITYPRODUCTIVITY
TRUST
PROMOTION
EDUCATE
SOCIAL RESPONSIBILITY
OUTREACH
TRAININGCARE
SITUATION & MARKET ANALYSISThe National Pork Board: The situation and market analysis below stems from the work of Dr. Steve Meyer and Dr. Dan Sumner.
The National Pork Board conducted a thorough situation and market analysis when developing its 2015 strategic plan. As part of that effort, data was reviewed from a variety of inputs, and a list of factors working for and against the National Pork Board was developed. In addition, economic forecasts and analysis were conducted by agricultural economists Steve Meyer and Dan Sumner. Below is a list of significant factors impacting the National Pork Board and its current environment.
Consumer and Retailer Education is a PriorityAnti-meat activists - citing everything from animal welfare issues to sustainability and antibiotic concerns - were part of the conversation surrounding the development of the strategic plan. The proliferation of social media and rise in undercover videos have helped to magnify the focus on animal welfare.
While there is an understanding in the industry that activists’ messages are emotionally driven, there is also concern that simply relaying the science behind modern pork production is not enough. The pork industry challenges stem from negative perceptions of “big ag” and an affinity for more pastoral images of a by-gone era.
This vocal minority is having an impact throughout the supply-chain. Some retailers and foodservice operators are succumbing to anti-ag pressures, often putting new restrictions on farmers. Some procurement policies have been developed and others debated regarding sow housing, antibiotic use and other production technologies.
It is expected that retailers and foodservice operators will continue to show a strong interest in knowing more about farm practices and encouraging farmers to meet demands of stakeholder opinion leaders even more than actual pork consumers.
Porcine Epidemic Diarrhea Virus (PEDV) Sheds Light on Threats of Foreign Animal Disease The pork industry is facing PEDV, which has impacted as many as 8 million piglets. Fear of PEDV and other potential foreign animal diseases is a top concern among producers. The current situation placed increased focus on the ability of the industry to effectively monitor and plan for potential disease threats.
Future Is Bright for Domestic Market Currently, about 75 percent of U.S. pork production stays within the U.S. market. Per capita pork consumption is expected to increase modestly in the United States and return to that of a decade ago, but that depends on a competitive price. In the foodservice arena, there is a marked increase in U.S. consumption of pork, which is outpacing sales of all other proteins. U.S. real per capita expenditures for pork is at a 10-year high and growing.
Despite increased attention being put on animal agriculture, people are spending more money on meat even while per capita income fails to grow. Following a year where animal activism increased its pressure through the release of undercover videos and the use of social media, people not only continued to buy meat, but in fact, bought more meat and paid more for it.
Opportunities Abound in Asia – Rising Middle Class Demands More MeatAsia and Latin America are the big story for the future, with 30-year projections of income growth and a rising middle class consuming more protein and produce. The share of animal calories will continue to increase, replacing plant sources around the world. We will see more food imported from the United States to China, as well as increased shipments of pork (vs. feed). The population movement from rural to urban China is worth watching because urbanization tends to boost income and demand for quality food and animal products.

10 | National Pork Board 2015-2020 Strategic Plan
PARTNER
COLLABORATE
CONTINUOUS
ETHICSQUALITY
NUTRITION
SAFETYIMPROVEMENTRESEARCH
PROTEIN
COMMITMENT
SUSTAINABILITYPRODUCTIVITY
TRUST
PROMOTION
EDUCATE
SOCIAL RESPONSIBILITY
OUTREACH
TRAININGCARE
Productivity IncreasesProductivity of the average pig farmer has increased, with pigs per litter and average market hog weights both increasing. This creates an average annual 2.6 percent increase in the amount of pork entering the market, with 2014 being an exception due to PEDV. Even so, we need to see increased production per sow with production growth and efficiency necessary to compete with other pork-producing countries to capture an ever-increasing share of Asian and Latin American markets for the United States.
The worst is behind us in terms of grain input costs. Ethanol growth has slowed, yields continue to grow and barring another drought, corn and soybean supplies should be ample.
THE STRATEGIC PLANNING TASK FORCEThe National Pork Board selected a team to serve on its Strategic Planning Task Force. The purpose of the task force was to provide input from a variety of stakeholders throughout the supply-chain — producers, processors, foodservice and retail customers and other interested parties. The 2014 task force included the following members:
Jay Akridge | Purdue UniversityJan Archer | Archer Farms, North CarolinaBob Dykhuis | Dykhuis Farm, MichiganRich Gallant | Cargill Meat SolutionsJim Heimerl | Heimerl Farms LTDJoe Jordan | Domino’s PizzaRoy Lee Lindsey | Oklahoma Pork CouncilDale Norton | Kendale Farm, MichiganRick Parker | JBS USA, LLC
Karen Richter | DKR Swine Farm, MinnnesotaCraig Rowles | Elite Pork Partnership, IowaLeann Saunders | Where Food Comes From, Inc.Mike Skahill | Smithfield Foods, Inc.Randy Spronk | Spronk Brothers, MinnnesotaJoe Swedberg | Hormel FoodsGlen Walters | Walters Farm, GeorgiaLarge National Retailer Representative

National Pork Board 2015-2020 Strategic Plan | 11
PARTNER
COLLABORATE
CONTINUOUS
ETHICSQUALITY
NUTRITION
SAFETYIMPROVEMENTRESEARCH
PROTEIN
COMMITMENT
SUSTAINABILITYPRODUCTIVITY
TRUST
PROMOTION
EDUCATE
SOCIAL RESPONSIBILITY
OUTREACH
TRAININGCARE
THE PROCESSAt the onset of the strategic planning process, the National Pork Board recognized the importance of including various stakeholders, as well as getting a thorough look at the environment in which the organization is operating. Thus, a strategic planning task force was carefully chosen, and various inputs were reviewed prior to development of the plan. The graphic below explains those inputs:
*Pork Foresight is an extension of Food Foresight, a system - designed by Nuffer, Smith, Tucker and the California Institute of Food and Agricultural Research at the University of California, Davis - for anticipating, planning for and managing trends/issues likely to impact the agri-food chain. Each year, a cross-disciplinary team of Food Foresight panelists review and analyze data to determine top trends/issues, and a Food Foresight trends intelligence report is issued. For Pork Foresight, a specially assembled team examined the trends report and drew implications for the National Pork Board. In addition, a data scan was conducted of pork-specific data. See page 23 for a summary of Pork Foresight findings.
The Situation
Strategic Planning Task Force launched planning process
Strategic Planning Task Force scrutinized the situation and made recommendations, vision and goals; provided input to staff on SMART objectives
Staff developed SMART objectives with input from committees
Management scrutinized objectives and made final recommendations to task force
Strategic Planning Task Force made final recommendations on vision, vision, goals and SMART objectives and provided input to board
National Pork Board Board final approval of strategic plan
Review of existing National Pork Board consumer and
stakeholder research
Pork Foresight* trends analysis
Staff perceptions of National Pork Board strengths/weaknesses,
external threats/opportunities
Progress against existing National Pork Board strategic plan
Interviews and surveys with pork
industry/supply-chain stakeholders
Board perceptions of pork industry, National Pork
Board, core values and National Pork Board’s role in shaping the
future of the industry
Macro-economic analysis by Dr. Dan
Sumner and Dr. Steve Meyer

12 | National Pork Board 2015-2020 Strategic Plan
PARTNER
COLLABORATE
CONTINUOUS
ETHICSQUALITY
NUTRITION
SAFETYIMPROVEMENTRESEARCH
PROTEIN
COMMITMENT
SUSTAINABILITYPRODUCTIVITY
TRUST
PROMOTION
EDUCATE
SOCIAL RESPONSIBILITY
OUTREACH
TRAININGCARE
SUMMARY OF INPUTSThe following audiences provided input both in evaluating the last strategic plan and for the creation of the 2015-2020 plan. What you see here is a summary of relevant, forward-looking inputs.
Board Summary: The board advocated for greater synergy with packers and the entire supply-chain. In addition, the concept of leadership was discussed in detail, with the board defining leadership at the National Pork Board as engaging and motivating others to pursue a collaborative direction on issues as a shared vision, shared effort and shared success.
Staff Summary: The staff expressed a desire for better alignment behind the strategic plan and vision. In addition, they sought clearer direction on when to adopt or drop tactics. Finally, the staff suggested a need to better measure objectives and address issues related to organizational structure.
Committees at Unified Research Meeting: The committees also underscored a need to better align behind the plan, with some committees using it and some not. According to the committees, there’s not enough communication/collaboration between committees on implementing the plan. Also, defining and measuring success is an ongoing challenge.
Packer Summary: Packers felt that the industry could do a better job of communicating the benefits of modern agriculture and that the industry is not taking advantage of the emotional connection people have with their food. Animal welfare was among the top issues identified. Simultaneously, the packers interviewed expressed a desire to protect the rights and ability to produce pork in a socially responsible way. Packers - like other stakeholders - underscored the need for collaboration between industry groups on efforts and the need to leverage dollars.
Trade Group Summary: Trade groups noted that production practices have become marketplace issues, therefore creating a need for communication about the industry and its practices. Trade groups felt the industry needs to be more proactive, transparent and connected to public values and concerns - not just science. This audience also advocated for a common industry communication strategy - rooted in collaboration - that includes a focus on which practices to defend, which practices need new alternatives and strategies to engage consumers.
Marketing Channel Summary: Marketing channel stakeholders do not feel that the industry defends itself well. The need to address issues and lead the discussion was a universal refrain. There is a desire for the industry to be more proactive and less reactive, and to speak with one voice. Sustainability, animal welfare and antibiotics are big issues on the radar and are emotional issues for many stakeholders. Transparency and not “hiding behind the science” were mentioned as key to engaging with stakeholders.
NGO Summary: NGOs provided high praise for environmental accomplishments. There was support for consolidation at production and slaughter. NGOs expressed a desire to work with the pork industry on continuous improvement initiatives.
Pork Foresight Summary: The panel recommended the following: • Concentrate on environmental vulnerabilities.• Enhance pork’s health halo by investing in today’s research technologies to determine specific health benefits
to specific population clusters.• Develop and clearly articulate a business model and brand promise that engages moderate thought leaders
around a vision of responsibility, sustainability and continuous improvement.• Engage and build credibility for the pork industry with domestic and international consumers and regulatory agencies• Anticipate, chronicle and strengthen the pork industry’s food safety and disease vulnerabilities.• Strengthen issue anticipation/management/crisis response system.• Seize opportunities in emerging global markets.
The panel identified the following as a game-changing opportunity: Brand U.S. pork as the protein category leader in sustainable-intensive farming. As part of this effort to elevate pork’s image, the panel recommended the strategic plan be focused to:
National Pork Board 2015-2020 Strategic Plan | 13
PARTNER
COLLABORATE
CONTINUOUS
ETHICSQUALITY
NUTRITION
SAFETYIMPROVEMENTRESEARCH
PROTEIN
COMMITMENT
SUSTAINABILITYPRODUCTIVITY
TRUST
PROMOTION
EDUCATE
SOCIAL RESPONSIBILITY
OUTREACH
TRAININGCARE
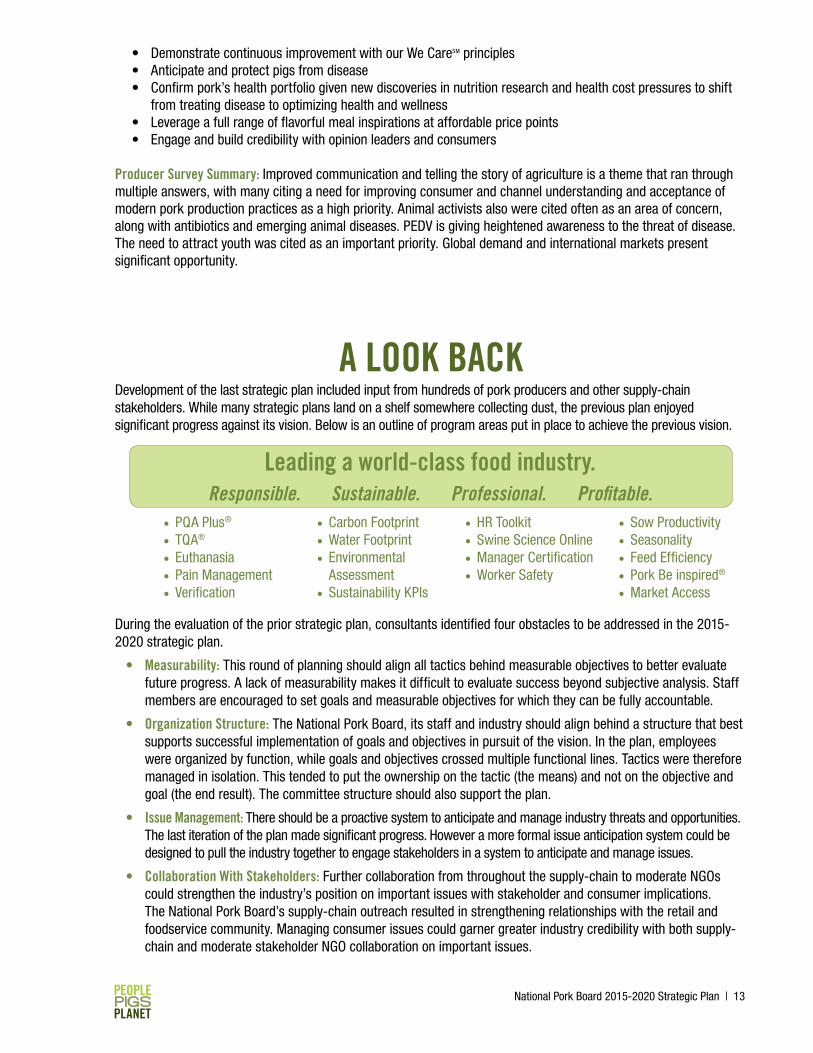
A LOOK BACKDevelopment of the last strategic plan included input from hundreds of pork producers and other supply-chain stakeholders. While many strategic plans land on a shelf somewhere collecting dust, the previous plan enjoyed significant progress against its vision. Below is an outline of program areas put in place to achieve the previous vision.
During the evaluation of the prior strategic plan, consultants identified four obstacles to be addressed in the 2015-2020 strategic plan.
• Measurability: This round of planning should align all tactics behind measurable objectives to better evaluate future progress. A lack of measurability makes it difficult to evaluate success beyond subjective analysis. Staff members are encouraged to set goals and measurable objectives for which they can be fully accountable.
• Organization Structure: The National Pork Board, its staff and industry should align behind a structure that best supports successful implementation of goals and objectives in pursuit of the vision. In the plan, employees were organized by function, while goals and objectives crossed multiple functional lines. Tactics were therefore managed in isolation. This tended to put the ownership on the tactic (the means) and not on the objective and goal (the end result). The committee structure should also support the plan.
• Issue Management: There should be a proactive system to anticipate and manage industry threats and opportunities. The last iteration of the plan made significant progress. However a more formal issue anticipation system could be designed to pull the industry together to engage stakeholders in a system to anticipate and manage issues.
• Collaboration With Stakeholders: Further collaboration from throughout the supply-chain to moderate NGOs could strengthen the industry’s position on important issues with stakeholder and consumer implications. The National Pork Board’s supply-chain outreach resulted in strengthening relationships with the retail and foodservice community. Managing consumer issues could garner greater industry credibility with both supply-chain and moderate stakeholder NGO collaboration on important issues.
• Demonstrate continuous improvement with our We Caresm principles• Anticipate and protect pigs from disease• Confirm pork’s health portfolio given new discoveries in nutrition research and health cost pressures to shift
from treating disease to optimizing health and wellness• Leverage a full range of flavorful meal inspirations at affordable price points• Engage and build credibility with opinion leaders and consumers
Producer Survey Summary: Improved communication and telling the story of agriculture is a theme that ran through multiple answers, with many citing a need for improving consumer and channel understanding and acceptance of modern pork production practices as a high priority. Animal activists also were cited often as an area of concern, along with antibiotics and emerging animal diseases. PEDV is giving heightened awareness to the threat of disease. The need to attract youth was cited as an important priority. Global demand and international markets present significant opportunity.
Leading a world-class food industry.Responsible. Sustainable. Professional. Profitable.
• PQA Plus®
• TQA®
• Euthanasia• Pain Management• Verification
• Carbon Footprint• Water Footprint• Environmental
Assessment• Sustainability KPIs
• HR Toolkit• Swine Science Online• Manager Certification• Worker Safety
• Sow Productivity• Seasonality• Feed Efficiency• Pork Be inspired®
• Market Access

14 | National Pork Board 2015-2020 Strategic Plan
PARTNER
COLLABORATE
CONTINUOUS
ETHICSQUALITY
NUTRITION
SAFETYIMPROVEMENTRESEARCH
PROTEIN
COMMITMENT
SUSTAINABILITYPRODUCTIVITY
TRUST
PROMOTION
EDUCATE
SOCIAL RESPONSIBILITY
OUTREACH
TRAININGCARE
CREATING ALIGNMENTIn many organizations, different parts of the entity work independently, often with different priorities and goals. The result is a lack of focus and effectiveness.
In a strategic-thinking/behaving organization, all parts are working together for a common vision - that is what alignment is all about.
Organizational alignment means that the vision is the driving force behind all activities. Goals should support the vision, and SMART objectives support the goals. Tactics should be evaluated in terms of their contribution to the objectives. Thus, if a tactic does not support an objective (and ultimately a goal and the vision), then it should not be considered. When a tactic is put in place that is not in alignment with the plan, the result is “shoehorning,” which should be avoided.
Typical Organization
Board Committees Staff Other Trade Associations
Marketing Chain
Producers
A Strategic-Thinking/Behaving Organization
Board Committees Staff Other Trade Associations
Marketing Chain
Producers
The graphic below demonstrates the planning process and how all roads stem from the vision.
Vision
Values
Culture (practices and
behaviors)
Results
Stakeholders
Infrastructure (board, CEO, committees)
Resources
Priorities
Objectives
Tactics
Deliverables
STRA
TEGY
BEHAVIOR
Stakeholder Input/Business Environment
National Pork Board 2015-2020 Strategic Plan | 15
PARTNER
COLLABORATE
CONTINUOUS
ETHICSQUALITY
NUTRITION
SAFETYIMPROVEMENTRESEARCH
PROTEIN
COMMITMENT
SUSTAINABILITYPRODUCTIVITY
TRUST
PROMOTION
EDUCATE
SOCIAL RESPONSIBILITY
OUTREACH
TRAININGCARE
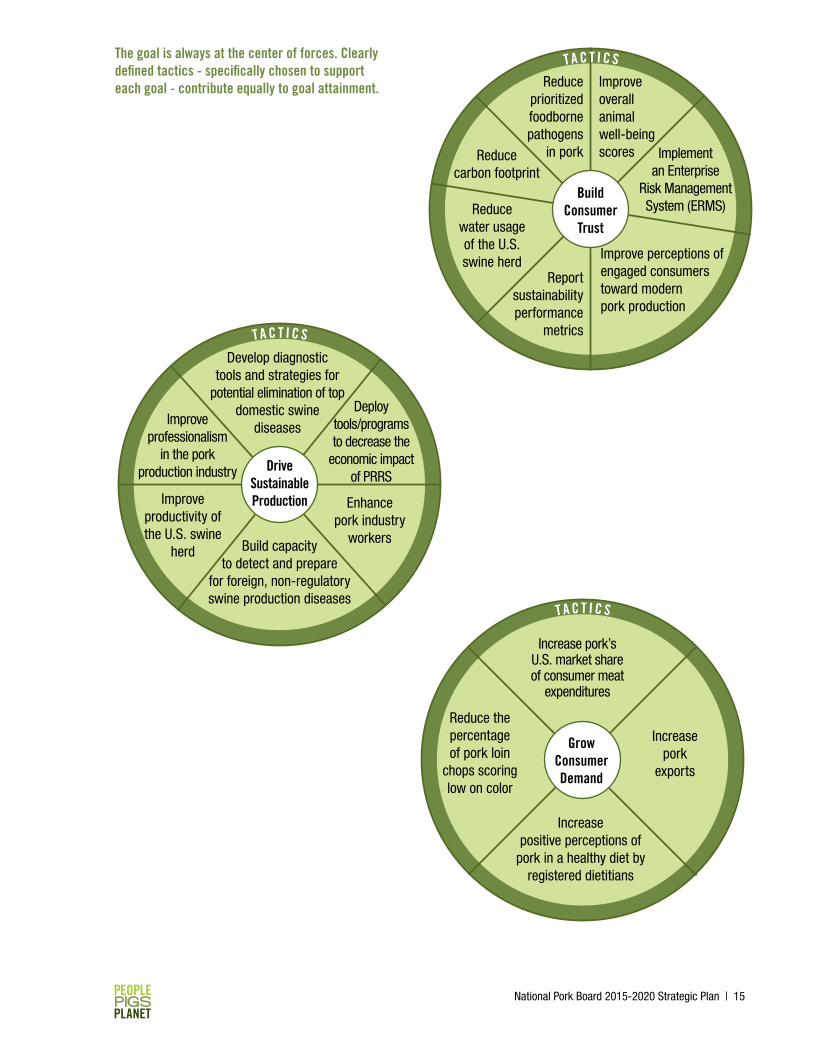
The goal is always at the center of forces. Clearly defined tactics - specifically chosen to support each goal - contribute equally to goal attainment.
Build Consumer
Trust
Reduce prioritized foodborne pathogens
in pork
Improve overall animal well-being scores
Reduce water usage of the U.S. swine herd
Implement an Enterprise
Risk Management System (ERMS)
Improve perceptions of engaged consumers toward modern pork production
Report sustainability performance
metrics
Reduce carbon footprint
TA C T I C S
TA C T I C S
Drive Sustainable Production
Deploytools/programs to decrease the
economic impact of PRRS
Enhance pork industry
workersBuild capacity to detect and prepare
for foreign, non-regulatory swine production diseases
Improve productivity of the U.S. swine
herd
Improve professionalism
in the pork production industry
Develop diagnostic tools and strategies for
potential elimination of top domestic swine
diseases
TA C T I C S
Increase pork’s U.S. market share of consumer meat
expenditures
Increase pork
exports
Increasepositive perceptions of
pork in a healthy diet by registered dietitians
Reduce the percentage of pork loin
chops scoring low on color
Grow Consumer Demand
16 | National Pork Board 2015-2020 Strategic Plan
PARTNER
COLLABORATE
CONTINUOUS
ETHICSQUALITY
NUTRITION
SAFETYIMPROVEMENTRESEARCH
PROTEIN
COMMITMENT
SUSTAINABILITYPRODUCTIVITY
TRUST
PROMOTION
EDUCATE
SOCIAL RESPONSIBILITY
OUTREACH
TRAININGCARE
CRITICAL FACTORS FOR SUCCESSAs the result of reviewing all inputs into the strategic plan, the National Pork Board leadership, in conjunction with the task force and external consultants, determined eight critical factors for success.
1. Focus on outcomes: All organization efforts/tactics need to measurably contribute to the outcomes defined in the strategic plan’s SMART objectives and be challenged based on cost vs. contribution to achieving the outcome.
2. Create behavior change: The National Pork Board’s vision and mission are to be a catalyst for continuous improvement. This implies behavior change, such as practice improvements or stakeholder support, that should be the center of the National Pork Board’s success.
3. Leverage resources: The National Pork Board’s resources are limited, but by acting as a catalyst, there is unlimited opportunity to align and leverage the full value chain’s resources, including money, expertise and systems to achieve the vision.
4. Communicate well (internal and external): Communication needs to link the plan with people both internally and externally in order to energize and provide direction on the plan and to create opportunity for engagement.
5. Develop a system for anticipation and management of issues: A complete and formal system that engages the industry is critical to ensure the industry is proactive and aligned in managing issues.
6. Collaborate with the supply-chain at multiple touch points: This involves working with the full-value chain whenever and wherever possible.
7. Ensure the structure supports the plan: The structure of the organization needs to be aligned to achieve the goals. As goals change, the structure needs to be assessed to ensure it supports achieving the desired results.
8. Create an evaluation system for accountability: To ensure the most effective use of resources, it is critical that there is an ongoing evaluation and adjustment process for the strategic plan. The board is ultimately responsible and should lead this process.
EVALUATIONThe Strategic Planning Task Force defined it is the responsibility of the board to evaluate success.
• The tactics are mile markers in the journey to achieve the objectives. Monthly reports can include updates on tactics.
• The board can develop a dashboard of measures.
• Regular tracking within the plan can be difficult, particularly in the area of research.
• Committees may summarize tactic achievement on a quarterly basis and share across committees.
• Results should be shown in relation to goals and objectives for full context, not in pieces. Answer questions: How have our actions helped move us closer to reaching our objectives?
• Structure will impact the evaluation.
• Ask how willing are we to remove tactics that don’t fit the plan?

National Pork Board 2015-2020 Strategic Plan | 17
PARTNER
COLLABORATE
CONTINUOUS
ETHICSQUALITY
NUTRITION
SAFETYIMPROVEMENTRESEARCH
PROTEIN
COMMITMENT
SUSTAINABILITYPRODUCTIVITY
TRUST
PROMOTION
EDUCATE
SOCIAL RESPONSIBILITY
OUTREACH
TRAININGCARE
BOARD RETREAT SUMMARY OverviewThe December 2013 board retreat included directors and some senior staff members. The goals were four-fold:1. Understanding the National Pork Board planning
process.2. Clarifiying the board’s role in the strategic plan.3. Defining the board’s industry leadership role.4. Giving input to the Force Field Analysis process,
specifically the forces working for and against the successful implementation of National Pork Board’s vision for the future.
Each board member was surveyed prior to the retreat, and themes from the interviews drove the design and facilitation of the agenda.
Themes and ConclusionsGeneral• Some believe the “world-class” description in the
vision is arrogant.• There were differences of opinion on the use of
profitability in the vision statement. While some suggested that the industry not run away from it, others suggested another way of framing profitability (e.g., success).
Board’s Role in Strategic Planning• Provide direction to the planning task force• Provide input to the process.• Review all information provided and give feedback
when requested or unclear.• Thoroughly understand the recommended plan.• Approve the plan, making modifications if desired.• Own the plan as the roadmap for the National Pork Board• Monitor progress against the objectives; make
adjustments as needed.
Board Consensus on the National Pork Board Leadership Definition
Leadership at National Pork Board is engaging and motivating others to pursue a collaborative direction on issues as a shared vision, shared effort and shared success.
Board Consensus on National Pork Board Core Values These are the heart and soul of the organization – past and future• We value all aspects of diversity and strive for
collaboration.• We embrace the industry’s We Caresm principles• We do what’s right … for pigs, producers, people
and the planet.• We are proactive in defining solutions for emerging
challenges.• We are committed to continuous improvement in all
we do.
Board Direction to Planning Task Force • Make recommendations within the parameters of the
act/order.• Recognize diversity within the pork industry.• Review the previous plan and accomplishments.• Provide feedback on leadership continuum.*• Provide counsel on how to create greater synergy
with the packers and the supply-chain.• Provide counsel on budget allocations.
Questions to Consider• Does the vision need to be revised in consideration
of some people’s feelings about “world-class” and “profitability?”
• How do we implement the leadership definition? • Does the staff and management buy into the values
and are there any missing values?
Forces working for and against success with the vision**
* Leadership continuum, page 26** See Force Field Analysis diagram, page 27
STAFF MEETING SUMMARYOverviewThe November 2013 meeting included all National Pork Board staff with the goal of helping staff understand, value and own the strategic planning process. The agenda included a discussion of the strategic planning process, current and future vision, internal forces working for and against achieving the vision (force field analysis), SMART objectives and alignment with the strategic plan and how staff can integrate what they learned into future activities.
ThemesCurrent Vision • Staff agreed there are many areas where the vision
is strong – including the pillars of responsible, sustainable, professional and profitable – but they focused on areas of improvement.
• Areas cited for improvement include:· More specificity – many staff expressed concern
that the vision is “too broad,” and “somewhat
APPENDIX

18 | National Pork Board 2015-2020 Strategic Plan
PARTNER
COLLABORATE
CONTINUOUS
ETHICSQUALITY
NUTRITION
SAFETYIMPROVEMENTRESEARCH
PROTEIN
COMMITMENT
SUSTAINABILITYPRODUCTIVITY
TRUST
PROMOTION
EDUCATE
SOCIAL RESPONSIBILITY
OUTREACH
TRAININGCARE
APPENDIXunclear.” One person said it is a “mile wide and an inch deep.” Many expressed concern that there is too much room for interpretation. “What does ‘world-class’ mean?”
· Inclusion of pork reference – staff expressed concern that there is no reference to pork or protein in the vision. “Missing reference to pork” and “not pork-specific” were mentioned.
· No clear finish line and concern over whether or not the vision addresses all audiences.
Vision Ideas (Staff Were Asked to Rewrite The Vision for Potential Improvements)• Many pillars of the vision were included in rewrites –
responsible, sustainable, profitable, professional.• New words/themes included: transparency, pork
or protein, U.S., global, healthy or nutritious, environment and safety.
Internal Forces Working Against Achieving the Vision• Silos, cited as hindering cross collaboration and
communication; the plan of work/planning process/committee structures, which includes different priorities; lack of focus, i.e. “trying to be all things to all people;” and limited resources, including funding and workload.
Internal Forces Working for Achieving the Vision* • Staff who have a high level of expertise and passion;
work culture, including office morale and cross functionality with other departments; relationships and trust with producers; rich heritage/leadership and longevity of experience; and technology/professional expertise.
Moving Forward Discussion• Alignment with the strategic plan. Focus on the
strategic plan, make sure future plans/goals line up with the vision and not allow shoehorning. If it doesn’t fit, drop the tactic.
• The importance of SMART objectives. Work to make objectives more measurable, do a better job of defining measurable objectives and use the SMART process more when creating personal goals.
• Desire to understand their role in helping achieve the vision, particularly administrative and support staff.
Implications to the Industry and Strategic Planning Process • While overall elements of the vision are liked by staff,
there is lack of clarity on how elements of the vision should be interpreted, which may lead to inconsistent communication about the vision – i.e. where the organization is going, internally and externally.
• The vision may be strengthened with additional focus and specificity.
• The strategic planning process should look at structure to address silo issue/committee structure challenges.
• Staff members are passionate not only about their jobs, but also their role in the strategic planning process. They expressed a willingness and desire to change behavior (e.g. by developing SMART objectives) to better align with the vision of the organization.
Questions to Consider• When the new vision and plan are developed, how
can we ensure all staff and internal audiences have clarity about the direction of the organization? What type of education/training may be needed?
• How can the National Pork Board ensure alignment happens on an ongoing basis? Should there be an ombudsman or “alignment officer”?
NATIONAL PORK BOARD PROGRAM COMMITTEES AT UNIFIED RESEARCH MEETING SUMMARY
OverviewAt the Unified Research Meeting in February 2014, committee members were introduced to the strategic planning process and their role in developing and implementing the plan. The current plan was reviewed, and participants conducted an exercise within their committees to discuss: 1) What’s working with regard to how the committees use the plan? 2) What’s not working with regard to how the committees use the plan? and 3) How can each committee improve efforts to support the next iteration of the plan? In addition, participants shared what they think are the most pressing priorities/vulnerabilities for the organization via a voting-based
exercise and discussion.
Themes from committee-based exercise:• Overall, there were inconsistencies in how each
committee used the plan – some used it to guide their actions while others did not. There was no uniform approach to how the plan is used.
• One committee said it “always uses the plan to guide tactic and program development” while another said it had “lack of alignment with the previous strategic plan.”
• Several committees felt they didn’t get enough direction/feedback from the board and “need better definition of priority of needs.”

National Pork Board 2015-2020 Strategic Plan | 19
PARTNER
COLLABORATE
CONTINUOUS
ETHICSQUALITY
NUTRITION
SAFETYIMPROVEMENTRESEARCH
PROTEIN
COMMITMENT
SUSTAINABILITYPRODUCTIVITY
TRUST
PROMOTION
EDUCATE
SOCIAL RESPONSIBILITY
OUTREACH
TRAININGCARE
APPENDIX• Communication/collaboration between committees was cited as “not working” with regard to implementation of the strategic plan.
• Defining and measuring success is an ongoing challenge for many committees.
Input from voting-based exercise:• 66 percent of respondents said they are “extremely
familiar” with National Pork Board activities; 31 percent said they are “unsure” of the activities; 2 percent are “not familiar.”
• When asked to rate the performance of the National Pork Board in representing the overall interest of pork producers:
Rating % of votersExcellent 7%
Very Good 34%
Good 42%
Fair 14%
Poor 2%
• Committee members rated the National Pork Board’s performance in each of the critical issues/goals:
Rating Operating Freedom
Enhanced Demand*
Comp. Global Advantage
Excellent 8% 12% 3%
Very Good 30% 29% 40%
Good 44% 39% 39%
Fair 17% 17% 17%
Poor 1% 3% 0%
% Excellent, Very Good** 38% 41% 44%
* Note the Domestic Marketing Committee was not present **This metric will allow for comparison between metric reported for staff survey, i.e. self evaluation of progress.
Implications to the Industry and Strategic Planning Process • Committees need more education about the strategic
plan and how to use it within the context of their work so that all committee work is in alignment with the plan.
• Increased communication between committees may help create synergies and improve overall effectiveness.
• According to the committees, performance was best related to Competitive Global Advantage (44 percent ranked performance as “excellent” or “very good”), followed by Enhanced Demand (41 percent ranked performance as “excellent” or “very good”), and lastly Operating Freedom (38 percent ranked performance as “excellent” or “very good”). Also, the Domestic Marketing Committee did not participate in this exercise at the Unified Research Meeting but did so separately.
• Some members of the committees were “unsure” of National Pork Board activities (33 percent) demonstrating room for improved communication regarding activities.
• Foreign/emerging animal disease are the No. 1 threat according to this group, followed by animal welfare and reputation of modern agriculture. (NOTE: Several comments were made about the subjectivity of how the threats were worded, leaving room for interpretation about the meaning and severity of the threat.)
• When asked to rank threats in order of priority:
Threat Most Frequent Ranking
Foreign/emerging animal disease 1
Animal welfare 2
Reputation of Modern Agriculture 3
Pork safety 4
Human Health and Nutrition Issues 5
Feed Availability 6
Questions to Consider• What mechanisms can be put in place to ensure that
the work of the committees aligns with the plan?
PACKER INTERVIEW SUMMARYOverviewThree packer executives were interviewed to gain input into the National Pork Board’s strategic planning process. Interviewees included executives with Pine Ridge Farms, Johnsonville Foods and Seaboard Foods.
Themes cited by more than one interviewee:
Strengths • The industry is seeing increases in demand.
• Pork is a good price value over beef. • Export sales are strong.
Vulnerabilities • We’ve bred the flavor out of pork.• People overcook pork.• The industry is not consumer-focused.• Science shouldn’t be the criteria for sensitive
consumer issues. If we don’t get more sensitive to consumer perceptions, we can expect the

20 | National Pork Board 2015-2020 Strategic Plan
PARTNER
COLLABORATE
CONTINUOUS
ETHICSQUALITY
NUTRITION
SAFETYIMPROVEMENTRESEARCH
PROTEIN
COMMITMENT
SUSTAINABILITYPRODUCTIVITY
TRUST
PROMOTION
EDUCATE
SOCIAL RESPONSIBILITY
OUTREACH
TRAININGCARE
APPENDIXgovernment to intervene. • We have not done a good job of communicating the
benefits of modern agriculture. • We’ve got to start listening to how stakeholders view
these issues. • We’re a fractured industry and don’t speak with one
voice.• Two of the three interviewees put animal welfare
issues at the top of their priorities. We need to adopt a “hormone-free-if-that’s-what-you-want” attitude.
Meeting customer needs• We’re not taking advantage of the emotional
connection people have with their food (e.g., bacon). • Pork is not easy to prepare and therefore not
positioned as an everyday food. • New ideas don’t have industry funding.• Connect to the people who care about animals and
the environment. The people we have involved are good people. We need to put a face on them and demonstrate that our corporate structures benefit consumers with strong controls and systems.
Perceptions of the National Pork Board • The Pork Board does a good job of keeping us informed. • The Pork Board should be in the front helping to set
direction. • Keep focus on the whole industry. Help small producers
understand the importance of a healthy industry. • The interviewees are supportive of the vision and
broad direction the National Pork Board is taking, but it depends on what the criteria are for each of the pillars. Without criteria, there’s no way to measure results (e.g. Is the current housing sustainable? Are we being responsible when we don’t label country of origin?)
Perceptions of the visionThe “responsible” pillar was ranked an 8 on a scale of 1–10 by two of the interviewees and a 5 by the third (“Some aren’t being responsible, though it’s better than it was a few years ago.”) “Sustainable” and “professional” received similar rankings. “Profitable” was not rated. One interviewee viewed sustainability beyond the environment with animal welfare, community involvement and economic sustainability. Regarding animal welfare, one interviewee said that training isn’t where it should be because we’re not doing needed industry follow-up.
Perceptions of the goalsOperating freedom: One interviewee challenged this goal. “How can you protect the rights and ability to produce pork in a socially responsible way without defining ‘socially responsible.’ Another interviewee said he supported this operating freedom goal because it’s headed in the right direction. “We’re starting to look at being proactive.”
Enable pork producers to remain highly competitive: A lot is being done behind the scenes. It shows with PEDV. What about the small guy? He can’t compete. Not much has been done for the specialty groups. The Pork Board needs measurable goals tied to the customer/consumer.
Take-away messages• Get out in front of issues and lead the discussion. It’s
a totally different world out there.• We can’t afford to wait for something to brew. We
need to get out ahead of these issues.• Transparency and communication become the
foundation for staying ahead of the game.• Need balance between a pork (as a food) message
and the pork industry message. • Do a better job of collaborating among all the groups
that have something to do with pork. • The National Pork Board’s primary role is to promote
pork. Joint promotions with packers and retailers leverage dollars and take the message to the consumer. Leveraged dollars support repeat usage.
• We value the Pork Board’s role in helping to forecast the future for the industry. Put the reports out more often because we use/value the information.
• Natural has become a key word in marketing. • I hear more about the issue of antibiotics and
hormones (people want cleaner labels) than I do about how pigs are raised. The animal welfare issue is very slow to build and not an issue at this time.
• Antibiotic-free pork is an opportunity. No one is doing a good job with it, and we need to get the price down.
• Price value, quality, consistency and “how do I prepare it” are key consumer issues.
• We could do a better job of promoting the nutritional value of pork.
• Sometimes money gets in the way of doing the right thing. We need to do the right thing first.

National Pork Board 2015-2020 Strategic Plan | 21
PARTNER
COLLABORATE
CONTINUOUS
ETHICSQUALITY
NUTRITION
SAFETYIMPROVEMENTRESEARCH
PROTEIN
COMMITMENT
SUSTAINABILITYPRODUCTIVITY
TRUST
PROMOTION
EDUCATE
SOCIAL RESPONSIBILITY
OUTREACH
TRAININGCARE
APPENDIXTRADE ASSOCIATION INTERVIEW SUMMARYOverviewSeven trade group executives were interviewed to gain input into the National Pork Board’s strategic planning process. Interviewees included executives with the National Pork Producers Council, the American Meat Institute, the U.S. Meat Export Federation, the Animal Agriculture Alliance, the Food Marketing Institute, the National Restaurant Association and U.S. Farmers & Ranchers Alliance.
Themes repeatedly cited in interviews with trade association executives:
Strengths• A refined system, a great product, an industry culture
of continuous improvement, a tremendous story to tell on use of natural resources – water, land use, carbon footprint – huge potential for exports and the industry has smart people working for it
Vulnerabilities• A disconnect between the customer (retailer,
foodservice and to some extent the packer) and the rest of the industry, animal welfare issues, communicating to the consumer about the industry and production processes that have become marketplace issues (especially with exports)
Perceptions about the National Pork Board• Vast improvements in relevancy, being more open
and being proactive, but still more to do. • Good job keeping trade group executives informed. • Not viewed as being strong at partnerships and
collaboration up and down the supply-chain and with other trade groups. If there is one theme that resonates with almost everyone surveyed, it’s the
need for greater industry collaboration. • Ramp up consumer communication on issues. Two
executives questioned doing domestic marketing given the level of funding and the importance of greater focus on working with producers to instill consumer confidence in production practices.
• With the majority of product going to processing, there is criticism that the board doesn’t do enough for that side of the business.
• Clarifying the Pork Board’s leadership role is critical. Is it related to technology and the marketplace? One executive suggested a role as catalyst for change.
• Another cautioned, “They are not the end-all of everything.” the board gets high marks for its vision and the direction it’s headed.
• The key question is “What are you going to do about these four pillars?”
Take-away messages• The pork industry needs to be more proactive,
transparent and connected to public values and concerns – not just the science of modern pork production.
• The industry needs a common communication strategy that includes a focus on which practices to defend, which practices need new alternatives and investments in those alternatives and how best to engage the public.
• Working with moderate NGOs appears to have support, with one executive saying, “We need allies because we have enemies. We need to do a better job of reaching for support beyond the producer.”
• Two questions received multiple mentiones: 1) Do we have the right allocation of resources? 2) Are we doing enough for the meat processing side of the business?
MARKETING CHANNEL INTERVIEW SUMMARYOverviewSix executives from retail and foodservice chains and one registered dietitian were interviewed to get their input into the National Pork Board’s strategic planning process. Interviewees included executives from Brinkers International, Costco, Sodexo, Wegmans, Wendy’s, Whole Foods and Melissa Dobbins, RD and blogger for soundbitesrd.com
Themes cited repeatedly in interviews:Pork is a great food; bacon is hot; some people have an emotional attachment to bacon; pork is perceived to be healthy protein (an opportunity to align with health professionals) and fits with consumer interest in world cuisines.
Sustainability is a big deal.
Animal welfare was repeatedly cited as a problem. It’s a big target on the industry’s back.
Antibiotics was repeatedly cited as a consumer issue.
Industry is integrated and efficient, but doesn’t defend itself very well. Don’t wait for others to frame your issues, get out in front of issues (e.g., tail docking). Be more proactive and less reactive. Lag behind others in policing its own. Industry does not speak with one voice. Align with Temple Grandin. Decide which issues to defend and which issues to support and be transparent. Tell the story of what you’re doing on these issues.

22 | National Pork Board 2015-2020 Strategic Plan
PARTNER
COLLABORATE
CONTINUOUS
ETHICSQUALITY
NUTRITION
SAFETYIMPROVEMENTRESEARCH
PROTEIN
COMMITMENT
SUSTAINABILITYPRODUCTIVITY
TRUST
PROMOTION
EDUCATE
SOCIAL RESPONSIBILITY
OUTREACH
TRAININGCARE
APPENDIXConversation about food is very different today. People want to know how their food is raised. Consumers want local. Pork trails beef and poultry in small suppliers.
The Pork Board is awesome, but it’s constrained by representing so many producers. Great information resource, but could be more flexible in meeting individual retailer needs. Could relate better to younger audiences. Impressed with progress in creating a new reality that lots of people are embracing.
Strengths• Product versatility • A perceived healthy protein choice • Good product, good story to tell • People can have emotional attachments to bacon as
a product • Well-positioned in global cuisines • Highly integrated and efficient industry • Industry capable of being nimble
Vulnerabilities • Animal welfare issues cited as the No. 1 issue by
most interviewees • Don’t defend themselves well • Reactive, not proactive • Use of antibiotics; industry hides behind science on
tough issues• The science is solid; the argument is flawed• Lack of transparency • Don’t speak with one voice• Industry behind in paying attention to consumers and
their growing concerns • Pay attention to flavor in light of getting so lean that
flavor was removed • Grossly misunderstood perception-driven issues
Meeting customer needs• Good-tasting but may have gone too far on lean • Bacon is a winner, the next chicken wing
• Production issues continue to grow as marketplace issues
• Sustainability is huge – the next major issue on college campuses
• Buy local trend and campus mandates to buy local • Consumers make decisions based on emotion;
science alone doesn’t cut it • There’s value in telling the story of the farmer and
how he treats his animals.
Perceptions of the National Pork Board• Good job keeping us informed on issues • Good job of coordinating and toning down the
sensationalism when there’s an issue • Could play a stronger role in mediating animal
welfare issues for retailers, foodservice, packers and producers
• Could take a bigger role in educating people about the pork industry
• Channel collaboration is valued;and it’s greatly increased • We connect directly with consumers; give us more
tools to position pork and the industry • Impressed with a new reality and want to partner
more with the pork industry; want to feel more a part of your family, not distant cousins
Take-away messages• Get out in front of issues and lead the discussion is a
universal refrain.• Develop a strategic position on animal welfare issues
and either get ahead of the issue or take another route
• Connect with people so they can say, “That’s a value I can really share.”
• Spend more National Pork Board resources to educate at the farm level.
• The pork industry needs to drive their own agenda. Since they don’t, we have to step in and help drive it.
NGO INTERVIEW SUMMARYOverviewTwo executives from moderate NGOs were interviewed to get their input into the National Pork Board’s strategic planning process. The representatives were from the World Wildlife Fund and the Environmental Defense Fund.
Themes cited in interview with NGO executives:• Significant conservation improvements over the last
decade or so • Consolidation at production and slaughter (and that’s
a good thing environmentally)
Strengths• Willingness to engage in conservation issues • An admirable job in getting on top of environmental
issues driven by the regulatory community • Progress on animal husbandry issues • Solid science to justify decisions • New technology on the horizon to help advance
conservation and reduce risk • Sustainable intensification and producing inside are
strengths environmentally • Pork production: high quality, traceability, food safety
and price

National Pork Board 2015-2020 Strategic Plan | 23
PARTNER
COLLABORATE
CONTINUOUS
ETHICSQUALITY
NUTRITION
SAFETYIMPROVEMENTRESEARCH
PROTEIN
COMMITMENT
SUSTAINABILITYPRODUCTIVITY
TRUST
PROMOTION
EDUCATE
SOCIAL RESPONSIBILITY
OUTREACH
TRAININGCARE
APPENDIX• Huge conservation opportunities in the feed grain supply-chain
Vulnerabilities• A perception that the pork industry isn’t as aggressive
as other commodities but is positioned well • Animal welfare and feed
Perceptions of the National Pork Board• Good at permitting and regulatory issues • Good grower communications • Doing a lot of work to engage and address animal
welfare issues • Would love to collaborate on sustainability issues
(both interviewees).
PORK FORESIGHT MEETING SUMMARYOverviewIn April 2014, four members of the pork industry Strategic Planning Task Force met with two academics with pork experience and seven members of the multi-disciplined Food Foresight trends panel. The group participated at different stages of a process to draw implications from the Food Foresight 2014 trends report and a special issue data run specific to the pork industry. The group was then asked to chronicle and prioritize threats and opportunities facing the pork industry. The group’s recommendations will be delivered to the planning task force as it deliberates on an industry strategic plan.
Priority threats/opportunities*• Concentrate on environmental vulnerabilities (e.g.,
manure management, water quality, air particulates, waste, climate change).
• Enhance pork’s health halo (e.g., microbiome, protein substitutes, processing concerns, health benefits) by investing in today’s research technologies to determine specific health benefits to specific population clusters.
• Develop and clearly articulate a business model and brand promise that engages moderate thought leaders around a vision of responsibility, sustainability and continuous improvement.
• Engage and build credibility for the pork industry with consumers and regulatory agencies (domestic and international).
• Anticipate, chronicle and refine the pork industry’s food safety and disease vulnerabilities.
• Strengthen the issue anticipation/management/crisis response system.
• Seize opportunities in emerging global markets.
* Following a data-driven discussion, we asked each member of the group to assess their top priority threats and opportunities facing the pork industry.
Editorial comments reflecting group discussion“The domestic market will remain the largest source of pork demand, but the dynamic economies of Asia represent the future growth of the U.S. pork industry,” said Food
Foresight’s Dan Sumner, professor of agricultural economics at the University of California, Davis. “That means the industry must continue to keep both types of markets in view and tailor its products and messages to satisfy both long-time customers and the emerging middle class.”
“The reason U.S. pork is so enticing internationally is that it is a wonderful source of high-quality protein that is relatively inexpensive compared to other producing areas or other proteins,” said Food Foresight’s Martha Roberts of University of Florida. “But, focus is a challenge in light of significant PEDV disease losses, mounting feed costs and unchecked environmental vulnerabilities.”
“The pork industry must clearly articulate a business model and brand promise that engages moderate thought leaders and consumers around a vision of sustainability, responsibility and continuous improvement,” said Food Foresight’s Greg Drescher of the Culinary Institute of America. “In the absence of this, the voices that want the industry to go away will hold undue influence with the media, experts and consumers alike.”
“Consumers are looking for experiences that put the foods they buy into a meaningful context,” said Food Foresight’s Bill Bishop of brickmeetsclick.com. “The pork industry can literally brand itself - not as a product per se but as an industry of farmers committed to delivering healthy foods from healthy animals in a healthy environment. This kind of value-driven brand platform when communicated to the marketplace will clearly differentiate the pork industry from other protein providers.”
“The literature documenting the health benefits of pork is dated,” said Food Foresight’s Carl Keen, professor of nutrition and internal medicine at University of California, Davis. “An increased play in health research is an opportunity to document the positive effects of pork with sensitive populations using state-of-the-art methodologies.”
“On the opportunity front, pork can be the protein of choice, aligning health, bold global flavors and consumer value,” said Food Foresight’s Jeff Dlott of SureHarvest. “On the threat side, protein substitutes can position themselves as healthy for people, animals and the planet.”
24 | National Pork Board 2015-2020 Strategic Plan
PARTNER
COLLABORATE
CONTINUOUS
ETHICSQUALITY
NUTRITION
SAFETYIMPROVEMENTRESEARCH
PROTEIN
COMMITMENT
SUSTAINABILITYPRODUCTIVITY
TRUST
PROMOTION
EDUCATE
SOCIAL RESPONSIBILITY
OUTREACH
TRAININGCARE
APPENDIX“Opportunity lies with seeking out and engaging influentials on social issues. Dialogue is a powerful tool if done correctly,” said Food Foresight’s Larry Kaagan of Kaagan Research. “That is, listening to and acknowledging stakeholder concerns without being accusatory or defensive, demonstrating that you care about what they think, correcting misperceptions but also demonstrating your own commitment to continuous improvement and searching for middle ground.
On the other hand, a strategy of continual ‘critic bashing’ runs the risk of inflaming the debate and driving merely curious or legitimately concerned consumers and other stakeholders to those more extreme critics when industry is perceived to be stonewalling and unwilling to hear from dissenting voices.”
“Our We Care program fulfills our pork producer needs, and now we need to connect and engage with consumers,” said Craig Rowles, Elite Pork Partnership.
The greatest game-changing opportunity for the pork industry?Following further discussion, we asked each member of the group to assess the greatest game-changing opportunity for the pork industry. The overwhelming consensus:
“Brand” the pork industry as the protein category leader in sustainable-intensive farming.To deliver on this brand promise means:
• Demonstrating continuous improvement with the We Care platform
• Anticipating and protecting pigs from disease• Confirming pork’s health portfolio• Leveraging a full range of flavorful meal inspirations at
affordable price points• Engaging and building credibility with opinion leaders
and consumers
Pork Foresight PanelFood Foresight panelists
Bill Bishop | Retail Consultant, Brickmeetsclick.comJeff Dlott | SureHarvestGreg Drescher | Culinary Institute of AmericaLarry Kaagan | SociologistCarl Keen | University of California, DavisMartha Roberts | University of FloridaDan Sumner | University of California, Davis
Academic experts with pork experienceRaymond Anthony | University of AlaskaSharon Beals | Maple Leaf Consumer Foods
National Pork Board planning task force representativesJoe Swedberg | Hormel FoodsGlen Walters | Walters FarmsCraig Rowles | Elite Pork PartnershipRoy Lee Lindsey | Oklahoma Pork Council
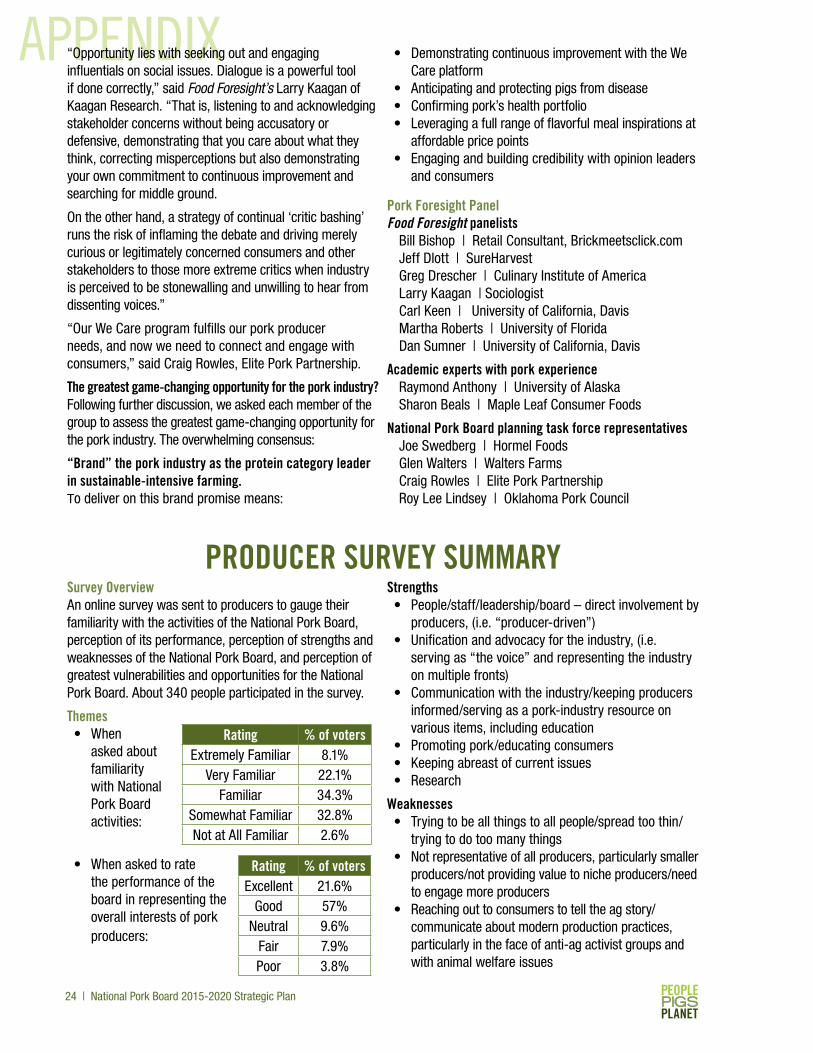
PRODUCER SURVEY SUMMARYSurvey OverviewAn online survey was sent to producers to gauge their familiarity with the activities of the National Pork Board, perception of its performance, perception of strengths and weaknesses of the National Pork Board, and perception of greatest vulnerabilities and opportunities for the National Pork Board. About 340 people participated in the survey.
Themes• When
asked about familiarity with National Pork Board activities:
• When asked to rate the performance of the board in representing the overall interests of pork producers:
Strengths• People/staff/leadership/board – direct involvement by
producers, (i.e. “producer-driven”)• Unification and advocacy for the industry, (i.e.
serving as “the voice” and representing the industry on multiple fronts)
• Communication with the industry/keeping producers informed/serving as a pork-industry resource on various items, including education
• Promoting pork/educating consumers• Keeping abreast of current issues• Research
Weaknesses• Trying to be all things to all people/spread too thin/
trying to do too many things• Not representative of all producers, particularly smaller
producers/not providing value to niche producers/need to engage more producers
• Reaching out to consumers to tell the ag story/communicate about modern production practices, particularly in the face of anti-ag activist groups and with animal welfare issues
Rating % of votersExtremely Familiar 8.1%
Very Familiar 22.1%Familiar 34.3%
Somewhat Familiar 32.8%Not at All Familiar 2.6%
Rating % of votersExcellent 21.6%
Good 57%Neutral 9.6%
Fair 7.9%Poor 3.8%

National Pork Board 2015-2020 Strategic Plan | 25
PARTNER
COLLABORATE
CONTINUOUS
ETHICSQUALITY
NUTRITION
SAFETYIMPROVEMENTRESEARCH
PROTEIN
COMMITMENT
SUSTAINABILITYPRODUCTIVITY
TRUST
PROMOTION
EDUCATE
SOCIAL RESPONSIBILITY
OUTREACH
TRAININGCARE
APPENDIX• Challenges with emerging issues/looking ahead/staying ahead of the game; some respondents also mentioned the speed at which the Pork Board can/does respond is challenging
• Potential conflicts between producer/committee priorities and those of the staff
When asked to rank priorities in order of greatest vulnerability, respondents ranked them in the following order, with 1 being the biggest vulnerability and 6 being the smallest vulnerability: 1. Foreign/emerging animal disease2. Animal welfare3. Reputation of modern ag4. Pork safety5. Health and nutrition6. Feed availability
Respondents were then asked to list other vulnerabilities as an open ended question. The following were themes:• Animal activist and activist groups• Biosecurity• Antibiotic issues• Water/drought• Government regulations• Attracting young/skilled workforce• Trade barriers/market access issues• Environmental issues/pollution• Public image
Respondents were then asked to allocate a $100 budget among various programs.
Program in which to allocate funding Average Allocated
Increase domestic per capita consumption of pork
$17.80
Increase both dollar value and pounds of pork exported to foreign markets
$16.60
Improve consumer/channel understanding and acceptance of modern production practices
$24.50
Conduct research to improve pork productivity and response to disease outbreaks
$24.20
Develop training, education, and certification programs to improve the professionalism of the U.S. Pork industry
$15.20
Respondents were then asked in open-ended questions to list opportunities and areas where they would like the Pork Board to concentrate its efforts. The following themes emerged: • International marketing/emerging markets/global
demand• Public education/outreach/marketing/creating
greater consumer awareness/demand (emphasis
on education about production practices/safety and product benefits), i.e. define pork as great protein source
• Tell our story/improve public perception and reputation and credibility of pork producers
• Attracting youth to the industry • Research and response to disease, particularly
foreign animal disease
Other notes: Animal activist groups were cited throughout the survey, along with the need to communicate about pork production. PEDV also was referenced as an industry game-changer, raising concern over animal disease.
Implications to the Industry and Strategic Planning Process• 78.6 percent of respondents noted the Pork Board
is representing the interests of pork producers as “excellent” or “good.”
• Some feel the Pork Board under-represents the interests of small producers.
• Improved communication/telling the ag story and animal activists were cited throughout the survey.
• Concern over emerging issues, (i.e. antibiotics and emerging animal diseases), and ability of the National Pork Board to respond quickly was cited.
• PEDV gives awareness to the threat of disease.• The need to attract youth was cited as a main
priority. • Global demand and international markets pose an
opportunity.• Respondents felt “improving consumer and channel
understanding and acceptance of modern pork production practices” and “conduct research to improve pork productivity and response to disease outbreaks” ranked highest among areas that should receive funding (out of five identified priorities).

26 | National Pork Board 2015-2020 Strategic Plan
PARTNER
COLLABORATE
CONTINUOUS
ETHICSQUALITY
NUTRITION
SAFETYIMPROVEMENTRESEARCH
PROTEIN
COMMITMENT
SUSTAINABILITYPRODUCTIVITY
TRUST
PROMOTION
EDUCATE
SOCIAL RESPONSIBILITY
OUTREACH
TRAININGCARE
APPENDIXNATIONAL PORK BOARD CONTINUUM OF INFLUENCE FACILITATORS: NATIONAL PORK BOARD/NPPC
Anticipate/prioritize industry threats/opportunities*• Risk/opportunity assessment
(ERMS)• Strategic plan
Issue analysis**• Create issue-specific task force• Share information/engage
industry stakeholders in issue discussion
Determine industry position• Decision: act/not act***
If act, develop plan to drive behavior supporting industry position• Set success benchmarks
Facilitate changes in industry/stakeholder practices• Definitive public statements (e.g. Pork Forum resolution,
board motions, press statements)• Concerted marketing and communication programs• Checkoff cost-share program• Educational campaign• Research
Evaluate changes in industry/stakeholder behaviors
* Set priorities based on impact on industry and vision: Leading a world-class food industry. Responsible. Sustainable. Professional. Profitable.
** Define the issue, identify stakeholders/likely positions/behavioral inclinations, identify likely partners to shape the issue, identify forces working for and against you, draw assumptions of where the issue is headed with no intervention.
*** Put research/education plan in place and collaborate where needed to be a) proactive-accelerate opportunity, redirect threat, and/or adjust industry practices - and/or b) reactive with crisis response plan to respond when needed.
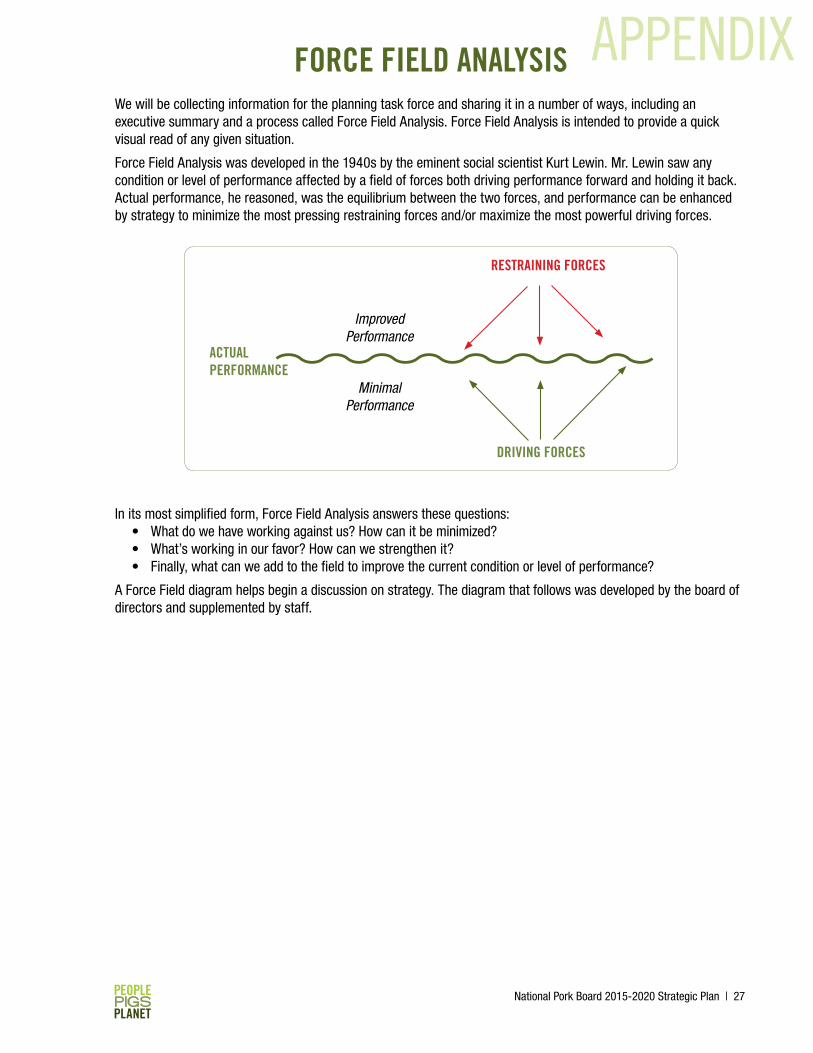
National Pork Board 2015-2020 Strategic Plan | 27
PARTNER
COLLABORATE
CONTINUOUS
ETHICSQUALITY
NUTRITION
SAFETYIMPROVEMENTRESEARCH
PROTEIN
COMMITMENT
SUSTAINABILITYPRODUCTIVITY
TRUST
PROMOTION
EDUCATE
SOCIAL RESPONSIBILITY
OUTREACH
TRAININGCARE
FORCE FIELD ANALYSISWe will be collecting information for the planning task force and sharing it in a number of ways, including an executive summary and a process called Force Field Analysis. Force Field Analysis is intended to provide a quick visual read of any given situation.
Force Field Analysis was developed in the 1940s by the eminent social scientist Kurt Lewin. Mr. Lewin saw any condition or level of performance affected by a field of forces both driving performance forward and holding it back. Actual performance, he reasoned, was the equilibrium between the two forces, and performance can be enhanced by strategy to minimize the most pressing restraining forces and/or maximize the most powerful driving forces.
In its most simplified form, Force Field Analysis answers these questions:• What do we have working against us? How can it be minimized?• What’s working in our favor? How can we strengthen it?• Finally, what can we add to the field to improve the current condition or level of performance?
A Force Field diagram helps begin a discussion on strategy. The diagram that follows was developed by the board of directors and supplemented by staff.
RESTRAINING FORCES
ACTUAL PERFORMANCE
DRIVING FORCES
Improved Performance
Minimal Performance
APPENDIX
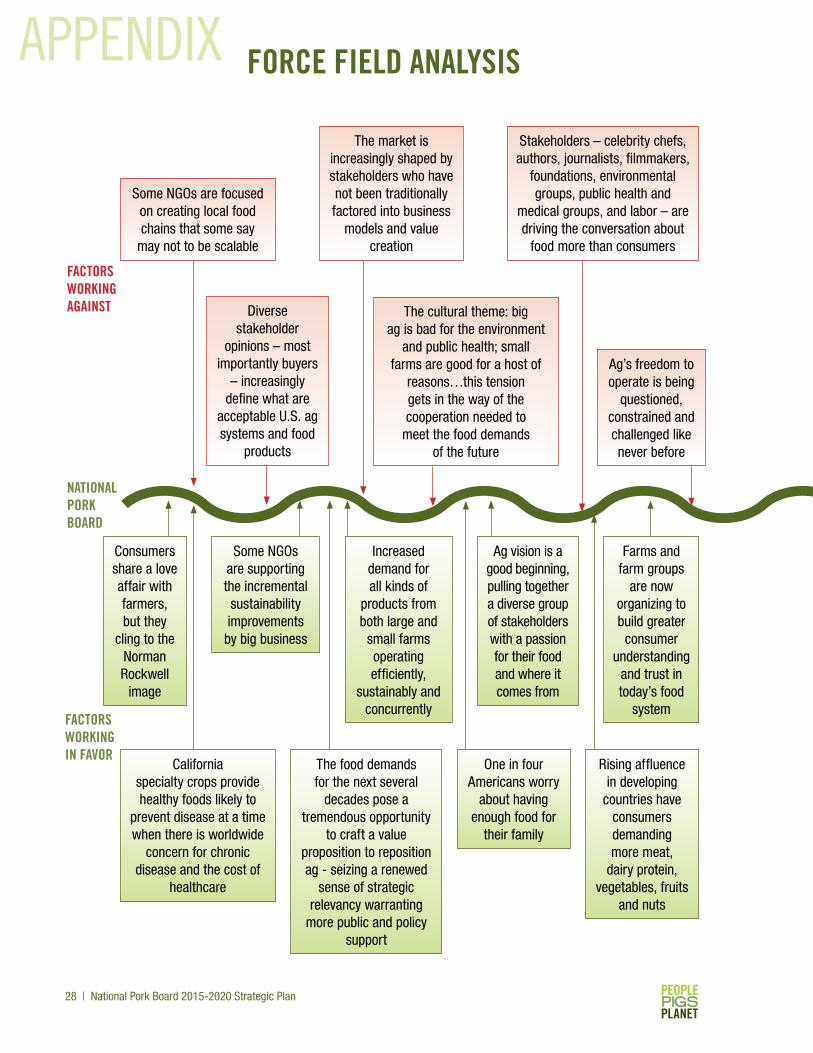
28 | National Pork Board 2015-2020 Strategic Plan
PARTNER
COLLABORATE
CONTINUOUS
ETHICSQUALITY
NUTRITION
SAFETYIMPROVEMENTRESEARCH
PROTEIN
COMMITMENT
SUSTAINABILITYPRODUCTIVITY
TRUST
PROMOTION
EDUCATE
SOCIAL RESPONSIBILITY
OUTREACH
TRAININGCARE
FACTORS WORKING AGAINST
NATIONAL PORK BOARD
FACTORS WORKING IN FAVOR
Rising affluence in developing
countries have consumers demanding more meat,
dairy protein, vegetables, fruits
and nuts
Consumers share a love affair with farmers, but they
cling to the Norman Rockwell
image
California specialty crops provide healthy foods likely to
prevent disease at a time when there is worldwide
concern for chronic disease and the cost of
healthcare
Some NGOs are supporting the incremental sustainability improvements by big business
The food demands for the next several
decades pose a tremendous opportunity
to craft a value proposition to reposition ag - seizing a renewed
sense of strategic relevancy warranting
more public and policy support
Increased demand for all kinds of
products from both large and
small farms operating efficiently,
sustainably and concurrently
Ag vision is a good beginning, pulling together a diverse group of stakeholders with a passion for their food and where it comes from
Farms and farm groups
are now organizing to build greater
consumer understanding
and trust in today’s food
system
One in four Americans worry
about having enough food for
their family
Diverse stakeholder
opinions – most importantly buyers
– increasingly define what are
acceptable U.S. ag systems and food
products
The cultural theme: big ag is bad for the environment
and public health; small farms are good for a host of
reasons…this tension gets in the way of the cooperation needed to
meet the food demands of the future
Ag’s freedom to operate is being
questioned, constrained and challenged like never before
Stakeholders – celebrity chefs, authors, journalists, filmmakers,
foundations, environmental groups, public health and
medical groups, and labor – are driving the conversation about
food more than consumers
The market is increasingly shaped by stakeholders who have not been traditionally factored into business
models and value creation
Some NGOs are focused on creating local food chains that some say
may not to be scalable
FORCE FIELD ANALYSISAPPENDIX

National Pork Board 2015-2020 Strategic Plan | 29
PARTNER
COLLABORATE
CONTINUOUS
ETHICSQUALITY
NUTRITION
SAFETYIMPROVEMENTRESEARCH
PROTEIN
COMMITMENT
SUSTAINABILITYPRODUCTIVITY
TRUST
PROMOTION
EDUCATE
SOCIAL RESPONSIBILITY
OUTREACH
TRAININGCARE
APPENDIX
The Stewardship Index for Specialty Crops is
having discussions with other similar groups,
but agreement on what metrics are feasible from a technical and value-based perspective are years away
The seafood sector appears to have
gotten sustainability
right working with stakeholders on
shaping the issue for mutual benefit
Some traditional agriculturists believe ag is doing 90% of
what stakeholders want so why not document and
package practices?
Individuals, regional and national farm
groups are being more aggressive with social media – putting a face
on farmers
Pressure is being applied in the name of sustainability and access to local and
regional food across
multiple fronts
Some trade groups are breaking sustainability
down into modules (e.g., air and water quality, pesticides, fertilizer,
even human resources best practices)
working toward one set of standards for all
customers
The Leonardo Academy failed
to provide a national standard
for sustainable agriculture
with ag groups walking away; a credible outcome appears unlikely
The Stewardship
Index for Specialty Crops is testing
performance metrics
Major buyers continue to
wrestle for market dominance
and demand for supplier
transparency with implications for
their sustainability
Food manufacturers, retail and foodservice
chains are funding Walmart’s
Sustainability Consortium in the hunt for more transparent
and measurable sustainable goals and measurement systems
Demand continues to grow for more
transparency, more connection to food sources, even more
snooping (e.g., buyers) to see
whether the talk is measured by on-
farm walk
The launch of the U.S. Farmers &
Ranchers Alliance was billed as a dialogue, but some
stakeholders criticized the launch as a monologue
U.S. chefs see a change in the U.S. food system and are modifying restaurant practices with a focus on
sustainability
Separate standards for every customer (food safety) may be on the
horizon if ag doesn’t get more engaged
Stakeholders are organizing efforts to feed
the world with fewer resources without enough
farmer involvement
FORCE FIELD ANALYSIS

30 | National Pork Board 2015-2020 Strategic Plan
PARTNER
COLLABORATE
CONTINUOUS
ETHICSQUALITY
NUTRITION
SAFETYIMPROVEMENTRESEARCH
PROTEIN
COMMITMENT
SUSTAINABILITYPRODUCTIVITY
TRUST
PROMOTION
EDUCATE
SOCIAL RESPONSIBILITY
OUTREACH
TRAININGCARE
China
Canada
Mexico
JapanEU
SoutheastAsia
Korea
Hong Kong
Taiwan
Other
China
Japan
CanadaCentralAmerica/Caribbean
Mexico
HongKongSouth
Korea
Russia
20 30 40 50 60 70 80 90 100
35
30
25
20
15
10
5
0
Urban share of population (%)
Shar
e of
cal
orie
s fr
om a
nim
al p
rodu
cts
(%)
uVietnamuThailand
uIndonesia
uChina
uPeru
uTaiwanuKorea
uMexico
uChileuCanadauUS
uColombiauMalaysia
uEcuadorBruneiu
Japanu
Philippinesu
NZuuAus.
ECONOMIC ANALYSISDR. DAN SUMNER, UNIVERSITY OF CALIFORNIA-DAVIS
Major Pork Importers Projected to 2022(Precise numbers and shares are not the issue)
US Meat Export ProjectionsSource: USDA, Long-Term Agricultural Projection Tables
Major Pork ImportersSource: USDA, Economic Research Service, Long-Term Agricultural Projection Tables
Tons
(mill
ions
)
2011 ‘12 ‘13 ‘14 ‘15 ‘16 ‘17 ‘18 ‘19 ‘20 ‘21 ‘22
9
8
7
6
5
4
3
2
1
0
Beef Pork Poultry
2011 ‘12 ‘13 ‘14 ‘15 ‘16 ‘17 ‘18 ‘19 ‘20 ‘21 ‘22
6.5
6.0
5.5
5.0
4.5
4.0
3.5
3.0
2.5
2.0
1.5
1.0
.5
0
Tons
(mill
ions
)
C. Amer/Carib.CanadaUnited StatesSouth Korea
Hong Kong
Russia
Mexico
China
Japan
2000 ‘01 ‘02 ‘03 ‘04 ‘05 ‘06 ‘07 ‘08 ‘09 ‘10 ‘11 ‘12
Tons
(mill
ions
)
1200
1000
800
600
400
200
0
Beef Poultry Swine
Tons
(mill
ions
)
2011 ‘12 ‘13 ‘14 ‘15 ‘16 ‘17 ‘18 ‘19 ‘20 ‘21 ‘22
9
8
7
6
5
4
3
2
1
0
Beef Pork Poultry
2011 ‘12 ‘13 ‘14 ‘15 ‘16 ‘17 ‘18 ‘19 ‘20 ‘21 ‘22
6.5
6.0
5.5
5.0
4.5
4.0
3.5
3.0
2.5
2.0
1.5
1.0
.5
0
Tons
(mill
ions
)
C. Amer/Carib.CanadaUnited StatesSouth Korea
Hong Kong
Russia
Mexico
China
Japan
2000 ‘01 ‘02 ‘03 ‘04 ‘05 ‘06 ‘07 ‘08 ‘09 ‘10 ‘11 ‘12
Tons
(mill
ions
)
1200
1000
800
600
400
200
0
Beef Poultry Swine
APPENDIX

National Pork Board 2015-2020 Strategic Plan | 31
PARTNER
COLLABORATE
CONTINUOUS
ETHICSQUALITY
NUTRITION
SAFETYIMPROVEMENTRESEARCH
PROTEIN
COMMITMENT
SUSTAINABILITYPRODUCTIVITY
TRUST
PROMOTION
EDUCATE
SOCIAL RESPONSIBILITY
OUTREACH
TRAININGCARE
APPENDIXUrbanization Boosts Demand for Animal ProductsSource: FAOSTAT
Changing Composition of Asian Diets (kg/person/year)Meat consumption is expected to increase.Source: FAOSTAT
China
Canada
Mexico
JapanEU
SoutheastAsia
Korea
Hong Kong
Taiwan
Other
China
Japan
CanadaCentralAmerica/Caribbean
Mexico
HongKongSouth
Korea
Russia
20 30 40 50 60 70 80 90 100
35
30
25
20
15
10
5
0
Urban share of population (%)
Shar
e of
cal
orie
s fr
om a
nim
al p
rodu
cts
(%)
uVietnamuThailand
uIndonesia
uChina
uPeru
uTaiwanuKorea
uMexico
uChileuCanadauUS
uColombiauMalaysia
uEcuadorBruneiu
Japanu
Philippinesu
NZuuAus.
1979-81 1984-86 1989-91 1994-96 1999-01 2004-06Rice 82.3 88.7 89.2 86.0 84.1 78.0
Wheat 54.3 62.5 65.8 69.8 66.7 64.3
Milk 26.1 30.2 32.1 37.5 41.6 48.6
Meat 11.4 14.0 17.1 22.4 26.3 28.0
Vegetable Oil 4.6 5.8 6.9 7.8 9.0 8.5
Vegetables 57.1 70.2 76.4 96.3 124.4 139.6
Fruits 27.8 30.1 32.2 40.8 46.0 54.1
Calories/Day 2286 2463 2550 2637 2680 2624
% from Cereals 65.5% 64.7% 63.3% 59.7% 56.3% 54.9%
% from Animals 7.9% 8.9% 10.0% 12.1% 13.7% 15.0%

32 | National Pork Board 2015-2020 Strategic Plan
PARTNER
COLLABORATE
CONTINUOUS
ETHICSQUALITY
NUTRITION
SAFETYIMPROVEMENTRESEARCH
PROTEIN
COMMITMENT
SUSTAINABILITYPRODUCTIVITY
TRUST
PROMOTION
EDUCATE
SOCIAL RESPONSIBILITY
OUTREACH
TRAININGCARE
China Meat and Poultry ImportsSource: USDA, PSD database
China has already had an enormous impact, and that impact will grow and changeSource: Dermot Hayes, Iowa State University:
• When China buys our variety meats, the value of a live pig goes up by almost $20 per animal.• This reduces the breakeven price of loins and tenderloins.• If China frees its people to move to the city, it will need as much as 140 million tons of corn (more than 5 billion
bushels).
Our Perspective• As China opens agricultural trade to be more consumer- and market-driven, traders will see the opportunity to
import the animal products directly rather than the feed for the animals.• Environmental issues and food safety demands in China drive in the same direction. Human population density
and animal density are difficult to manage.
China seems likely to continue on the food import path
Protectionism is a “blind alley.” - Chinese Premier Li Keqiang* reported in the China Daily.
The recent release of the reform documents suggest:• More economic opening• Less subsidy for state-owned firms• More land rights on the farm• Relaxing the one-child policy
All of these suggest better long-term prospects for imports of animal products.
*Li has a doctorate in economics and was a pupil of the leading “free-market” economist Li Yining.
Tons
(mill
ions
)
2011 ‘12 ‘13 ‘14 ‘15 ‘16 ‘17 ‘18 ‘19 ‘20 ‘21 ‘22
9
8
7
6
5
4
3
2
1
0
Beef Pork Poultry
2011 ‘12 ‘13 ‘14 ‘15 ‘16 ‘17 ‘18 ‘19 ‘20 ‘21 ‘22
6.5
6.0
5.5
5.0
4.5
4.0
3.5
3.0
2.5
2.0
1.5
1.0
.5
0
Tons
(mill
ions
)
C. Amer/Carib.CanadaUnited StatesSouth Korea
Hong Kong
Russia
Mexico
China
Japan
2000 ‘01 ‘02 ‘03 ‘04 ‘05 ‘06 ‘07 ‘08 ‘09 ‘10 ‘11 ‘12
Tons
(mill
ions
)
1200
1000
800
600
400
200
0
Beef Poultry Swine
APPENDIX

National Pork Board 2015-2020 Strategic Plan | 33
PARTNER
COLLABORATE
CONTINUOUS
ETHICSQUALITY
NUTRITION
SAFETYIMPROVEMENTRESEARCH
PROTEIN
COMMITMENT
SUSTAINABILITYPRODUCTIVITY
TRUST
PROMOTION
EDUCATE
SOCIAL RESPONSIBILITY
OUTREACH
TRAININGCARE
APPENDIXU.S. Pork Export Share of Production: Most of the Market Remains at HomeSource: USDA, Economic Research Service, Long-Term Agricultural Projection Tables
Pork Production to Grow Steadily (15% in a Decade) Driven by Higher Prices and Lower Feed CostsSource: USDA, Economic Research Service, Long-Term Agricultural Projection Tables
U.S. Economic Growth and the Macroeconomy• The United States has a gradually growing, aging and culturally diverse population. The growing population is
generally positive for pork consumption.• A larger Hispanic population and more Asians and a shift south are all positive for pork.• Gradual income growth is generally positive.
• No evidence of a big economic take-off, 2%+ per year.• Response of pork consumption to income in United States is positive but moderate, 10% income growth =
5% increase in demand.• On the cost side, real interest rates show no sign of a significant rise, given moderate economic growth.• The energy supply boom and moderate growth suggest moderation in energy prices.• Predicting the dollar exchange rate is too hard for anyone.
2011 ‘12 ‘13 ‘14 ‘15 ‘16 ‘17 ‘18 ‘19 ‘20 ‘21 ‘22
24%
23%
22%
21%
20%
2011 ‘12 ‘13 ‘14 ‘15 ‘16 ‘17 ‘18 ‘19 ‘20 ‘21 ‘22
27,000
26,000
25,000
24,000
23,000
22,000
21,000
20,000M
illio
n po
unds
2011 ‘12 ‘13 ‘14 ‘15 ‘16 ‘17 ‘18 ‘19 ‘20 ‘21 ‘22
48.0
47.5
47.0
46.5
46.0
45.5
45.0
44.5
2011 ‘12 ‘13 ‘14 ‘15 ‘16 ‘17 ‘18 ‘19 ‘20 ‘21 ‘22
70
68
66
64
62
60
$/cw
t
Shar
e of
Pro
duct
ion
(per
cent
)
2011 ‘12 ‘13 ‘14 ‘15 ‘16 ‘17 ‘18 ‘19 ‘20 ‘21 ‘22
24%
23%
22%
21%
20%
2011 ‘12 ‘13 ‘14 ‘15 ‘16 ‘17 ‘18 ‘19 ‘20 ‘21 ‘22
27,000
26,000
25,000
24,000
23,000
22,000
21,000
20,000
Mill
ion
poun
ds
2011 ‘12 ‘13 ‘14 ‘15 ‘16 ‘17 ‘18 ‘19 ‘20 ‘21 ‘22
48.0
47.5
47.0
46.5
46.0
45.5
45.0
44.5
2011 ‘12 ‘13 ‘14 ‘15 ‘16 ‘17 ‘18 ‘19 ‘20 ‘21 ‘22
70
68
66
64
62
60
$/cw
t
Shar
e of
Pro
duct
ion
(per
cent
)

34 | National Pork Board 2015-2020 Strategic Plan
PARTNER
COLLABORATE
CONTINUOUS
ETHICSQUALITY
NUTRITION
SAFETYIMPROVEMENTRESEARCH
PROTEIN
COMMITMENT
SUSTAINABILITYPRODUCTIVITY
TRUST
PROMOTION
EDUCATE
SOCIAL RESPONSIBILITY
OUTREACH
TRAININGCARE
APPENDIXReminder: Predictions may be useful, but timing is challenging• USDA sees good news for the pork industry in the domestic market. That is the beginning, not the end of the
discussion.• USDA saw a gradual grain price decline, but it came sooner than projected.• USDA saw higher hog prices, but they came sooner than they projected.• The projections are not much good for short-term wiggles, but the longer-term trends are important to
understand.• Remember the cure for high prices is high prices. Producers can soon overwhelm expected demand growth,
unless costs rise with expansion.
Economic Bottom Lines (Domestic)• Economic growth and population fundamentals mean gradual demand growth. The broad demographic trends
are positive for pork.• U.S. pork is competitive in the U.S. market.• Diet trends and publicity suggest continued
strong pork demand. Those that don’t buy won’t, but pork buyers are doing fine and are a growing demographic.
• Regulatory and buyer restrictions may raise production costs or processing and marketing costs, but this seems consistent across competitive products and unlikely to price pork out of the market.
• Productivity growth on farm and in processing and marketing relative to other meats is important to keep the pork price in line.
U.S. Pork Per Capita Consumption
2011 ‘12 ‘13 ‘14 ‘15 ‘16 ‘17 ‘18 ‘19 ‘20 ‘21 ‘22
24%
23%
22%
21%
20%
2011 ‘12 ‘13 ‘14 ‘15 ‘16 ‘17 ‘18 ‘19 ‘20 ‘21 ‘22
27,000
26,000
25,000
24,000
23,000
22,000
21,000
20,000
Mill
ion
poun
ds
2011 ‘12 ‘13 ‘14 ‘15 ‘16 ‘17 ‘18 ‘19 ‘20 ‘21 ‘22
48.0
47.5
47.0
46.5
46.0
45.5
45.0
44.5
2011 ‘12 ‘13 ‘14 ‘15 ‘16 ‘17 ‘18 ‘19 ‘20 ‘21 ‘22
70
68
66
64
62
60$/
cwt
Shar
e of
Pro
duct
ion
(per
cent
)
Economic Bottom Lines (International)• Economic growth and population fundamentals mean strong demand for U.S. pork products as the new middle
class emerges, and will demand more meat and higher quality.• Animal products and the feeds for those animals have continued growth prospects, and the United States has a
strong competitive advantage.• High-quality meat products, including
pork, meet the profile of food that will have growing demand as incomes rise above poverty levels.
• Then, so long as U.S. productivity growth does not lag, the U.S. pork industry is poised to benefit.
• The key to the global market is to demonstrate advantages of buying pork directly rather than the corn and beans to grow the pork.
USDA Projections of Farm Market Price
2011 ‘12 ‘13 ‘14 ‘15 ‘16 ‘17 ‘18 ‘19 ‘20 ‘21 ‘22
24%
23%
22%
21%
20%
2011 ‘12 ‘13 ‘14 ‘15 ‘16 ‘17 ‘18 ‘19 ‘20 ‘21 ‘22
27,000
26,000
25,000
24,000
23,000
22,000
21,000
20,000
Mill
ion
poun
ds
2011 ‘12 ‘13 ‘14 ‘15 ‘16 ‘17 ‘18 ‘19 ‘20 ‘21 ‘22
48.0
47.5
47.0
46.5
46.0
45.5
45.0
44.5
2011 ‘12 ‘13 ‘14 ‘15 ‘16 ‘17 ‘18 ‘19 ‘20 ‘21 ‘22
70
68
66
64
62
60
$/cw
t
Shar
e of
Pro
duct
ion
(per
cent
)

National Pork Board 2015-2020 Strategic Plan | 35
PARTNER
COLLABORATE
CONTINUOUS
ETHICSQUALITY
NUTRITION
SAFETYIMPROVEMENTRESEARCH
PROTEIN
COMMITMENT
SUSTAINABILITYPRODUCTIVITY
TRUST
PROMOTION
EDUCATE
SOCIAL RESPONSIBILITY
OUTREACH
TRAININGCARE
Real Per Capita Expenditures for Pork
RPCE for pork have exceeded year-earlier levels in every month except one since January 2013.
ECONOMIC ANALYSISDR. STEVE MEYER, PARAGON ECONOMICS
100
90
80
70
60
50
40
30
20
10
01998 1999 2000 ‘01 ‘02 ‘03 ‘04 ‘05 ‘06 ‘07 ‘08 ‘09 ‘10 ‘11
50,000 and over20,000-49,999
10,000-19,9995,000-9,999
2,000-4,9991,000-1,999
500-1,999100-499
<100
12.50
12.00
11.50
11.00
10.50
10.00
9.50
9.00
RPCE
, $/m
onth
, 200
0$
J F M A M J J A S O N D
2012
Yr/Yr % Change = 7.2%
YTD % Change = 5.5%
14.00
13.00
12.00
11.00
10.00
9.00
8.00
$/m
onth
, 200
0$
‘90 ‘92 ‘94 ‘96 ‘98 ‘00 ‘02 ‘04 ‘06 ‘08 ‘10 ‘12 ‘14
150
140
130
120
110
100
90
80
70
60
‘70 ‘72 ‘74 ‘76 ‘78 ‘80 ‘82 ‘84 ‘86 ‘88 ‘90 ‘92 ‘94 ‘96 ‘98 ‘00 ‘02 ‘04 ‘06 ‘08 ‘10 ‘12 ‘14
Inde
x, ‘8
5=10
0
Choice Beef
2013 7/13-7/14Pork: 4.6 5.2Beef: 1.7 1.5Chicken: 3.5 2.7Turkey: 0.6 -1.2
Avg. ‘08-‘12
2013
12.50
12.00
11.50
11.00
10.50
10.00
9.50
9.00
RPCE
, $/m
onth
, 200
0$
J F M A M J J A S O N D
2014
Yr/Yr % Change = 5.4%
YTD % Change = 6.8%
Avg. ‘09-‘13
2013
Turkey
Broilers
Pork
100
90
80
70
60
50
40
30
20
10
01998 1999 2000 ‘01 ‘02 ‘03 ‘04 ‘05 ‘06 ‘07 ‘08 ‘09 ‘10 ‘11
50,000 and over20,000-49,999
10,000-19,9995,000-9,999
2,000-4,9991,000-1,999
500-1,999100-499
<100
12.50
12.00
11.50
11.00
10.50
10.00
9.50
9.00
RPCE
, $/m
onth
, 200
0$
J F M A M J J A S O N D
2012
Yr/Yr % Change = 7.2%
YTD % Change = 5.5%
14.00
13.00
12.00
11.00
10.00
9.00
8.00
$/m
onth
, 200
0$
‘90 ‘92 ‘94 ‘96 ‘98 ‘00 ‘02 ‘04 ‘06 ‘08 ‘10 ‘12 ‘14
150
140
130
120
110
100
90
80
70
60
‘70 ‘72 ‘74 ‘76 ‘78 ‘80 ‘82 ‘84 ‘86 ‘88 ‘90 ‘92 ‘94 ‘96 ‘98 ‘00 ‘02 ‘04 ‘06 ‘08 ‘10 ‘12 ‘14
Inde
x, ‘8
5=10
0
Choice Beef
2013 7/13-7/14Pork: 4.6 5.2Beef: 1.7 1.5Chicken: 3.5 2.7Turkey: 0.6 -1.2
Avg. ‘08-‘12
2013
12.50
12.00
11.50
11.00
10.50
10.00
9.50
9.00
RPCE
, $/m
onth
, 200
0$
J F M A M J J A S O N D
2014
Yr/Yr % Change = 5.4%
YTD % Change = 6.8%
Avg. ‘09-‘13
2013
Turkey
Broilers
Pork
APPENDIX
100
90
80
70
60
50
40
30
20
10
01998 1999 2000 ‘01 ‘02 ‘03 ‘04 ‘05 ‘06 ‘07 ‘08 ‘09 ‘10 ‘11
50,000 and over20,000-49,999
10,000-19,9995,000-9,999
2,000-4,9991,000-1,999
500-1,999100-499
<100
12.50
12.00
11.50
11.00
10.50
10.00
9.50
9.00
RPCE
, $/m
onth
, 200
0$
J F M A M J J A S O N D
2012
Yr/Yr % Change = 7.2%
YTD % Change = 5.5%
14.00
13.00
12.00
11.00
10.00
9.00
8.00
$/m
onth
, 200
0$
‘90 ‘92 ‘94 ‘96 ‘98 ‘00 ‘02 ‘04 ‘06 ‘08 ‘10 ‘12 ‘14
150
140
130
120
110
100
90
80
70
60
‘70 ‘72 ‘74 ‘76 ‘78 ‘80 ‘82 ‘84 ‘86 ‘88 ‘90 ‘92 ‘94 ‘96 ‘98 ‘00 ‘02 ‘04 ‘06 ‘08 ‘10 ‘12 ‘14
Inde
x, ‘8
5=10
0
Choice Beef
2013 7/13-7/14Pork: 4.6 5.2Beef: 1.7 1.5Chicken: 3.5 2.7Turkey: 0.6 -1.2
Avg. ‘08-‘12
2013
12.50
12.00
11.50
11.00
10.50
10.00
9.50
9.00
RPCE
, $/m
onth
, 200
0$
J F M A M J J A S O N D
2014
Yr/Yr % Change = 5.4%
YTD % Change = 6.8%
Avg. ‘09-‘13
2013
Turkey
Broilers
Pork
Share of Inventory by Operation Size by Ownership, Percent
Source: Farms, Land in Farms and Livestock Operations, Various Editors, USDA-NASS
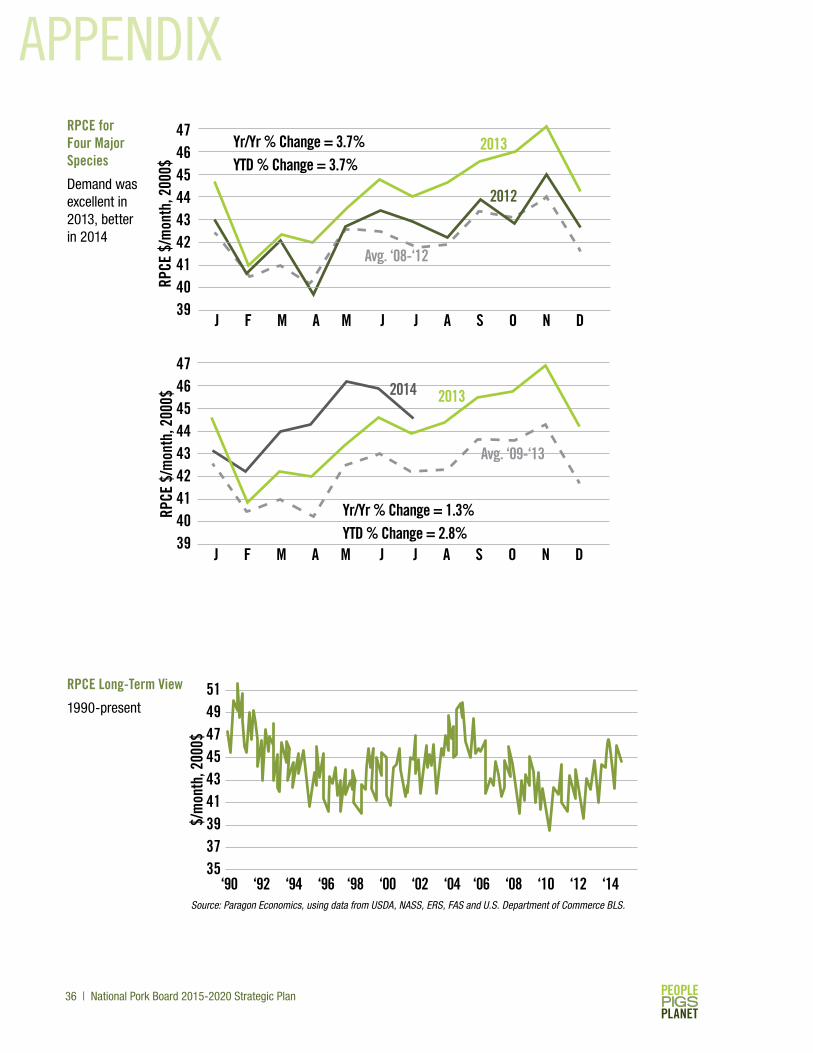
36 | National Pork Board 2015-2020 Strategic Plan
PARTNER
COLLABORATE
CONTINUOUS
ETHICSQUALITY
NUTRITION
SAFETYIMPROVEMENTRESEARCH
PROTEIN
COMMITMENT
SUSTAINABILITYPRODUCTIVITY
TRUST
PROMOTION
EDUCATE
SOCIAL RESPONSIBILITY
OUTREACH
TRAININGCARE
APPENDIXRPCE for Four Major Species
Demand was excellent in 2013, better in 2014
100
90
80
70
60
50
40
30
20
10
01998 1999 2000 ‘01 ‘02 ‘03 ‘04 ‘05 ‘06 ‘07 ‘08 ‘09 ‘10 ‘11
50,000 and over20,000-49,999
10,000-19,9995,000-9,999
2,000-4,9991,000-1,999
500-1,999100-499
<100
474645444342414039
RPCE
$/m
onth
, 200
0$
J F M A M J J A S O N D
2012
Yr/Yr % Change = 3.7%YTD % Change = 3.7%
514947454341393735
$/m
onth
, 200
0$
‘90 ‘92 ‘94 ‘96 ‘98 ‘00 ‘02 ‘04 ‘06 ‘08 ‘10 ‘12 ‘14
2013
Avg. ‘08-‘12
2014
Avg. ‘09-‘13
2013
474645444342414039
J F M A M J J A S O N D
Yr/Yr % Change = 1.3%YTD % Change = 2.8%
RPCE
$/m
onth
, 200
0$
RPCE Long-Term View
1990-present
Source: Paragon Economics, using data from USDA, NASS, ERS, FAS and U.S. Department of Commerce BLS.

National Pork Board 2015-2020 Strategic Plan | 37
PARTNER
COLLABORATE
CONTINUOUS
ETHICSQUALITY
NUTRITION
SAFETYIMPROVEMENTRESEARCH
PROTEIN
COMMITMENT
SUSTAINABILITYPRODUCTIVITY
TRUST
PROMOTION
EDUCATE
SOCIAL RESPONSIBILITY
OUTREACH
TRAININGCARE
APPENDIX
100
90
80
70
60
50
40
30
20
10
01998 1999 2000 ‘01 ‘02 ‘03 ‘04 ‘05 ‘06 ‘07 ‘08 ‘09 ‘10 ‘11
50,000 and over20,000-49,999
10,000-19,9995,000-9,999
2,000-4,9991,000-1,999
500-1,999100-499
<100
12.50
12.00
11.50
11.00
10.50
10.00
9.50
9.00
RPCE
, $/m
onth
, 200
0$
J F M A M J J A S O N D
2012
Yr/Yr % Change = 7.2%
YTD % Change = 5.5%
14.00
13.00
12.00
11.00
10.00
9.00
8.00
$/m
onth
, 200
0$
‘90 ‘92 ‘94 ‘96 ‘98 ‘00 ‘02 ‘04 ‘06 ‘08 ‘10 ‘12 ‘14
150
140
130
120
110
100
90
80
70
60
‘70 ‘72 ‘74 ‘76 ‘78 ‘80 ‘82 ‘84 ‘86 ‘88 ‘90 ‘92 ‘94 ‘96 ‘98 ‘00 ‘02 ‘04 ‘06 ‘08 ‘10 ‘12 ‘14
Inde
x, ‘8
5=10
0
Choice Beef
2013 7/13-7/14Pork: 4.6 5.2Beef: 1.7 1.5Chicken: 3.5 2.7Turkey: 0.6 -1.2
Avg. ‘08-‘12
2013
12.50
12.00
11.50
11.00
10.50
10.00
9.50
9.00
RPCE
, $/m
onth
, 200
0$
J F M A M J J A S O N D
2014
Yr/Yr % Change = 5.4%
YTD % Change = 6.8%
Avg. ‘09-‘13
2013
Turkey
Broilers
Pork
Longer-Term, Pork Demand is Unchanged Since 1985 But Beef is Down 20% and all U.S. Consumer Demand Indexes Flat Since 2004
Weekly
100
90
80
70
60
50
40
$/cw
t car
cass
‘96 ‘97 ‘98 ‘99 ‘00 ‘01 ‘02 ‘03 ‘04 ‘05 ‘06 ‘07 ‘08 ‘09 ‘10 ‘11 ‘12 ‘13 ‘14 ‘15
ActualCosts
Linear (Weekly)
Forecast Costs
Average Cost, 1999-2006: $52.76/cwt
2011: $86.70
2012: $90.89
2013: $93.95
2014: $79.83
2015: $66.31
4000
3500
3000
2500
2000
1500
1000
500
Poun
ds C
arc.
Wei
ght
‘67 ‘69 ‘71 ‘73 ‘75 ‘77 ‘79 ‘81 ‘83 ‘85 ‘87 ‘89 ‘91 ‘93 ‘95 ‘97 ‘99 ‘01 ‘03 ‘05 ‘07 ‘09 ‘11 ‘13
Canada
Brazil
European Union
United States
220
215
210
205
200
195
190
Lbs.
Car
cass
‘00 ‘01 ‘02 ‘03 ‘04 ‘05 ‘06 ‘07 ‘08 ‘09 ‘10 ‘11 ‘12 ‘13 ‘14
52-Week Avg.
Source: Paragon Economics Inc, using USDA data. Elasticity of demand assumed to be +.75
Iowa Breakeven Costs: Farrow-to-Finish Operations
The worst of the biofuels-driven cost onslaught is over, but this is the new normal.
Source: Paragon Economics, using data from Iowa State University estimated costs and returns.
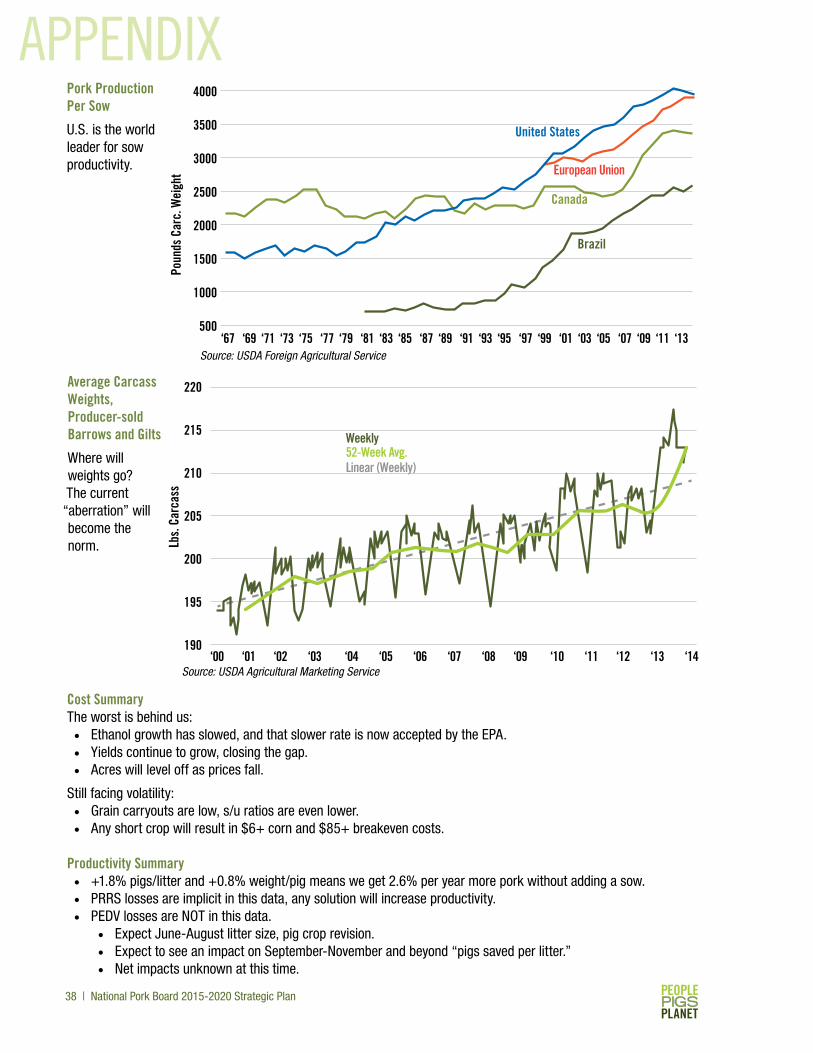
38 | National Pork Board 2015-2020 Strategic Plan
PARTNER
COLLABORATE
CONTINUOUS
ETHICSQUALITY
NUTRITION
SAFETYIMPROVEMENTRESEARCH
PROTEIN
COMMITMENT
SUSTAINABILITYPRODUCTIVITY
TRUST
PROMOTION
EDUCATE
SOCIAL RESPONSIBILITY
OUTREACH
TRAININGCARE
APPENDIX
Weekly
100
90
80
70
60
50
40
$/cw
t car
cass
‘96 ‘97 ‘98 ‘99 ‘00 ‘01 ‘02 ‘03 ‘04 ‘05 ‘06 ‘07 ‘08 ‘09 ‘10 ‘11 ‘12 ‘13 ‘14 ‘15
ActualCosts
Linear (Weekly)
Forecast Costs
Average Cost, 1999-2006: $52.76/cwt
2011: $86.70
2012: $90.89
2013: $93.95
2014: $79.83
2015: $66.31
4000
3500
3000
2500
2000
1500
1000
500
Poun
ds C
arc.
Wei
ght
‘67 ‘69 ‘71 ‘73 ‘75 ‘77 ‘79 ‘81 ‘83 ‘85 ‘87 ‘89 ‘91 ‘93 ‘95 ‘97 ‘99 ‘01 ‘03 ‘05 ‘07 ‘09 ‘11 ‘13
Canada
Brazil
European Union
United States
220
215
210
205
200
195
190
Lbs.
Car
cass
‘00 ‘01 ‘02 ‘03 ‘04 ‘05 ‘06 ‘07 ‘08 ‘09 ‘10 ‘11 ‘12 ‘13 ‘14
52-Week Avg.
Cost SummaryThe worst is behind us:• Ethanol growth has slowed, and that slower rate is now accepted by the EPA.• Yields continue to grow, closing the gap.• Acres will level off as prices fall.
Still facing volatility:• Grain carryouts are low, s/u ratios are even lower.• Any short crop will result in $6+ corn and $85+ breakeven costs.
Productivity Summary• +1.8% pigs/litter and +0.8% weight/pig means we get 2.6% per year more pork without adding a sow.• PRRS losses are implicit in this data, any solution will increase productivity.• PEDV losses are NOT in this data.
• Expect June-August litter size, pig crop revision.• Expect to see an impact on September-November and beyond “pigs saved per litter.”• Net impacts unknown at this time.
Pork Production Per Sow
U.S. is the world leader for sow productivity.
Average Carcass Weights, Producer-sold Barrows and Gilts
Where will weights go? The current
“aberration” will become the norm.
Source: USDA Foreign Agricultural Service
Source: USDA Agricultural Marketing Service


National Pork Board1776 NW 114th St, Des Moines, IA 50325
pork.org • (800) 456-7675
PARTNER
COLLABORATE
CONTINUOUS
ETHICSQUALITY
NUTRITION
SAFETYIMPROVEMENTRESEARCH
PROTEIN
COMMITMENT
SUSTAINABILITYPRODUCTIVITY
TRUST
PROMOTION
EDUCATE
SOCIAL RESPONSIBILITY
OUTREACH
TRAININGCARE
©2014 National Pork Board, Des Moines, IA USA. This message funded by America’s Pork Producers and the Pork Checkoff. 11/01/14