Research Report Volume 4 Measuring City Resilience · has been to test the CRI in five cities, ......
116
Research Report Volume 4 Measuring City Resilience City Resilience Index Issue | March 2016
Transcript of Research Report Volume 4 Measuring City Resilience · has been to test the CRI in five cities, ......
Research Report Volume 4Measuring City Resilience
City Resilience Index
Issue | March 2016

Research Report Volume 4 Measuring City Resilience 2
AcknowledgementsThe core research team comprised Jo da Silva, Braulio Eduardo Morera, Andrea Fernandez, Sarah Gillhespy, Amy Leitch and Kieran Birtill, but many others have contributed to the research and development of the City Resilience Index. It would not have been possible without the Rockefeller Foundation, and we would particularly like to acknowledge the support and guidance provided by Dr Nancy Kete and Sundaa Bridgett-Jones. We have greatly appreciated the feedback we have received from them and their colleagues engaged in the Asia Cities Climate Change Resilience Network and 100 Resilient Cities.
The research has benefited from inputs from over 30 Arup colleagues, and 12 external experts who have generously made time to provide advice and comment on the indicators and metrics as they were developed. We would like to specifically mention Arup staff in Hong Kong, Liverpool, Dubai, São Paulo, Melbourne, New York, Madrid, Shanghai and Cape Town who sought feedback on our behalf from their city counterparts, and all those they engaged with. Finally, we would like to thank all those who attended the peer review workshops in New York, Bangkok, London and Cape Town.
Jo da Silva
Director
Arup International Development
Unless specified, all images are copyright Arup
Contents
Executive summary 1
Introduction 5
Methodology 9• What matters 10• What to measure 11 • How to measure 18• Peer review 27
Key considerations 35• Purpose 35• Credibility 37• Alignment 39• Managing Complexity 41• Consistency 42• Global Applicability 43• Data Availability 45• Usability 46
Conclusion 49• City Resilience Index 49• Next Steps 50
References 51
Appendices 57• A: Gap analysis • B: Expert engagement • C: City engagement • D: Profile metrics • E: Thresholds definition • F: Expert review feedback • G: Qualities of resilient systems • H: Peer review salons

Research Report Volume 4 Measuring City Resilience 4
The Rockefeller Foundation | Arup 1
The City Resilience Index (CRI) is an initiative led by Arup with the support of the Rockefeller Foundation to develop a comprehensive set of indicators, variables and metrics that allow cities to understand, baseline and subsequently measure local resilience over time.
The CRI builds on extensive research undertaken previously by Arup to provide an evidence-based definition of urban resilience which culminated in the publication of the City Resilience Framework (CRF) in April 2014.
This report summarises the further research carried out between December 2014 and November 2015 to define indicators, questions and metrics so that performance against each of the 12 goals in the CRF can be assessed.
The research set out to develop a measurement process to be used by cities to periodically assess their resilience. This was based on key methodological criteria of credibility and usability. The CRI is technically robust; based on evidence of what contributes to city resilience, as well as considering current best practice in urban measurement. It is designed to be relevant and accessible to cities globally, irrespective of size, capacity or location.
The key research activities in the development of the CRI comprised of an extensive literature review, desk study, series of expert consultations, and extended period of city engagement.
These inputs fuelled an iterative process of analysis, development and review which systematically considered three key research questions:
1. What contributes to city resilience?
2. How can this be observed?
3. How to measure this?
This research has culminated in the creation of a comprehensive index for the measurement of urban resilience comprising: 12 goals, 52 indicators, and 156 scenarios and proxy metrics.
The intention is that by enabling cities to baseline and subsequently measure their resilience over time; they can make urban planning, policy and investment decisions that will enhance the resilience of the city.
Executive summary
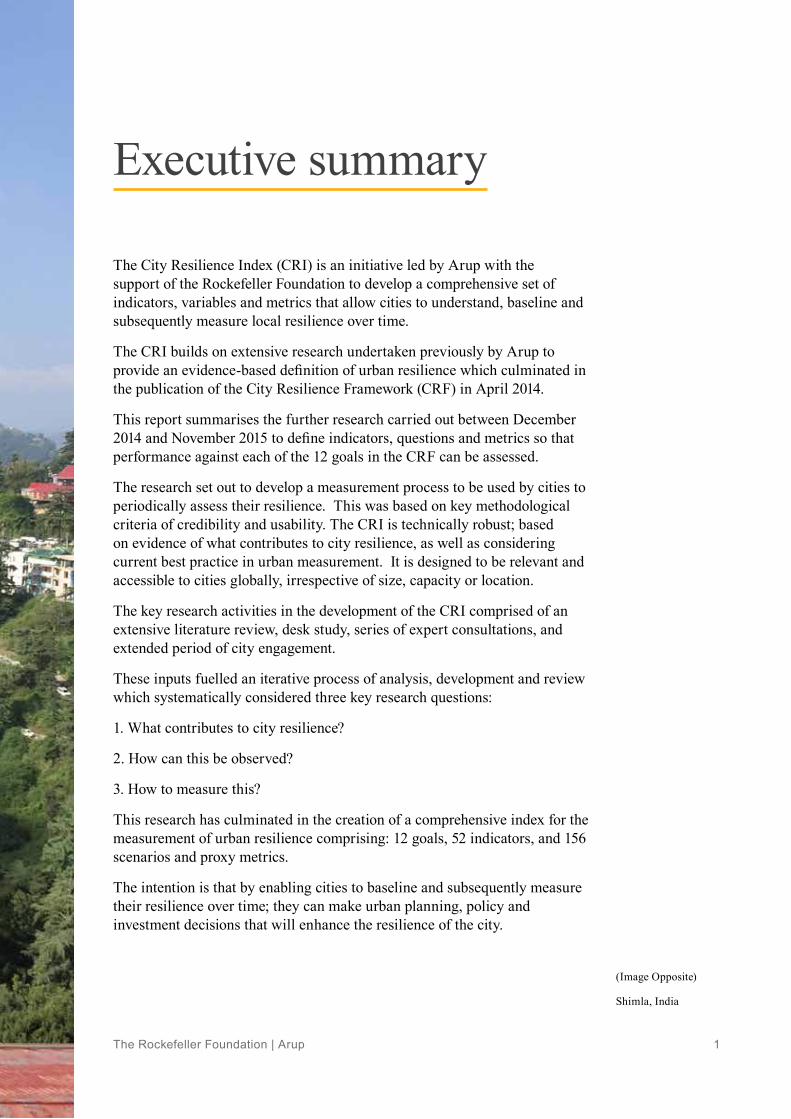
(Image Opposite)
Shimla, India

Research Report Volume 4 Measuring City Resilience 2
The Rockefeller Foundation | Arup 3
The CRI is intended as a diagnostic tool that enables cities to assess their resilience at a city scale, in order to identify strengths, weakness and priorities for action. Its purpose is not to compare cities. Nevertheless, it was decided a common basis of measurement is necessary to facilitate dialogue and knowledge-sharing between cities. This also provides opportunities for cities to benchmark their performance against logical peers; and, to analyse data from multiple cities in order to establish common trends and best practice.
The CRI will be available via a web-based platform incorporating a user-centric interface that facilitates data collection. Data from the assessments can be used to refine the tool, share knowledge, and inform best practice globally. The outputs have been designed to communicate different levels of information appropriate for different audiences, or different levels of expertise.
The CRI is different to many other urban assessment tools because it is based on a significant body of research that is firmly grounded in the experiences of cities, and evidence of what contributes to their ability to survive and thrive whatever disruption they have faced, or anticipate (CRF, 2014). It embraces the wide array of issues and complexity inherent in measuring resilience at a city scale, and considerable thought has been given to developing a basis of assessment that is both comprehensive and manageable.
Considering the whole range of the city resilience research and outputs collectively, it is felt that the CRI might be considered as toolkit which comprises:
• City Resilience Framework – a means to understand city resilience; 4 dimensions, 12 goals
• City Resilience Indicators – 52 indicators which incorporate the ‘qualities’ and tell us how city resilience can be observed.
• City Resilience Assessment – combining a qualitative and quantitative assessment that enables cities to assess their strengths/weaknesses, also baseline and monitor their resilience over time,
• City Resilience Database – the data collected from multiple cities that can be analysed to refine the toolkit, and create greater understanding of resilience.
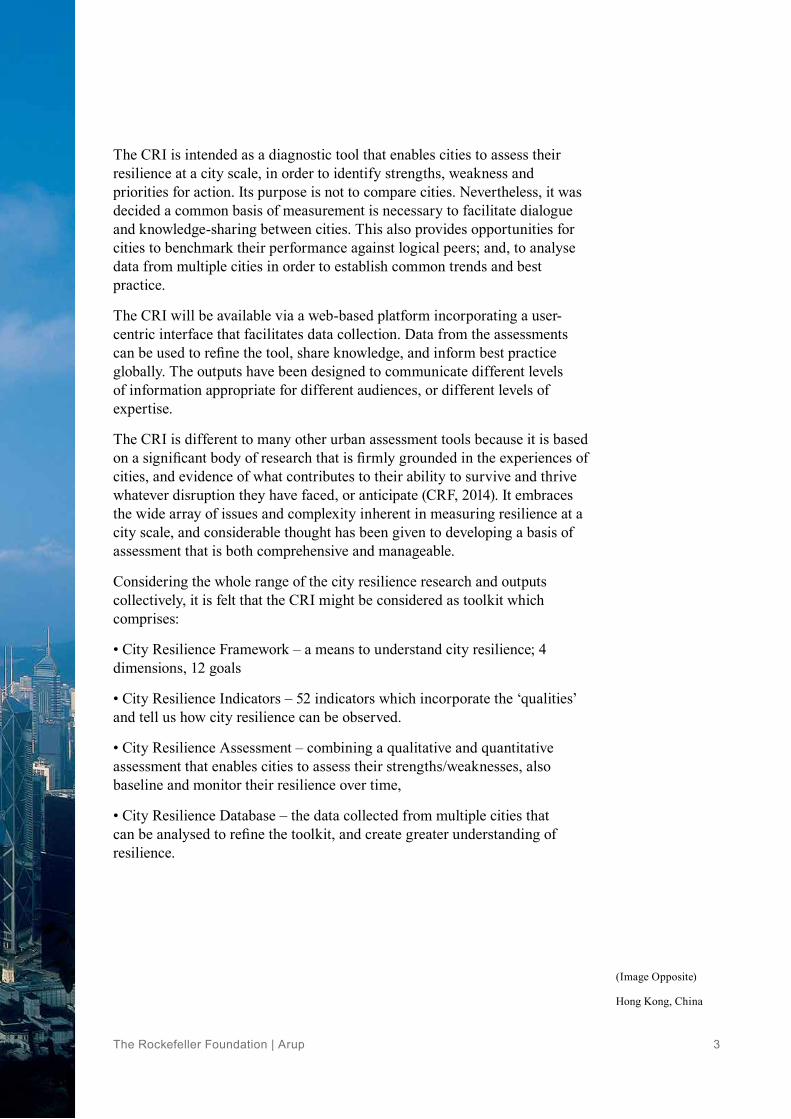
(Image Opposite)
Hong Kong, China
Research Report Volume 4 Measuring City Resilience 4
The Rockefeller Foundation | Arup 5
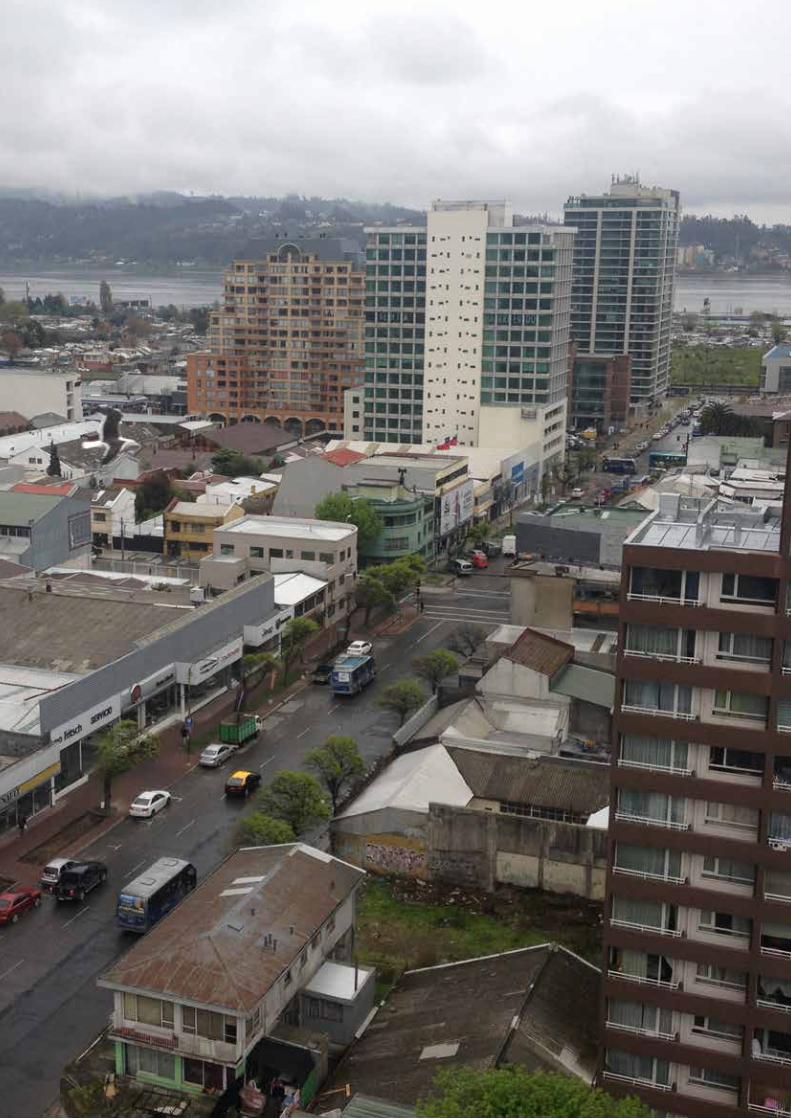
Cities are subject to a wide range of natural and man-made pressures that have the potential to cause significant disruption, at worst leading to spiralling social breakdown, economic or decline or physical collapse. Historically, urban risk management has focussed on understanding the impact of specific hazards and taking appropriate measure to mitigate risk. But, over recent years the diversity of hazards, complexity of cities, and uncertainty associated with climate change, globalization and rapid urbanization has emphasised the importance of building resilience. City resilience describes the overall ‘capacity of a city (individuals, communities, institutions, businesses and systems) to survive, adapt and thrive no matter what kinds of chronic stresses or acute shocks they experience’. (Rockefeller Foundation: 2013).
Resilience is now recognised as a critical agenda for urban development (SDG: 2015). The challenge now facing city administrations, investors and other stakeholders is ensuring that day-to-day practices, behaviours and decisions collectively contribute to enhancing the city’s resilience overall. This requires an understanding of what contributes to resilience, and how it can be measured. To address this need, Arup, with support from the Rockefeller Foundation, set out to develop a comprehensive, accessible and technically robust basis for measuring resilience at a city scale - the City Resilience Index (CRI). The CRI will give cities the means to diagnose key strength and weaknesses, and to baseline and monitor their resilience. It can be used to influence urban planning practices and ensure investment decisions contribute towards an increasingly resilient development trajectory.
The CRI builds on extensive research undertaken previously by Arup to provide an evidence-based definition of urban resilience which culminated in the publication of the City Resilience Framework (CRF) in April 2014. This report summarises the further research carried out between December 2014 and November 2015 to define a comprehensive set of indicators, questions and metrics so that performance against each of the 12 goals in the CRF can be assessed.
This research has informed the design of the on-line assessment tool (see www.cityresilienceindex.org). The final step in the development process has been to test the CRI in five cities, which is documented in our Research Report Volume 5: Lessons from the Pilots.
Introduction
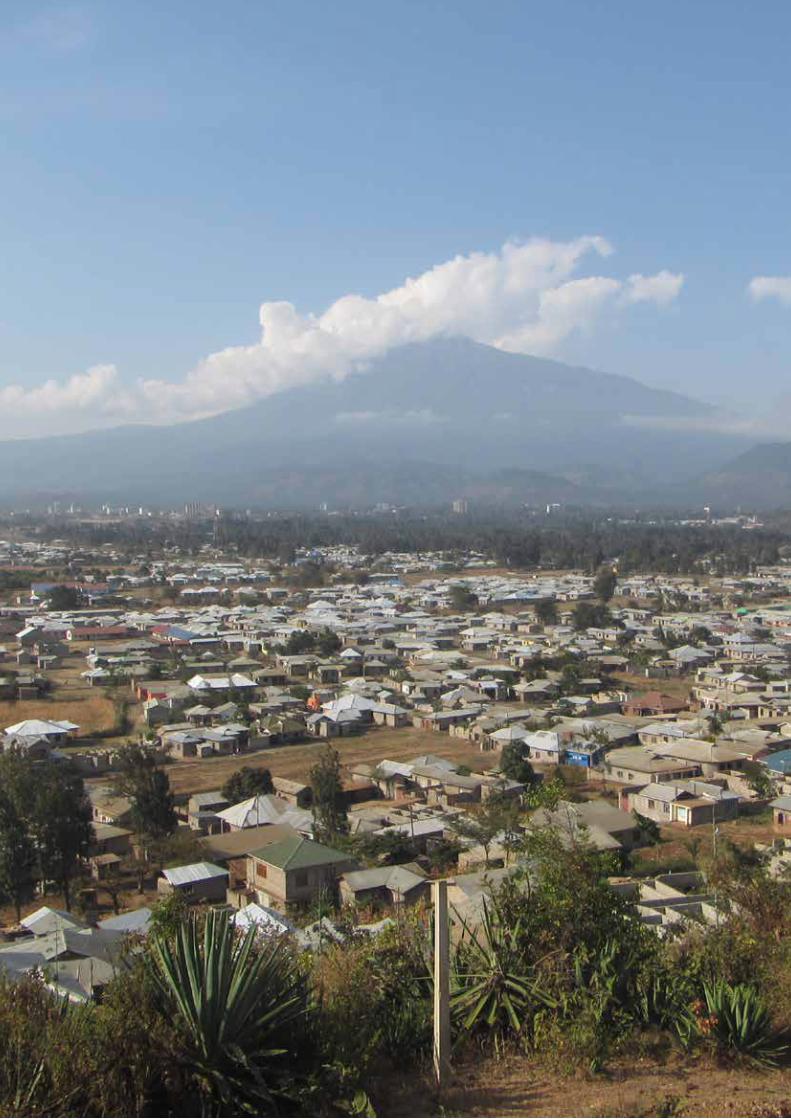
(Image Opposite)
Informal settlement in Arusha, Tanzania
Research Report Volume 4 Measuring City Resilience 6

The Rockefeller Foundation | Arup 7
The report is structured in three parts:
• Methodology summarises our overall approach to defining the indicators, and developing a robust basis of measurement based on an iterative process of research, review and refinement.
• Key Considerations discusses the critical issues and decisions that have shaped the development of the indicators, variables, scenarios and metrics; and informed the design of the assessment tool.
• Conclusion describes the City Resilience Index and our thoughts on how it might be further developed.
Additional information is contained in the Appendices.
Developing the CRI has been a journey that has involved extensive research, consultation with thematic experts, and city stakeholders. In writing this report, our aim has been to capture this rigorous process, and share the challenges and learning which have shaped our decision making. Measuring resilience is an emerging field, and we hope that the others tackling similar issues will benefit from us sharing our experiences.
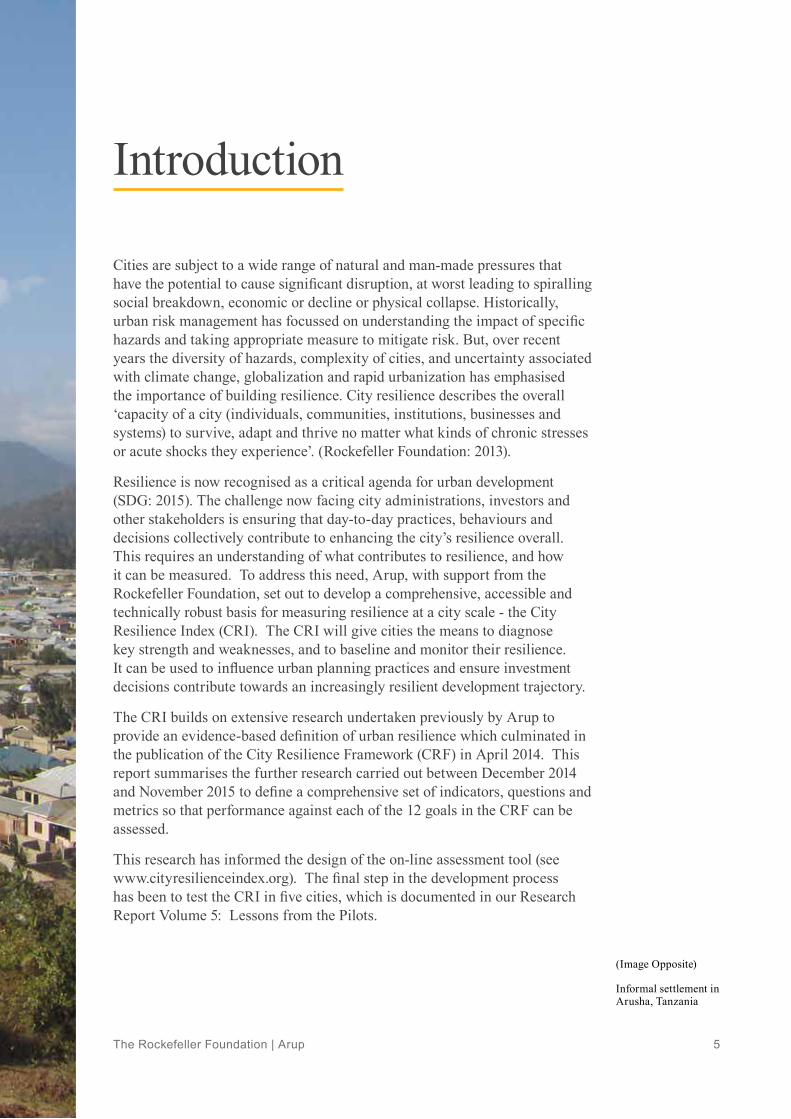
(Image Opposite)
View of Concepción and Bío Bío river, Chile


The Rockefeller Foundation | Arup 9
(Image Opposite)
Liverpool Docks Redevelopment
We set out to develop ‘a set of indicators, variables and metrics that can be used by cities to measure their resilience and compare their performance over time’1. Our methodology has focussed on credibility and usability. We wanted to ensure that the CRI is technically robust; based on evidence of what contributes to city resilience, as well as current best practice in urban measurement. We also wanted it to be both relevant and accessible to cities globally irrespective of their size, capacity or location, since a common basis of measurement creates opportunity for peer-to-peer knowledge exchange between cities, including benchmarking performance and sharing best practice. In addition, data from multiple assessments can be used to identify key issues and practices which can inform best practice globally2.
The key research activities have comprised an extensive literature review, desk study, expert consultation, and city engagement as summarised in Box 1. These inputs have fuelled an iterative process of analysis, development and review which has systematically considered three key research questions resulting in a technically robust basis of measurement comprising: 12 goals, 52 indicators, and 156 scenarios and proxy metrics.
Methodology
(1) City Resilience Index II Grant Proposal 26 September 2015
(2) Opportunity Statement: Project Plan: 27 March 2015
Box 1: Ensuring credibility and usability
Credibility
• Builds on research undertaken for CRF; 150 references, 14 city case studies, primary data in 6 cities;• Additional literature review of 45 frameworks and new references related to urban and resilience measurement (incl. SDGs, ISO37120, UNISDR scorecard, CityStrength)• Consultation with 45 thematic specialists
Usability
• Consultation in 9 cities with Arup presence (funded by Arup)• Peer review during 4 salons in NOLA (100RC CROs), Bangkok (ACCCRN partners), New York (RF academic and research partners) and Cape Town (academic, business, and government stakeholders).• Piloting in 5 cities (Liverpool, Hong Kong, Concepcion, Shimla, Arusha)
Research Questions Basis of Measurement
1. What matters What contributes to city resilience? • Goals
2. How can this be observed? What to measure? • Indicators/variables
3. How to measure? • Metrics/scenarios

Research Report Volume 4 Measuring City Resilience 10
What matters? The City Resilience Index builds on the extensive research that resulted in the City Resilience Framework3.This involved a review of more than 150 references, 14 city case studies based on secondary data sources, and primary research in 6 cities globally. This research concluded that the resilience of a city relates to 4 key dimensions:
• People: the health and well-being of everyone living and working in the city;
• Organisation: the social and economic systems that enable urban populations to live peacefully, and act collectively;
• Place: the quality of infrastructure and ecosystems that protects, provide and connect us;
• Knowledge: the capacity to learn from the past and take appropriate action based on evidence and active participation, including business and civil society
(3) Arup (2014), City Resilience Index Research Report Volume 1: Desk Study
Figure 1: CRI Goals, Indicators, and Qualities (Updated December 2015)
Health & wellbeing
Lead
ersh
ip & str
ategy
Economy & so
ciety
Infrastructure & ecosystems
Integrated
economy
Empo
wered
security & ru
le of
law
Effe
ctiv
e le
ader
ship
& co
mm
unity
sup
port & com
munications
Effective safeguards to
of critical services
Diverse livelihoods
& fragility
Minimal human
development planning
Sustainable
stak
eh
olders
Compre
hens
ive
& m
anag
emen
t
Colle
ctiv
e id
entit
y R
eliable mobility
human health & life
Effective provision
& employment
Reduced exposure
vulnerability
Flexible
RedundantRobust
Resourceful
Reflective
Inclusive
Integrated
The Rockefeller Foundation | Arup 11
What to measure? A literature review and desk study was carried out to develop an initial definition of the CRI, which was then refined based on consultation and city engagement. The key steps in this process are described below.
Literature Review
At the outset we carried out a literature review to explore current practices, drivers and challenges related to urban measurement and assess how these might inform the development of the CRI4 This review included academic and ‘grey’ literature, as well as 24 frameworks related to resilience and/or sustainability and/or urban measurement. The implications for the development of the CRI summarised in Box 2 have guided our research, particularly the structure of the CRI and the choice of variables. Further detail can be found in Research Report Volume 3: Urban Measurement: May 2014.
(4) Arup (2014), City Resilience Index Research Report Volume 3: Urban Measurement
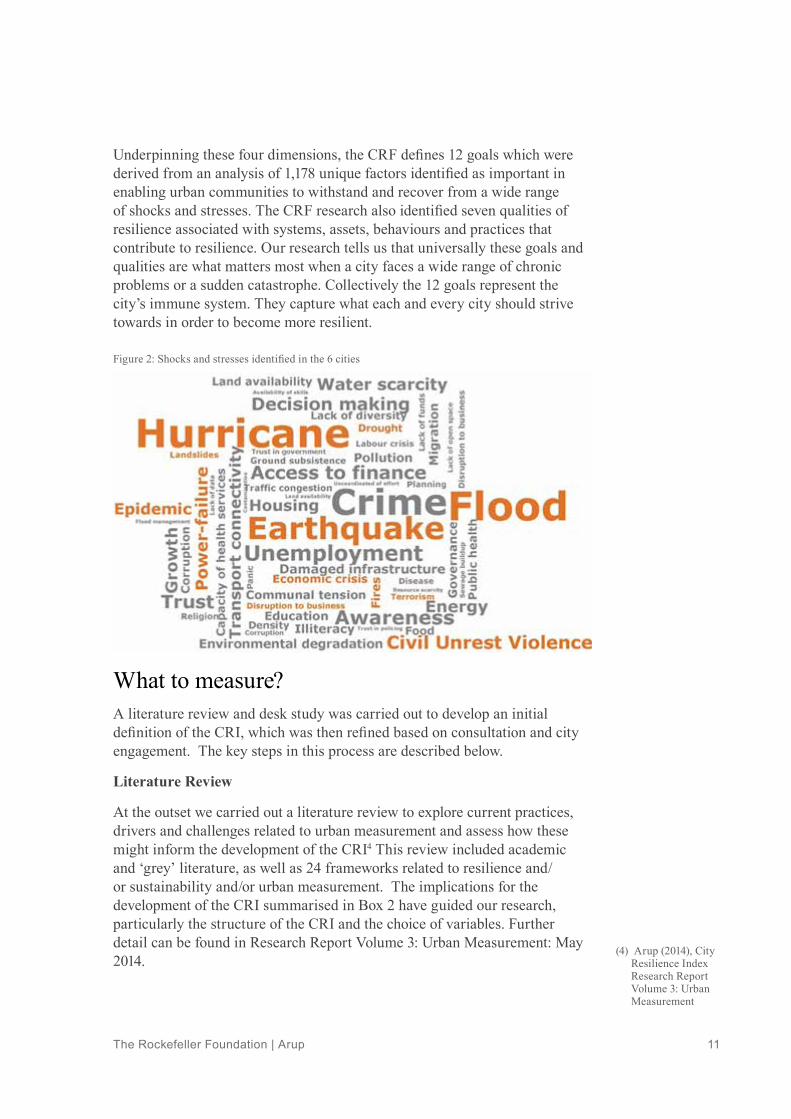
Underpinning these four dimensions, the CRF defines 12 goals which were derived from an analysis of 1,178 unique factors identified as important in enabling urban communities to withstand and recover from a wide range of shocks and stresses. The CRF research also identified seven qualities of resilience associated with systems, assets, behaviours and practices that contribute to resilience. Our research tells us that universally these goals and qualities are what matters most when a city faces a wide range of chronic problems or a sudden catastrophe. Collectively the 12 goals represent the city’s immune system. They capture what each and every city should strive towards in order to become more resilient.
Figure 2: Shocks and stresses identified in the 6 cities

Research Report Volume 4 Measuring City Resilience 12
Desk Study
The desk study was based on interrogating original CRF research data and reviewing prominent framework literature.
The CRF data was used to identify a preliminary list of indicators that could be used to assess performance against the 12 goals. Indicators describe the wide range of assets, behaviours, systems and practices that contribute to the resilience goals, and relate to day-to-day functions of the city. For example, ‘Goal 1: Minimal human vulnerability’ is related to availability of housing, access to water, energy, food etc. Our previous research suggested that resilience is determined not just by the presence of assets but by specific qualities namely: inclusive, integrated, robust, redundant, flexible, resourceful, and reflective5.The preliminary list of indicators were therefore purposively articulated in terms of these qualities. For example, robust and inclusive housing.
For each indicator, we also identified a preliminary set of variables. Variables were phrased as outcomes that are tangible enough to be observed and therefore measured. These variables were developed from further analysis and synthesis of the factors from the CRF research. These were cross-referenced against the database of indicators and variables previously created as part of the review of 23 measurement frameworks carried out early in 20146. This resulted in CRI draft 1 a database comprising 48 indicators and approximately 130 variables. At this stage the database also included 163 potential metrics describing exactly how performance might be measured (E.g. percentage of population living in informal settlements).
Box 2: Key considerations in developing the CRI
1. Define a clear purpose and audience [ranking/influencing-changing/ understanding]2. Establish a broad universe of variables but allow flexibility [not all cities will be able to/or want to measure everything];3. Aggregate up to goals [aggregation v clarity of message] 4. Include different types of variables [leading/lagging, qualitative/ quantitative, context]5. Use established variables where possible [avoid ‘reinventing the wheel’] 6. Identify systems or functions related to variables [ability to measure/ ownership]7. Strengthen local capacity to assess [ownership, commitment, facilitation]
(5) Arup (2014), City Resilience Index Research Report Volume 1 Desk Study
(6) Arup (2014), City Resilience Index Research Report Volume 3: Urban Measurement

The Rockefeller Foundation | Arup 13
There is a rapidly growing body of research relating to urban resilience and measurement. Therefore, a further search was carried out to identify more recently published material relating to urban resilience, disaster risk management, or urban measurement (see Appendix A1). Eight of the 21 additional frameworks that were identified were considered directly relevant to resilience at a city scale. Although other more niche frameworks provided input at metric-level later in the development process.
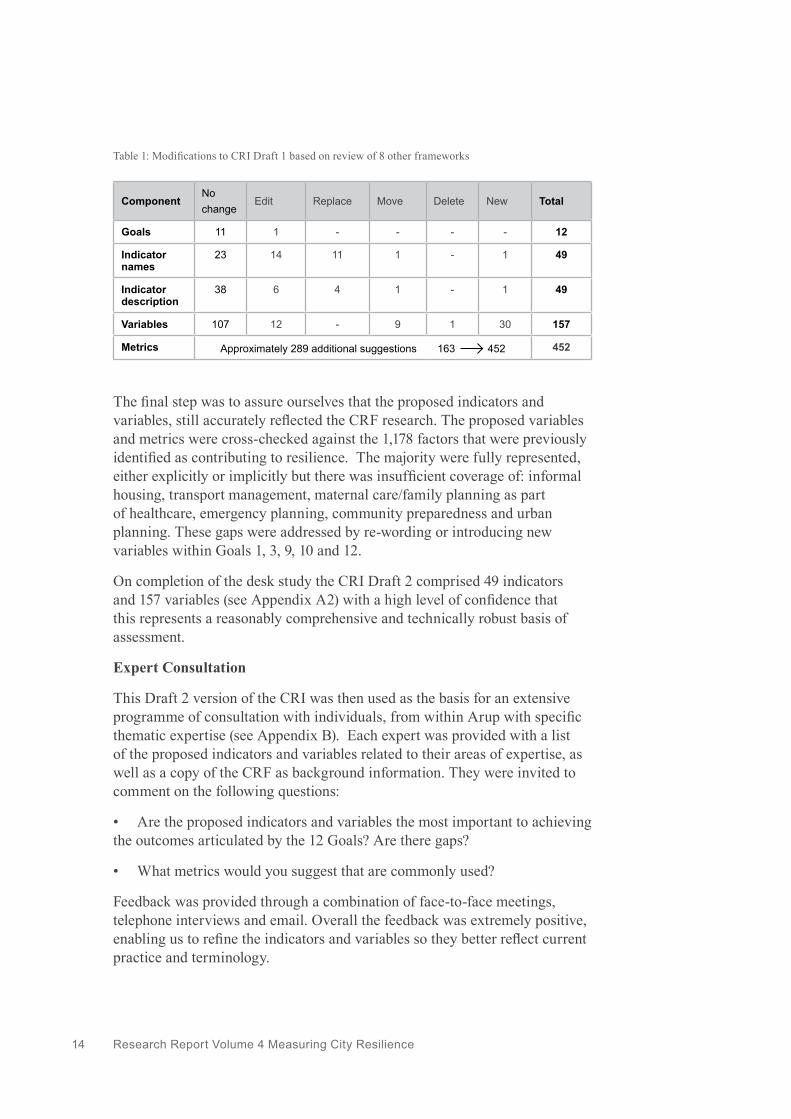
These eight frameworks were mapped against the preliminary CRI indicators in order to identify critical gaps or material issues that had been overlooked in the initial definition of the CRI. Relevant variables and metrics were extracted and added to the database, and modifications made to existing indicators and variables as summarised in Table 1. Notably, only one additional indicator was identified - Public Health under ‘Goal 3: Safeguards to Human Life and Health’. Approximately half of the indicator names were edited in order to align with terminology used elsewhere, but there were no changes to the majority of the indicator descriptions (76%). Likewise only a small proportion of variables were modified (11%) although a number of additional variables were identified, and others moved (9%).
During this process a further 289 additional resilience metrics were identified. ISO 31720, the UNISDR Scorecard and the OECD-Better Life Index were particularly significant sources of metric data and between them they provided more than 50% of these additional metrics. Where there were multiple metrics for a given variable, metrics were prioritised in the database favouring those that originated from well-established sources and/or are commonly used.
Figure 3: Preliminary definition of CRI Draft 1 Goals 1-3
Research Report Volume 4 Measuring City Resilience 14
ComponentNo change
Edit Replace Move Delete New Total
Goals 11 1 - - - - 12
Indicator names
23 14 11 1 - 1 49
Indicator description
38 6 4 1 - 1 49
Variables 107 12 - 9 1 30 157
Metrics Approximately 289 additional suggestions 163 452 452
Table 1: Modifications to CRI Draft 1 based on review of 8 other frameworks
The final step was to assure ourselves that the proposed indicators and variables, still accurately reflected the CRF research. The proposed variables and metrics were cross-checked against the 1,178 factors that were previously identified as contributing to resilience. The majority were fully represented, either explicitly or implicitly but there was insufficient coverage of: informal housing, transport management, maternal care/family planning as part of healthcare, emergency planning, community preparedness and urban planning. These gaps were addressed by re-wording or introducing new variables within Goals 1, 3, 9, 10 and 12.
On completion of the desk study the CRI Draft 2 comprised 49 indicators and 157 variables (see Appendix A2) with a high level of confidence that this represents a reasonably comprehensive and technically robust basis of assessment.
Expert Consultation
This Draft 2 version of the CRI was then used as the basis for an extensive programme of consultation with individuals, from within Arup with specific thematic expertise (see Appendix B). Each expert was provided with a list of the proposed indicators and variables related to their areas of expertise, as well as a copy of the CRF as background information. They were invited to comment on the following questions:
• Are the proposed indicators and variables the most important to achieving the outcomes articulated by the 12 Goals? Are there gaps?
• What metrics would you suggest that are commonly used?
Feedback was provided through a combination of face-to-face meetings, telephone interviews and email. Overall the feedback was extremely positive, enabling us to refine the indicators and variables so they better reflect current practice and terminology.
The Rockefeller Foundation | Arup 15
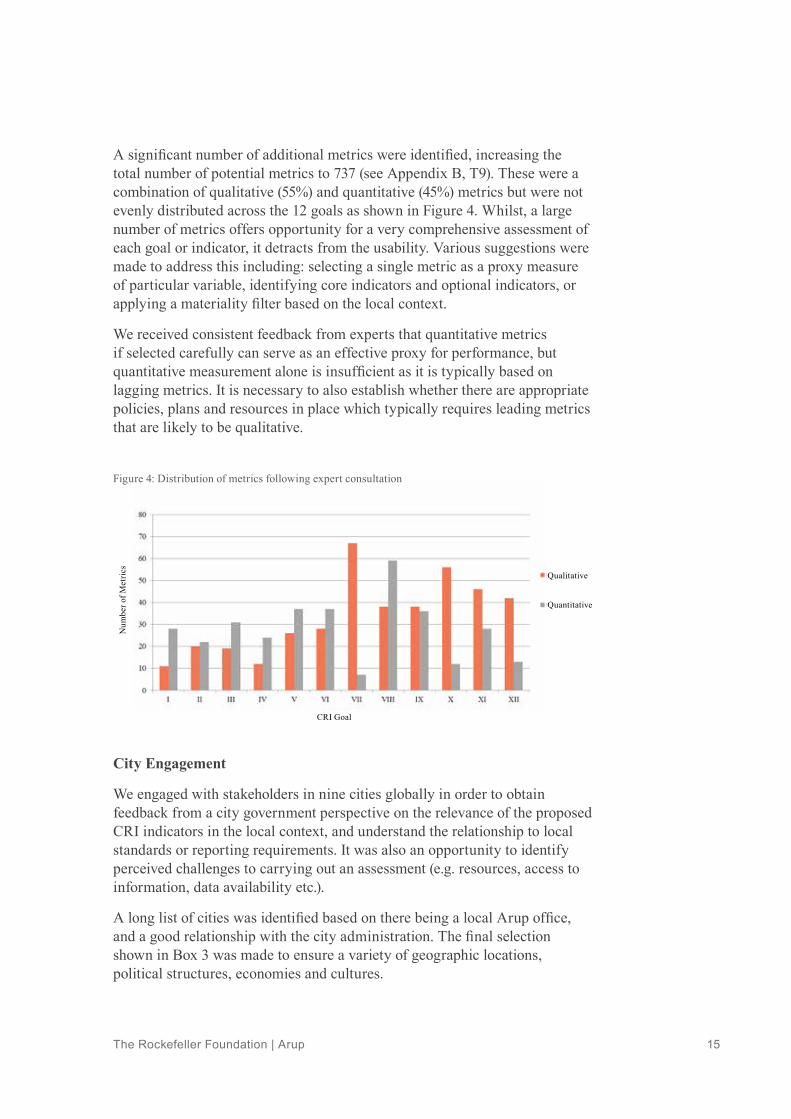
A significant number of additional metrics were identified, increasing the total number of potential metrics to 737 (see Appendix B, T9). These were a combination of qualitative (55%) and quantitative (45%) metrics but were not evenly distributed across the 12 goals as shown in Figure 4. Whilst, a large number of metrics offers opportunity for a very comprehensive assessment of each goal or indicator, it detracts from the usability. Various suggestions were made to address this including: selecting a single metric as a proxy measure of particular variable, identifying core indicators and optional indicators, or applying a materiality filter based on the local context.
We received consistent feedback from experts that quantitative metrics if selected carefully can serve as an effective proxy for performance, but quantitative measurement alone is insufficient as it is typically based on lagging metrics. It is necessary to also establish whether there are appropriate policies, plans and resources in place which typically requires leading metrics that are likely to be qualitative.
City Engagement
We engaged with stakeholders in nine cities globally in order to obtain feedback from a city government perspective on the relevance of the proposed CRI indicators in the local context, and understand the relationship to local standards or reporting requirements. It was also an opportunity to identify perceived challenges to carrying out an assessment (e.g. resources, access to information, data availability etc.).
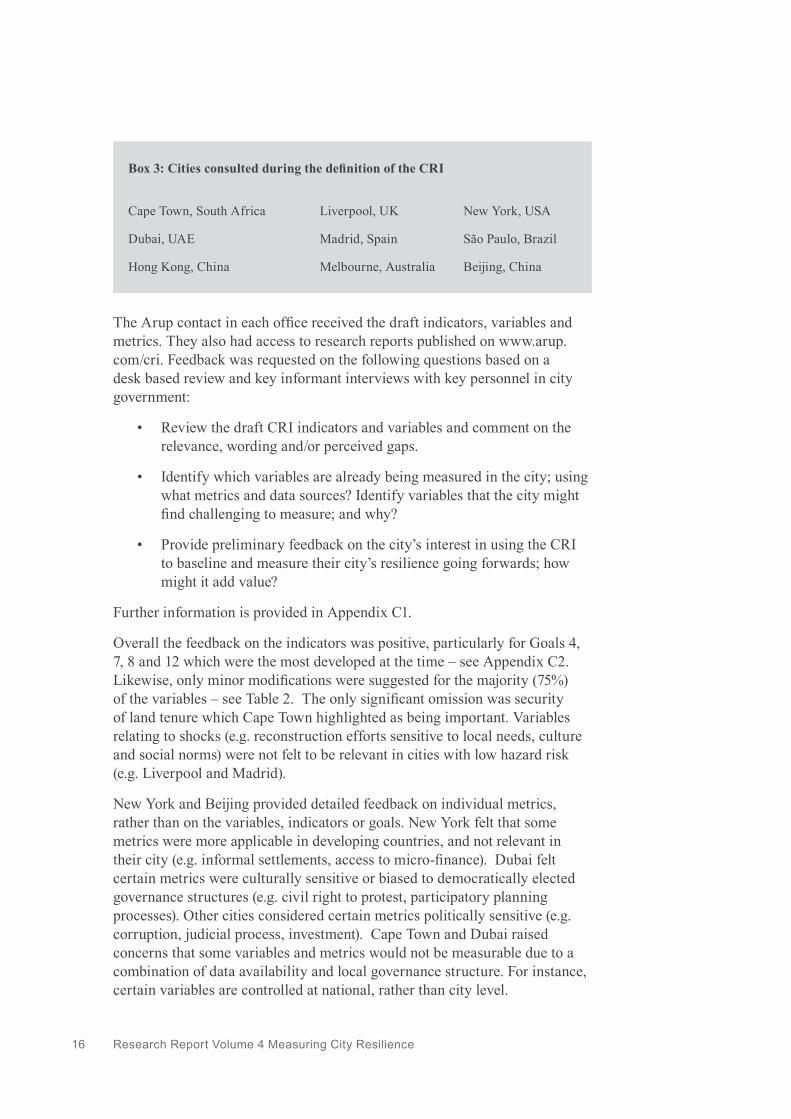
A long list of cities was identified based on there being a local Arup office, and a good relationship with the city administration. The final selection shown in Box 3 was made to ensure a variety of geographic locations, political structures, economies and cultures.
Figure 4: Distribution of metrics following expert consultation
Num
ber o
f Met
rics
CRI Goal
Qualitative
Quantitative
Research Report Volume 4 Measuring City Resilience 16
The Arup contact in each office received the draft indicators, variables and metrics. They also had access to research reports published on www.arup.com/cri. Feedback was requested on the following questions based on a desk based review and key informant interviews with key personnel in city government:
• Review the draft CRI indicators and variables and comment on the relevance, wording and/or perceived gaps.
• Identify which variables are already being measured in the city; using what metrics and data sources? Identify variables that the city might find challenging to measure; and why?
• Provide preliminary feedback on the city’s interest in using the CRI to baseline and measure their city’s resilience going forwards; how might it add value?
Further information is provided in Appendix C1.
Overall the feedback on the indicators was positive, particularly for Goals 4, 7, 8 and 12 which were the most developed at the time – see Appendix C2. Likewise, only minor modifications were suggested for the majority (75%) of the variables – see Table 2. The only significant omission was security of land tenure which Cape Town highlighted as being important. Variables relating to shocks (e.g. reconstruction efforts sensitive to local needs, culture and social norms) were not felt to be relevant in cities with low hazard risk (e.g. Liverpool and Madrid).
New York and Beijing provided detailed feedback on individual metrics, rather than on the variables, indicators or goals. New York felt that some metrics were more applicable in developing countries, and not relevant in their city (e.g. informal settlements, access to micro-finance). Dubai felt certain metrics were culturally sensitive or biased to democratically elected governance structures (e.g. civil right to protest, participatory planning processes). Other cities considered certain metrics politically sensitive (e.g. corruption, judicial process, investment). Cape Town and Dubai raised concerns that some variables and metrics would not be measurable due to a combination of data availability and local governance structure. For instance, certain variables are controlled at national, rather than city level.
Box 3: Cities consulted during the definition of the CRI
Cape Town, South Africa Liverpool, UK New York, USA
Dubai, UAE Madrid, Spain São Paulo, Brazil
Hong Kong, China Melbourne, Australia Beijing, China
The Rockefeller Foundation | Arup 17
There was considerable enthusiasm from several of the pilot cities (Madrid, São Paulo, New York, Liverpool, and Beijing) with regard to future application of the final CRI tool. Some cities were concerned about the time and resources required to carry out an assessment, whilst others (Liverpool and Hong Kong) felt they would have little difficulty accessing appropriate data.
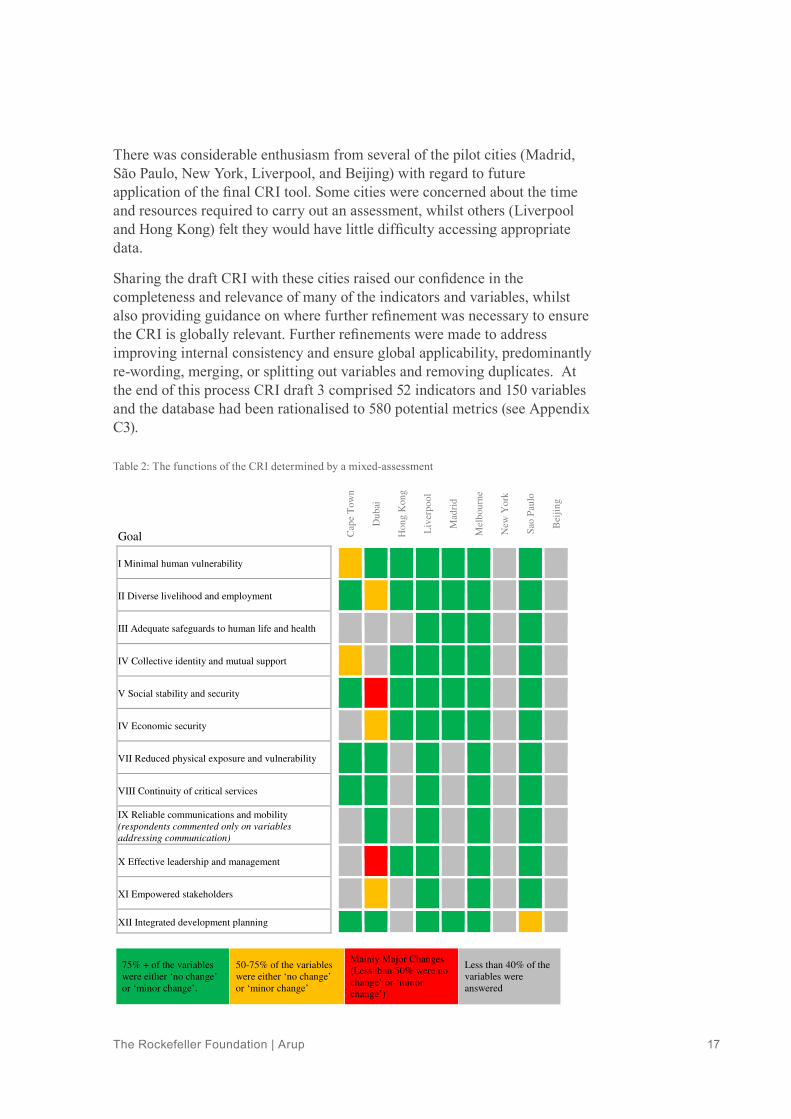
Sharing the draft CRI with these cities raised our confidence in the completeness and relevance of many of the indicators and variables, whilst also providing guidance on where further refinement was necessary to ensure the CRI is globally relevant. Further refinements were made to address improving internal consistency and ensure global applicability, predominantly re-wording, merging, or splitting out variables and removing duplicates. At the end of this process CRI draft 3 comprised 52 indicators and 150 variables and the database had been rationalised to 580 potential metrics (see Appendix C3).
Table 2: The functions of the CRI determined by a mixed-assessment
Rockefeller Foundation City Resilience IndexResearch Report Volume 4 Measuring City Resilience
240031-10 | Final Draft | 7 December 2015
C:\USERS\JOSE.AHUMADA\DOCUMENTS\ARUP 2016\160301_JOSE_AHUMADA_CRI\151207_CRI-2_VOLUME 4 RESEARCH REPORT-ARUP FINAL DRAFT.DOCX
13
Sharing the draft CRI with these cities raised our confidence in the completeness
and relevance of many of the indicators and variables, whilst also providing
guidance on where further refinement was necessary to ensure the CRI is globally
relevant. Further refinements were made to address improving internal
consistency and ensure global applicability, predominantly re-wording, merging,
or splitting out variables and removing duplicates. At the end of this process CRI
draft 3 comprised 52 indicators and 150 variables and the database had been
rationalised to 580 potential metrics (see Appendix C3).
Goal
Cap
e T
ow
n
Du
bai
Ho
ng K
ong
Liv
erpo
ol
Mad
rid
Mel
bou
rne
New
Yo
rk
Sao
Pau
lo
Bei
jin
g
I Minimal human vulnerability
II Diverse livelihood and employment
III Adequate safeguards to human life and health
IV Collective identity and mutual support
V Social stability and security
IV Economic security
VII Reduced physical exposure and vulnerability
VIII Continuity of critical services
IX Reliable communications and mobility
(respondents commented only on variables
addressing communication)
X Effective leadership and management
XI Empowered stakeholders
XII Integrated development planning
75% + of the variables
were either ‘no change’
or ‘minor change’.
50-75% of the variables
were either ‘no change’
or ‘minor change’
Mainly Major Changes
(Less than 50% were no
change’ or ‘minor
change’)
Less than 40% of the
variables were
answered
Table 2 - The functions of the CRI determined by a mixed-assessment

Research Report Volume 4 Measuring City Resilience 18
How to measure? Having achieved a high level of confidence (85%) that the proposed indicators and variables provide a comprehensive and robust basis of assessment (i.e. what to measure?) a number of studies were carried out to determine the most appropriate method of assessment (i.e. how to measure?) taking account of the feedback from expert consultation and city engagement. This stage of research considered:
• What is the optimum structure for the CRI in order to strike an appropriate balance between what is practical (usability) whilst also meaningful (credibility)?
• How can the CRI best incorporate quantitative and qualitative data, whilst also allowing for aggregation so that the results can be succinctly communicated?
• How can the CRI provide sufficient flexibility for it to be globally applicable, whilst also providing a comparable basis of assessment that allows cities to benchmark themselves against their peers?
Filtering
We initially explored the possibility of filtering out (or switching off) indicators and/or variables based on typical city profile data. A list of 61 potential profile indicators were identified through a literature review, including those used by ISO 31720 (see Appendix D1). Eight were selected as being potentially most relevant (see Box 4). The 150 variables in the CRI Draft 3 were reviewed in relation to each of these in turn to determine whether there were obvious thresholds which might mean variables were no longer relevant, or substantially less relevant. For example, we hypothesised that cities in countries with a low HDI might place greater emphasis on Goals 1-3 whilst these might be not applicable for cities in countries with a high HDI.
Box 4: City Profile Indicators• Region (World Bank, 2015)• City Development Index / Human Development Index ranking• Gini Coefficient (UNSDSN, 2015)• GNI per capita (PPP, current US$ Atlas method) (UNSDSN, 2015)• Growth rate (Arup)
• Major disaster in last 10 years (Arup)• Percentage of households with incomes below 50% of median income ("relative poverty") (UNSDSN, 2015)• Size: “small”, population < 1 million; “middle-sized”, population between 1m and 3m; and “large”, population > 3m." KPMG (2010)
The Rockefeller Foundation | Arup 19
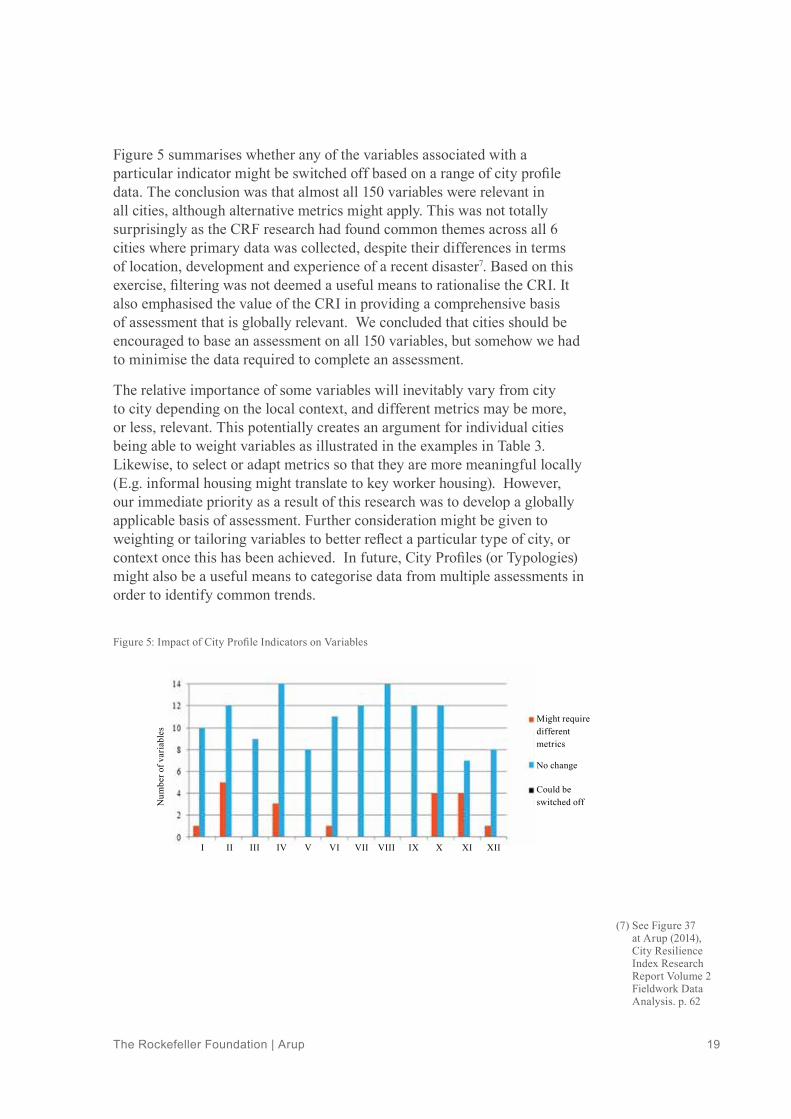
Figure 5 summarises whether any of the variables associated with a particular indicator might be switched off based on a range of city profile data. The conclusion was that almost all 150 variables were relevant in all cities, although alternative metrics might apply. This was not totally surprisingly as the CRF research had found common themes across all 6 cities where primary data was collected, despite their differences in terms of location, development and experience of a recent disaster7. Based on this exercise, filtering was not deemed a useful means to rationalise the CRI. It also emphasised the value of the CRI in providing a comprehensive basis of assessment that is globally relevant. We concluded that cities should be encouraged to base an assessment on all 150 variables, but somehow we had to minimise the data required to complete an assessment.
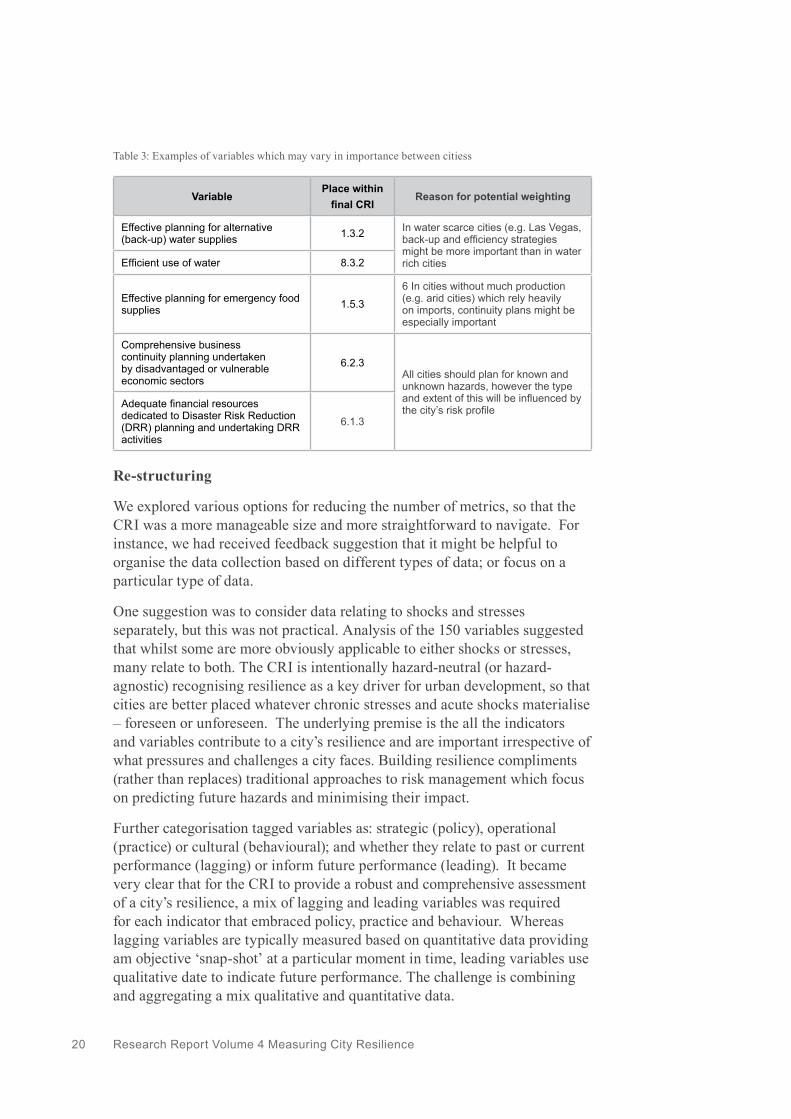
The relative importance of some variables will inevitably vary from city to city depending on the local context, and different metrics may be more, or less, relevant. This potentially creates an argument for individual cities being able to weight variables as illustrated in the examples in Table 3. Likewise, to select or adapt metrics so that they are more meaningful locally (E.g. informal housing might translate to key worker housing). However, our immediate priority as a result of this research was to develop a globally applicable basis of assessment. Further consideration might be given to weighting or tailoring variables to better reflect a particular type of city, or context once this has been achieved. In future, City Profiles (or Typologies) might also be a useful means to categorise data from multiple assessments in order to identify common trends.
Figure 5: Impact of City Profile Indicators on Variables
(7) See Figure 37 at Arup (2014), City Resilience Index Research Report Volume 2 Fieldwork Data Analysis. p. 62
Num
ber o
f var
iabl
es
Might require different metrics
I II III IV V VI VII VIII IX X XI XII
No change
Could be switched off
Research Report Volume 4 Measuring City Resilience 20
Re-structuring
We explored various options for reducing the number of metrics, so that the CRI was a more manageable size and more straightforward to navigate. For instance, we had received feedback suggestion that it might be helpful to organise the data collection based on different types of data; or focus on a particular type of data.
One suggestion was to consider data relating to shocks and stresses separately, but this was not practical. Analysis of the 150 variables suggested that whilst some are more obviously applicable to either shocks or stresses, many relate to both. The CRI is intentionally hazard-neutral (or hazard-agnostic) recognising resilience as a key driver for urban development, so that cities are better placed whatever chronic stresses and acute shocks materialise – foreseen or unforeseen. The underlying premise is the all the indicators and variables contribute to a city’s resilience and are important irrespective of what pressures and challenges a city faces. Building resilience compliments (rather than replaces) traditional approaches to risk management which focus on predicting future hazards and minimising their impact.
Further categorisation tagged variables as: strategic (policy), operational (practice) or cultural (behavioural); and whether they relate to past or current performance (lagging) or inform future performance (leading). It became very clear that for the CRI to provide a robust and comprehensive assessment of a city’s resilience, a mix of lagging and leading variables was required for each indicator that embraced policy, practice and behaviour. Whereas lagging variables are typically measured based on quantitative data providing am objective ‘snap-shot’ at a particular moment in time, leading variables use qualitative date to indicate future performance. The challenge is combining and aggregating a mix qualitative and quantitative data.
VariablePlace within
final CRIReason for potential weighting
Effective planning for alternative (back-up) water supplies 1.3.2 In water scarce cities (e.g. Las Vegas,
back-up and efficiency strategies might be more important than in water rich citiesEfficient use of water 8.3.2
Effective planning for emergency food supplies 1.5.3
6 In cities without much production (e.g. arid cities) which rely heavily on imports, continuity plans might be especially important
Comprehensive business continuity planning undertaken by disadvantaged or vulnerable economic sectors
6.2.3All cities should plan for known and unknown hazards, however the type and extent of this will be influenced by the city’s risk profileAdequate financial resources
dedicated to Disaster Risk Reduction (DRR) planning and undertaking DRR activities
6.1.3
Table 3: Examples of variables which may vary in importance between citiess

The Rockefeller Foundation | Arup 21
Recognising the value of both, we decided that the CRI should comprise two parts:
• A qualitative assessment that would provide a subjective diagnosis of a city’s resilience identifying key strengths and weaknesses in policy, practice and behaviours; and,
• A quantitative assessment that would enable cities to baseline their present day performance and monitor progress over time.
To ensure the two parts were consistent and complementary, the variables were used as ‘scaffolding’ to re-structure the CRI. A series of questions were identified for each variable, reflecting the types of data (qualitative and quantitative) that might be considered. These were reviewed, re-worded and merged to create a single prompt question that could be answered subjectively based on qualitative information, and objectively based on quantitative data, if available. This process is illustrated for a variable associated with indicator 3.1 in Table 4.
Our previous research on urban measurement8 suggested that resilience – like sustainability – would require a ‘broad universe of variables’ in order to provide a comprehensive basis of assessment; and, that approximately 150 fields was the maximum number of fields that is practical. In order to keep the overall number of prompt questions to approximately 150, there are typically no more than 3 prompt questions per indicator. However, additional questions were necessary for some indicators, notably the ‘effective provision of critical services’ (Goal 8) which covers several systems (water, energy, etc.) In total 156 prompt questions were defined.
Previous Variable
Previous Qualitative Questions(New)
Prompt
Effective programmes for health risk monitoring and controls (disease and pest)
Does the city or other partner agency run programmes to identify and monitor current and future health risks within the city?
To what extent are health risks monitored and controlled within the city?
Does the city or other agency within the city run vaccination programmes to reduce known health risks?
Are special arrangements made to extend these programmes to minority and vulnerable groups?
Does the city or other partner agency undertake programmes to control the spread of diseases (E.g. Water/vector-borne)?
Does the city or other partner agency undertake public health inspections and regulation of public facilities and businesses?
Are the findings of these inspections made available to the general public?
Table 4: Example of how a variable and one or more qualitative data requirements were brought together into a single prompt question
(8) Arup (2014) City Resilience Index Research Report Volume : Urban Measurement Report

Research Report Volume 4 Measuring City Resilience 22
Box 5: Options for converting qualitative data to a numerical score
1. Yes-No: The variable is worded as a question (E.g. Is there currently safe, reliable and affordable potable water supply to households across the city?). A ‘Yes’ generates a score of 1, a ‘No’ a score of 0.
2. Perceptions: The variables is worded as a statement (E.g. There is currently safe, reliable and affordable potable water supply to households across the city). Scores are assigned on an ordinal scale with 1 equates to ‘strongly disagree’, and 5 to ‘strongly agree’.
3. Bounded range: The variable is translated into worst case and best case scenarios. E.g.
There is an acute shortage of affordable housing in the city
The city's supply of affordable housing is able to meet demand and requirements of residents (in terms of space and quality).
Scores are assigned on a scale of 1 (worst case) to 5 (best case).
4. Thresholds: The variable is presented as a question beginning ‘to what extent’ (E.g. To what extent is there currently safe, reliable and affordable potable water supply to households across the city?) Scores are assigned based on pre-defined scenarios that describe the interim performance thresholds associated with scores 2-4, as well as the extremes.
Qualitative Assessment
Several different approaches were considered for converting qualitative (or subjective responses) to the 156 questions into numerical scores that can then be aggregated in order to communicate key strengths and weakness based on the 12 goals.
These options were assessed by the team, and also discussed at the peer review workshop in Bangkok (see section 2.12). The preferred option is a bounded range. It provides more granularity than a yes-no approach; more flexibility than the thresholds approach which was considered to be too prescriptive for global application; and, is considerably more informative and educational compared to the perceptions approach. The best/worst case scenarios encourage the responder to think objectively about where city’s performance falls between these two extremes, rather than voice a personal opinion. It strikes a balance between capturing the perceptions of the responder, whilst setting their views within a wider context so that assessments from different cities are on a comparable basis. For instance, a city may think they are performing very well against a particular variable, but it may not be as well as the best case scenario so would score themselves as 4, rather than 5.

The Rockefeller Foundation | Arup 23
The 403 qualitative questions (identified by original research, literature, expert consultation and city engagement) provided the basis for defining best/worst case scenarios. In many cases several qualitative metrics were able to be captured under one scenario. Scenarios describes the outcomes relevant to resilience, rather than how those outcomes are achieved. For example, ‘there are mechanisms in place to ensure that plans are regularly reviewed’ rather than ‘there is an emergency planning committee that meets quarterly to review plans’.
Quantitative metrics
The initial CRI development produced 334 quantitative metrics. For some goals and indicators there were many metrics to choose from, but for others very few quantitative metrics existed. Figure 4 illustrates how for the indicators associated with Goals 7 and 10 the desk study and expert consultation had identified only a handful of quantitative metrics, compared with the indicators associated with Goal 8. Additional metrics had to be created for some indicators, whilst for others there were too many indicators. It was necessary to propose a new metric for approximately half (47%) of the prompt questions. Predominantly these are questions associated with indicators for goals 4, 6-7, 9-11 which are more intangible.
Initially, several metrics were included in order to fully measure the qualities of resilience associated with each question. For example, the question ‘availability of safe and affordable housing’ would need metrics that reflect the amount of housing, who has access to housing, whether it is well-built and how much it costs in relation to local incomes. However, this proved impractical in terms of the time and resources a city is likely to have to complete the assessment, particularly if the assessment is to be repeated annually (or to coincide with planning cycles).
5 1
Figure 6: An example of scenarios
→Prompt
question
E.g. To what extent does the city provide diverse and effective transport links to other cities or regions?
Part A: Qualitative Assessment
Best-case ScenarioThe city has identified the commuting catchment and has up-to-date data on commuting time and cost by mode. The city has strong regional transport connectivity through a range of accesible transport modes. The city has undertaken a strategic assessment of...
Worst-case ScenarioThe city has not identified the commuting catchment. The city has poor transport links to other cities or regions. The city has not undertaken a strategic assessment of...
Assessors makes judgement on where the city lies on the scoring scale
Score = 4
Research Report Volume 4 Measuring City Resilience 24
Selecting a single metric as a reasonable proxy for performance is a common approach to managing complexity (E.g. MDGs, SDGs and ISO37120). A poor performance can act as a red flag, triggering the need for a more in-depth assessment into a broader set of issues. The preferred proxy metric was selected based on relevance to the prompt question, likelihood of data being available.
Wherever possible metrics from established sources have been used (E.g. ISO 31720 (2014), OECD (2014) etc.). The initial stage of piloting the CRI in Liverpool and Hong Kong specifically explored whether there was data available for the 156 preferred proxy metrics, concluding even data rich cities are only likely to currently measure at most 60% of the proposed metrics (see CRI Research Report: Volume 5: Lessons from the Pilots).
A further 450 supplementary metrics are included in the database; up to four for each prompt question. These might be useful in future, should a city want to pursue a more in depth analysis of a particular goal, or base their performance on more comprehensive set of data. They could be adopted as alternative metrics in a particular city, if data is more readily available but this would compromise the opportunity for benchmarking or comparison with other cities.
Thresholds
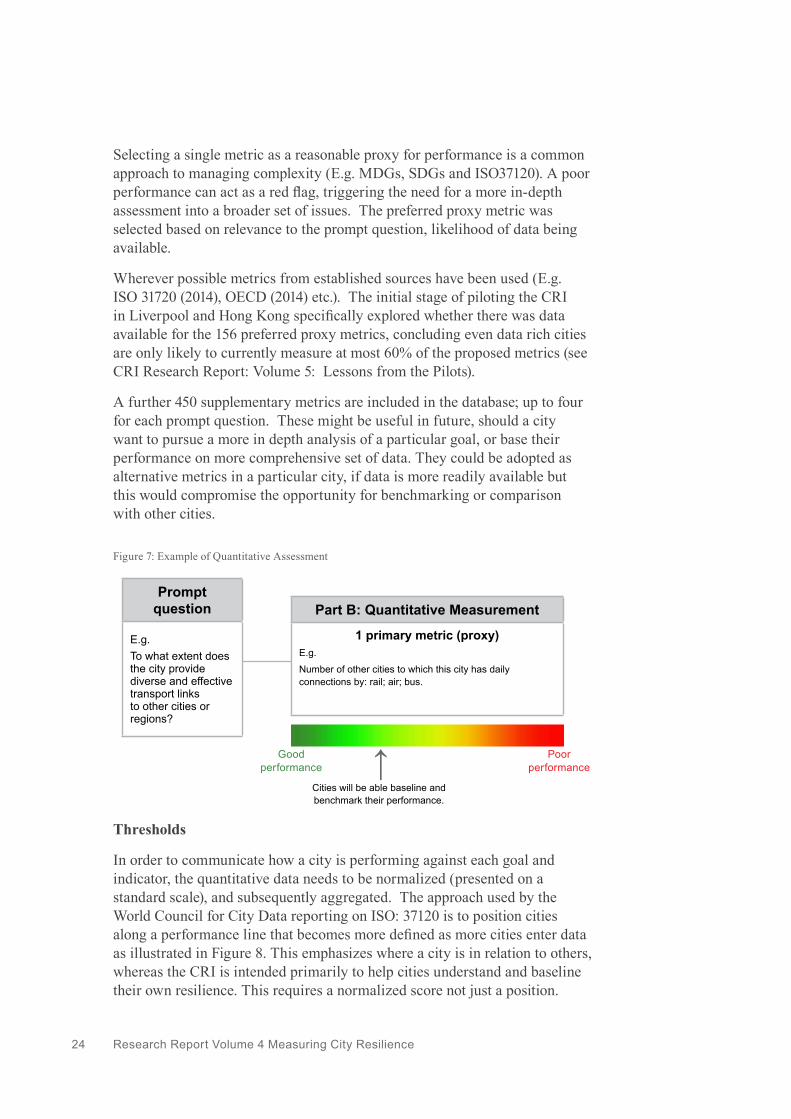
In order to communicate how a city is performing against each goal and indicator, the quantitative data needs to be normalized (presented on a standard scale), and subsequently aggregated. The approach used by the World Council for City Data reporting on ISO: 37120 is to position cities along a performance line that becomes more defined as more cities enter data as illustrated in Figure 8. This emphasizes where a city is in relation to others, whereas the CRI is intended primarily to help cities understand and baseline their own resilience. This requires a normalized score not just a position.
Figure 7: Example of Quantitative Assessment
Good performance
Poor performance→
Prompt question
E.g. To what extent does the city provide diverse and effective transport links to other cities or regions?
Part B: Quantitative Measurement
1 primary metric (proxy)E.g.
Number of other cities to which this city has daily connections by: rail; air; bus.
Cities will be able baseline and benchmark their performance.
The Rockefeller Foundation | Arup 25
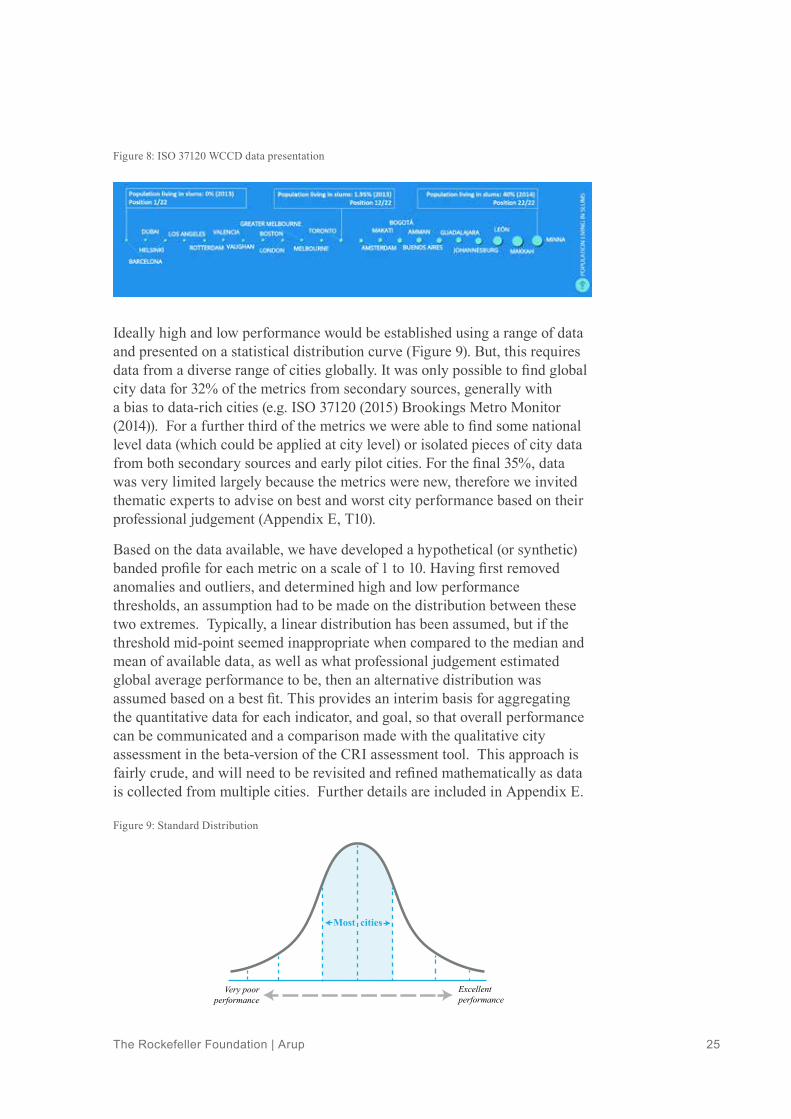
Ideally high and low performance would be established using a range of data and presented on a statistical distribution curve (Figure 9). But, this requires data from a diverse range of cities globally. It was only possible to find global city data for 32% of the metrics from secondary sources, generally with a bias to data-rich cities (e.g. ISO 37120 (2015) Brookings Metro Monitor (2014)). For a further third of the metrics we were able to find some national level data (which could be applied at city level) or isolated pieces of city data from both secondary sources and early pilot cities. For the final 35%, data was very limited largely because the metrics were new, therefore we invited thematic experts to advise on best and worst city performance based on their professional judgement (Appendix E, T10).
Based on the data available, we have developed a hypothetical (or synthetic) banded profile for each metric on a scale of 1 to 10. Having first removed anomalies and outliers, and determined high and low performance thresholds, an assumption had to be made on the distribution between these two extremes. Typically, a linear distribution has been assumed, but if the threshold mid-point seemed inappropriate when compared to the median and mean of available data, as well as what professional judgement estimated global average performance to be, then an alternative distribution was assumed based on a best fit. This provides an interim basis for aggregating the quantitative data for each indicator, and goal, so that overall performance can be communicated and a comparison made with the qualitative city assessment in the beta-version of the CRI assessment tool. This approach is fairly crude, and will need to be revisited and refined mathematically as data is collected from multiple cities. Further details are included in Appendix E.
Figure 8: ISO 37120 WCCD data presentation
Figure 9: Standard Distribution
Excellentperformance
Most cities
Very poorperformance
Research Report Volume 4 Measuring City Resilience 26
Validation
A final round of expert consultation was held involving 12 external experts and 10 Arup sector experts in order to validate the approach taken (Appendix F1). Specifically, answers to the following questions were sought:
• Are the prompt questions used for qualitative assessment of the indicators framed appropriately for scope, context and detail?
• Are the best-case and worst-case scenarios appropriate for providing sufficient and appropriate guidance for interpreting performance in relation to the prompt questions?
• Are the preferred metrics used for quantitative measurement of performance against the indicators appropriate, meaningful, and measureable by cities?
The specialists were provided with a list of the indicators, prompt questions, best-case / worst-case scenarios and preferred metrics most closely related to their areas of expertise. Additionally, in order to understand the broader context of the 12 Goals, specialists were also provided with copies of the CRF. Once the specialists had reviewed the materials, the CRI team carried out face-to-face and telephone interviews. In addition detailed feedback was generally provided by email. The comments received are summarised in Appendix F2. This enabled us to further refine the questions and scenarios; particularly for Goals 2-4, 6 and 11.
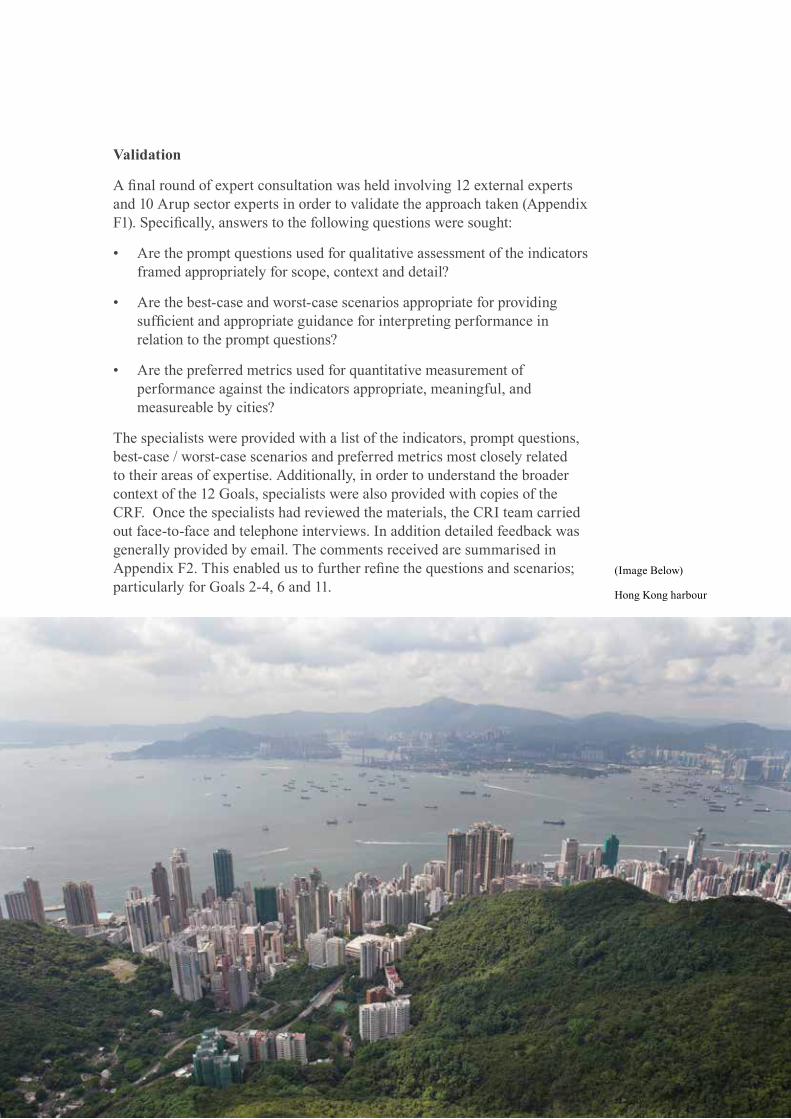
(Image Below)
Hong Kong harbour

The Rockefeller Foundation | Arup 27
A final independent desk study review of all the goals, indicators, scenarios and metrics was then carried out to ensure consistency and identify any omissions, overlaps or duplication. This included a cross-check of all the qualities (see Appendix G1). Table 5 summarises the key changes resulting from this final review.
Indicator Main Changes
I: Minimal human vulnerability
In the housing indicator, additional focus was placed upon education to the population about safe construction.
II: Diverse livelihood & employment Metric development.
III: Adequate safeguards to human life & health
A new prompt question was created around support for addiction patients / substance misuse.
IV: Collective identity & mutual support
Within ‘Local Community Support’ additional focus was placed upon support for vulnerable persons addressing issues such as such as street children, domestic abuse & underage marriage.
V: Social stability & security No significant changes.
VI: Economic security Metric development.
VII: Reduced Physical Exposure & Vulnerability
Building codes expanded to include communication as well as presence.
VIII: Continuity of Critical Services
Sanitation prompt amended to consider robustness instead of diversity.
IX: Reliable communications & mobility Metric development.
X: Effective leadership & management
Significant restructure to emergency planning indicators & prompts. Government & Multistakeholder Emergency Planning indicators merged into one indicator considering city emergency planning overall. This increases indicator usability & emphasises government-other stakeholder coordination.
XI: Empowered stakeholders No significant changes.
XII: Integrated development planning
Addition focusing of prompts to ensure that the indicator capture the use of hazard data in planning and zonation.
Table 5: Main Changes to CRI from Final Review
Peer ReviewDuring the development of the CRI, we held regular peer review workshops (or salons) with participants sharing a strong interest in urban resilience. A full list of participants is included in Appendix H1. Each has a specific focus relevant to the particular stage in the development process.
Research Report Volume 4 Measuring City Resilience 28
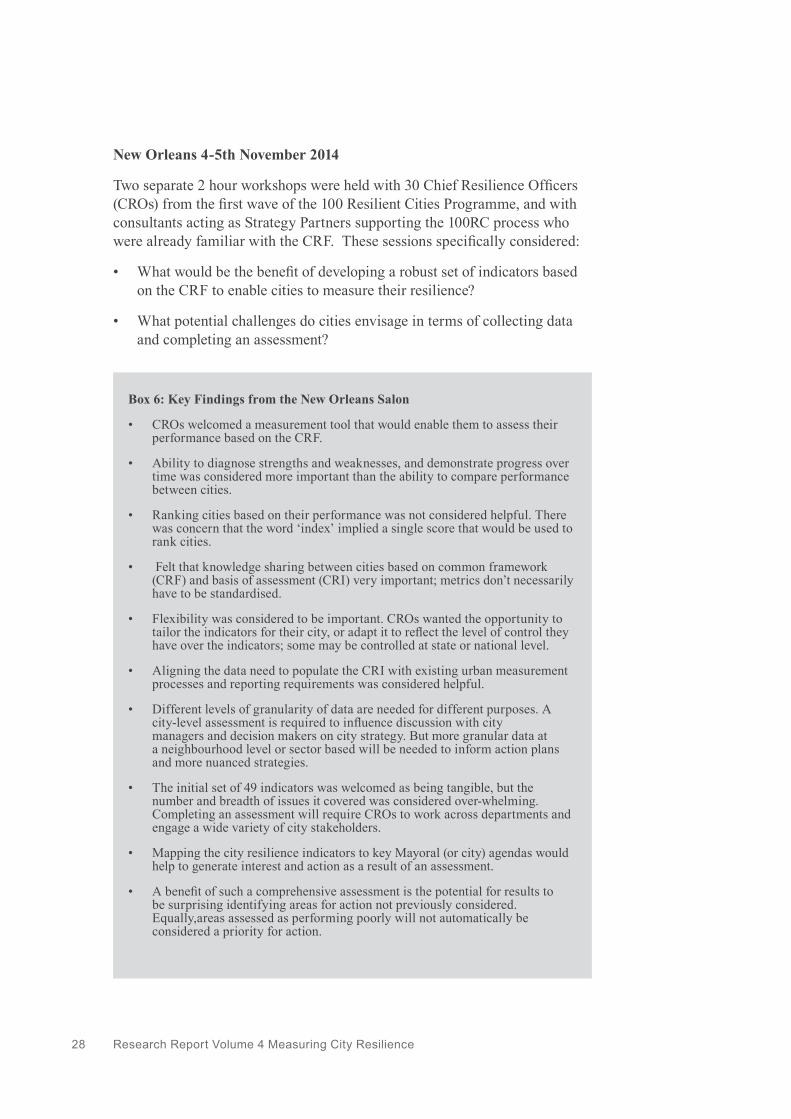
New Orleans 4-5th November 2014
Two separate 2 hour workshops were held with 30 Chief Resilience Officers (CROs) from the first wave of the 100 Resilient Cities Programme, and with consultants acting as Strategy Partners supporting the 100RC process who were already familiar with the CRF. These sessions specifically considered:
• What would be the benefit of developing a robust set of indicators based on the CRF to enable cities to measure their resilience?
• What potential challenges do cities envisage in terms of collecting data and completing an assessment?
Box 6: Key Findings from the New Orleans Salon
• CROs welcomed a measurement tool that would enable them to assess their performance based on the CRF.
• Ability to diagnose strengths and weaknesses, and demonstrate progress over time was considered more important than the ability to compare performance between cities.
• Ranking cities based on their performance was not considered helpful. There was concern that the word ‘index’ implied a single score that would be used to rank cities.
• Felt that knowledge sharing between cities based on common framework (CRF) and basis of assessment (CRI) very important; metrics don’t necessarily have to be standardised.
• Flexibility was considered to be important. CROs wanted the opportunity to tailor the indicators for their city, or adapt it to reflect the level of control they have over the indicators; some may be controlled at state or national level.
• Aligning the data need to populate the CRI with existing urban measurement processes and reporting requirements was considered helpful.
• Different levels of granularity of data are needed for different purposes. A city-level assessment is required to influence discussion with city managers and decision makers on city strategy. But more granular data at a neighbourhood level or sector based will be needed to inform action plans and more nuanced strategies.
• The initial set of 49 indicators was welcomed as being tangible, but the number and breadth of issues it covered was considered over-whelming. Completing an assessment will require CROs to work across departments and engage a wide variety of city stakeholders.
• Mapping the city resilience indicators to key Mayoral (or city) agendas would help to generate interest and action as a result of an assessment.
• A benefit of such a comprehensive assessment is the potential for results to be surprising identifying areas for action not previously considered. Equally,areas assessed as performing poorly will not automatically be considered a priority for action.
The Rockefeller Foundation | Arup 29
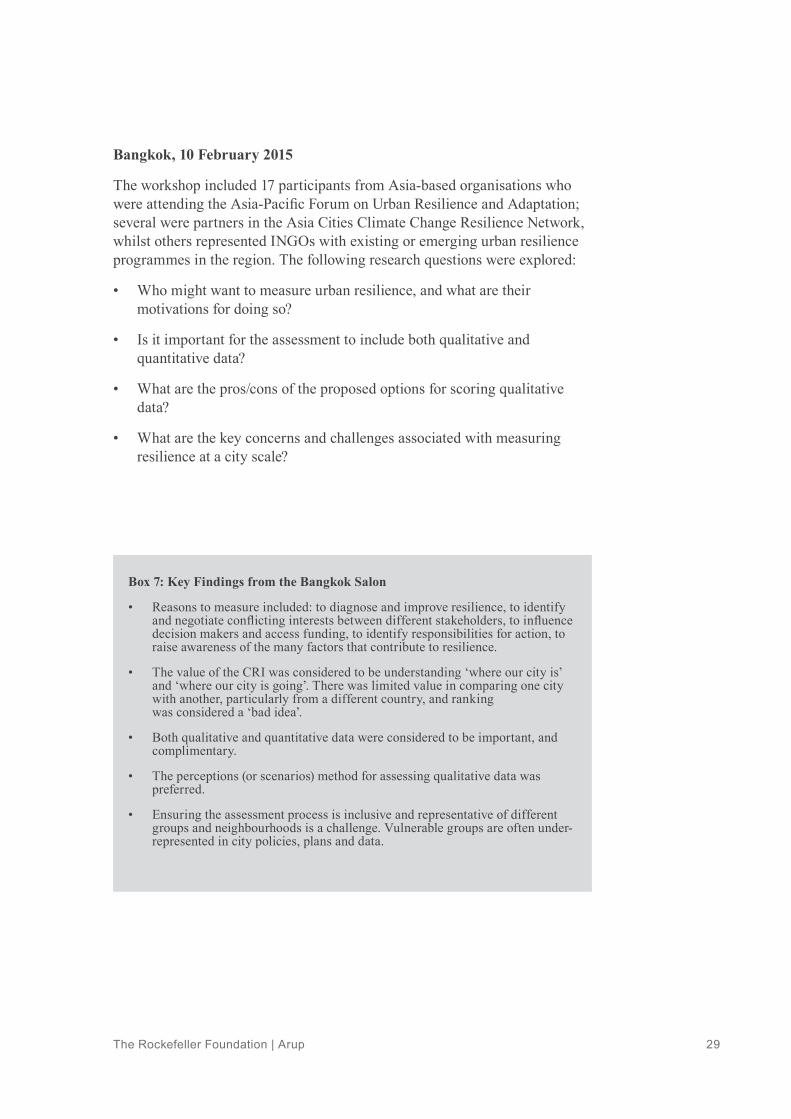
Bangkok, 10 February 2015
The workshop included 17 participants from Asia-based organisations who were attending the Asia-Pacific Forum on Urban Resilience and Adaptation; several were partners in the Asia Cities Climate Change Resilience Network, whilst others represented INGOs with existing or emerging urban resilience programmes in the region. The following research questions were explored:
• Who might want to measure urban resilience, and what are their motivations for doing so?
• Is it important for the assessment to include both qualitative and quantitative data?
• What are the pros/cons of the proposed options for scoring qualitative data?
• What are the key concerns and challenges associated with measuring resilience at a city scale?
Box 7: Key Findings from the Bangkok Salon
• Reasons to measure included: to diagnose and improve resilience, to identify and negotiate conflicting interests between different stakeholders, to influence decision makers and access funding, to identify responsibilities for action, to raise awareness of the many factors that contribute to resilience.
• The value of the CRI was considered to be understanding ‘where our city is’ and ‘where our city is going’. There was limited value in comparing one city with another, particularly from a different country, and ranking was considered a ‘bad idea’.
• Both qualitative and quantitative data were considered to be important, and complimentary.
• The perceptions (or scenarios) method for assessing qualitative data was preferred.
• Ensuring the assessment process is inclusive and representative of different groups and neighbourhoods is a challenge. Vulnerable groups are often under- represented in city policies, plans and data.
Research Report Volume 4 Measuring City Resilience 30
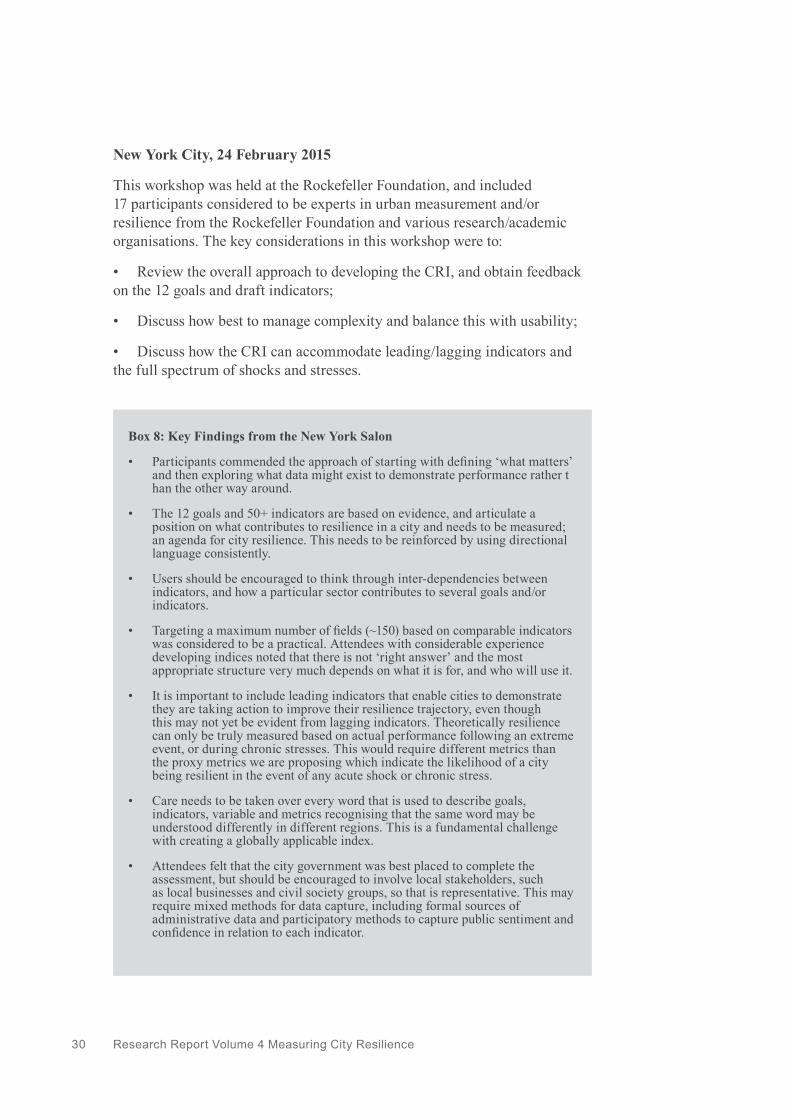
New York City, 24 February 2015
This workshop was held at the Rockefeller Foundation, and included 17 participants considered to be experts in urban measurement and/or resilience from the Rockefeller Foundation and various research/academic organisations. The key considerations in this workshop were to:
• Review the overall approach to developing the CRI, and obtain feedback on the 12 goals and draft indicators;
• Discuss how best to manage complexity and balance this with usability;
• Discuss how the CRI can accommodate leading/lagging indicators and the full spectrum of shocks and stresses.
Box 8: Key Findings from the New York Salon
• Participants commended the approach of starting with defining ‘what matters’ and then exploring what data might exist to demonstrate performance rather t han the other way around.
• The 12 goals and 50+ indicators are based on evidence, and articulate a position on what contributes to resilience in a city and needs to be measured; an agenda for city resilience. This needs to be reinforced by using directional language consistently.
• Users should be encouraged to think through inter-dependencies between indicators, and how a particular sector contributes to several goals and/or indicators.
• Targeting a maximum number of fields (~150) based on comparable indicators was considered to be a practical. Attendees with considerable experience developing indices noted that there is not ‘right answer’ and the most appropriate structure very much depends on what it is for, and who will use it.
• It is important to include leading indicators that enable cities to demonstrate they are taking action to improve their resilience trajectory, even though this may not yet be evident from lagging indicators. Theoretically resilience can only be truly measured based on actual performance following an extreme event, or during chronic stresses. This would require different metrics than the proxy metrics we are proposing which indicate the likelihood of a city being resilient in the event of any acute shock or chronic stress.
• Care needs to be taken over every word that is used to describe goals, indicators, variable and metrics recognising that the same word may be understood differently in different regions. This is a fundamental challenge with creating a globally applicable index.
• Attendees felt that the city government was best placed to complete the assessment, but should be encouraged to involve local stakeholders, such as local businesses and civil society groups, so that is representative. This may require mixed methods for data capture, including formal sources of administrative data and participatory methods to capture public sentiment and confidence in relation to each indicator.

The Rockefeller Foundation | Arup 31
Cape Town, 21 April 2015
The Cape Town workshop was held in Arup’s office and included 12 participants with representatives from city government, local businesses, and civil society.
A number of key questions were raised in this meeting which provided useful considerations with respect to future presentation and use of the final city resilience tool. They questioned whether the CRI had been viewed in the context of the Sustainable Development Goals (See Appendix A1). They also questioned whether the CRI might be used at sub-city level to measure and compare the resilience of different areas, in a way that can be aggregated up to city scale? This is a question that could be explored further in future work.
Box 8 (continued)• Participants felt the CRI had the potential to establish an agenda for city resilience and guide cities on the action they need to take; and, create a richer evidence base on what does/doesn’t contribute to city resilience. Its unique value is saying ‘if you want to measure city resilience, these are the things you would want to measure’; but this may mean metric vary from city to city.
(Image Below)
Informal settlement in Cape Town, South Africa

Research Report Volume 4 Measuring City Resilience 32
Box 9: Key Findings from the Second New York Salon
• The CRI provides a user-driven diagnostic and assessment tool.
• Together the CRF, CRI and the on-line assessment tool provide a suite of related products and tools for understanding and measuring resilience.
• The CRI can be used to rate – rather than rank – cities i.e., compare with other cities rather than position against other cities; Principal use is to compare a city to itself, over time.
• The CRI can be used retrospectively to evaluate or understand the trajectory of change over time in a city.
• The CRI has not been designed as project or programme evaluation framework, Nevertheless, the indicators could be used for evaluating urban resilience programs or projects, specifically to consider how a project or program can affect a city or region’s resilience over time.
• The CRI indicators are applicable at scales above and below the city but the basis of measurement may differ.
• Consider the possibility of derivatives of the CRI that respond to national reporting or guidance on urban development planning without compromising its integrity.
• Consider the time, resources, and support for users to complete the assessment.
• How the CRF/CRI can be used to promote a shared understanding of resilience within the Rockefeller Foundation as well as with our partners.
New York City, 14th September 2015
This second NYC Workshop was with members of the Rockefeller Foundation working on resilience initiatives, including the Global Resilience Partnership, ACCCRN and 100RC. This workshop focussed on the implementation of the CRI:
Bangkok, 14th - October 2015
The USAID-RF Measuring Resilience Seminar provided an opportunity to share the research and development process for the CRI with a wide range of organisations who themselves have tackled similar challenges developing tools to measure resilience at various scales for different purposes. Only two other organisations, ICLEI and Mercy Corps (both ACCCRN partners) had tried to develop urban resilience tools. The CRI presentation was very positively received, particularly the rigour behind its development and evidence-based approach. It reflected the convergence during the seminar on key resilience messages summarised in Box 10.
The CRI presentation was very positively received, particularly the rigour behind its development and evidence-based approach. It reflected the
The Rockefeller Foundation | Arup 33
Box 10: Key Resilience Messages from USAID-RF Measuring Resilience Seminar
• Resilience is more than DRR, and does specifically focus on what enables individuals, households, cities to function in adverse or disruptive conditions;
• Resilience relates to hazards - both shocks and stresses. Although some felt this distinction was misleading and proposed sudden, repeat and long term (or accumulating) stresses as an alternative with the analysis of risk reflecting predictability, as well as severity and frequency; repetitive events (flooding, drought, etc.) are a critical concern.
• Integrated planning, and integrated programming are important; and ability to achieve impact at scale within the wider objective of achieving broader development outcomes.
• Resilience is a multi-hazard, multi-scale, multi-stakeholder agenda;
• Requirement to understand hazards + build resilience capacity in order to achieve development outcomes (well-being).
• Recognition that measuring resilience means different things to different groups including: resilience assessment to prioritise action (CRI), quantifying resilience (social dividend, avoided loss, cost-benefit), monitoring programme level outcomes and evaluating impact, informing capital allocation.
• The need to align efforts to build resilience with national plans which are influence by global frameworks; Sendai, COP21 and SDGs. All have targets and indicators.
• Networks play and important role in resilience building and act as a driver of change (ACCCRN, APAN, FSIN) (so does measurement).
• Resilience is an emerging field and sharing knowledge is important. Collaboration not competition is what is needed.
convergence during the seminar on key resilience messages summarised in Box 10. The CRI was understood by participants as focussing specifically on assessing ‘resilience capacities’ where as some of the other ‘resilience tools’ presented incorporated (or focussed on) risk (or hazard) assessment.

Research Report Volume 4 Measuring City Resilience 34
The Rockefeller Foundation | Arup 35
Key ConsiderationsPurpose We set out “to develop a comprehensive set of indicators, variables and metrics – the City Resilience Index – that can be used by cities to baseline and measure their resilience over time; thereby inform urban planning and investment decisions that will enhance their resilience”.9The CRI will be widely accessible, via an on-line platform, so that data from the assessments can be used “to refine the tool, share knowledge, and inform best practice globally.”10
The CRI is intended as a diagnostic tool that enables cities to assess their resilience at a city scale, in order to identify strengths, weakness and priorities for action, as well as measure relative performance over time. Its purpose is not to compare cities. Nevertheless, we decided a common basis of measurement is necessary to facilitate dialogue and knowledge-sharing between cities. It also provides opportunities for cities to benchmark their performance against logical peers; and, to analyse data from multiple cities in order to establish common trends and best practice.
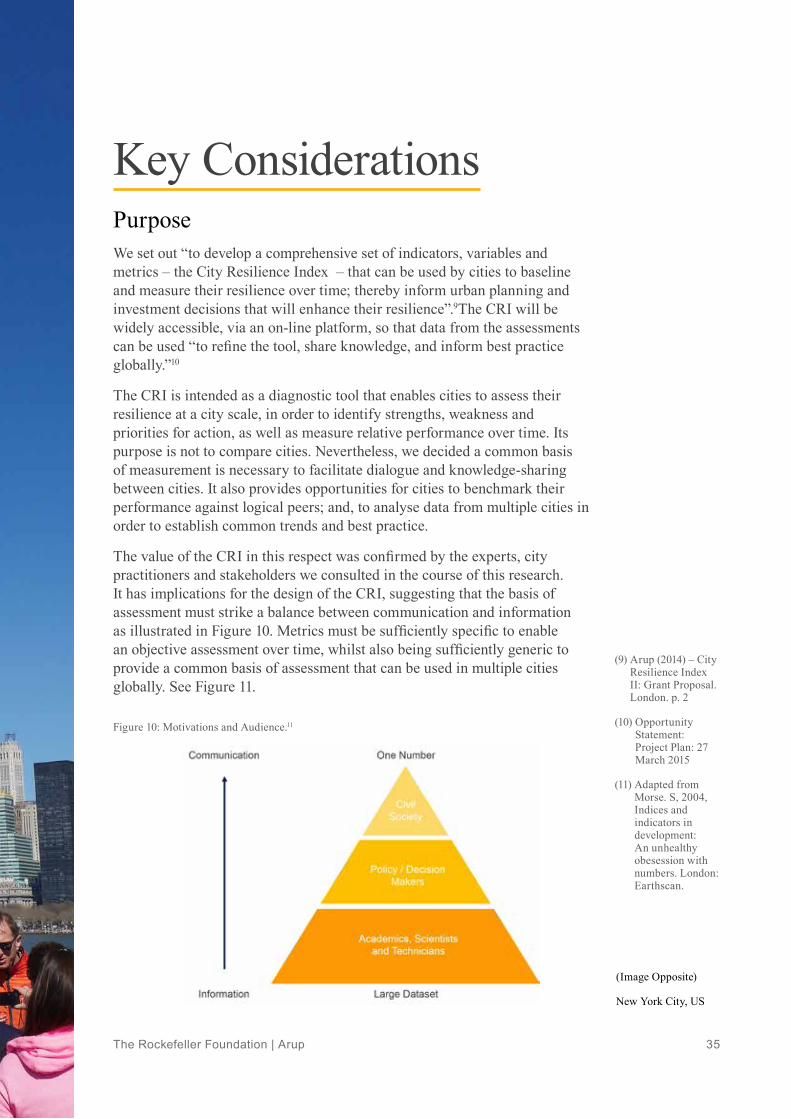
The value of the CRI in this respect was confirmed by the experts, city practitioners and stakeholders we consulted in the course of this research. It has implications for the design of the CRI, suggesting that the basis of assessment must strike a balance between communication and information as illustrated in Figure 10. Metrics must be sufficiently specific to enable an objective assessment over time, whilst also being sufficiently generic to provide a common basis of assessment that can be used in multiple cities globally. See Figure 11.
Figure 10: Motivations and Audience.11
(9) Arup (2014) – City Resilience Index II: Grant Proposal. London. p. 2
(10) Opportunity Statement: Project Plan: 27 March 2015
(11) Adapted from Morse. S, 2004, Indices and indicators in development: An unhealthy obesession with numbers. London: Earthscan.
(Image Opposite)
New York City, US
Research Report Volume 4 Measuring City Resilience 36
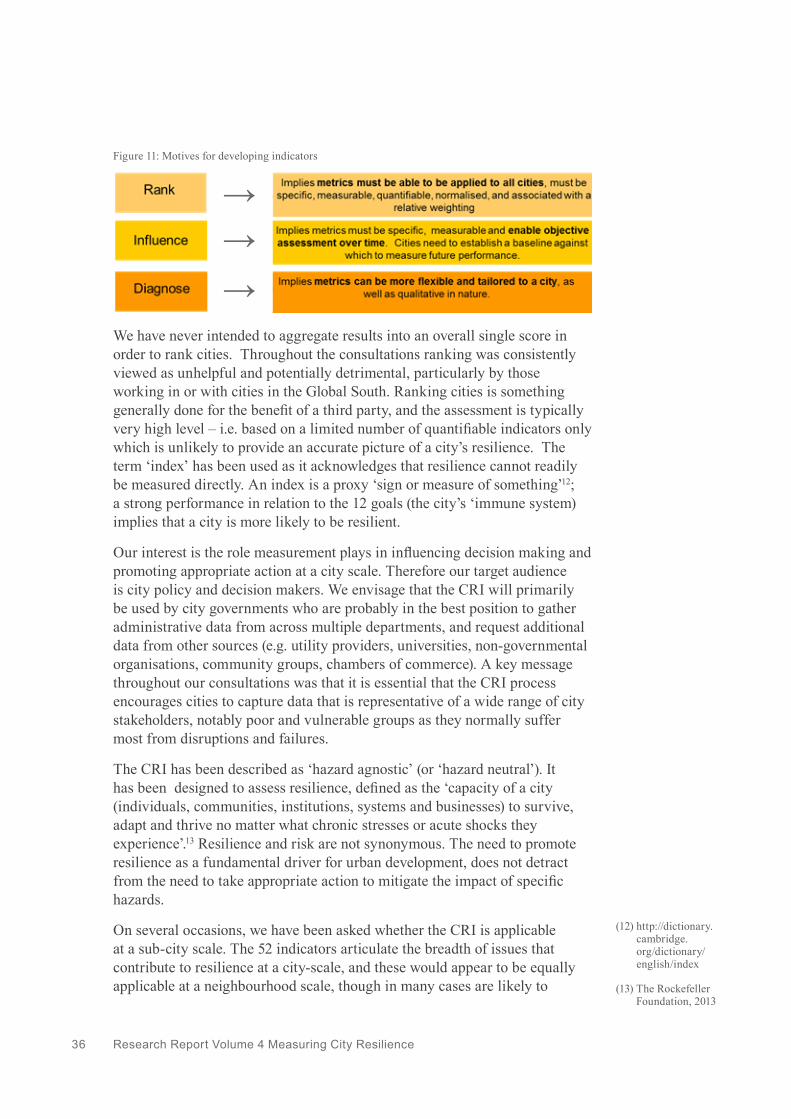
We have never intended to aggregate results into an overall single score in order to rank cities. Throughout the consultations ranking was consistently viewed as unhelpful and potentially detrimental, particularly by those working in or with cities in the Global South. Ranking cities is something generally done for the benefit of a third party, and the assessment is typically very high level – i.e. based on a limited number of quantifiable indicators only which is unlikely to provide an accurate picture of a city’s resilience. The term ‘index’ has been used as it acknowledges that resilience cannot readily be measured directly. An index is a proxy ‘sign or measure of something’12; a strong performance in relation to the 12 goals (the city’s ‘immune system) implies that a city is more likely to be resilient.
Our interest is the role measurement plays in influencing decision making and promoting appropriate action at a city scale. Therefore our target audience is city policy and decision makers. We envisage that the CRI will primarily be used by city governments who are probably in the best position to gather administrative data from across multiple departments, and request additional data from other sources (e.g. utility providers, universities, non-governmental organisations, community groups, chambers of commerce). A key message throughout our consultations was that it is essential that the CRI process encourages cities to capture data that is representative of a wide range of city stakeholders, notably poor and vulnerable groups as they normally suffer most from disruptions and failures.
The CRI has been described as ‘hazard agnostic’ (or ‘hazard neutral’). It has been designed to assess resilience, defined as the ‘capacity of a city (individuals, communities, institutions, systems and businesses) to survive, adapt and thrive no matter what chronic stresses or acute shocks they experience’.13 Resilience and risk are not synonymous. The need to promote resilience as a fundamental driver for urban development, does not detract from the need to take appropriate action to mitigate the impact of specific hazards.
On several occasions, we have been asked whether the CRI is applicable at a sub-city scale. The 52 indicators articulate the breadth of issues that contribute to resilience at a city-scale, and these would appear to be equally applicable at a neighbourhood scale, though in many cases are likely to
Figure 11: Motives for developing indicators
(12) http://dictionary.cambridge.org/dictionary/english/index
(13) The Rockefeller Foundation, 2013
→→→
The Rockefeller Foundation | Arup 37
depend on appropriate action being taken at a city-scale rather that at neighbourhood level. The scenarios and metrics that are based on city data, and alternative scenarios and metrics may be more applicable at a neighbourhood scale. We have also been asked if the CRI can be used to assess the contribution of projects and programmes to a city’s resilience. An assessment could be made with respect to particular indicators. However, it might not have a measureable impact in terms of city-level scenarios and metrics unless the project or programme is sufficiently large.
Credibility A key driver throughout has been to ensure the CRI provides both a comprehensive and credible basis of assessment which cities can confidentially use to inform urban development plans and future investment. It has been based on substantial evidence of what contributes to a city’s resilience, and informed what constitutes best practice in urban measurement.
Evidence based
The City Resilience Framework provides a robust theoretical framework on which to base and assessment. It is the result of extensive research that included literature review, 14 city case studies and primary data from 6 cities globally14 which focussed on identifying the multitude of factors that contribute to a city’s ability to be able to function in the event of an extreme event or chronic stresses. The resulting 12 goals and 52 indicators provide a comprehensive picture of resilience based on evidence of what matters. In this respect the CRI appears to be unique. The theoretical (or conceptual) origins of other frameworks and tools we reviewed was not always readily apparent, but most appear to be based solely on secondary data, adapting existing asset-based frameworks, or what cities currently measure.
The CRI assesses the qualities of resilience: inclusiveness, integration, reflectiveness, resourcefulness, robustness, redundancy, and flexibility – see Appendix G1. These feature consistently in literature on resilient systems and appear in a number of other resilience frameworks (ISET: 2014, World Bank: 2015). Empirical evidence suggests that these qualities (or characteristics) help to prevent breakdown or failure, in the same way that other qualities, such as efficiency or competitiveness, are associated with sustainability or economic performance. The premise is that a complex system with components (assets, networks, practices) that exhibit these qualities is more likely to be resilient.
The qualities have guided our thinking about what we might specifically want to observe and measure. The descriptions of the indicators, prompt questions and best/worst case scenarios interpret these qualities in the context of the variety of issues the CRI embraces. For instance, robust and inclusive housing translates as safe and affordable housing. Our research suggests that some
(14) Arup (2014) City Resilience Index Research Report Volume 1: Desk Study; Arup (2014) City Resilience Index Research Report Volume 2: Fieldwork Data Analysis
Research Report Volume 4 Measuring City Resilience 38
(15) Arup (2014), City Resilience Index Research Report Volume 3: Urban Measurement Report, p. 13 .
qualities (integrated, inclusive) should be promoted across all city systems, whilst others are more important in some systems than others. The tables in Appendix G2 illustrates the relevance of each quality to each CRI indicator.
Best practice
As resilience relates to the ability of complex systems to recover and adapt to shocks and stresses. It cannot be measured directly, until after a shock occurs or stresses accumulate and reach a tipping point. Lagging indicators in this context would reveal something about the ability of the city to cope, and can be useful to better understand how the recovery process unfolds, in order to inform post-disaster recovery plans. But, they would not necessarily provide an indication of future performance, even in similar circumstances. Instead, future resilience has to be determined based on present-day proxy indicators. A strong performance in relation to any or all of the 52 indicators in the CRI increases the likelihood of the city being resilient.
Where the city is, and where a city is going, are not necessarily correlated, and are often better measured using different types of data. Hence, the Urban Measurement Report highlighted the need to include a mix of leading (process) and lagging (outcome) variables.15 Lagging variables provide a useful measure of the current state of performance (E.g. based on current practices or behaviours), but provide no indication of the future trajectory (E.g. resulting from policy, knowledge or culture). Leading variables measure whether actions to improve resilience have been put into place. They are particularly important where there is potentially a long time period between putting the action in to place and evaluating its effectiveness (E.g. emergency response plans).
The CRI considered both leading and lagging variables which are assessed using qualitative scenarios, and quantitative metrics which are specific and measurable. These are complimentary, see Table 6. The qualitative assessment provides a valuable perspective of a city’s resilience that combines facts with stakeholder perception. This provides necessary context to the quantitative assessment which is used to monitor progress.
The advantage of quantitative metrics is that they are objective, therefore can be used to track improvements over time; and, they can also be more readily aggregated. The downside it that quantitative metrics are very specific in terms of the type of data and how it is collected. In some cities, obtaining the data needed to populate a quantitative assessment in the appropriate format may prove challenging.
A key disadvantage of qualitative assessment is its subjectivity, being dependent on the knowledge, opinions and motivations of the assessor. To some extent this has been mitigated by pre-defining best/worst case scenario, and requesting the assessor to record the rationale for a given score so that the assessment can be independently audited and repeated on the same basis in future.

The Rockefeller Foundation | Arup 39
FunctionsQuantitative
MeasurementQuantitative
Assessment
Proxy for current performance (can act as ‘red flags’) X
Track year-on-year change X
Determine if the right processes are in place for building resilience long-term (track long-term trajectories)
X
Succinctly capture the complexity associated with each indicator X
Indicate if qualities of resilient systems are in place X
Capture perceptions of risk and resilience X
Table 6: The functions of the CRI determined by a mixed-assessment
Alignment Our research on urban measurement also highlighted the importance of not ‘reinventing the wheel’; instead, to use established variables as far as possible. Also, the Rockefeller Foundation are signatories to the Medellin Collaboration on Urban Resilience (MCUR) established at the World Urban Forum in 2014. A key objective of MCUR is to foster harmonisation of the approaches and tools available to help cities assess their strengths, vulnerabilities and exposure to a multitude of natural and manmade threats in order to build their resilience.
We reviewed 45 prominent urban and/or resilience frameworks and assessment tools currently in circulation - see Volume 3, Appendix A, and Appendix A1 of this report. Those, that were considered to be most relevant are listed in Box 11 and are discussed below.
Box 11 – Other Key Urban Resilience Frameworks
• GCI, ISO, WCCD - ISO 37120 - Sustainable Development of Communities
• Grosvenor - Resilient Cities
• UN-Habitat - City Resilience Profiling Tool
• Aecom, IBM, UNISDR - Disaster Resilience Scorecard for Cities
• Cutter et al. – Disaster Resilience Indicators
• NIST - Community Resilience Planning Guide
• World Bank - City Strength

Research Report Volume 4 Measuring City Resilience 40
• The Grosvenor Resilient Cities Index – there are strong parallels with the way in which they describe resilience as being ‘the ability of cities to thrive as centre of human habitation, production and cultural development, despite the challenges posed by climate change, population growth and globalisation’.16 However, they adopt a risk based approach that ranks cities where Grosvenor have existing or planned capital investments based on: vulnerability (primarily exposure or susceptibility) to a range of pressures including climate, environmental degradation, resource shortages, infrastructure deficits, conflict and inequality; and adaptive capacity which is determined by various factors relating to governance, institutions, technology, wealth and the propensity to plan.
• The UN-Habitat City Resilience Profiling Programme also adopts a risk-based approach based on multiple hazards, and consideration of vulnerability and capacity. Like the CRI, it is targeted at local governments, and intended to inform the development and implementation of Resilience Action Plans.
• The ISO 37210 created by GCIF and ISO and managed by WCCD provides a comprehensive basis for cities to consistently measure their performance based on 100 indicators which are primarily focussed on of city services and quality of life (GCIF, 2008). WCCD refer to the standard as helping to create ‘smart, sustainable, resilient and prosperous cities’17, but measuring resilience is not the primary objective and a further standard focussing specifically on this is being considered.
• The Disaster Resilience Scorecard for Cities developed by Aecom-IBM focusses specifically on the ability of city to minimise the impact of extreme events, primarily natural hazards. It is based on the UNISDR Making Cities Resilient 10 Essentials, and identifies 82 qualitative scenario questions.
• The Disaster Resilience Indicators (Cutter et al.) considers the capacity of counties to manage both shocks and stresses base their assessment on 36 quantitative measurements across five different categories (referred to as term sub-indices) which are aggregated into a final resilience index score. This is used to rank counties in the US. In terms of content, the framework shares similarities with the CRI in the respect that it also measures less tangible social aspects of resilience through its ‘Community Capital’ sub-index.
• The NIST (also the World Bank) have developed methodological processes to enable users to assess resilience, but do not specifically provide the indicators required for measurement. The NIST framework is primarily a guidance document and planning tool for US cities, rather than an assessment process.
• The World Bank’s City Strength is to identify and prioritise investments that contribute to a city’s resilience. It is designed to be carried out by a multi-disciplinary team of World Bank sector experts. The City Resilience
(16) http://www.grosvenor.com/news-views-research/research/2014/resilient%20cities%20research%20report/.
(17) GCIF, 2008

The Rockefeller Foundation | Arup 41
Breadth of assessment is set - all 12 Goals and 52 Indicators are important
Depth of analysis is inversely related to usability
Framework is used towards the end of the process, to provide a holistic perspective of the city’s resilience based on the sectoral assessments.
There is no other framework or tool that focusses specifically on assessing the capacity of cities to withstand multiple shocks and stresses in order to enable decisions that ensure that cities are resilient. Nevertheless, there was considerable overlap in terms of indicators, variables and/or metrics used in these 7 frameworks, and those proposed for the CRI. For example, ‘Comprehensive government emergency management’ is covered within the UNISDR Scorecard; and many of the metrics that CRI measures are covered in ISO 37120 even though this has a much broader focus. Approximately one third of the 156 metrics in the CRI are used in one or more of these frameworks.
Managing Complexity Addressing complexity whilst ensuring usability are two competing requirements which have required a constant trade-off as the basis of assessment has been developed. A very large number of metrics (more than 450) would be required to fully measure the breadth of issues addressed by the 52 indicators.
For example, ‘Effectively managed and protective ecosystems’ (one of four indicators which contributes to Goal 7) depends on whether the city has identified critical ecosystems, and whether there are appropriate policies and management plans in place to ensure they are valued and protected. There a numerous variables and/or metrics that might be used to measure this fully including: percentage of natural areas within the city that have undergone ecological evaluation for their protective services; percentage green space increase or decrease; and, percentage of city area that is officially recognised for environmental protection, including shorelines down to mean low-tide mark.
But, the depth of a performance assessment is also a key consideration and constraint for cities. Undertaking a large scale, in depth assessment of performance may yield highly valuable information, but also consumes a significant amount of time and resources therefore detracts from its usability as illustrated in Figure 12 below.
Figure 12: Key Measurement Considerations
Usability
Depth of Analysis
Research Report Volume 4 Measuring City Resilience 42
It has been necessary to adopt a pragmatic approach which have also had to strike a balance between the breadth of issues contributing to resilience and the depth of analysis. This approach is consistent with other well-established frameworks of urban measurement (e.g. ISO31720, Siemen’s Green City Index), although lacks the granularity of many excellent sectoral assessment frameworks which provide an in depth assessment of a specific issue. The UN Rule of Law framework for measuring performance of criminal justice systems has 50 metrics that would map to just one of the 52 indicators in the CRI.
A review of measurement of other complex issues such as sustainability, and feedback from cities suggested that ~150 data points was manageable. Since the CRI is based on 12 goals and 52 indicators, we targeted a range of 135-165 (150 plus/minus 10%) data points; on average three per indicator. This may reduce in future following statistical analysis of real evidence from multiple cities to understand unintentional correlations and overlaps.
For comparison, ASPIRE (a sustainability assessment tool for infrastructure projects developed by Arup and Engineers Against Poverty) uses 96 data points. ‘From Transparency to Performance: Industry-Based Sustainability Reporting on Key Issues’ (Lydenberg, Rogers & Wood: 2010) identifies a ‘universe of sustainability’ with 156 potential data points, grouped within 6 business sectors and filtered based on whether they relate to general (social and environmental) performance, or whether they specifically concern innovation and seizing opportunities. The C40 CAM report (version 3.0) includes a total of 268 mandatory questions and 525 optional questions. This is possible only in the context of a facilitated, mandatory process that is externally supported.
ConsistencyFrom a technical perspective, our work to date covers the definition of a ‘theoretical framework’ (goals and indicators) and ‘data selection’ (definition of variables). Within this well-defined scope, we have addressed consistency in four ways:
• Completeness – ensuring both qualitative scenarios and the metrics unpack the full intent of the indicator within the rules set for the index;
• Directionality and voice – ensuring goals and indicators had a consistent voice aiming at defining what resilience means in practice (as opposed to what isn’t resilience, or what a green, sustainable, eco, or smart city is);
• Use of qualifiers – ensuring the correct use of qualities of resilient systems, recognising that not all qualities are applicable to all systems; and
• Scale - maintaining a consistent focus on the city scale (as opposed to community or country scale). Notwithstanding the possibility that in some
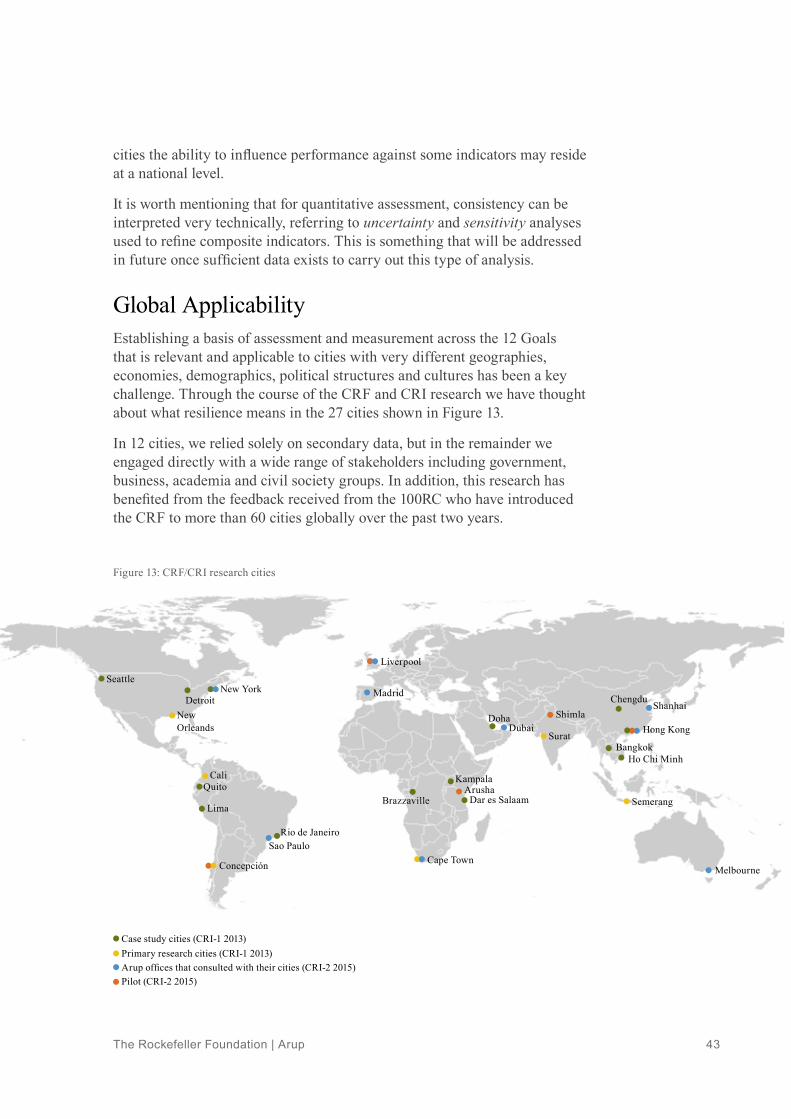
The Rockefeller Foundation | Arup 43
cities the ability to influence performance against some indicators may reside at a national level.
It is worth mentioning that for quantitative assessment, consistency can be interpreted very technically, referring to uncertainty and sensitivity analyses used to refine composite indicators. This is something that will be addressed in future once sufficient data exists to carry out this type of analysis.
Global ApplicabilityEstablishing a basis of assessment and measurement across the 12 Goals that is relevant and applicable to cities with very different geographies, economies, demographics, political structures and cultures has been a key challenge. Through the course of the CRF and CRI research we have thought about what resilience means in the 27 cities shown in Figure 13.
In 12 cities, we relied solely on secondary data, but in the remainder we engaged directly with a wide range of stakeholders including government, business, academia and civil society groups. In addition, this research has benefited from the feedback received from the 100RC who have introduced the CRF to more than 60 cities globally over the past two years.
Figure 13: CRF/CRI research cities
Seattle
DetroitNew Orleands
CaliQuito
Lima
Rio de JaneiroSao Paulo
Concepción
Liverpool
Madrid
BrazzavilleArusha
Dar es Salaam
Kampala
Cape Town
DohaDubai
Shimla
Surat
ShanhaiChengdu
Hong Kong
BangkokHo Chi Minh
Semerang
Melbourne
New York
Case study cities (CRI-1 2013)Primary research cities (CRI-1 2013)Arup offices that consulted with their cities (CRI-2 2015)Pilot (CRI-2 2015)
Research Report Volume 4 Measuring City Resilience 44
Feedback from technical specialists and ‘salon’ participants emphasised the importance of ensuring neutrality, by focussing on outcomes rather than actions. The 52 indicators represent outcomes that can be achieved in a variety of ways, likewise the scenarios are generic rather than specific. We have also endeavoured to employ commonly used variables and metrics favouring those used in internationally recognised frameworks.
We were reminded in the New York salon that ‘care needs to be taken over every word’ so that the indicators are interpreted consistently The nine cities consulted in our city engagement suggested giving further consideration to the relevance of particular indicators and variables in light of different political, economic, cultural structures, which we have done. In some cases the terminology used to describe qualitative best/worst case scenarios was perceived as too ‘Western’– notably in China and the Middle East. Elsewhere, indicators and variables were considered politically sensitive.
Cities suggested allowing them to modify the CRI to accommodate city priorities and perceived relevance of the indicators to the city. However in our consultation with peers, we heard that there is value in creating an index that is globally applicable, which essentially adopts a position on how a notion (or intellectual construct such as resilience) needs to be put into practice. This is reinforced through reference points or thresholds that enable an emerging consensus globally on good or bad performance.
Nevertheless, allowing a degree of flexibility and accepting that not all cities will want to/or be able to measure everything has been an important consideration. Within a national context, there is potential to tailor the qualitative scenarios, select quantitative metrics and propose consistent sources of data that directly align with local reporting requirements. This could be readily achieved by providing national guidelines on the implementation of the CRI, as with national application of Eurocodes (European Building Standards). Whilst, we would encourage cities to carry out a comprehensive assessment based on all 52 indicators initially, subsequent monitoring of performance might focus on a specific goals, or indicators that are considered priorities.
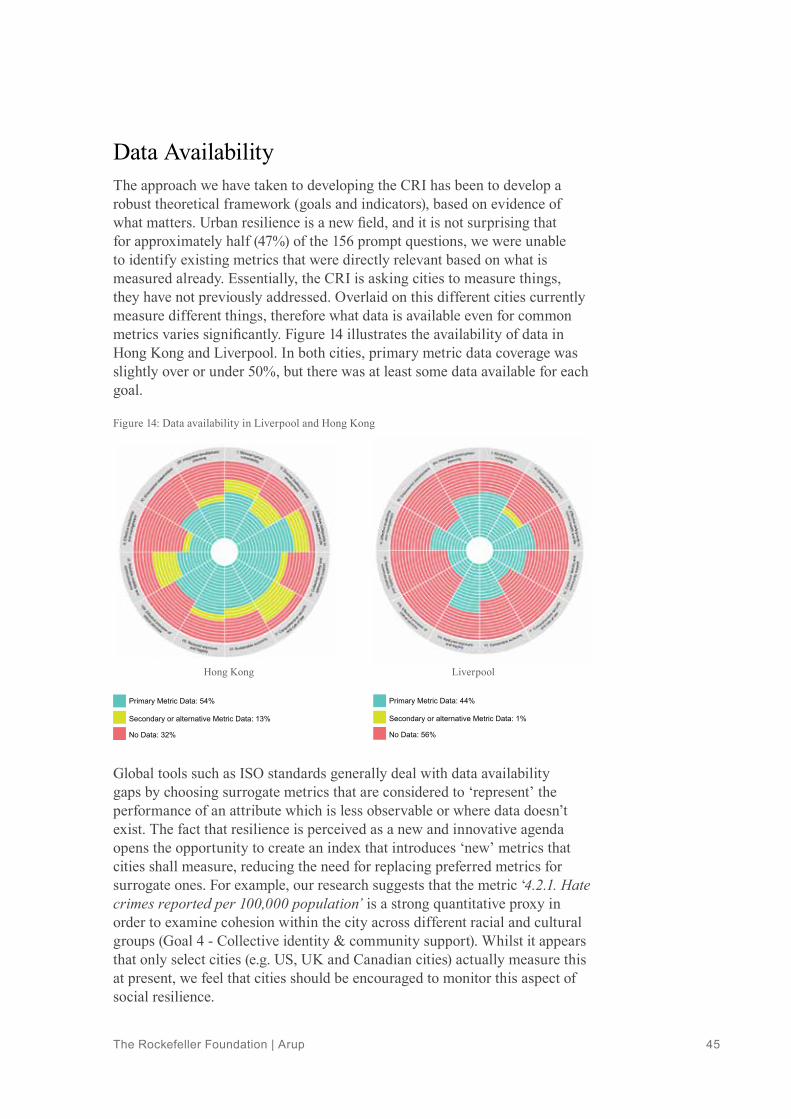
The Rockefeller Foundation | Arup 45
Data AvailabilityThe approach we have taken to developing the CRI has been to develop a robust theoretical framework (goals and indicators), based on evidence of what matters. Urban resilience is a new field, and it is not surprising that for approximately half (47%) of the 156 prompt questions, we were unable to identify existing metrics that were directly relevant based on what is measured already. Essentially, the CRI is asking cities to measure things, they have not previously addressed. Overlaid on this different cities currently measure different things, therefore what data is available even for common metrics varies significantly. Figure 14 illustrates the availability of data in Hong Kong and Liverpool. In both cities, primary metric data coverage was slightly over or under 50%, but there was at least some data available for each goal.
Global tools such as ISO standards generally deal with data availability gaps by choosing surrogate metrics that are considered to ‘represent’ the performance of an attribute which is less observable or where data doesn’t exist. The fact that resilience is perceived as a new and innovative agenda opens the opportunity to create an index that introduces ‘new’ metrics that cities shall measure, reducing the need for replacing preferred metrics for surrogate ones. For example, our research suggests that the metric ‘4.2.1. Hate crimes reported per 100,000 population’ is a strong quantitative proxy in order to examine cohesion within the city across different racial and cultural groups (Goal 4 - Collective identity & community support). Whilst it appears that only select cities (e.g. US, UK and Canadian cities) actually measure this at present, we feel that cities should be encouraged to monitor this aspect of social resilience.
Figure 14: Data availability in Liverpool and Hong Kong
Hong Kong Liverpool
Primary Metric Data: 44%
Secondary or alternative Metric Data: 1%
No Data: 56%
Primary Metric Data: 54%
Secondary or alternative Metric Data: 13%
No Data: 32%
Research Report Volume 4 Measuring City Resilience 46
UsabilityThe need to strike a balance between complexity and usability has been discussed previously (see section 3.4). A further consideration has been resolving a systems based approach to resilience with the siloed sectoral approach to urban planning and governance that exists in most cities.
The premise that underpins the CRI is that integrated, inclusive planning is essential, therefore a city-scale assessment needs to consider the dependencies and interdependencies between different sectors. Hence, the CRI is based on measuring performance against 12 goals. Each describes an outcome at the city scale, which is the result of a variety of activity across different sectors. The data required for an assessment, and also action or investment to build resilience as a result of an assessment, is likely to be sectoral. We have therefore designed the assessment methodology so that the 52 indicators can be categorised under 24 topics, which better reflect how a city operates in practice. See Table 7.
The CRI will be available via a web-based platform incorporating a user-centric interface that facilitates data collection. The outputs have been designed to communicate different levels of information appropriate for different audiences, or different levels of expertise (see 3.1). These include:
• Resilience Profiles: A circular graphic image based on the CRF which provides a visually aggregation of the overall performance of the city for each of the 12 key goals. This output can be interpreted at dimension level (i.e. is the city preforming differently across the four dimensions?) as well as providing a comparative analysis of the 12 goals, highlighting those with particularly good or poor performance.
• Resilience Dashboard: This summarises the relative performance of each of the 52 indicators, highlighting their performance in relation to the overall performance for its particular goal. These enable more detailed interrogation of the information shown in the Profiles.
• Database: This will be particularly helpful for performance managers and technical staff who are interested in accessing the data gathered throughout the CRI process.
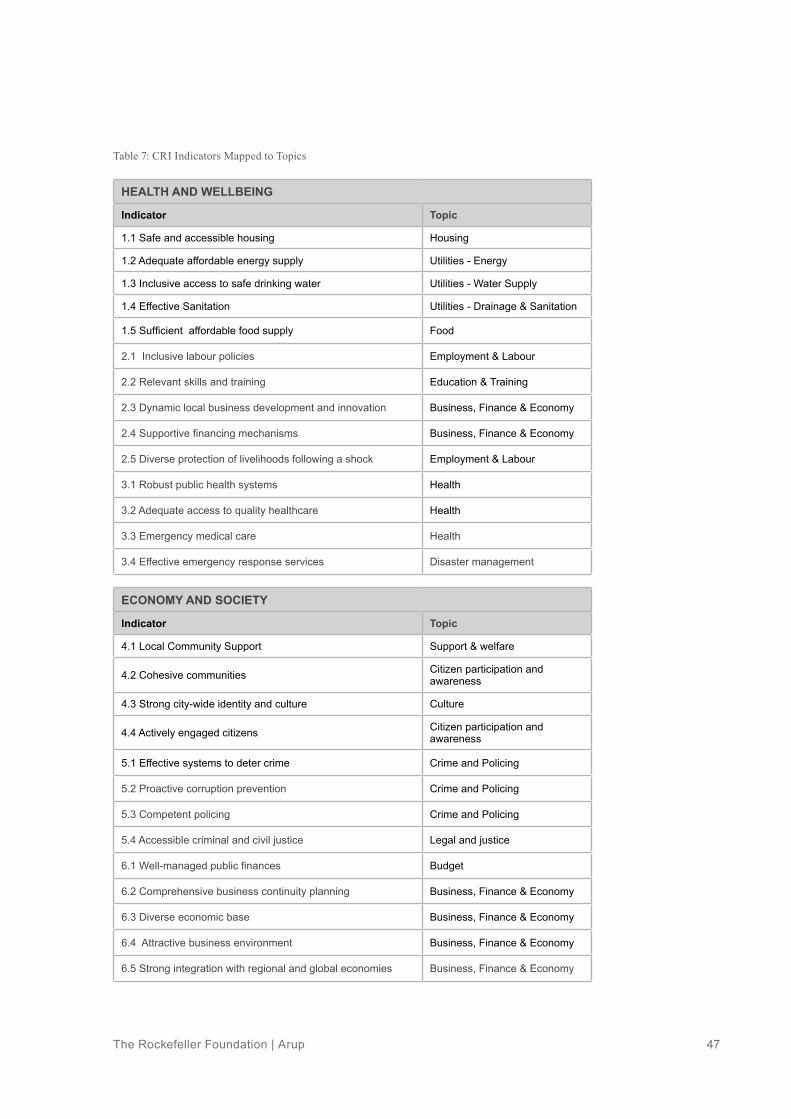
The Rockefeller Foundation | Arup 47
HEALTH AND WELLBEING
Indicator Topic
1.1 Safe and accessible housing Housing
1.2 Adequate affordable energy supply Utilities - Energy
1.3 Inclusive access to safe drinking water Utilities - Water Supply
1.4 Effective Sanitation Utilities - Drainage & Sanitation
1.5 Sufficient affordable food supply Food
2.1 Inclusive labour policies Employment & Labour
2.2 Relevant skills and training Education & Training
2.3 Dynamic local business development and innovation Business, Finance & Economy
2.4 Supportive financing mechanisms Business, Finance & Economy
2.5 Diverse protection of livelihoods following a shock Employment & Labour
3.1 Robust public health systems Health
3.2 Adequate access to quality healthcare Health
3.3 Emergency medical care Health
3.4 Effective emergency response services Disaster management
ECONOMY AND SOCIETY
Indicator Topic
4.1 Local Community Support Support & welfare
4.2 Cohesive communities Citizen participation and awareness
4.3 Strong city-wide identity and culture Culture
4.4 Actively engaged citizens Citizen participation and awareness
5.1 Effective systems to deter crime Crime and Policing
5.2 Proactive corruption prevention Crime and Policing
5.3 Competent policing Crime and Policing
5.4 Accessible criminal and civil justice Legal and justice
6.1 Well-managed public finances Budget
6.2 Comprehensive business continuity planning Business, Finance & Economy
6.3 Diverse economic base Business, Finance & Economy
6.4 Attractive business environment Business, Finance & Economy
6.5 Strong integration with regional and global economies Business, Finance & Economy
Table 7: CRI Indicators Mapped to Topics
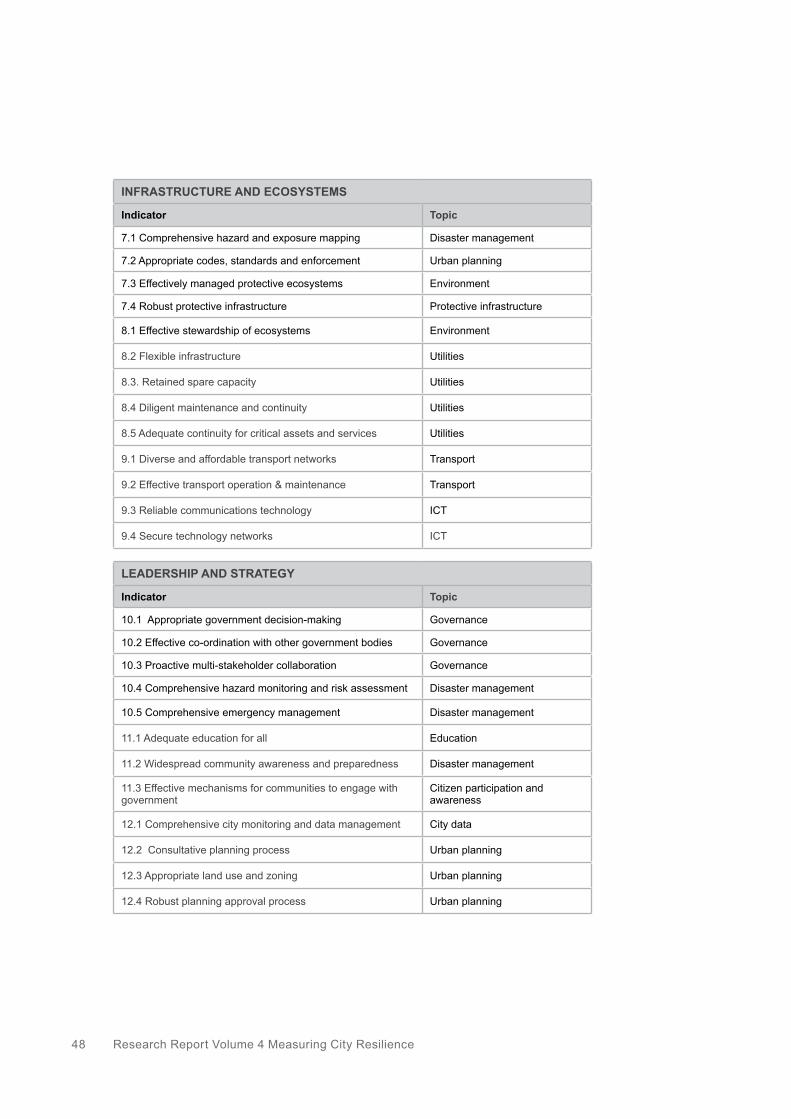
Research Report Volume 4 Measuring City Resilience 48
INFRASTRUCTURE AND ECOSYSTEMS
Indicator Topic
7.1 Comprehensive hazard and exposure mapping Disaster management
7.2 Appropriate codes, standards and enforcement Urban planning
7.3 Effectively managed protective ecosystems Environment
7.4 Robust protective infrastructure Protective infrastructure
8.1 Effective stewardship of ecosystems Environment
8.2 Flexible infrastructure Utilities
8.3. Retained spare capacity Utilities
8.4 Diligent maintenance and continuity Utilities
8.5 Adequate continuity for critical assets and services Utilities
9.1 Diverse and affordable transport networks Transport
9.2 Effective transport operation & maintenance Transport
9.3 Reliable communications technology ICT
9.4 Secure technology networks ICT
LEADERSHIP AND STRATEGY
Indicator Topic
10.1 Appropriate government decision-making Governance
10.2 Effective co-ordination with other government bodies Governance
10.3 Proactive multi-stakeholder collaboration Governance
10.4 Comprehensive hazard monitoring and risk assessment Disaster management
10.5 Comprehensive emergency management Disaster management
11.1 Adequate education for all Education
11.2 Widespread community awareness and preparedness Disaster management
11.3 Effective mechanisms for communities to engage with government
Citizen participation and awareness
12.1 Comprehensive city monitoring and data management City data
12.2 Consultative planning process Urban planning
12.3 Appropriate land use and zoning Urban planning
12.4 Robust planning approval process Urban planning

The Rockefeller Foundation | Arup 49
Conclusions
City Resilience Index The City Resilience Index provides a comprehensive and technically robust basis for measuring city resilience that is globally applicable. It comprises 52 resilience indicators which are assessed through 156 questions, drawing upon both qualitative and quantitative data – see Figure 15 below. Responses to these questions are aggregated and presented graphically in relation to the 12 goals in the City Resilience Framework.
Figure 15: The basis of the City Resilience Index
Qualitative 156 Scenarios
The Assessor assigns a score on a linear scale between 1 and 5, based upon
consideration of a 'best case' and 'worst case' scenario relevant to a particular area
of city performance.
Quantitative 156 Metrics
The Assessor provides relevant city data in a specific unit as a proxy measure of
reilience. A score from 1 to 5 is then automated, based on a standardised
performance scale.
What mattersCity resilience outcomes are understood at Goal and Dimension level
What to observePerformance is observed at Indicator level
How to measurePrompt Questions provide a proxy measurement of city resilience
4 Dimensions
12 Goals
(3 per Dimension)
52 Indicators(3-5 per Goal)
156 Prompt Questions
(1-7 per Indicator, distributed within Questionnaires)
Research Report Volume 4 Measuring City Resilience 50
Uniquely, the CRI is based on a significant body of research that is firmly grounded in the experiences of cities, and evidence of what contributes to their ability to survive and thrive whatever disruption they have faced, or anticipate. It embraces the wide array of issues and complexity inherent in measuring resilience at a city scale, and considerable thought has been given to developing a basis of assessment that is both comprehensive and manageable.
Measuring resilience means different things to different people based on whether their motivations are intellectual, practical or financial. The CRI is practical. It has been designed for cities to use, rather than to help external investors assess investment risk or project opportunity, or rank cities based on an aggregated resilience score. It is intended to help cities understand and assess their capacities and deficiencies, hence their overall ability to withstand and adapt to potential shocks and stresses. In addition, a common basis of assessment should facilitate peer-to-peer knowledge exchange between cities. Some cities may find it helps to benchmark their performance against their peers, and in future it may be possible to compare cities as data becomes more available and more standardised.
Reflecting on the substantial body of knowledge and outputs generated to date, we realise the CRI might be considered as toolkit which comprises:
• City Resilience Framework – a means to understand city resilience; 4 dimensions, 12 goals
• City Resilience Indicators – 52 indicators which incorporate the ‘qualities’ and tell us how city resilience can be observed.
• City Resilience Assessment – combining a qualitative and quantitative assessment that enables cities to assess their strengths/weaknesses, also baseline and monitor their resilience over time,
• City Resilience Database – the data collected from multiple cities that can be analysed to refine the toolkit, and create greater understanding of resilience.
Next Steps To date the Index has been tested in five cities: Shimla, India; Concepción, Chile; Arusha, Tanzania; Hong Kong, and Liverpool, UK. This is documented in Research Report Volume 5: Lessons from the Pilots.
The City Resilience Index will be available as a beta-version interactive online assessment tool at www.cityresilienceindex.org in 2016. This will be further refined based on data collected and lessons learned from early adopters (or first movers).

The Rockefeller Foundation | Arup 51
Aecom, IBM, UNISDR, 2014, Disaster Resilience Scorecard for Cities, UNISDR, Geneva
Brookings, 2014, Global Metro Monitor, Brookings, Washington
Bureau of Labor Statistics, 2014, EMTs and Paramedics, [online] Available at: <http://www.bls.gov/ooh/Healthcare/EMTs-and-paramedics.htm> [Accessed November, 2015]
Bureau of Labor Statistics, 2015, Employment Situation Summary, [online] Available at:<http://www.bls.gov/news.release/empsit.nr0.htm> [Accessed November, 2015]
Centre for Cities, 2015, Cities Outlook, Centre for Cities, London
Centre for Disease Control (CDC) (US Government), Health Indicators Warehouse, 2008, 2010, 2013, [online] Available at: <http://www.healthindicators.gov/indicators/Selection> [Accessed June 2015]
Climate Investment Funds (CIF), 2012, PPCR Results Framework
Commission on Crime Prevention and Criminal Justice, 2002, Reform of the criminal justice system [online] Available at: <http://www.unodc.org/pdf/crime/commissions/11comm/3e.pdf> [Accessed May 2015]
CUNY, 2015 – Expert Feedback – Colombia University, New York
Cutter, S.L., Burton, C.G. and Emrich C.T, 2010, ‘Disaster Resilience Indicators for Benchmarking Baseline Conditions’. Available at http://www.bepress.com/jhsem/vol7/iss1/51
EU, Eurostat, 2015, Lifelong learning statistics, [online] Available at: <http://ec.europa.eu/eurostat/statistics-explained/index.php/Lifelong_learning_statistics> [Accessed July 2015]
Federal Bureau of Investigation (FBI), 2013, Hate Crime Statistics, [online] Available at https://www.fbi.gov/about-us/cjis/ucr/hate-crime/2013 [Accessed September, 2015]
Friesen - Expert Feedback – Milton Friesen, Program Director, Social Cities, Cardus
GEF, 2014, Climate Change Mitigation Results Framework (CCMRF)
References

Research Report Volume 4 Measuring City Resilience 52
GHI – Global Housing Indicators, 2011, Habitat for Humanity [online] Available at: <http://globalhousingindicators.org/> [Accessed September 2014]
GNO - Expert Feedback, Greater New Orleans
Green Climate Fund, 2014, Investment Framework, GCF, Songdo, South Korea
IAEA/IEA/UNDESA - International Atomic Energy Agency, International Energy Agency, United Nations Department of Economic and Social Affairs, 2005, Energy Indicators for Sustainable Development: Guidelines and Methodologies, http://www-pub.iaea.org/MTCD/publications/PDF/Pub1222_web.pdf [Accessed September 2014]
IAEA/IEA/UNDESA - International Atomic Energy Agency, International Energy Agency, United Nations Department of Economic and Social Affairs, 2005, Energy Indicators for Sustainable Development: Guidelines and Methodologies, IAEA, Vienna, Austria
ILO, 2012, Statistical update on employment in the informal economy [online] Available at: http://laborsta.ilo.org/applv8/data/INFORMAL_ECONOMY/2012-06-Statistical%20update%20-%20v2.pdf [Accessed October, 2014]
ILO, Small change, Big changes: Women and Microfinance, [online] Available at: <http://www.ilo.org/wcmsp5/groups/public/@dgreports/@gender/documents/meetingdocument/wcms_091581.pdf> [Accessed July 2015]
Indicators Registry, 2015, Humanitarian Response, UN OCHA [online] Available at: <http://www.humanitarianresponse.info/en/applications/ir/indicators/ind-key/1?search=&page=4> [Accessed June, 2015]
Institute For Sustainable Infrastructure, Envision Sustainable Infrastructure Rating System [online] Available at: <http://sustainableinfrastructure.org/rating/index.cfm> [Accessed May 2015]
ISET, 2014, Developing Indicators of Urban Climate Resilience, ISET, Colorado
ISO 37120, 2014. Sustainable development of communities: Indicators for city services & quality of life, ISO, Geneva
Kitchin. R, Lauriault. T and McArdle. G, 2015, Knowing and governing cities through urban indicators, city benchmarking and real-time dashboards, Regional Studies, Regional Science, 2:1, 6-28, DOI: 10.1080/21681376.2014.983149

The Rockefeller Foundation | Arup 53
KPMG, 2010, City Typology as a Basis for Policy [online] Available at: <http://www.kpmg.com/BE/en/IssuesAndInsights/ArticlesPublications/Documents/City-typology-as-the-basis-for-policy.pdf> [Accessed Jan 2015]
Kruk - Expert Feedback, Margaret Kruk, Associate Professor of Global Health, Harvard
LCC Policy – Expert Feedback, Liverpool City Council Policy Department
Lewis C. G. 2003, How Effective is Criminal Justice, Helsinki conference of the European Society of Criminology [online] Available at <http://www.esc-eurocrim.org/files/how_effective_is_criminal_justice.doc> [Accessed May 2015]
Lydenberg. S, Rogers. J & Wood. D, 2010, From Transparency to Performance, Harvard, Cambridge
Mckinsey, 2012, Urban world: Mapping the economic power of cities [online] Available at: <http://www.mckinsey.com/insights/urbanization/urban_world> [Accessed August 2015]
MOPAC - London Mayor's Office for Policing and Crime, 2015, Police and Crime Data & Information, [online] Available at: <https://www.london.gov.uk/priorities/policing-crime/data-information> [Accessed May 2015]
National Audit Office, Ministry of Justice, 2015, Comparing International Criminal Justice Systems [online] Available at: http://www.nao.org.uk/wp-content/uploads/2012/03/NAO_Briefing_Comparing_International_Criminal_Justice.pdf [Accessed May, 2015]
Notre Dame University, ND-GAIN Country Index [online] Available at: http://index.gain.org/ [Accessed November, 2014]
OECD – Better Life Index [online] Available at <http://www.oecdbetterlifeindex.org/> [Accessed October 2014]
OECD – Better Life Index [online] Available at <http://www.oecdbetterlifeindex.org/> [Accessed September 2014]
OECD, 2014, Guidelines for resilience systems analysis, OECD Publishing
OECD, Library, Statistics [online] Available at: <http://www.oecd-ilibrary.org/statistics> [Accessed June, 2015]
OECD, 2013, What makes civil justice effective?, Economics Department Policy Note No. 18
OFGEM, 2014, Electricity Capacity Assessment, OFGEM, London
PWC, Cities of Opportunity, 2014 [online] Available at: <http://www.pwc.com/us/en/cities-of-opportunity> [Accessed August, 2015]
Research Report Volume 4 Measuring City Resilience 54
Rodin, J., 2014. The Resilience Dividend. United States of America: Public Affairs.
Tomer, A. (Brookings) 2012 - Where the Jobs Are: Employer Access to Labor by Transit, Brookings, Washington
Transparency International, 2015, Corruption Perceptions Index [online] Available at: http://www.transparency.org/research/cpi/overview [Accessed April, 2015]
UK Office for National Statistics (ONS), 2012, Measuring National Well-being, Where we Live [online] Available at: <http://www.ons.gov.uk/ons/dcp171766_270690.pdf> [Accessed June 2015]
UN-Habitat – Human Settlement Index
UNICEF, 2013, Statistics [online] Available at: http://www.unicef.org/statistics/ [Accessed August, 2015]
UNISDR, 2008, Indicators of Progress [online] Available at: <http://www.preventionweb.net/files/2259_IndicatorsofProgressHFA.pdf> [Accessed October 2014]
United Nations (Department of Peacekeeping Operations), 2011, Rule of Law Indicators [online] Available at: <http://www.un.org/en/events/peacekeepersday/2011/publications/un_rule_of_law_indicators.pdf> [Accessed May 2015]
United Nations Centre for Human Settlements and the World Bank, 1996, Indicators Programme Monitoring Human Settlements, Volumes I, II and III, Nairobi, Kenya
United Nations Office on Drugs and Crime, 2012, World Drug Report [online] Available at: <http://www.unodc.org/unodc/data-and-analysis/WDR-2012.html> [Accessed May 2015]
United Nations University, 2013, Indicators of Resilience in Socio-ecological Production Landscapes (SEPLs). UNU-IAS, Yokohama
University of Buffalo Regional Institute, 2015, [online] Available via: <http://www.oecdbetterlifeindex.org/> [Accessed September 2014]
UNSDSN Sustainable Development Goals, 2015, Indicators and a Monitoring Framework for the Sustainable Development Goals, USDN, New York
Waste Altlas [online] Available at: <http://www.atlas.d-waste.com/> [Accessed September, 2015]
World Bank Group 2014: Can Tho, Vietnam: Enhancing Urban Resilience
The Rockefeller Foundation | Arup 55
World Bank, Data, [online] Available at: <http://data.worldbank.org/> [Accessed June 2015]
World Bank, 2015, World Development Indicators [online] Available at: <http://wdi.worldbank.org/tables> [Accessed August, 2015]
World Cities Culture Forum, 2015, World Cities Culture Report 2015 [online] Available at: <http://www.worldcitiescultureforum.com> [Accessed August, 2015]
World Health Organisation (WHO), 2012, 2014, 2015, Global Health Observatory Data Repository [online] Available at: http://apps.who.int/gho/data/node.main.A897C?lang=en> [Accessed September 2015]
World Health Organisation (WHO), 2012, Health Indicators of sustainable water [online] <http://www.who.int/hia/green_economy/indicators_water.pdf> [Accessed September 2015]
World Health Organisation (WHO), 2015, Health statistics and information systems [online] Available at: http://www.who.int/healthinfo/indicators/2015/metadata/en/ [Accessed September 2015]
World Justice Project [online] Available at: www.worldjusticeproject.org [Accessed May 2015]

Research Report Volume 4 Measuring City Resilience 56
Appendix A Gap analysis
City Resilience Index

Research Report Volume 4 Measuring City Resilience 58
A1. Gap Analysis Frameworks
Introduction: Qualitative assessment process based on UNISDR Ten Essentials for Disaster Resilient Cities. Created 2011.
Purpose and Audience: The LGSAT is focused on Disaster Risk Reduction and Climate Change Adaptation. It is intended to help cities set baselines, identify gaps, plan actions and have comparable data across local governments, within the country and globally, to measure advancements over time.
Complexity: The tool is comprised of 41 subjective questions that the user rates 1-5. There is no aggregation.
Compared to CRI: City-level but more focused on DRR/shock capacities than a combined shock and stress focus.
Introduction: 2014 expansion of the UNISDR LGSAT.
Purpose and Audience: The Scorecard aims to allow cities to understand how resilient they are to natural disasters. The LGSAT and Scorecard are intended to complement each other in a two part process.
Complexity: Qualitative. 82 variables each assessed on a 0 to 5 scale. No aggregation.
Compared to CRI: The focus is on Disaster Risk Reduction. Areas such as risk mapping, monitoring, assessment and management are addressed in detail. It does not assess other stress aspects of resilience such as employment, health, security, finance, mobility and leadership.
UNISDR - Local Government Self-Assessment Tool
Aecom, UNISDR - Disaster Resilience Scorecard for Cities
The Rockefeller Foundation | Arup 59
Introduction: ISO standard indicators for cities used by the World Council for City Data and participating cities - 2015.
Purpose and Audience: Aim to establish standardised, consistent and comparable indicators for cities to measure performance management of city services and quality of life, enable comparison between cities across a wide range of measures, share best practice. Data shared through WCCD platform.
Complexity: Quantitative assessment process. All indicators are lagging/outcome indicators. There are 46 ‘Core Indicators’ and 54 ‘Supporting Indicators’. Grouped under seventeen ‘themes’ representing different sectors and services provided by the city.
Compared to CRI: ISO provides a rich selection of quantitative metrics based on what cities measure. Conversely the CRI starting point is research around ‘what contributes to urban resilience’. CRI assesses areas such as leadership, critical services and community cohesion in greater detail.
ISO 37120 - Sustainable Development of Communities
Introduction: 2015 World Bank rapid diagnostic. A two-six month resilience assessment process.
Purpose and Audience: It is a project prioritisation tool designed to help the World Bank and its target cities identify appropriate project investments.
Complexity: City Strength is not an indicator assessment. It examines a city’s resilience through qualitative analysis of the strengths and weaknesses of individual city sectors. Undertaken by World Bank experts along with city sector stakeholders.
Compared to CRI: A very different assessment methodology. Emphasis placed on shocks but some analysis of stresses too.
World Bank - City Strength
Research Report Volume 4 Measuring City Resilience 60
Introduction: University of South Carolina. Provides a methodology and set of indicators to measure the present conditions influencing resilience of USA counties. 2010.
Purpose and Audience: Academic research. Intended for policy makers and other academics. County level.
Complexity: Thirty-six quantitative metrics under five indices (Social, Economic, Institutional, Infrastructure and Community Capital). Normalises data, then aggregates to provide both five sub-index scores and one final index score.
Compared to CRI: Cutter does not have a specific urban focus - rural counties are assessed too. It only uses quantitative data and a limited number of metrics opposed to in-depth analysis (1/5 size of CRI). Both address shocks and stresses. USA opposed to international focus is evident in some of the questions asked.
Cutter et al. – Disaster Resilience Indicators
Introduction: 2014 project quantifying the resilience of what Grosvenor consider to be 50 of the most important global cities.
Purpose and Audience: To help Grosvenor (real estate firm) inform their future investment in global cities – capital allocation. The research has an urban focus.
Complexity: Model of vulnerability (including exposure) + adaptive capacity = resilience. Vulnerability and adaptive capacity are both presented as five themes. These aggregate to a score for each. Then combined to final resilience score.
Compared to CRI: Grosvenor is concerned with ranking cities based on a combination of vulnerability and adaptive capacity including exposure. CRI focuses on a city’s capacities (and ability to manage impact of shocks/stresses) opposed to inherent hazard exposure. (E.g. CRI would examine steps that a city has taken to prepare for and mitigate the impact of a hurricane but would not penalise a city for being on a hurricane track).
Grosvenor - Resilient Cities
The Rockefeller Foundation | Arup 61
Introduction: The OECD guidelines describe a process to develop a roadmap to resilience. This process is based on the DFID Sustainable Livelihoods system and involves undertaking an assessment of risks to each of the livelihood assets from shocks or stresses.
Purpose and Audience: Community level guidance to assist humanitarian field practitioners. Step-by-step guide to help users:
• prepare/facilitate, a multi-stakeholder resilience analysis workshop
• design a roadmap to boost the resilience of communities and societies
• integrate results into their development and humanitarian programming
Complexity: No indicators or metrics provided in the guidelines. However, there is information on how to select performance indicators (so communities would be using different, tailored indicators).
Compared to CRI: Different level, methodology and objective but similar shock and stress focus.
OECD Guidelines for Resilience Systems Analysis
Introduction: An index which allows you to compare well-being across countries.
Purpose and Audience: Focuses on developing statistics to capture aspects of life that matter to people and that shape the quality of their lives. National-level - covers all OECD countries as well as the Russian Federation and Brazil. The data is already provided by the OECD, (not completed by the user). Broad audience - any interested party.
Complexity: Eleven topics, each topic of well-being is measured by one to four indicators. Within each topic indicators are averaged with equal weights. Quantitative but some questions are survey-based.
Compared to CRI: The BLI operates on a different level to CRI, with a different methodology and focus but certain metrics are relevant to resilience and therefore useful.
OCED - Better Life Index (BLI)

Research Report Volume 4 Measuring City Resilience 62
Introduction: Part of UN-Habitat’s City Resilience Profiling Programme, launched in 2012 with ten Partner Cities.
Purpose and Audience: Global cities - To enable any city to assess urban resilience. More shock than stress focused.
Complexity: Multi-hazard assessment tool, combining specific hazard vulnerability, exposure and capacity.
Compared to CRI: Like Grosvenor, the CRPT includes hazard exposure analysis within its evaluation. Hazard/shock focused, opposed to a holistic resilience approach.
UN-Habitat - City Resilience Profiling Tool
Introduction: 2015 Guide produced by the US. National Institute of Standards and Technology.
Purpose and Audience: To help communities assess social and economic needs, hazard risks, and recovery. Includes performance goals for key services and infrastructure. Incorporates locally identified needs and community priorities. Focus on resilient infrastructure with a prominent recovery planning element.
Complexity: Much of the process relies on the community in question identifying their own performance goals but there are some broad indicators provided in the guide.
Compared to CRI: Different methodology, focus. Emphasis on infrastructure, US cities, recovery planning. Shock focus.
NIST - Community Resilience Planning Guide

The Rockefeller Foundation | Arup 63
Introduction: UN Food and Agricultural Organization research developing since 2008.
Purpose and Audience: Examines resilience from the perspective of food insecurity and livelihoods. The audience is UN workers and communities at Household level in food insecure countries
Complexity: Primarily quantitative with some stand-alone, complementary qualitative analysis. Index weighs the six dimensions that contribute to household resilience: Income and Food Access (IFA); Access to Basic Services (ABS); Assets (AST); Adaptive Capacity (AC); Social Safety Nets (SSN); and Sensitivity (S) to shocks.
Compared to CRI: FAO tool focuses on food insecurity and livelihoods at household level. These are key issues within communities in which FAO is using the tool (e.g. Ethiopia, Kenya, Sudan, Somalia). The CRI has a wider resilience perspective and a global, city-level focus.
FAO - Resilience Index Measurement & Analysis
Introduction: Began in 2012 as a convergence of interests of UN agencies, donors, NGOs and research institutions.
Purpose and Audience: National level for humanitarian actors. Aim: establish common evidence-base for global humanitarian risk analysis. Help identify where and why a humanitarian crisis might occur and monitor risk trends.
Complexity: Quantitative. Open platform. Creates a risk profile for each of the 191 countries it covers. Each has a risk rating based on national Hazards, Vulnerability and Coping Capacity (the resources available). 50 different indicators in total.
UN OCHA / EU - Index for Risk Management

Research Report Volume 4 Measuring City Resilience 64
Introduction: Partnership between innovation charity Nesta, technology consultancy Accenture and urban research centre Future Cities Catapult.
Purpose and Audience: Framework and diagnostic tool to help city policymakers develop initiatives which catalyse innovation and entrepreneurship in cities.
Complexity: The framework is structured around three overarching questions concerning openness, infrastructure and leadership. These attributes are investigated through how the city performs in nine policy roles. This performance is investigated through 3-5 broad questions in each role. (For example, access to high-speed internet is one sign that the city performs well in the area of connectivity.) It appears that the CITIE framework team undertake the assessment opposed to the city itself.
Compared to CRI: The CITIE framework has a very specific niche and is not a resilience framework. It also differs from the CRI in that it is an external assessment process. Should the city wish to undertake the CITIE analysis (or any other niche framework), this has the potential to complement the CRI in the respect that it analyses certain CRI goals and indicators in greater detail (than is appropriate in the broader CRI framework).
Introduction: 2015 Monitoring Framework developed by the Leadership Council of the Sustainable Development Solutions Network to accompany the United Nations’ Sustainable Development Goals.
Purpose and Audience: Intended for anyone monitoring performance (local, national, regional, global) in meeting the SDGs but there is generally a national focus on the progress that countries (and the world) are making in meeting the SDGs
Complexity: The SDSN provides 100 indicators – some quantitative metrics, others less precise variables. Based on an 18-month consultation with ~500 organisations discussing how to best measure the broad SDGs.
Compared to CRI: The SDSN has a different methodology and focus to the CRI but there is obvious crossover in the sense that both measure how essential needs of citizens are being met.
Nesta, Accenture, Catapult Future Cities – CITIE: City Initiatives for Technology, Innovation and Entrepreneurship
UNSDSN - Indicators and a Monitoring Framework for the Sustainable Development Goals
The Rockefeller Foundation | Arup 65
Targeted towards GEF practitioners and supports the GEF-6 Climate Change Mitigation Strategy. The CCMRF provides an assessment framework of programmes against the strategy goal to ‘support developing countries and economies in transition to make transformational shifts towards a low-emission, resilient development path’. The framework is based on three objectives and five Programs. They are monitored and tracked with three Core Outcomes and seven core outcome indicators. The indicators include a mix of qualitative / quantitative metrics. Outcomes and outcome indicators are shared between programs and focal area objectives.
Global Environment Facility - The Climate Change Mitigation Results Framework -
Joint collaboration between Harvard University Graduate School of Design and the Institute for Sustainable Infrastructure. Holistic framework for ‘evaluating and rating the community, environmental, and economic benefits of all types and sizes of infrastructure projects.’ Examines project approach and impact in these areas. 5 themes – Quality of Life, Resource Allocation, Leadership, Natural World and Climate and Risk. Qualitative assessment. Well-designed framework but different objective to CRI.
Envision® Sustainable Infrastructure Rating System
Research Report Volume 4 Measuring City Resilience 66
IRI propose a method to identify Key Performance Indicators on sustainability impacts of US corporations. Provides KPIs on material issues for six example subsectors as a model for minimum guidance that could be developed for all 114 Industry Classification Benchmark (ICB) sectors.
Builds broad disclosure frameworks (e.g., Global Reporting Initiative (GRI)). Is intended to be useful for (among others) regulators or stock exchanges, corporations, stakeholders, and investors. It does not define what constitutes good or bad performance for the indicators or incorporate performance scoring.
IRI - Harvard University (- From Transparency to Performance: Industry-Based Sustainability Reporting on Key Issues
ND-Gain - ‘Data-driven - to show which countries are best prepared to deal with global changes brought about by overcrowding, resource-constraints and climate disruption.’ Assessment is based on Vulnerability (including exposure, sensitivity and capacity to adapt to climate change – explored through six sectors - food, water, health, ecosystem service, human habitat, and infrastructure) + Readiness (to act/leverage investment - economic readiness, governance readiness and social readiness). Different approach and level to CRI.
Notre Dame University - Global Adaptation Index
The Rockefeller Foundation | Arup 67
UNU present 20 qualitative indicators focused on assessing the resilience of agricultural systems. Indicators are scored against a qualitative scale from 1-5, with description of each score threshold provided for every indicator. No aggregation of indicators. 20 indicators grouped under four categories:
1) Ecosystems protection, 2) agricultural biodiversity 3) knowledge, learning and innovation 4) social equity and infrastructure.
Specific agricultural focus – not that relevant.
United Nations University -IAS Policy Report: Indicators of Resilience in Socio-ecological Production Landscapes (SEPLs)
Audience = Board of Directors of the Green Climate Fund (UN Climate Change). Establishes the criteria on which the Green Climate Fund will screen projects for funding. Three Components:
1. Investment Policies
2. Investment strategy and portfolio targets
3. Investment Guidelines
No guidance on how the sub-criteria/criteria will be measured or scored. Not a v useful reference document for the CRI
Green Climate Fund - GCF Investment Framework
Research Report Volume 4 Measuring City Resilience 68
Audience = Board of Directors of the Green Technology Fund. Establishes the criteria on which the Clean Technology Fund will screen projects for funding. The overall country- level impact objective of CTF, which is measured by these outcomes, is a transformed national low carbon economy.
Not a very useful reference document for the CRI.
Clean Technology Fund - CTF Investment Framework
Other literature helped us develop specific variables and metrics later in the process. A full list of sources is recorded in the references

The Rockefeller Foundation | Arup 69
A2 Gap Analysis Goals and Indicators Goal Indicator
Minimal human vulnerability (I)
Access to safe housing (1)Water supply and sanitation (2)Energy supply (3)Food supply (4)
Diverse livelihood and employment (II)
Labour policy (1)Skills and training (2)Continuity following a shock (3)Local business development and innovation (4)Access to finance (5)
Adequate safeguards to human life and health (III)
Emergency medical resources (1)Access to healthcare (2)Public health (3)
Collective identity and mutual support (IV)
Connected communities (1)Local identity and culture (2)Community participation (3)
Social stability and security (V)
Crime deterrents (1)Anti-corruption measures (2)Policing (3)Law enforcement (4)
Vibrant economic activity (VI) orAvailability of financial resources and contingency funds (VI)
Business continuity planning (1)City budgets (2)Inward investment (3)Economic structure (4)Regional and global economic integration (5)
Reduced physical exposure and vulnerability (VII)
Safeguards for protective ecosystems (1)Safeguards for critical infrastructure (2)
Continuity of critical services (VIII)
Continuity planning (1)Resource efficiency (2)Infrastructure delivery (3)Maintenance practice (3)Ecosystem health (4)
Reliable communications and mobility (IX)
City transport networks (1)Public transport networks (2)Regional transport networks (3)Communications technology (4)Emergency information and communication (5)
Effective leadership and management (X)
Multi-stakeholder alignment (1)Government alignment (2)Government decision-making and leadership (3)Emergency planning and coordination (4)Risk monitoring (5)
Empowered stakeholders (XI)
Education (1)Community awareness and preparedness (2)Communication between government and public (3)Knowledge transfer and best practice sharing (4)
Integrated development planning (XII)
City monitoring and data management (1)Strategies and plans (2)Land use and development (3)Infrastructure and building codes and standards (4)

Appendix B Expert engagement
City Resilience Index
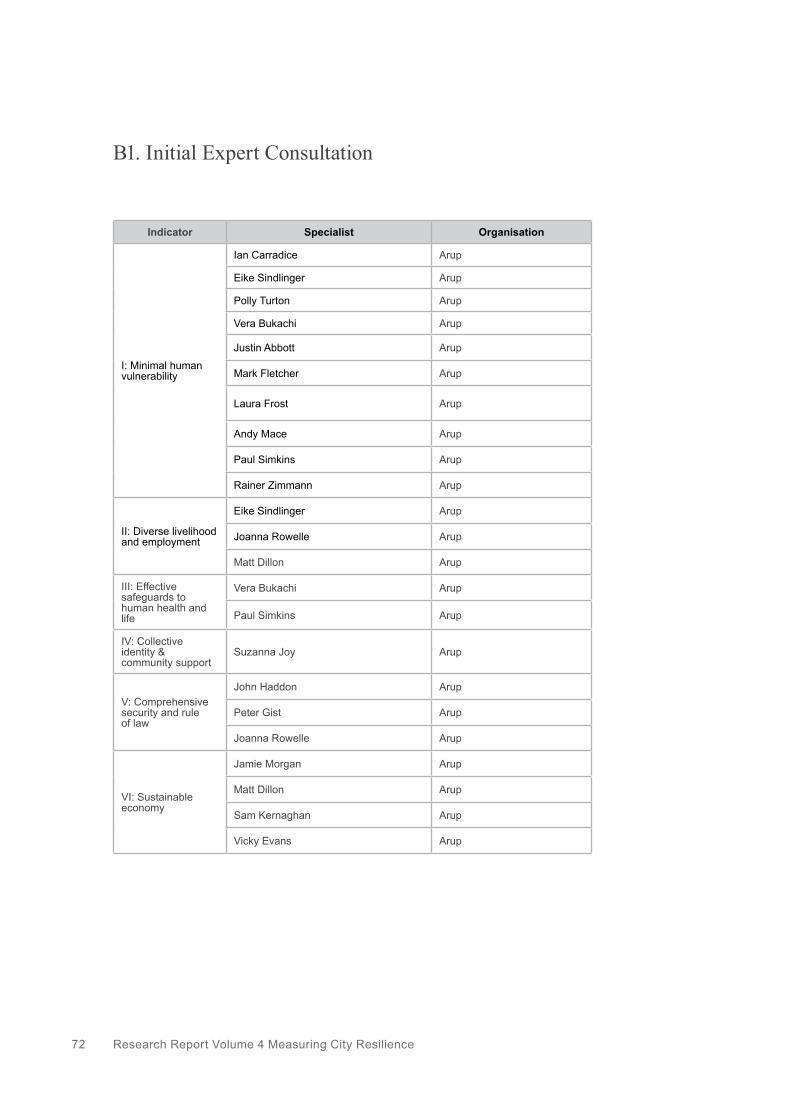
Research Report Volume 4 Measuring City Resilience 72
B1. Initial Expert Consultation
Indicator Specialist Organisation
I: Minimal human vulnerability
Ian Carradice Arup
Eike Sindlinger Arup
Polly Turton Arup
Vera Bukachi Arup
Justin Abbott Arup
Mark Fletcher Arup
Laura Frost Arup
Andy Mace Arup
Paul Simkins Arup
Rainer Zimmann Arup
II: Diverse livelihood and employment
Eike Sindlinger Arup
Joanna Rowelle Arup
Matt Dillon Arup
III: Effective safeguards to human health and life
Vera Bukachi Arup
Paul Simkins Arup
IV: Collective identity & community support
Suzanna Joy Arup
V: Comprehensive security and rule of law
John Haddon Arup
Peter Gist Arup
Joanna Rowelle Arup
VI: Sustainable economy
Jamie Morgan Arup
Matt Dillon Arup
Sam Kernaghan Arup
Vicky Evans Arup

The Rockefeller Foundation | Arup 73
Indicator Specialist Organisation
VII: Reduced exposure & fragility
Ian Carradice Arup
Juliet Mian Arup
Katherine Coates Arup
Tim White Arup
Matthew Free Arup
Tom Gray Arup
Neil Harwood Arup
Austin Brown Arup
Polly Turton Arup
Rachel Sandham Arup
VIII: Effective provision of critical services
Ian Carradice Arup
Rachel Sandham Arup
Matthew Free Arup
Andy Mace Arup
Juliet Mian Arup
Rainer Zimmann Arup
Stephen Cook Arup
Andy Thompson Arup
IX: Reliable mobility and communications
Susan Ambrosini Arup
Stuart Jenkins Arup
X: Effective leadership and management
Corinne Swain Arup
John Haddon Arup
XI: Empowered stakeholders Corinne Swain Arup
XII: Integrated development planning
Corinne Swain Arup
Susan Ambrosini Arup
Dahlia Chazan Arup
Laura Frost Arup

Research Report Volume 4 Measuring City Resilience 74
B2. Expert Engagement Metric Evolution
Indicator Pre-engagement # metrics
Post-engagement # metrics Change
I: Minimal human vulnerability 74 39 Down 35
II: Diverse livelihood & employment 40 42 Up 2
III: Adequate safeguards to human life & health 45 50 Up 5
IV: Collective identity & mutual support 27 36 Up 9
V: Social stability & security 22 63 Up 41
VI: Economic security 34 65 Up 31
VII: Reduced Physical Exposure & Vulnerability 43 74 Up 31
VIII: Continuity of Critical Services 29 97 Up 58
IX: Reliable communications & mobility 29 74 Up 45
X: Effective leadership & management 45 68 Up 23
XI: Empowered stakeholders 33 74 Up 41
XII: Integrated development planning 31 55 Up 24
Total 452 737 Up 285

The Rockefeller Foundation | Arup 75

Appendix C City engagement
City Resilience Index
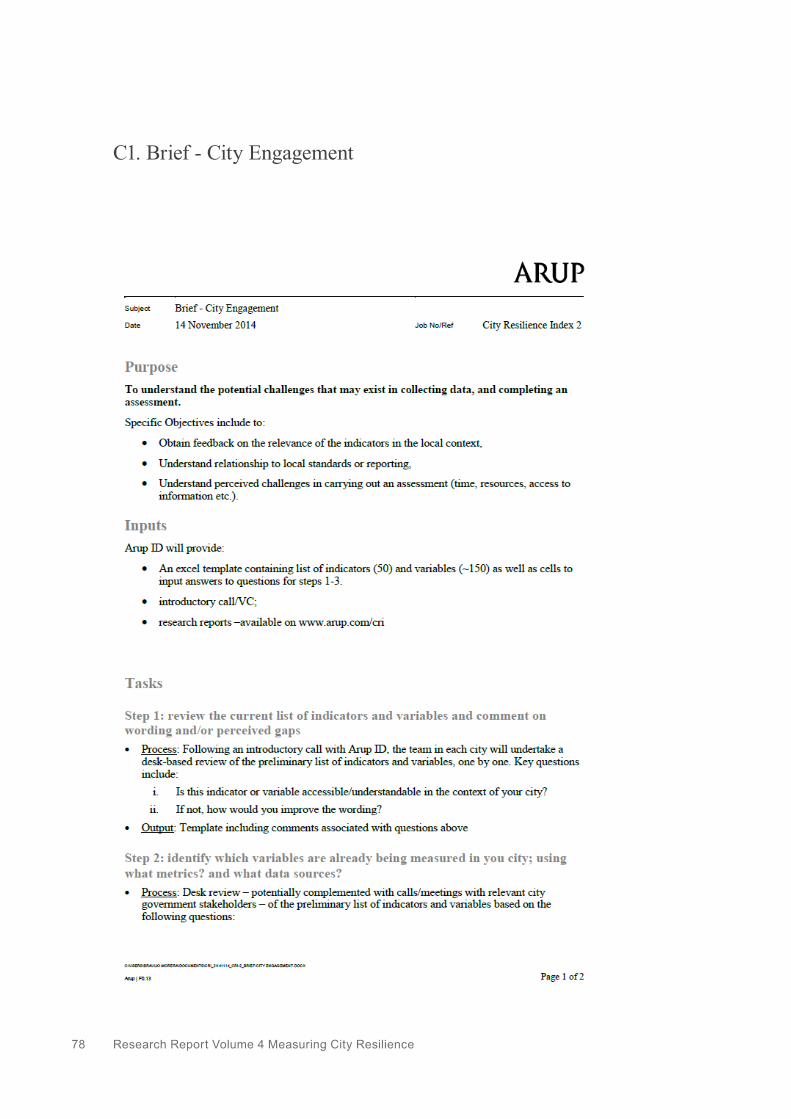
Research Report Volume 4 Measuring City Resilience 78
C1. Brief - City Engagement
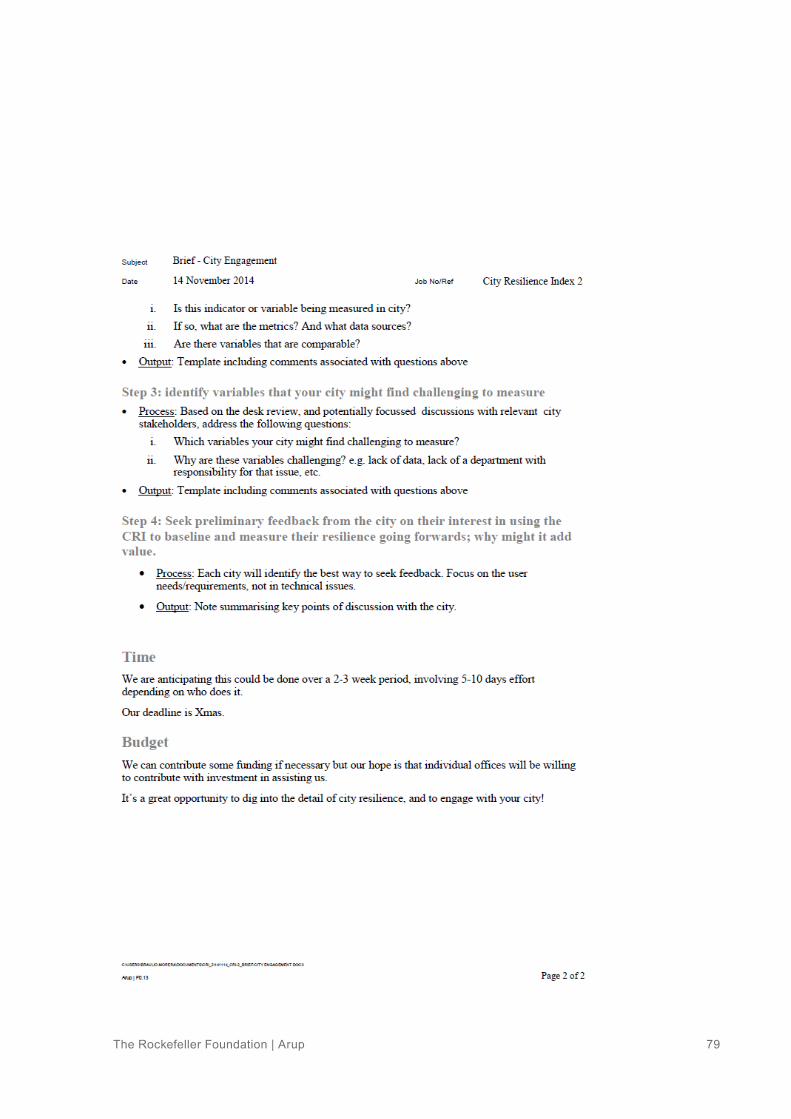
The Rockefeller Foundation | Arup 79

Research Report Volume 4 Measuring City Resilience 80
C2. Overview of average variable feedback across the cities within each indicator

The Rockefeller Foundation | Arup 81
C3. Sample Section of the CRI at the end of city consultation (Goal 1)
IndicatorPre-
engagement # metrics
Post-engagement #
metricsChange
I: Minimal human vulnerability
Access to safe housing (1)
a) Availability of safe and affordable decent housing (including integration of informal housing)
1. Percentage of households that own their own home
2. Percentage of household income spent on housing
3. Floor area per person
4. Percentage population with durable structures
5. Percentage of urban population living in a slum/Number of households living in informal settlements in the greater municipality
6. Is there an effective funding model to provide appropriate housing to the poor?
7. Existence of incentives and affordable financing to help owners and tenants of all substandard buildings bring them to a standard to withstand hazard risks.
b) Effective planning for emergency shelter & temporary housing
1. Presence of emergency housing plans or consideration of this within Major Incident Plans.
2. Percentage of population that could be served by city's access to stock of emergency shelters
Water supply and sanitation (2)
a) Safe, reliable & affordable distribution of potable water to households
1. Is there a water resources plan that includes the city (e.g. municipal, regional or national)?
2. Percentage of population that has access to safe and reliable water
3. Proportion of population using an improved drinking water source
4. Average consumer cost (/m3) of potable water
5. For city residents, average proportion of annual income spent on potable water
b) Effective planning for alternative water supplies
1. Has a contingency plan been developed to distribute potable water in case of a major event
c) Safe, reliable and affordable sanitation provided to all areas of the city
1. Percentage of population with access to improved sanitation
2. Percentage of the population living in a dwelling without [indoor?] flushing toilet for the sole use of their households
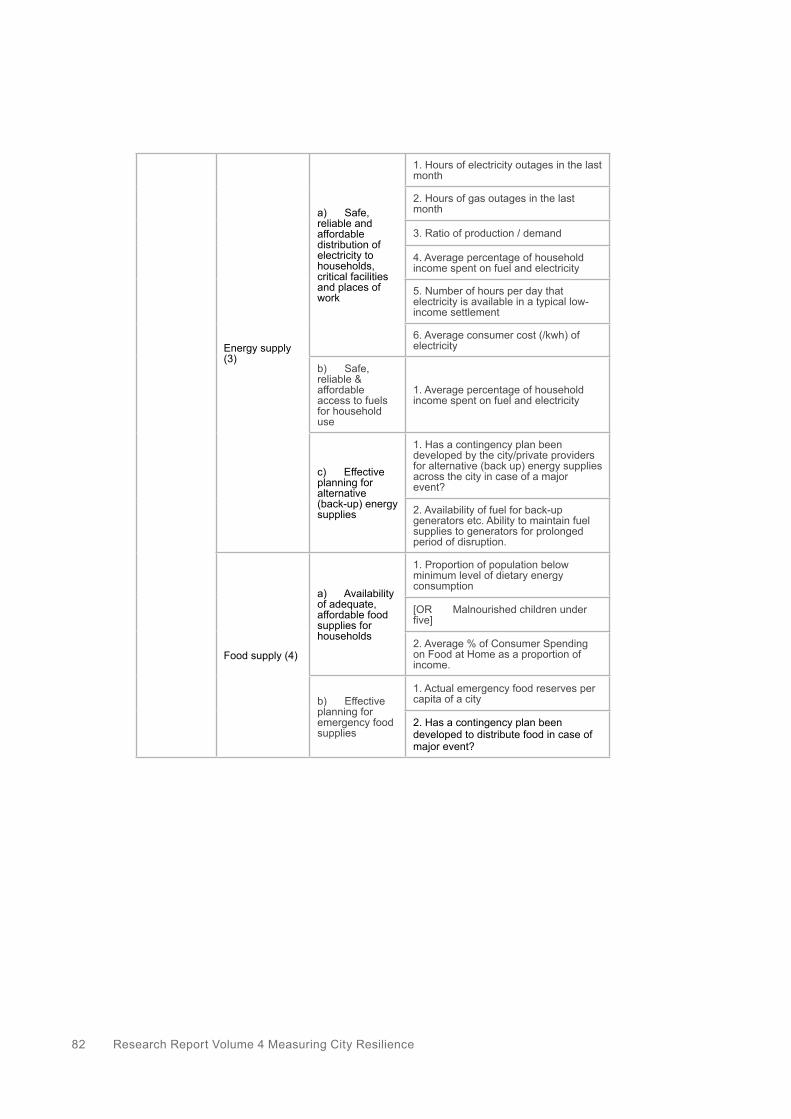
Research Report Volume 4 Measuring City Resilience 82
Energy supply (3)
a) Safe, reliable and affordable distribution of electricity to households, critical facilities and places of work
1. Hours of electricity outages in the last month
2. Hours of gas outages in the last month
3. Ratio of production / demand
4. Average percentage of household income spent on fuel and electricity
5. Number of hours per day that electricity is available in a typical low-income settlement
6. Average consumer cost (/kwh) of electricity
b) Safe, reliable & affordable access to fuels for household use
1. Average percentage of household income spent on fuel and electricity
c) Effective planning for alternative (back-up) energy supplies
1. Has a contingency plan been developed by the city/private providers for alternative (back up) energy supplies across the city in case of a major event?
2. Availability of fuel for back-up generators etc. Ability to maintain fuel supplies to generators for prolonged period of disruption.
Food supply (4)
a) Availability of adequate, affordable food supplies for households
1. Proportion of population below minimum level of dietary energy consumption
[OR Malnourished children under five]
2. Average % of Consumer Spending on Food at Home as a proportion of income.
b) Effective planning for emergency food supplies
1. Actual emergency food reserves per capita of a city
2. Has a contingency plan been developed to distribute food in case of major event?

The Rockefeller Foundation | Arup 83

Appendix D Profile metrics
City Resilience Index

Research Report Volume 4 Measuring City Resilience 86
D1. Profile Metrics - Long List
Metric Level Metric Source
Average household income (USD) City ISO, 2014
City Product as a percentage of Country’s GDP City ISO, 2014
City Product per capita (USD) City ISO, 2014
Cost of living City ISO, 2014
Country’s GDP (USD) National ISO, 2014
Country’s GDP per capita (USD) National ISO, 2014
Region (as classified by World Bank) NationalWorld Bank, 2015 - http://data.worldbank.org/about/country-and-lending-groups
National Income Category (as classified by World Bank) National
World Bank, 2015 - http://data.worldbank.org/about/country-and-lending-groups
Annual average temperature (Celsius) City ISO, 2014
Average annual rain (mm) City ISO, 2014
Average annual snowfall (cm) City ISO, 2014
Climate type City ISO, 2014
Land area (Square kilometres) City ISO, 2014
Percentage of non-residential area (square km) City ISO, 2014
Region Region ISO, 2014
Gross capital budget (USD) City ISO, 2014
Gross capital budget per capita (USD) City ISO, 2014
Gross operating budget (USD) City ISO, 2014
Gross operating budget per capita (USD) City ISO, 2014
Type of government (e.g. local, regional, county) City ISO, 2014
Dwelling density (per square kilometre) City ISO, 2014
Annual population change City ISO, 2014
Male to female ratio (number of males per 100 females) City ISO, 2014
Population as percentage of country’s population City ISO, 2014
Percentage of population that are adult (25-64) City ISO, 2014
Percentage of population that are children (0-14) City ISO, 2014
Percentage of population that are foreign born City ISO, 2014
Percentage of population that are new immigrants City ISO, 2014
Percentage of population that are senior citizens (65+) City ISO, 2014

The Rockefeller Foundation | Arup 87
Percentage of population that are youth City ISO, 2014
Percentage of residents who are not citizens City ISO, 2014
Population density (per square kilometre) City ISO, 2014
Population dependency ratio City ISO, 2014
Total city population City ISO, 2014
Inequality: GNI share of richest 10% City UNSDN (SDGs), 2015
Birth rate City World Bank, 2015
City Development Index / Human Development Index ranking City City Development Index /
Human Development Index
City distance from active convergent plate margin City Arup
City distance from active divergent plate margin City Arup
Mortality rate City World Bank, 2015
Elevation (Sea Level Rise, landslides) City Arup
ENSO/latitude? City Arup
Exposure to drought City Arup
Exposure to flooding City Arup
Exposure to SLR City Arup
Exposure to storms City Arup
Gini Coefficient City/National UNSDN (SDGs), 2015
Growth rate City Arup
History: not plotted as it cannot be captured in the grid structure. Impact of history should be addressed for each city individually.
City KPMG (2010)
Income/wage persistence (intergenerational socioeconomic mobility) City UNSDN (SDGs), 2015
Percentage of population in each income category City KPMG (2010)
Major disaster in last 5 years, 10 years, 20 years City/Region Arup
Corruption Perception Index National Transparency International
Official development assistance (ODA) and net private grants as % of high-income country's GNI National UNSDN (SDGs), 2015
Percentage of households with incomes below 50% of median income City UNSDN (SDGs), 2015
Political Structure City Arup
Population demographics - ethnicity City Individual Sources
Population demographics - religion City Arup
Employment Sector composition City KPMG (2010)
World Risk Index National UN World Risk Index
Percentage of city that lies below sea level or <1m above sea level? City Arup

Research Report Volume 4 Measuring City Resilience 88

Appendix E Thresholds definition
City Resilience Index
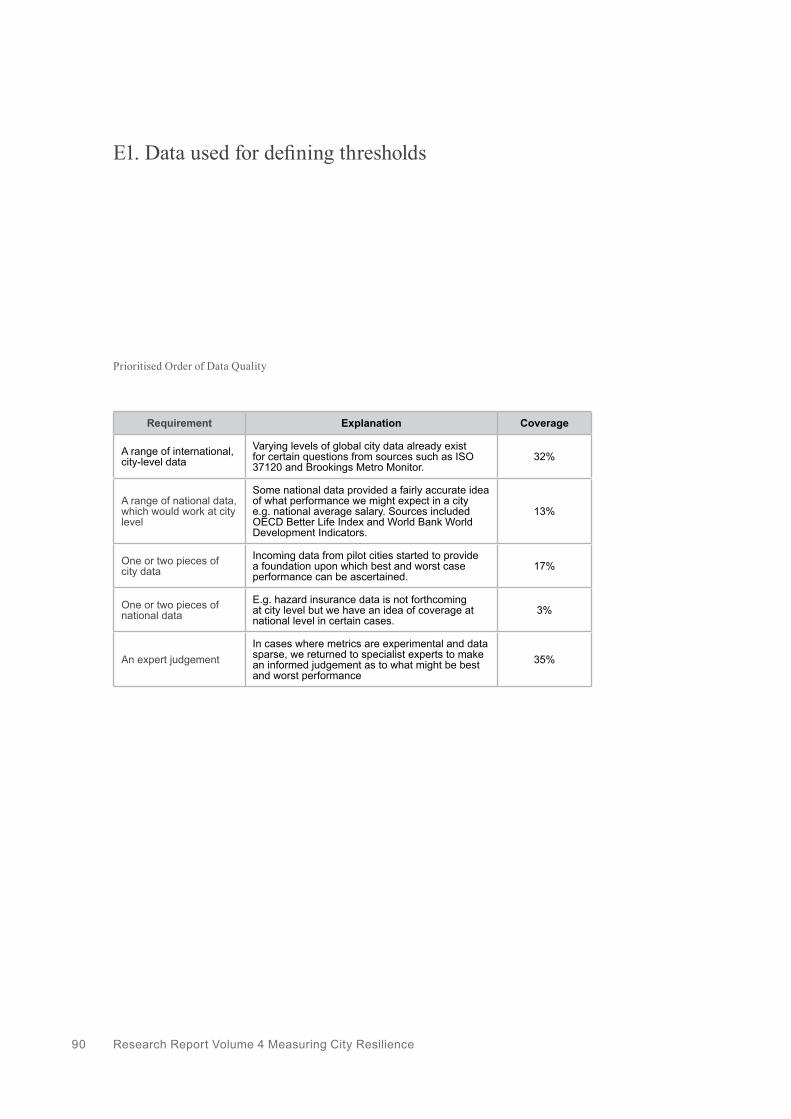
Research Report Volume 4 Measuring City Resilience 90
E1. Data used for defining thresholds
Requirement Explanation Coverage
A range of international, city-level data
Varying levels of global city data already exist for certain questions from sources such as ISO 37120 and Brookings Metro Monitor.
32%
A range of national data, which would work at city level
Some national data provided a fairly accurate idea of what performance we might expect in a city e.g. national average salary. Sources included OECD Better Life Index and World Bank World Development Indicators.
13%
One or two pieces of city data
Incoming data from pilot cities started to provide a foundation upon which best and worst case performance can be ascertained.
17%
One or two pieces of national data
E.g. hazard insurance data is not forthcoming at city level but we have an idea of coverage at national level in certain cases.
3%
An expert judgementIn cases where metrics are experimental and data sparse, we returned to specialist experts to make an informed judgement as to what might be best and worst performance
35%
Prioritised Order of Data Quality
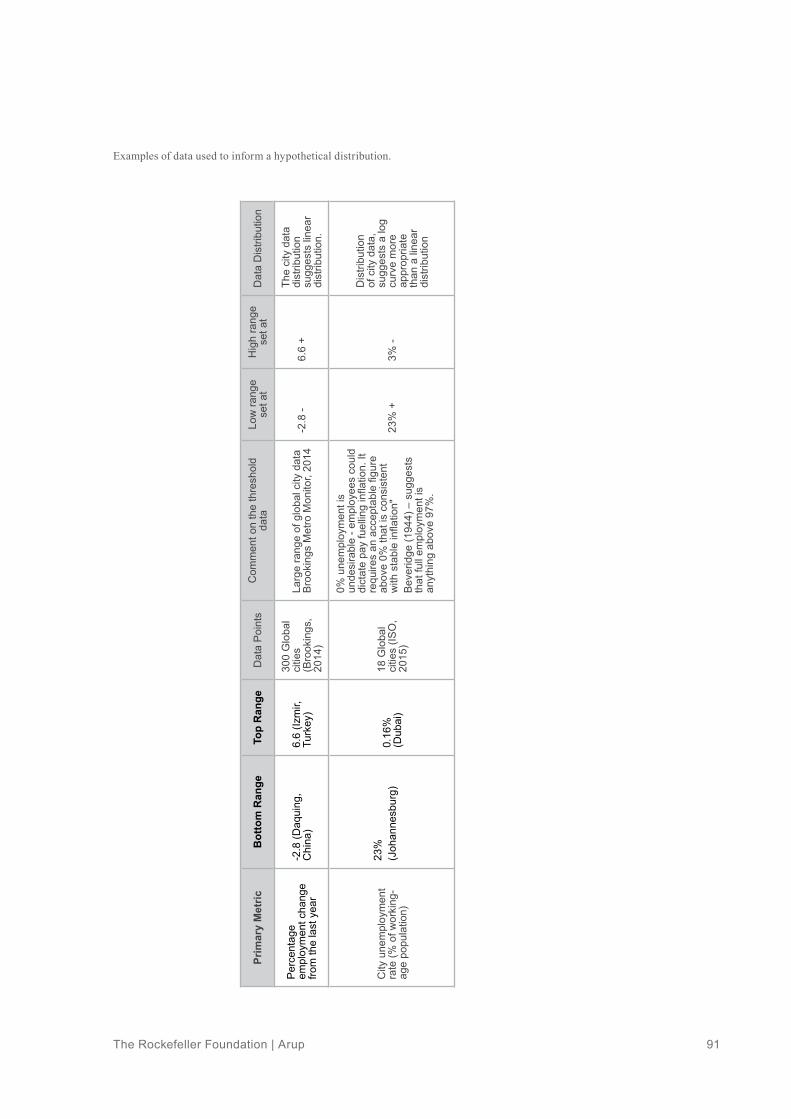
The Rockefeller Foundation | Arup 91
Prim
ary
Met
ricB
otto
m R
ange
Top
Ran
geD
ata
Poi
nts
Com
men
t on
the
thre
shol
d da
taLo
w ra
nge
set a
tH
igh
rang
e se
t at
Dat
a D
istri
butio
n
Per
cent
age
empl
oym
ent c
hang
e fro
m th
e la
st y
ear
-2.8
(Daq
uing
, C
hina
)6.
6 (Iz
mir,
Tu
rkey
)
300
Glo
bal
citie
s (B
rook
ings
, 20
14)
Larg
e ra
nge
of g
loba
l city
dat
a B
rook
ings
Met
ro M
onito
r, 20
14-2
.8 -
6.6
+Th
e ci
ty d
ata
dist
ribut
ion
sugg
ests
line
ar
dist
ribut
ion.
City
une
mpl
oym
ent
rate
(% o
f wor
king
-ag
e po
pula
tion)
23%
(Joh
anne
sbur
g)0.
16%
(D
ubai
)18
Glo
bal
citie
s (IS
O,
2015
)
0% u
nem
ploy
men
t is
unde
sira
ble
- em
ploy
ees
coul
d di
ctat
e pa
y fu
ellin
g in
flatio
n. It
re
quire
s an
acc
epta
ble
figur
e ab
ove
0% th
at is
con
sist
ent
with
sta
ble
infla
tion"
Bev
erid
ge (1
944)
– s
ugge
sts
that
full
empl
oym
ent i
s an
ythi
ng a
bove
97%
.
23%
+3%
-
Dis
tribu
tion
of c
ity d
ata,
su
gges
ts a
log
curv
e m
ore
appr
opria
te
than
a li
near
di
strib
utio
n
Examples of data used to inform a hypothetical distribution.

Research Report Volume 4 Measuring City Resilience 92
Hypothetical distribution for City Unemployment (Goal 2.3.2)

The Rockefeller Foundation | Arup 93


Appendix F Expert review feedback
City Resilience Index
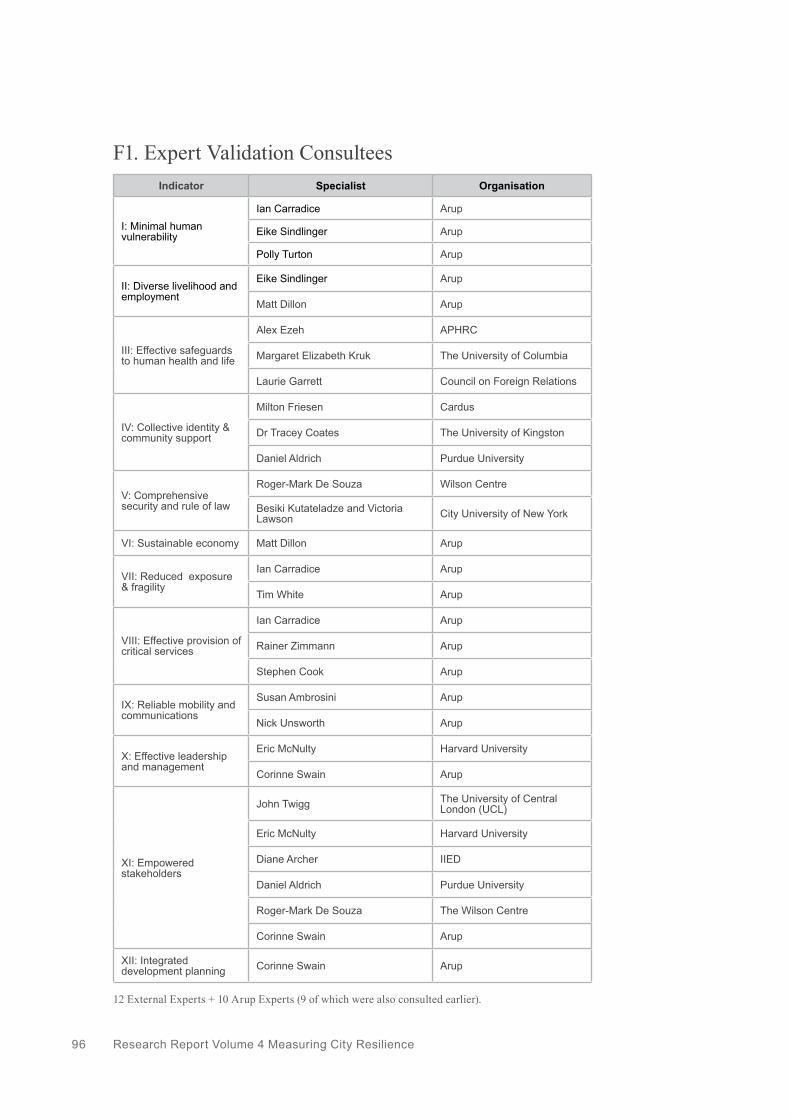
Research Report Volume 4 Measuring City Resilience 96
F1. Expert Validation ConsulteesIndicator Specialist Organisation
I: Minimal human vulnerability
Ian Carradice Arup
Eike Sindlinger Arup
Polly Turton Arup
II: Diverse livelihood and employment
Eike Sindlinger Arup
Matt Dillon Arup
III: Effective safeguards to human health and life
Alex Ezeh APHRC
Margaret Elizabeth Kruk The University of Columbia
Laurie Garrett Council on Foreign Relations
IV: Collective identity & community support
Milton Friesen Cardus
Dr Tracey Coates The University of Kingston
Daniel Aldrich Purdue University
V: Comprehensive security and rule of law
Roger-Mark De Souza Wilson Centre
Besiki Kutateladze and Victoria Lawson City University of New York
VI: Sustainable economy Matt Dillon Arup
VII: Reduced exposure & fragility
Ian Carradice Arup
Tim White Arup
VIII: Effective provision of critical services
Ian Carradice Arup
Rainer Zimmann Arup
Stephen Cook Arup
IX: Reliable mobility and communications
Susan Ambrosini Arup
Nick Unsworth Arup
X: Effective leadership and management
Eric McNulty Harvard University
Corinne Swain Arup
XI: Empowered stakeholders
John Twigg The University of Central London (UCL)
Eric McNulty Harvard University
Diane Archer IIED
Daniel Aldrich Purdue University
Roger-Mark De Souza The Wilson Centre
Corinne Swain Arup
XII: Integrated development planning Corinne Swain Arup
12 External Experts + 10 Arup Experts (9 of which were also consulted earlier).

The Rockefeller Foundation | Arup 97
Indicator Experts + - Mix Comments Summary
I: Minimal human vulnerability 3
- Generally positive, some suggestions on metrics;- Food deserts within cities & disruptions to supply chain.
II: Diverse livelihood & employment 3 - Helped us develop the questions & scenarios.
III: Efective safeguards to human health & life
3 - The scenarios look good. The challenge I think is in finding easily available (globally) quantitative measures.
IV: Collective identity & community support 3
- Types of social capital, such as bridging, social ties, linking.- Assumption that there are strong correlations across the issues (e.g. a repressed society with no freedom of speech has disempowered people) - Potential need for surveys
V: Comprehensive security and rule of law
2- Align with ISO, SDG indicators & HFA2 where possible- Suggest that you add an indicator looking at civil justice, rather than only criminal justice
VI: Sustainable economic 1 - Specific scenario feedback.
VII: Reduced exposure & fragility 2
- Generally positive about the questions & scenarios. Made some suggestions on metrics.- International list of hazards / hazards taxonomy.
VIII: Effective provision of Critical Services
2 - Trying to cover too much with some scenarios. Qs should follow consistent format. Not sure solid waste is critical
IX: Reliable mobility & communications 2
- Transit travel time to key destinations may be a better overall metric than # of transfers. - Lack of questions regarding cyber security
X: Effective leadership & management
1 - Suggestion of measuring public confidence that you’ll see in a couple of places. Various specific comments
XI: Empowered stakeholders 6
- Specific comments to improve both qualitative and quantitative - 'Marginalised' groups to 'vulnerable and disadvantaged' - Yes, I think these are the right kinds of Qs. ‘% gov. comms. in top two minority languages’ not appropriate.- Overall, the index is very helpful for organizing thinking about what makes a resilient city. However, seems to be a big leap between metrics and the broad indicators - Do you have an indicator on digital literacy anywhere?
XII: Integrated development planning
2
- Challenge is providing indicators that work for a wide range of institutional capacities throughout developing and developed economies. In general, I think your questions and scoring systems work well. You might reflect on whether “scenario” is appropriate – implies something future looking.- Finding metrics for these other than yes/no are difficult
F2. Expert review Final Feedback

Appendix G Qualities of resilient systems
City Resilience Index
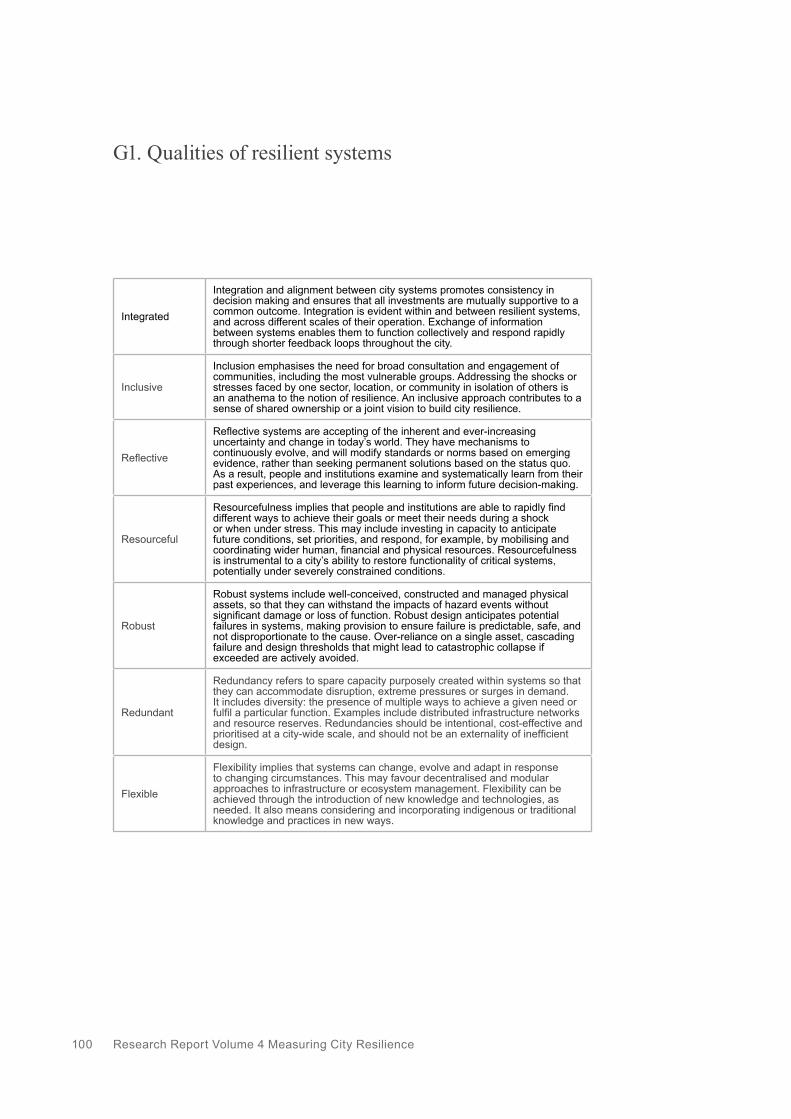
Research Report Volume 4 Measuring City Resilience 100
G1. Qualities of resilient systems
Integrated
Integration and alignment between city systems promotes consistency in decision making and ensures that all investments are mutually supportive to a common outcome. Integration is evident within and between resilient systems, and across different scales of their operation. Exchange of information between systems enables them to function collectively and respond rapidly through shorter feedback loops throughout the city.
Inclusive
Inclusion emphasises the need for broad consultation and engagement of communities, including the most vulnerable groups. Addressing the shocks or stresses faced by one sector, location, or community in isolation of others is an anathema to the notion of resilience. An inclusive approach contributes to a sense of shared ownership or a joint vision to build city resilience.
Reflective
Reflective systems are accepting of the inherent and ever-increasing uncertainty and change in today’s world. They have mechanisms to continuously evolve, and will modify standards or norms based on emerging evidence, rather than seeking permanent solutions based on the status quo. As a result, people and institutions examine and systematically learn from their past experiences, and leverage this learning to inform future decision-making.
Resourceful
Resourcefulness implies that people and institutions are able to rapidly find different ways to achieve their goals or meet their needs during a shock or when under stress. This may include investing in capacity to anticipate future conditions, set priorities, and respond, for example, by mobilising and coordinating wider human, financial and physical resources. Resourcefulness is instrumental to a city’s ability to restore functionality of critical systems, potentially under severely constrained conditions.
Robust
Robust systems include well-conceived, constructed and managed physical assets, so that they can withstand the impacts of hazard events without significant damage or loss of function. Robust design anticipates potential failures in systems, making provision to ensure failure is predictable, safe, and not disproportionate to the cause. Over-reliance on a single asset, cascading failure and design thresholds that might lead to catastrophic collapse if exceeded are actively avoided.
Redundant
Redundancy refers to spare capacity purposely created within systems so that they can accommodate disruption, extreme pressures or surges in demand. It includes diversity: the presence of multiple ways to achieve a given need or fulfil a particular function. Examples include distributed infrastructure networks and resource reserves. Redundancies should be intentional, cost-effective and prioritised at a city-wide scale, and should not be an externality of inefficient design.
Flexible
Flexibility implies that systems can change, evolve and adapt in response to changing circumstances. This may favour decentralised and modular approaches to infrastructure or ecosystem management. Flexibility can be achieved through the introduction of new knowledge and technologies, as needed. It also means considering and incorporating indigenous or traditional knowledge and practices in new ways.

The Rockefeller Foundation | Arup 101
G2. Directional Statements that embed the qualities of resilient urban systems
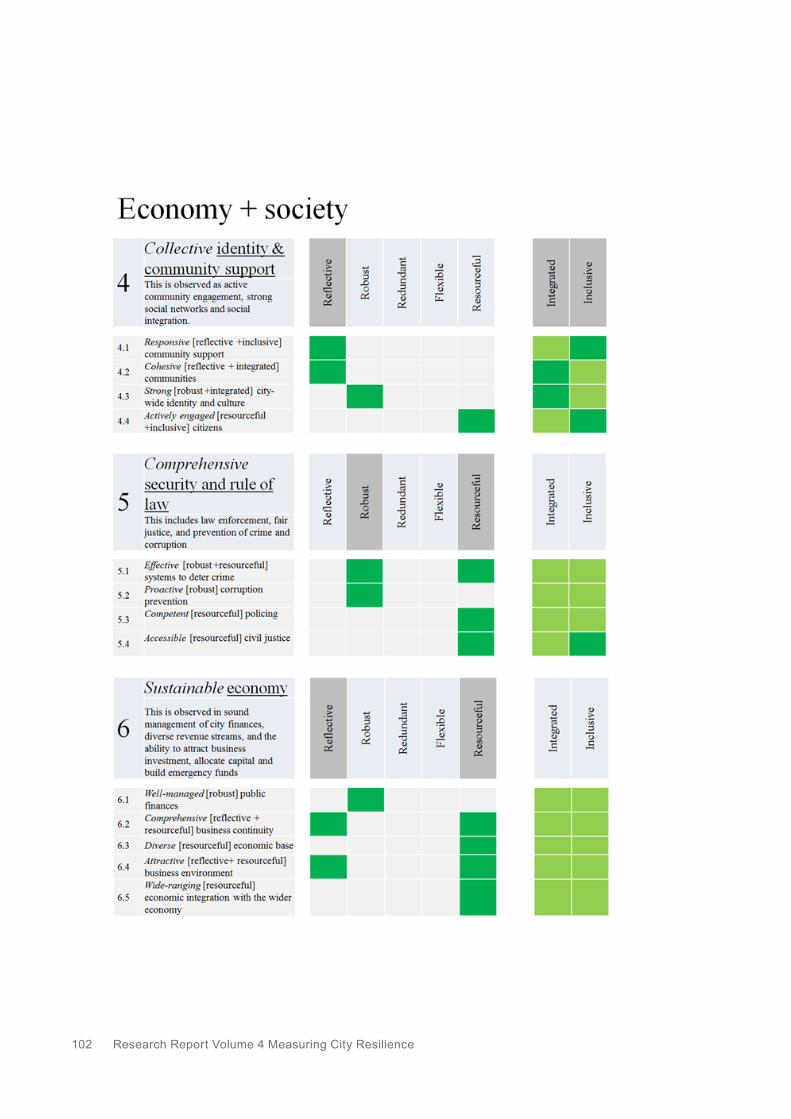
Research Report Volume 4 Measuring City Resilience 102

The Rockefeller Foundation | Arup 103

Research Report Volume 4 Measuring City Resilience 104

The Rockefeller Foundation | Arup 105


Appendix H Peer review 'salons'
City Resilience Index
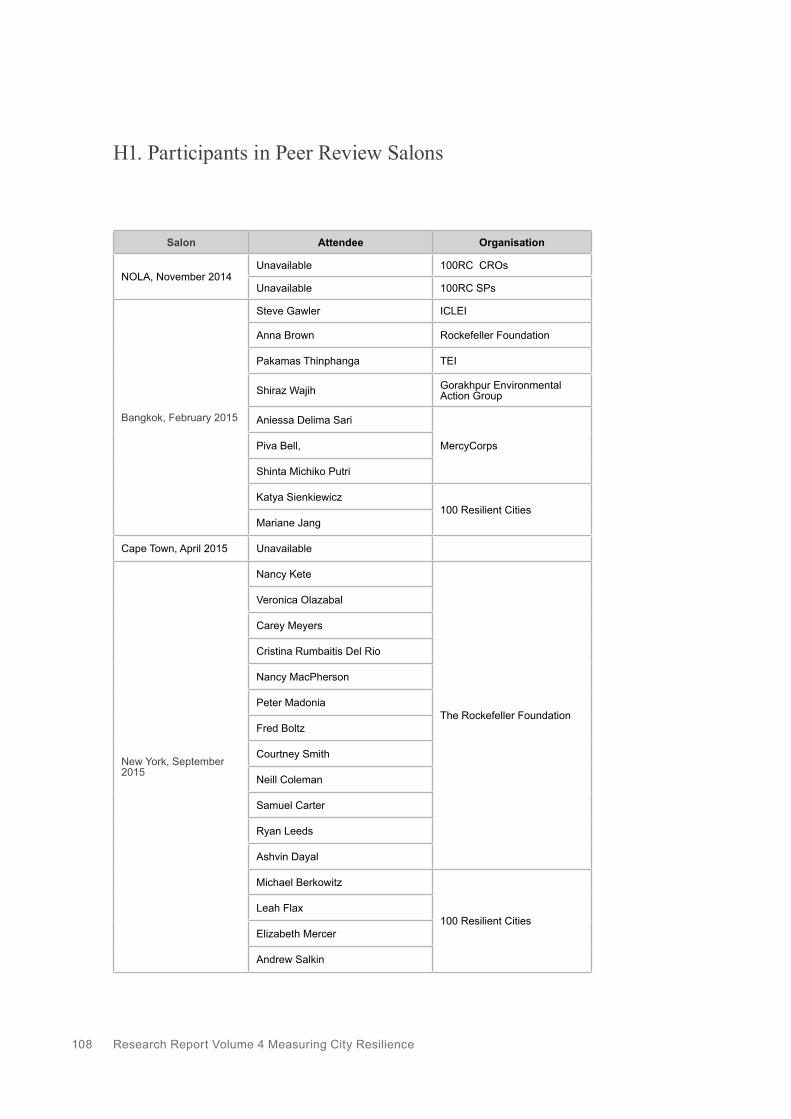
Research Report Volume 4 Measuring City Resilience 108
H1. Participants in Peer Review Salons
Salon Attendee Organisation
NOLA, November 2014Unavailable 100RC CROs
Unavailable 100RC SPs
Bangkok, February 2015
Steve Gawler ICLEI
Anna Brown Rockefeller Foundation
Pakamas Thinphanga TEI
Shiraz Wajih Gorakhpur Environmental Action Group
Aniessa Delima Sari
MercyCorpsPiva Bell,
Shinta Michiko Putri
Katya Sienkiewicz100 Resilient Cities
Mariane Jang
Cape Town, April 2015 Unavailable
New York, September 2015
Nancy Kete
The Rockefeller Foundation
Veronica Olazabal
Carey Meyers
Cristina Rumbaitis Del Rio
Nancy MacPherson
Peter Madonia
Fred Boltz
Courtney Smith
Neill Coleman
Samuel Carter
Ryan Leeds
Ashvin Dayal
Michael Berkowitz
100 Resilient CitiesLeah Flax
Elizabeth Mercer
Andrew Salkin
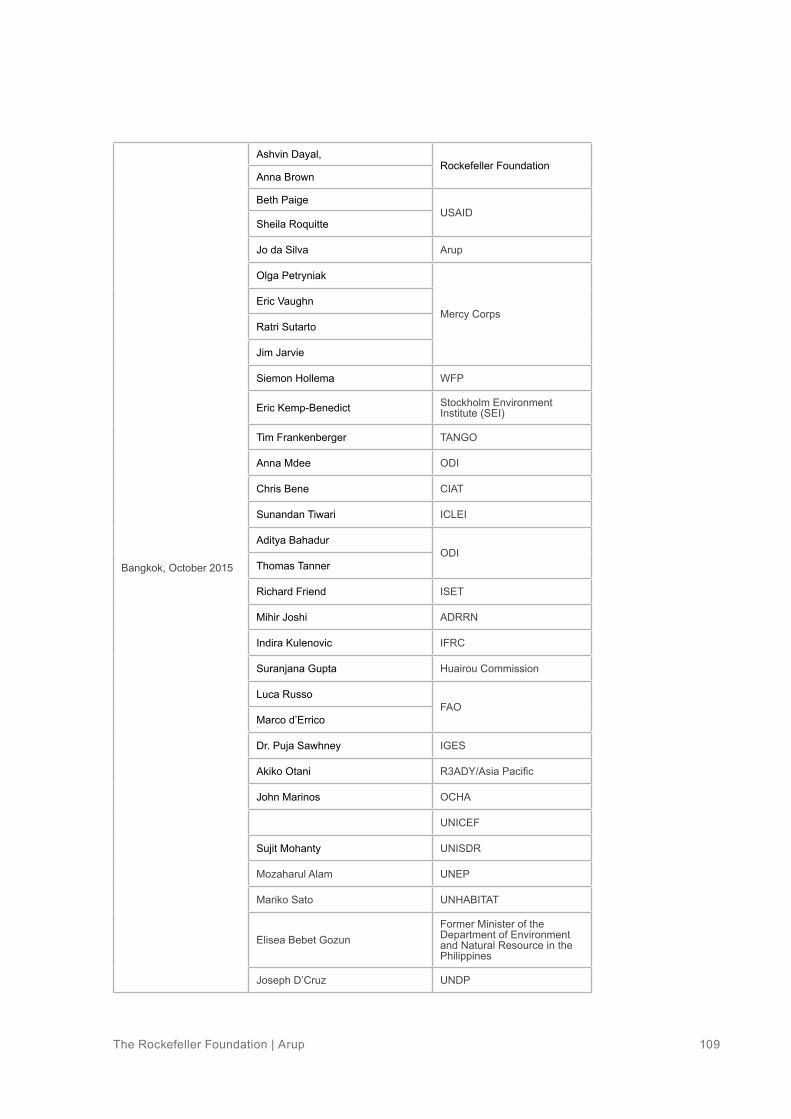
The Rockefeller Foundation | Arup 109
Bangkok, October 2015
Ashvin Dayal, Rockefeller Foundation
Anna Brown
Beth PaigeUSAID
Sheila Roquitte
Jo da Silva Arup
Olga Petryniak
Mercy CorpsEric Vaughn
Ratri Sutarto
Jim Jarvie
Siemon Hollema WFP
Eric Kemp-Benedict Stockholm Environment Institute (SEI)
Tim Frankenberger TANGO
Anna Mdee ODI
Chris Bene CIAT
Sunandan Tiwari ICLEI
Aditya BahadurODI
Thomas Tanner
Richard Friend ISET
Mihir Joshi ADRRN
Indira Kulenovic IFRC
Suranjana Gupta Huairou Commission
Luca RussoFAO
Marco d’Errico
Dr. Puja Sawhney IGES
Akiko Otani R3ADY/Asia Pacific
John Marinos OCHA
UNICEF
Sujit Mohanty UNISDR
Mozaharul Alam UNEP
Mariko Sato UNHABITAT
Elisea Bebet GozunFormer Minister of the Department of Environment and Natural Resource in the Philippines
Joseph D’Cruz UNDP

Research Report Volume 4 Measuring City Resilience 110


Arup13 Fitzroy Street London W1T 4BQ United Kingdom
Jo da SilvaDirectoremail: [email protected] tel: +44 20 7755 2010
Braulio Eduardo MoreraAssociateemail: [email protected] tel: +44 20 7755 4820
www.arup.com/cri