Research Report on Factor Productivity and Marketed...
69
Research Report on Factor Productivity and Marketed surplus of Major Crops in India Analysis of Orissa State (Final Report May 2009) Submitted to Planning Commission GOVT.OF INDIA BY A.Amarender Reddy ADMINISTRATIVE STAFF COLLEGE OF INDIA BELLA VISTA: HYDERABAD - 500 082
-
Upload
phungkhanh -
Category
Documents
-
view
217 -
download
3
Transcript of Research Report on Factor Productivity and Marketed...

Research Report on
Factor Productivity and Marketed surplus of Major Crops in India
Analysis of Orissa State
(Final Report May 2009)
Submitted
to Planning Commission
GOVT.OF INDIA BY
A.Amarender Reddy
ADMINISTRATIVE STAFF COLLEGE OF INDIA BELLA VISTA: HYDERABAD - 500 082

ii
Acknowledgement
I wish to thank Sh. Lambor Rynjah, Principal Adviser, Planning Commission
(Agriculture) for sanctioning of this research project to Administrative Staff College
of India, Hyderabad. Constant encouragement and guidance of Dr. V.V. Sadamate,
Adviser (Agriculture) and Smt. Sudha P. Rao Adviser (SER) during the study period
helped in addressing the present policy issues in the context of Orissa agriculture.
Discussions with Dr. (Smt.) Vandana Dwivedi, Jt. Adviser (Agriculture) helped in
shaping the report and addressing the issues pertaining to food security and
sustainability aspects. We have received full support from Sh. Shankar Mukherjee,
Deputy Secy. (SER) whenever we came to planning commission in all respects.
Special thanks are also due to Prof. Praduman Kumar, Hon. Prof. NCAP, New Delhi
for his constructive guidance during the study period. Constant encouragement and
support of Mr.Chadrashekar Rao, Dean (Research and Consultancy) and Dr.Gautham
Pingle, Centre Director (Public Policy) helped in early completion of the project. The
research assistance received from Ms.Varavalli, Mr.Tirumala Rao, Mr. Pratap Kumar
Jeena, Mr. Basava Raju and Mr. Bushan is appreciated. Lastly, thanks to Mr.Narsi
Redy, for his secretarial assistance.
Team Leader
A.Amarender Reddy
26th May 2009

iii
Abstract
Over the last three decades there has been stagnation in agriculture in Orissa. During the
period 1996 to 2003 the growth rate is negative in area, production and yield in major
crops. The study estimated TFP growth of major crops in Orissa from 1971 to 2003 at state
level. The study also estimated district level production efficiency by using frontier
production function for the period 1971 to 2005 by using district level data on inputs and
outputs. The marketed surplus of major crops has been estimated by using primary survey
data for the period 2007 by using modified Raj Krishna model.
Study indicates the TFP growth of all crops, except paddy, groundnut and jute has been
declined with negative growth. Concentration of cropped area is increased towards paddy
cultivation. There is a significant increase in real cost of production and relative decline in
price of output for all major crops, with consequent adverse effects on gross cropped area.
There is an urgent need to increase TFP growth in all crops especially in pulses and oilseeds
to make their cultivation profitable and to increase crop diversification and optimal
utilization of land and water resources. For achieving the desired level of food production
keeping in mind the dietary requirement, we need to raise GCA and cropping intensity,
which, in turn, depends on increase in crop diversification towards pulses and oilseeds,
irrigation facilities and infrastructure. The results also pointed out significant monetary
benefits to farmers through crop diversification to pulses and oilseeds from the existing
cropping pattern, in addition to gains in food security at macro-level
To sustain the agricultural production, we need enhanced supply of inputs like seed, fertilizer
and pesticides and irrigated area. Seed replacement ratio is less than 20% for most of the
crops, which needs to be increased by supply of certified seed. Total seed supplied for all
crops in 2005-06 is 62, 000 tonnes, projected demand for seed is 72, 568 tonnes for 2011-12.
Likewise fertilizer consumption per ha. of GCA was 70 kg for year 2005-06, projected to
increase further to 134 kg for the year 2011-12. Infrastructure items such as farm energy and
power and, agricultural credit need to be developed concurrently to sustain agricultural
growth at desired level.

iv
Literate rate, % agricultural workers, irrigation, electricity used for agricultural purpose,
marketing infrastructure and transport facilities are crucial for increasing agricultural value
from districts. Steps to be taken to improve conditions in the above aspects. Efficiency level at
district level is very low with only 36%. Which indicates that with the existing resources and
technology districts agricultural value product can be increased by 64%.

v
Cha.No. Title Page No.
1 Introduction 1-4
2 Orissa Agricultural Economy: Interstate Comparison 5-9
3 Agricultural Production Scenario in Orissa 10-14
4 Methodology 15-22
5 Results and Discussions 23-46
6 Conclusion and Policy Implication 47-49
References 50-51
Appendix Tables 52-60

vi
List of Tables S.No. Title Page 2.1 Trends in Area, Production and Yield of Major Crops in Orissa and
India
5
2.2 Inter-state comparison of Indicators of Agricultural Development TE 2006
7
2.3 Trends in Cropping Pattern since 1971 8 2.4 Per capita GSDP as a percent of GDP 8 3.1 Population statistics 9 3.2 Land and Resource Use Statistics in Orissa (2007-08) 10 3.3 Seed Replacement Rate (%) for the year 2007-8. 11 3.4 Distribution of Operational Holdings and Area Operated by Size Class
of Land Holdings in Rural Orissa 12
4.1 Trends in area, production and yield of field crops in Orissa
17
5.1 Index of area, yield and production of crops in Orissa 24 5.2 Real Input-output price parity of crops in Orissa 26 5.3 Profitability of crops in Orissa 29 5.4 Indices of Partial factor productivity of labour, fertilizer and land in
Orissa 32
5.5 Total factor productivity and cost of production per unit of output at constant price, Orissa
34
5.6 Inter-regional and inter-district variations in important agricultural sector indicators TE 2006
36
5.7 District-wise trends in Production (000 t), and yield (quintals/ha) of cereals, pulses, oilseeds and other crops in Orissa
37&38
5.8 Results of Frontier Production Function (Tine-invariant inefficiency model)
41
5.9 Mean efficiency estimates of districts in Orissa
42
5.10 Rice area diverted to non-rice area (hectares) during kharif season in ha
42
5.11 Marketed Surplus elasticities of Crops in Orissa 43 5.12 Estimates of Marketable Surplus of Rice, Cereals, Pulses and
Oilseeds from 2001-02 to 2006-7 46
5.13 Marginal effects on increase in gross revenue from a one hectare increase in area in different districts (average for 2001-2005)
47

vii
List of Figures/Appendix S.No. Title Page No
Map Orissa Districts Map 40
Appendix Table 1 Use of inputs per ha by crops in Orissa 53
Appendix Table 2 Index of input used in crops, Orissa 54
Appendix Table 3 Input share in total cost by crops in Orissa 55
Appendix Table 4 Index of input and output prices of crops in Orissa 56-57
Appendix Table 5 Price of inputs deflated by whole sale price index in Orissa 58
Appendix Table 6 Descriptive statistics of variables taken in efficiency frontier production function
59-61

1
Chapter-I
Introduction
In the liberalized era, improving productivity, competitiveness and increasing marketed
surplus are important goals of agriculture sector. To achieve the above goals is
important especially for underdeveloped states like Orissa, which is characterized by low
productivity, low investment and low crop income for a long time. Identifying price and
non-price factors in a specific geographical setup for accelerating the growth in
agriculture sector is critical to remove bottlenecks for overall development of the state. In
the background of increasing need for food security along with market driven policies,
one needs reliable empirical knowledge about the degree of responsiveness of demand
and supply for factors and products to relative prices, technological change and other
institutional factors. Studies in the factor productivity with special emphasis on
regions/districts in Orissa will help in characterizing the districts according to productivity
growth of different crops and will facilitate the planners to focus on potentially high
productivity growth areas for increasing area and productivity under different crops. By
simultaneously studying the factor share and output supply of major crops we can
suggest policy options for different farmer groups/agro-ecosystems based on their factor
endowment to increase output supply and marketed surplus. The outcome of these
adjustments in factors/outputs will be linked to marketed surplus for optimum allocation
of factors of production to increase marketed surplus of major crops.
In Orissa trends in area, production and productivity are very low upto 2003 for both food
grains and oilseeds. Then after agricultural productivity has been increased for all the
crops. Hence this study focuses on the causes for contraction of area and production
and TFP growth of major crops up to 2003. No single study exists for Orissa both at the
state level and also district level. Hence this study proposed to study Total factor
Productivity growth and efficiency in orissa agriculture with the following main objectives.
(i) How the total factor productivity (TFP) index is changing over time for principal crops
at state level? (ii) How the changes in factor share are taken place? (iii) How the real
factor and product prices have changed for different crops in Orissa? (iii) What is the
extent of the inter-district differences in productive efficiency? (iv) What are the factors,
which influence the differences in agricultural production, and (V) extent of marketed
surplus of major crops and its determinants?

2
Objectives (1) To examine the behavior of input-output prices, factor shares, technological and
institutional factors and total factor productivity of major crops in Orissa.
(2) To estimate the output supply elasticities with respect to change in inputs
(3) To compute the marketed surplus elasticities with respect to product price,
technology and other institutional factors.
(4) To measure the effect of price and non-price factors on output supply and marketed
surplus, and its policy implication towards food security.
Review of Literature
There are very few studies existing in measuring the factor shares, output supply and
marketed surplus simultaneously and also interlinking them with price and non-price
factors (like credit, technology, irrigation etc.) and studying them in integrated way will be
essential to make any policy options for increasing output supply and marketed surplus
of crops. There are studies for Punjab, Western India, Tamil Nadu, but for Orissa there is
no detailed scientific and exploratory study exists. At national level also many studies
concentrated on studying rice and wheat, but little work has been done on other crops
(pulses and oilseed crops) with the above objectives (Chand, 1986).
Ramesh Chand (1986) examined the effect of input and output prices on input demand
for major crops of Punjab. Quadratic profit function was used to estimate the factor
demand equations. The results revealed that the elasticities of factor demand with
respect to output prices were positive in all cases except for labour demand function in
cotton and gram and bullock labour demand function in gram. Fertilizer was found to be
weak complement of human labour in wheat and gram but a strong substitute in case of
paddy. Further, it was observed that the input-output price structure followed in the past,
has decreased the demand for factors in crop production except for fertilizer. The study
concluded that if the past structure of input-output price was maintained in future, without
technological change, it would decrease the demand for human as well as bullock
labour.
Mittal (2001) conducted a study entitled “ Productivity and Source of Growth for Wheat in
India”. The result of the study shows that TFP index for wheat has risen at the rate of 0.9
percent per annum and has contributed 24% to output growth. TFP growth has lowered
the unit cost of production and wheat price benefiting both producer and consumer.

3
Research investment, quality of input and rural infrastructure are the most important
determinants of output growth.
In marketed surplus studies, Janvry and Kumar (1981) formulated a model for the
analysis of marketed surplus response to output and factor price changes. They also
studied the implication of each prices on farmers’ income. The estimates of factor
demand and output supply elasticities, were computed from jointly estimated output
supply and factor demand equations and used to calculate the elaticities of marketed
surplus. The elasticities of marketed surplus with respect to wage rate and fertilizer price
were-0.19 and –0.24 respectively on small and –0.10 and –0.23 on large farms. The
response to output price was observed to be negative (-0.23) on small farms and
positive (0.26) on large farms. On small farms the negative response resulted from the
dominance of income effect in consumption, which had negative effect on marketed
surplus. In contrast for large farm the income effect was small and the positive output
response to higher wheat prices dominated the adjustments in marketed surplus. Kumar
and Dey (2004) used a multi-stage budgeting framework in estimating the demand
function for disaggregated commodity groups based on Almost Ideal Demand System.
The model has been adopted for fisheries demand in India. Own-price elasticity of
demand for fish is high and has not shown any sign of decline during the last 15 years.
These elasticities are substantially higher in eastern, northeastern and southern states.
Among international studies, Huang (1998) conducted study entitled “Investigation of
cost function of the small abalone farms in Taiwan”. The translog cost model is used to
study price elasticity of factor demand output elasticity of small abalone farms in Taiwan.
An output elasticity of 0.89 reveals decreasing return to scale in production. Luh (1993)
conducted a study entitled “Are Farmers Learning by Doing? Experience in Taiwan? The
results indicated long lags in adjustment of both agricultural labour and capital, and also
suggest that asset fixity is an important characteristic of Taiwan Agriculture. This study
demonstrated that labour using and capital saving were characteristics of technical
change in Taiwan agricultural production during past two decades. An earlier study
indicated that technical change is consistently biased against labour but towards capital
and intermediate input for U.S. Agricultural production. This pattern of factor bias
illustrated the possibility of influence of resource endowments on technological change.

4
Chapter-II Orissa Agricultural Economy: Interstate Comparison
Over the last three decades there has been stagnation in agriculture in Orissa. From
early 1970s to late 1990s the growth rates in area under food grains, yield rate and
production are found to be 0.54, 1.34 and 1.88 respectively. During the period 1996 to
2005 the growth rate in food grain production is 2.52%. These growth rates particularly
from 1970s to early 1990s are much lower in comparison to other Indian states and all-
India average. The year wise area, yield and production of food grains, pulses and
oilseeds have been indicated for the period 1996-2006 in Table 2.1. It shows that in
production of oilseeds Orissa recorded a negative growth rate, while in production of
food grains it recorded significant positive growth, mainly because of increase in area
under food grains, especially paddy crop. It also indicates that, during the last decade
there is an increase in concentration in Orissa agrarian economy in recent years towards
paddy with significant decline in area under oilseed crops.
The yield rate of food grains in Orissa was only 1348.7 kg/ha, whereas for all-India the
figure was quite higher i.e. 1715.7 kg/ha. Also, in the neighboring states of West Bengal
and Andhra Pradesh having similar agro-climatic conditions, the yield was substantially
higher i.e.2332 kg/ha and 2120 kg/ha respectively (Table 2.2). Orissa food grain yields
were almost equivalent to agriculturally less developed and drought prone states like MP
(1177 kg/ha), Rajastan (1018 kg/ha) and Maharastra (1028 kg/ha). If we consider the
yield rate of rice, which is the staple cereal crop of Orissa, the picture is, also, not
encouraging. The average per hectare yield rate of rice in Orissa is only 1348 kg,
whereas the all-India average is 2046 kg. The main reason for low yield of food grains in
Orissa is due to a low level of commercialization of agricultural sector, both input and
output side. For example fertilizer, pesticide and credit use per ha in Orissa is one of the
lowest in India. The Gross Irrigated Area (GIA) as percent of total cropped area is just
28% as against national average of 38.7%, even though there is vast scope to increase
unexplored irrigation potential. As a result of all these factors, agricultural GDP per
hectare is just Rs.11, 839.5/- as against Rs. 39,872/- in case of West Bengal,
Rs.21,443/- per ha in case of Andhra Pradesh in 2006.
5
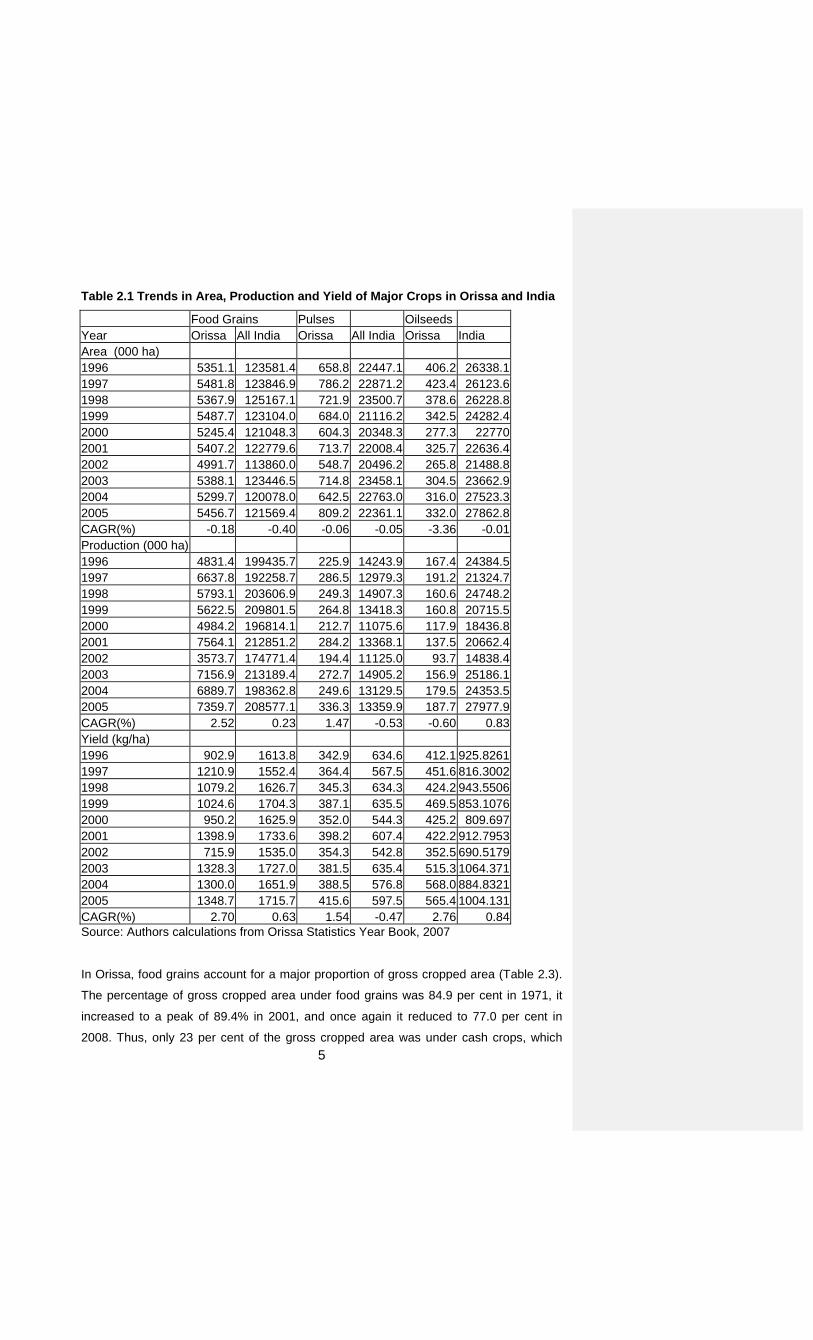
Table 2.1 Trends in Area, Production and Yield of Major Crops in Orissa and India
Food Grains Pulses Oilseeds Year Orissa All India Orissa All India Orissa India Area (000 ha) 1996 5351.1 123581.4 658.8 22447.1 406.2 26338.11997 5481.8 123846.9 786.2 22871.2 423.4 26123.61998 5367.9 125167.1 721.9 23500.7 378.6 26228.81999 5487.7 123104.0 684.0 21116.2 342.5 24282.42000 5245.4 121048.3 604.3 20348.3 277.3 227702001 5407.2 122779.6 713.7 22008.4 325.7 22636.42002 4991.7 113860.0 548.7 20496.2 265.8 21488.82003 5388.1 123446.5 714.8 23458.1 304.5 23662.92004 5299.7 120078.0 642.5 22763.0 316.0 27523.32005 5456.7 121569.4 809.2 22361.1 332.0 27862.8CAGR(%) -0.18 -0.40 -0.06 -0.05 -3.36 -0.01Production (000 ha) 1996 4831.4 199435.7 225.9 14243.9 167.4 24384.51997 6637.8 192258.7 286.5 12979.3 191.2 21324.71998 5793.1 203606.9 249.3 14907.3 160.6 24748.21999 5622.5 209801.5 264.8 13418.3 160.8 20715.52000 4984.2 196814.1 212.7 11075.6 117.9 18436.82001 7564.1 212851.2 284.2 13368.1 137.5 20662.42002 3573.7 174771.4 194.4 11125.0 93.7 14838.42003 7156.9 213189.4 272.7 14905.2 156.9 25186.12004 6889.7 198362.8 249.6 13129.5 179.5 24353.52005 7359.7 208577.1 336.3 13359.9 187.7 27977.9CAGR(%) 2.52 0.23 1.47 -0.53 -0.60 0.83Yield (kg/ha) 1996 902.9 1613.8 342.9 634.6 412.1 925.82611997 1210.9 1552.4 364.4 567.5 451.6 816.30021998 1079.2 1626.7 345.3 634.3 424.2 943.55061999 1024.6 1704.3 387.1 635.5 469.5 853.10762000 950.2 1625.9 352.0 544.3 425.2 809.6972001 1398.9 1733.6 398.2 607.4 422.2 912.79532002 715.9 1535.0 354.3 542.8 352.5 690.51792003 1328.3 1727.0 381.5 635.4 515.3 1064.3712004 1300.0 1651.9 388.5 576.8 568.0 884.83212005 1348.7 1715.7 415.6 597.5 565.4 1004.131CAGR(%) 2.70 0.63 1.54 -0.47 2.76 0.84Source: Authors calculations from Orissa Statistics Year Book, 2007
In Orissa, food grains account for a major proportion of gross cropped area (Table 2.3).
The percentage of gross cropped area under food grains was 84.9 per cent in 1971, it
increased to a peak of 89.4% in 2001, and once again it reduced to 77.0 per cent in
2008. Thus, only 23 per cent of the gross cropped area was under cash crops, which

6
include oilseeds, fibre crops, plantation crops and vegetables. There has not been any
perceptible change in the cropping pattern during the period 1971-2006. Instead of
diversification in cropping pattern favouring cultivation of more remunerative cash crops,
percentage area under food grains has slightly increased from 84.9 per cent in 1971 to
89.4 per cent in 2001 and then after decreased 77% in 2008. Regarding intensity of
cropping, Orissa is far behind achieving double cropping. Cropping intensity, which was
146 per cent in 1985, has actually declined to 139 per cent in 2001 but again increased
to 158 per cent in 2008. Area under paddy decreased from 66.1 % of Gross Cropped
Area (GCA) in 1970-71 to 45.9% of GCA in 1991 and then again increased to 74.4 per
cent in 2001, and later it declined to 50% in 2008. It once again shows that, until 2001,
there is a concentration of area under paddy, however crop diversification taken place
then after due to expansion of area under pulses, vegetables and spices. Area under
pulses decreased from 12.5% in 1971 to 11.8 per cent and again increased to 22.0 per
cent. Area under oilseeds shows higher level of fluctuations, as it increased from 4.9
per of GCA in 1971 to 12.4% of GCA in 1991 and once again declined to 6.4% of GCA
in 2000 and it is 9% of GCA in 2007.
As a result of stagnant or declining agricultural sector since 1970s, and also less
commercialization of all economic activities Orissa economy is stagnant when compared
to growth seen in other states and also India. For example in 1981, per capita SGDP of
Orissa is about 76% of national per capita GDP, while it decreased to 62% in 2001 and
again decreased to 53.5%. It is one of the lowest in the country.

7
Table 2.2. Inter-state comparison of Indicators of Agricultural Development TE 2006 State Yield
Rate Food
Grains(Kg/ha)
Yield Rate of
Rice (Kg/ha)
% of GCA
Irrigated
Fertilizer Use
(kg/ha)
Average Size of
Operational Holdings
(ha)
Poverty (%)
Credit-Deposit Ratio
NSA (000 ha)
Bank Branches/ 1000 ha
NSA (ha/capita)
Agril. GDP (Rs.1000/ha)
I. Eastern Region Orissa 1348 1348 27.5 43.8 1.34 48 39.8 5739 3.9 0.156 11839.5 Bihar 1526 1378 46 97.2 0.93 44 22.5 5572 9 0.067 24102.8 West Bengal 2332 2396 27.5 136 0.9 31.9 45.2 5295 8.3 0.066 39872.2 II. Southern Region Andhra Pradesh 2120 2947 43.1 155.5 1.56 11.1 63.8 10745 4.7 0.141 21443.5 Karnataka 1431 2682 23.7 103.1 2.13 17.4 61 10509 4.5 0.199 13864.5 Kerala 1876 2003 15.4 70 0.33 9.4 42.3 2132 15.2 0.067 26403.5 Tamil Nadu 2417 3646 51.8 162.9 0.93 20.6 88 5244 9 0.084 23889 III. Central Region Madhya Pradesh 1177 1071 25.8 47.2 2.63 37.1 49.2 14971 3 0.248 10880.8 Gujarat 1516 1728 33.1 87.8 2.93 13.2 49.8 9852 3.7 0.194 16833.1 Rajasthan 1018 1293 32.6 39.5 4.11 13.7 46.7 16836 2 0.298 9837.3 Maharashtra 1028 1760 14.5 88.9 2.2 23.7 83.8 17473 3.6 0.18 12081.8 IV. North-Western Region Utter Pradesh 2078 2078 66.9 125.4 0.89 31.2 27.5 16683 5.3 0.1 23305.8 Punjab 3964 3339 94.1 184.6 3.61 6.4 39.1 4243 5.9 0.174 41533.9 Haryana 2862 2374 78.8 148.5 2.43 8.3 41.4 3566 4.2 0.169 33740.7 India 1717 2046 38.7 95.3 1.57 Source: Annual Statistical Abstracts of Various States

8
Table 2.3. Trends in Cropping Pattern since 1971
S. No. Principal Crop 1970-71 1980-81 1990-91 2000-1 2007-08
1. Paddy 66.1 47.9 45.9 74.4 50.0
2. Total Cereals 72.4 59.3 51.7 77.6 55.0
3. Total Pulses 12.5 19.7 22.2 11.8 22.0
4. Total Food grains 84.9 79.0 73.9 89.4 77.0
5. Total Oil Seeds 4.9 8.4 12.1 6.4 9.0
6. Total Fibres 1.2 1.1 0.9 1.2 1.0
7. Other Crops (veg. &
spices)
8.1 10.6 12.4 3.0
13.0
All Crops 100 100 100 100 100
Total Area (000 ha) 5601 6130 6304 5980 8960
Cropping Intensity (%) 133 135 141 139 158
Source: Government of Orissa, Economic Survey, various Issues, Directorate of Economics and Statistics, Bhubaneswar,
Table 2.4. Per capita GSDP as a percent of GDP (Three-year average of incomes at current prices centered on)
States 1981 1985 1991 2001 2006 Eastern Region Orissa 75.7 74.7 66.9 61.8 53.5Bihar 58.8 60.6 53.5 44.2 109.0West Bengal 103.3 102.9 91.7 85.1 -II. Southern Region Andhra Pradesh 87.4 82.4 92.5 92.9 97.0Karnataka 92.8 93.7 95.4 107.2 62.7Kerala 90.5 90.9 87.8 116.4 119.4Tamil Nadu 92.8 97 100 119.5 108.0III. Central Region Madhya Pradesh 80.8 74.8 78.1 73.5 49.2Gujarat 125.3 124.4 118.8 137.4 76.1Rajasthan 76.6 74 79.3 81.1 44.5Maharashtra 143 134.7 144.7 167.5 54.6IV. North-Western Region Uttar Pradesh 75.8 71.9 70.6 64.4 105.4Punjab 168.6 165 169.7 146.5 187.8Haryana 146.5 139.9 146.6 139.4 152.6All India 100 100 100 100 100.0Source: Annual Statistical Abstracts of various states

9
Chapter-III Agricultural Production Scenario in Orissa
Agriculture is the mainstay of State’s economy and substance of life for the people. The
State Orissa is an agrarian state with Agriculture and Animal Husbandry Sector
contributing more than 22.5 % to the Net State Domestic Product (NSDP) in 2006-07 at
1999-2000 prices and 26.4% in current prices (2004-05) providing employment, directly
or indirectly to 65.0% of the total work force. Nearly 85 per cent of total population live in
rural areas most of them directly or indirectly dependent on agriculture (Table 3.1). Even
though percent of agricultural workers declined from 24.2% of total population in 1971 to
14.9% in 2001, in absolute terms number of agricultural workers remains same at 0.53
crores. This implies that there is stagnation in labour productivity in the agricultural
sector since 1970s. The per capita availability of cultivated land, which was 0.39 ha in
1950, has been drastically reduced to 0.16 ha in 2006, as productivity per land is not
showing any perceptible increase; productivity per farm household is decreased in real
terms.
Table 3.1: Population statistics (Figures in crores)
1971 1981 1991 2001Population 2.19 2.64 3.17 3.68Rural 2.01(91.8) 2.33(88.3) 2.75(86.8) 3.13(85.1)Urban 0.18(8.2) 0.31(11.7) 0.42(13.2) 0.55(14.9)Agricultural workers 0.53(24.2) 0.64(24.2) 0.76(24.0) 0.55(14.9)Cultivators 0.34(64.2) 0.4(62.5) 0.46(60.5) 0.34(61.8)Agril. Labourers 0.19(35.8) 0.24(37.5) 0.3(39.5) 0.21(38.2)Decennial Population Growth Rate 25.1 20.2 20.1 16.25Source: Census of India, different volumes Land use in Orissa The total geographical area of the state is 155.7 lakh ha, out of which 37.3 per cent is
forestland and 41.5 per cent area is suitable for cultivation and 36.12 per cent of area
(61.8 lakh ha) is cropped area. Gross cropped area is 90.09 lakh ha, with a cropping
intensity of 160% in the year 2007. Gross irrigated area is 33.08 lakh ha (36% of GCA).
The ground water development in Orissa is at very low level of development. The level
of ground water development is expressed as the ratio of Net Yearly Draft to Utilisable
Ground Water Resource for Irrigation multiplied by hundred. The stage of ground water
development for the state as whole is also very low i.e. 8.4 per cent compared to 98.2
per cent for Punjab and 80.2 per cent for Haryana and all India average of 30.1 per
10
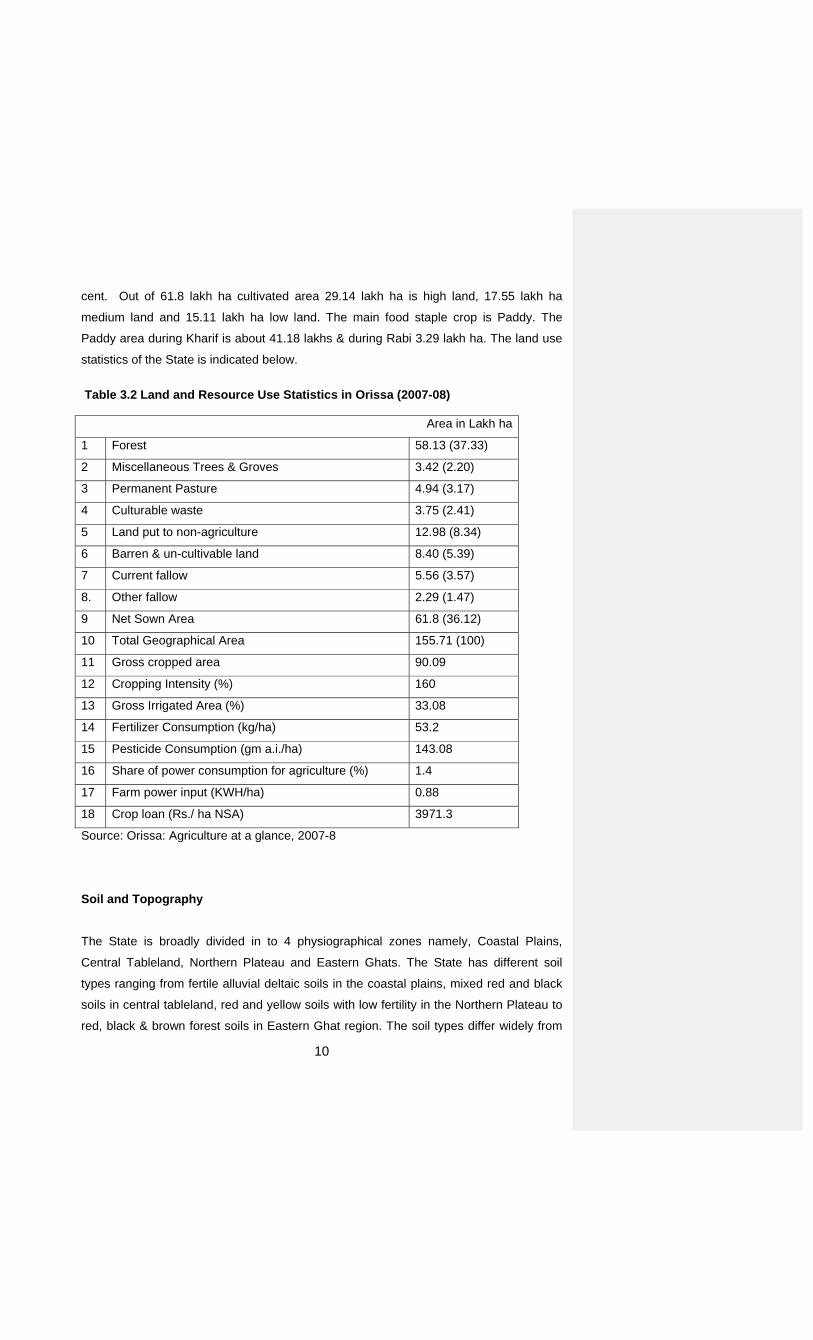
cent. Out of 61.8 lakh ha cultivated area 29.14 lakh ha is high land, 17.55 lakh ha
medium land and 15.11 lakh ha low land. The main food staple crop is Paddy. The
Paddy area during Kharif is about 41.18 lakhs & during Rabi 3.29 lakh ha. The land use
statistics of the State is indicated below.
Table 3.2 Land and Resource Use Statistics in Orissa (2007-08)
Area in Lakh ha
1 Forest 58.13 (37.33)
2 Miscellaneous Trees & Groves 3.42 (2.20)
3 Permanent Pasture 4.94 (3.17)
4 Culturable waste 3.75 (2.41)
5 Land put to non-agriculture 12.98 (8.34)
6 Barren & un-cultivable land 8.40 (5.39)
7 Current fallow 5.56 (3.57)
8. Other fallow 2.29 (1.47)
9 Net Sown Area 61.8 (36.12)
10 Total Geographical Area 155.71 (100)
11 Gross cropped area 90.09
12 Cropping Intensity (%) 160
13 Gross Irrigated Area (%) 33.08
14 Fertilizer Consumption (kg/ha) 53.2
15 Pesticide Consumption (gm a.i./ha) 143.08
16 Share of power consumption for agriculture (%) 1.4
17 Farm power input (KWH/ha) 0.88
18 Crop loan (Rs./ ha NSA) 3971.3
Source: Orissa: Agriculture at a glance, 2007-8
Soil and Topography
The State is broadly divided in to 4 physiographical zones namely, Coastal Plains,
Central Tableland, Northern Plateau and Eastern Ghats. The State has different soil
types ranging from fertile alluvial deltaic soils in the coastal plains, mixed red and black
soils in central tableland, red and yellow soils with low fertility in the Northern Plateau to
red, black & brown forest soils in Eastern Ghat region. The soil types differ widely from

11
highly acidic to slightly alkaline and from light sandy to stiff clays. The soils are mainly
acidic with the degree of acidity varying widely. Further about 4 lakh ha are exposed to
saline inundation, 3.54 lakh ha to flooding and 0.75 lakh ha to water logging, particularly
in the deltaic areas.
Status in modern input use
Table 3.2 depicts land and input use in agricultural sector. Use of modern inputs like
fertilizer (53.2 kg/ha) and pesticide (143.1 gm a.i./ha) is much less when compared to all
India. Share of power consumption by agricultural sector is just about 1.4% of total
power consumption, which is hovering around 20 to 25% for most of the states. Farm
power input per ha is also very low with 0.88 KWH/ha. The above figures indicate that
Orissa agriculture is generally low-input low-output cycle. The most important indicator of
agricultural modernization is seed replacement ratio (SRR), which is percent of area
covered under certified/improved seed for each crop. It is comfortably high for wheat
25%, gram (20%), groundnut (22%), sunflower (19%) and jute (46.5%), while for major
staple crop paddy and oilseed crop mustard it is 12 per cent, for pulse crops like mung,
urd and arhar it is less than 2% (Table 3.3). The low SRR in major staple crop paddy
and pulse crops need to be addressed with wide network of seed production and
distribution centers.
Table 3.3 Seed Replacement Rate (%) for the year 2007-8
Seed replacement Rate (%) Kharif Rabi Total Paddy 11.25 21.83 12.04 Maize 2.01 3.0 2.05 Wheat 25.85 25.85 Mung 1.2 1.43 1.36 Urd 1.07 1.98 1.57 Gram 20.46 20.46 Arhar 1.98 1.98 Groundnut 29.89 22.19 22.19 Mustard 12.2 12.2 Sunflower 100 10.83 19.09 Jute 46.47 46.47 Cotton 1.75 1.75 Source: Ministry of Agriculture, Govt. of India

12
Agrarian Structure Though several factors are attributed for lower agricultural productivity in Orissa, many
consider skewed distribution of agricultural land, small size of operational holding as
major impediments to agricultural growth. An analysis of trends in the number of
operational holdings and area operated reveals that the number of operational holdings in
Orissa has increased substantially from about 30.0 lakh in 1961 to 45.0 lakh in
2001(Statistical Abstract, Orissa 2007). During the same period the total operational area
has increased from 43.0 lakh ha to only 49.8 lakh. Thus within a span of forty years there
has been 50 per cent increase in number of operational holdings which far exceeds the
15.8 percentage increase in operated area. As a result the average area operated per
household has decreased from 1.44 ha in 1961 to 1.10 ha in 2001 showing 30 per cent
decline.
The size-wise distribution of operational holdings and area operated (Table 3.4) shows that
in the year 2004-5, 83.82 per cent of farm operators belonged to marginal farmer and small
farmer categories cultivating less than 2 hectares of land together operate only 52 per cent
of total operational area. On the other hand, the large farmers (operating land area more
than 4 hectares) constituting only 4 per cent of total holdings cultivated a substantial
proportion i.e. 20 per cent of operated area. Thus, in Orissa there is skewed distribution of
land area with its concentration in a few hands of big farmers. However, percentage of area
operated by large farmers shows a declining trend during the period 1961 to 2005.
Moreover, the holdings are fragmented and scattered. Consolidation of holdings has
been completed only in some major irrigation commands.
Table 3.4. Distribution of Operational Holdings and Area Operated by Size Class of Land Holdings in Rural Orissa. Size Class of Operational Holdings (Ha)
% of Operational Holdings % of Operated Area
1961
1971
1981
1991
2004
1961
1971
1981
1991
2004
Less than 1.01 39.42
54.52
54.45
59.99
56.43
6.97 18.6 17.02
22.09
22.73
1.01-2.00 22.92
25.78
26.11
24.34
27.39
12.51
27.32
26.48
30.16
30.39
2.01-4.00 19.65
13.9 14.08
12.02
12.29
20.73
27.06
26.16
27.87
26.45
4.01-10.00 13.66
5.25 4.63 3.36 3.57 31.04
21.56
17.84
16.2 16.08
Above 10.00 4.35 0.55 0.73 0.29 0.32 28.75
5.46 12.5 3.684.35
All Sizes 100 100 100 100 100 100 100 100 100 100Source: various reports of NSSO and agricultural census

13
An inter-state comparison of size of operational holdings shows that during 2001 it was
only 1.10 ha for Orissa whereas it was quite large for agriculturally advanced states like
Punjab (3.31 ha) and Haryana (2.23 ha). It is not only the size of land holding is small in
Orissa, but also most of the farmers are ultra-poor and are nearly resource-less. The
percentage of rural population below poverty line in Orissa is extremely high (49.7%).
Due to the poor resource base, the farmers in Orissa are not in a position to invest in
costly inputs like chemical fertilizer, High Yielding Varieties of seeds, mechanized farm
implements, pump sets etc.

14
Chapter-IV
Methodology
Increased use of inputs, to a certain extent, allows agricultural sector to move up along
the production surface by increasing yield per unit area. Their use may also induce an
upward shift in production function to the extent that a technological change is embodied
in them. It has long been recognized that partial productivity measures, such as output
per unit of individual inputs, are of limited use as indicators of real productivity change as
defined by a shift in a production function. The Total Factor Productivity (TFP) concept,
which implies as index of output per unit of total factor input, measures properly these
shifts or increases in output, holding all inputs constant. Since the publication of Solows
paper in 1957, voluminous literature dealing with the measurement and analysis of
productivity at different levels of aggregation has appeared (Krishna, 1962). Until recently
much of it related mainly to developed countries. However, during last two decades or so
quite a few studies on agricultural productivity have also been brought out for India
(Kumar and Mruthyunjaya 1992; Kumar and Rosegrant 1994). Most studies concentrated
either TFP growth for each crop at state level or TFP growth at regional level. That too
most of the studies carried out for developed states like Punjab, Haryana and indo-
gangatic plains.
Measurement of TFP The relative sect oral growth rates of productivity are important determinants of
structural transformation of economies, and the rate of growth of productivity in the
industrial (Kuznets, 1986) and agricultural sectors (Evenson and Jha, 1973) have been
put forward as a key variable. Since the publication of the pioneering works of Schultz
(1953), Solow (1957), and Griliches (1964), voluminous literature has appeared dealing
with the measurement and analysis of productivity at different levels of aggregation.
Three approaches for the measurement are the most representative: (i) the parametric
approach which models the state of technology by including a time trend in the
production or cost functions and the partial differentiation with respect to time to get
estimates of technological changes; (ii) the accounting approach which approximates
technological change by the computation of factor productivity indices, mainly the rate of
change of total factor productivity indices (Christensen, 1975); and (iii) a recent
approach, termed as 'non-parametric' by Chavas and Cox (1988) and Cox and Chavas
(1990), which identifies a group of implied linear inequalities that a profit maximizing (or

15
cost minimizing) firm must satisfy and estimates the rate of TFP using linear
programming. Coelli and Rao (2003) used this approach and constructed Malmquist
TFP index for agriculture using FAO data base of 93 countries covering the period 1980-
2000. However, the accounting approach is popular because it is easy to implement
requiring no econometric estimation. The use of TFP indices gained prominence since
Diewert (1976, 1978) proved that the Theil-Tornqvist discrete approximation to the
Divisia index is consistent in aggregation and superlative for a linear homogeneous
trans-logarithmic production function. Divisia-Tornqvist index has been used in the
present study for computing the TFP for the crop sector by district, agro-eco-region and
sub-region of the IGP. The output, input, and TFP indices were computed as:
where,
Rjt is the share of jth crop output in total revenue in the year t,
Qjt is the output of jth crop in year t,
Sit is the share of input i in total input cost in year t,
Xit is quantity of input i and
pit is price of input i in year t.
Total output and input index in period t was computed from (4.1) and (4.2) as follows.
TOI (t) = A1 A2 ………..At ……………. (4.3)
TII (t) = B1 B2 ………..Bt …………….(4.4)
Total factor productivity index (TFP)
TFPt = (TOIt / TIIt ) ………..(4.5)
Equations (4.3) to (4.5) provide the index of total output, total input, and TFP,
respectively for year ‘t’. The estimation of input, output, and TFP growth rates for any
specified period has been done by fitting an exponential (or semi-log) trend equation to
Total Output Input (TOI) index
)Q/Q( = TOI/TOI 2/)R+R(1jt-jtj1t-t
11jt-jt∏ = At ………..(4.1)
Total Input Index (TII) index
/2)S+S( 11-ititXX )/( = TII / TII 1it-iti1t-t ∏ = Bt ..………(4.2)

16
the input, output, and TFP indices, respectively. Taking derivative of above equation with
respect to time gives that growth rate of TFP is equal to growth rate of output index
minus growth rate of input index. The annual growth rates of output index and input
index were calculated using exponential trend and tested for statistical significance. TFP
indices were calculated for all major crops in the state i.e, paddy, arhar, mung, urad,
groundnut, seasamum, nigerseed and jute. Both main and by-products are included in
output index. Farm prices are used to aggregate the output. Inputs included in input
index are land, seed, fertilizer, manure, insecticide/pesticide, human labour, animal
labour, machine labour, capital (working and fixed) and irrigation. Inputs are aggregated
using actual prices while farm prices were used to aggregate outputs. Data on input
use of human labour, bullock labour, machine labour, seed, fertilizer, FYM, insecticides,
input and output prices and irrigation are taken from the cost of cultivation of principle
crops in India collected under the “Comprehensive Scheme for the Study of Cost of
Cultivation of Principle Crops,” of the DES, GOI, which is used for measuring the total
factor productivity. At the state level data from 1981 to 2003 has been used to caliculate
TFP growth for major crops. As from early 1980s to 2002-3, Orissa agriculture is
stagnant. Then after there is a sign of improvement in production and yield rates of
major crops. The year 2002-03 is a very special year for Orossa, as it showed the
record low level of production of food grains (only 43.2 million tonnes). (Table 4.1)
Measurement of Sustainability
At the farmers’ level, sustainability concerns are being expressed that the input levels
have to be continuously increased in order to maintain the yield at the old level. This
poses a threat to the economic viability and sustainability of crop production. A
sustainable farming system is a system in which natural resources are managed so that
potential yield and the stock of natural resources do not decline over time. However,
each of the components of sustainable agriculture is complex and some quantifiable
measures are needed to check whether a farming system is sustainable or not. Due to
the multidimensional nature of the concept of sustainability and the difficulties in
determining specific threshold values for these dimensions, it may be even too ambitious
to seek the absolute level of sustainability. We should probably be satisfied with the
relative ranking. Lynam and Herdt (1989) proposed a non-positive trend in TFP as a
good indicator of lack of sustainability of a production system. This has been widely
accepted and used as an indicator of unsustainability of production (see Ethui and
Spencer 1993, Cassman and Pingali 1995, Kumar et al.1998 ). The farming system is

17
sustainable if it can maintain TFP growth over time. In this study, deceleration in TFPG
has been taken as a proxy of unsustainability. The TFPG was classified into two
categories, viz. negative (negative and statistically significant TFPG), and positive
stagnant (statistically significant TFPG).
Table 4.1. Trends in area, production and yield of field crops in Orissa
Area (lakh ha) Production (lakh tones) Productivity (Kg/ha) Year Cereals Pulses oilseeds Total Cereals Pulses oilseeds TotalCereals Pulses oilseeds Total 1970-71 49 8 3.3 60.3 44 5 2.2 51.2 898 552 652 2102.0 1980-81 52 17 7.3 76.3 51 9 4.9 64.9 982 514 658 2154.0 1990-91 50 21 11.5 82.5 59 11 9.5 79.5 1181 551 821 2553.0 1998-99 49 16 8.6 73.6 58 6 4.5 68.5 1180 391 525 2096.0 1999-00 51 16 8.5 75.5 56 7 5.7 68.7 1108 403 668 2179.0 2000-01 49 14 7.0 70.0 50 5 3.7 58.7 1032 365 531 1928.0 2001-02 49 17 8.4 74.4 75 7 5.4 87.4 1526 400 635 2561.0 2002-03 47 13 5.8 65.8 36 4 3.2 43.2 767 349 550 1666.0 2003-04 49 16 7.9 72.9 71 6 4.9 81.9 1444 379 626 2449.0 2004-05 49 17 8.4 74.4 70 6 5.2 81.2 1414 378 627 2419.0 2005-06 49 19 8.2 76.2 74 8 5.5 87.5 1513 422 668 2603.0 2006-07 49 19 8.4 76.4 74 9 6 89.0 1520 444 719 2683.0 2007-08 49 20 8.4 77.4 83 9 6.8 98.8 1695 458 804 2957.0 Source: Handbook of statistics, Government of Orissa, various issues.
Methodology to Estimate Frontier Agricultural Production Function, Efficiency and Factors influencing Frontier Production Function
The measured TFP is an important measure to evaluate the performance of individual
crops and sustainability of a crop production system in a particular regional context.
However, aggregate production performance of a particular region will also be influenced
by changes in crop composition, relative prices of different crops on output side and
social (literacy rate) and economic infrastructure (roads, tractors, markets, GIA, spread
of HYV, use of fertilizer etc) of that region concerned. However, a number of complex
conceptual issues are not adequately captured by an analysis of the kind described
earlier while calculating TFP of individual crops. First, for example, HYVs and
agricultural research has contributed to breaking the seasonality in crop production.
Second, a great deal of efficiency has been introduced in crop production by increase in
literacy rates, roads and other infrastructure at district level/state level. Finally, quality
improvements and crop diversification towards commercial crops have added to the
value of production at the district level aggregate production function. All of these and

18
many other contributions have been estimated by using district level panel data on
agricultural output and inputs since 1971 to 2005. It would be worthwhile to identify these
influences explicitly, which would lead to a more realistic assessment of the progress in
agricultural sector.
The study employed a stochastic frontier production to estimate the technical efficiencies
of resource use at district level from 1974 to 2005 i.e, 25 years of data for 13 districts,
which comprises 455 data points for each variable. The estimated model is time-
invariant technical efficiency frontier model. The model was specified as eqation-4.6.
Yi = Xiβ + (Vi - Ui) --- i=1...N,------------------(4.6)
Where Yi is the logarithm of the value of agricultural production of the i-th district;
xi is a k×1 vector of (transformations of the) input quantities of the i-th district;
β is a vector of unknown parameters;
the Vi are random variables which are assumed to be iid. N (0,σV2), and
independent of the Ui, which are non-negative random variables, which are
assumed to account for technical inefficiency in production, and are often assumed to be
iid. |N (0,σU2)|.
The efficiency will be calculated as exp (-Ui) for the production function where the
dependent variable is logged form.
TEI= f(XI, β) EXP(Vi - Ui)/ f(XI, β) EXP(Vi )--------------------(4.7)
0<TE<1
Yi attains its maximum value of f(XI, β) exp(Vi ) and TE =1 if UI =0. Otherwise UI is not
equal to 0 provides the shortfall of observed output from the maximum potential (frontier)
output.
Model estimation:
The stochastic frontier production function used to analyse resource use efficiency at
district level is given by equation---4.8

19
Ln Yi=β0+ β1ln(GIA)+ β2ln(TOTCTL)+β3ln(NPK_Q)+ β4ln(RAINL) + β6 ln(HYV)+ β7
ln(RURALLIT)+β8 ln(RURAGR)+ β9 ln(LROAD)+ β10ln(TRAC_T) + β11 ln(CER_A)+ β12
ln(PULSE_A)+β13 ln(OILS_A)+ Vi - Ui---------(4.8)
Where
Y= actual value of agricultural output of ith district (Rs.lakhs)
GIA= Gross Irrigated Area (000 ha)
TOTCTL=Total Cattle Population in the District (with adult cattle =1, goat, sheep =0.5)
NPK_Q= Quantity of Fertilizers (N+1.3*P+1.3*K) used in tonnes
RAINL = Annual Rainfall (mm)
HYV = Area Under High Yielding Varieties (000 ha)
RURALLIT= Rural Literate Population (in lakhs)
RURAGR= Agricultural worker population (in lakhs)
LROAD= Length of Road (km)
TRAC_T= Number of tractors in district
CER_A= cereal area (000 ha)
PULSE_A=pulses area (000 ha)
OILS_A= oilseeds area (000 ha)
The same production function is fitted with least squire estimates with cobb-douglas
production function. The parameter estimates are direct elasticities of each input with
respect to output in both the models. The frontier production function is estimated by
using
1. Time-invariant Frontier production Function (Cobb-Douglas)
2. Time –decaying Frontier production Function (Cobb-Douglas)
Using the elasticities of Gross Revenue with respect to area under cereals, pulses and
oilseeds, one can easily estimate the value of marginal product (EVMP) for one unit ( per
ha) shift in area to cereals, pulses and oilseeds.
EVMP(CER_A )= b*(Y/CER_A)-------------------------- (4.9)

20
EVMP(PULSE_A )= b*(Y/PULSE_A)-------------------(4.10)
EVMP(OILS_A )= b*(Y/OILS_A)------------------------(4.11)
Estimation of Marketed Surplus of Principal Crops
The study of marketed surplus response to product price movements was initiated by
Raj Krishna and Behrman. It was applied to the study of marketed surplus of food grains
in Northern India by Bardhan and by Shah and Pandey. In these studies, attention was
centered on the response of marketed surplus to product price changes, output level,
and land tenure systems. We have used the below modified version of Raj Krishna
model given by Janvery and Kumar (1981) to estimate marketed surplus of major crops
in Orissa. The price elasticity of marketed surplus for each crop has been measured
under pure price inflation as :
Price elasticity of marketed surplus = - C/M *Price elasticity of consumption -C/M *PQ/I*Income elasticity of demand------------------------------(4.12)
C= consumption
M= marketed surplus
P= price of commodity
Q= quantity of output
I= Income

21
Primary Field Survey
Further a field survey has been carried out in selected districts/blocks/villages to find out
marketed surplus, input-output ratios, and price trends across different regions in the
agricultural year 2007. For this purpose six districts based on the % area irrigation is
selected for intensive field survey. i.e., from Coastal Orissa region Jagatsinghpur with
highest irrigated area(63%), and Dhenkanal with lowest irrigated area (42%); from KBK
region Malkangiri, Koraput, Nowrangpur and Kalahandi have been selected for survey.
From each district, one block and from each block, two villages have been selected
randomly. From each village 10 farmers have been selected for intensive field survey.
Totally 6 villages and 140 farmers comprise our sample. Variables like acreage under
each crop cost of cultivation, factor shares of fertilizer, pesticide, irrigation, labour,
education level of farmers, farm assets, input/output prices, institutional factors like credit
availability, membership of society, crop insurance, regulated markets, marketed
surplus, consumption pattern for the year 2007.

22
Chapter-V Results and Discussions
Changes in Indices of Area, Yield and Production The increase in area and production of the crop is highly associated with their relative
profitability (Kumar and Mruthyunjaya, 1989, Kumar and Resegrant, 1993). The table 5.1
presents changes in indices of area, production and yield. The average area for paddy
during 1970s is 98.6 and production is 114.8 with yield index of 1166. While in the 1980s
even though area is stagnant, the production indices increased to 143.1, due to increase
in yield index to 1478. While in 1990s there is significant upward movement in both area
index to 101.8 and yield index to 1888. During the early 2000s again there is significant
increase in yield index to 2124, which contributed to production index increased to
212.6. Overall, growth rate of yield index is much higher (2.43% per annum) than the
growth rate in area index (0.15%). While growth rate in production index is 2.58 during
the study period. Hence we can conclude that, the gains in rice output since 1970s to
early 2000s have come essentially from the steady increase in yield. Rao(1994) has
argued that output growth has come essentially from the better utilization of the existing
infrastructure, stepping up the use of modern inputs and extending the green revolution
to new areas.
Arhar, mung, biri, kulthi, gram, fieldpea, cowpea and lentil are the pulse crops grown in
the State. The major crops are arhar, mung, biri and kulthi. Pulses are grown mainly in
uplands during Kharif season predominantly in inland districts & in rice fallows during
Rabi season, mostly in coastal districts under available moisture condition. Mung & biri
are also grown as third crop in summer under irrigated condition. Post monsoon rains,
mostly govern the Rabi coverage of pulses in rice fallows. Among pulse crops, area
index for arhar is higher (75.7) followed by urad(28.0) and mung (18.8) with
corresponding production index of 68.8, 23.7 and 17.4 in the early 2000s. Area index for
all pulse crops decreased since 1980s, area index for arhar decreased by 3.04% per
annum, urad decreased by 10.7% per annum and mung decreased by 7.7% per annum.
In absolute terms area index for arhar decreased from 95.2 to 76, while area under urad
decreased from 114.8 to 28.0, and for mung from 84.2 to 18.8. Arhar yield index
increased from 880 to 907 during the same period, while yield index of urad decreased
from 949 to 838 and mung yield index decreased from 1026 to 929 with annual growth
rates of 0.68%, -1.29% and –0.66% respectively. Hence overall production growth rate
23
for all pulse crops is negative. For arhar, growth rate of production is –2.36, urad –11.99
and for mung it was –8.36. The above figures indicates that, production of pulses
decreased in Orissa, mainly due to significant decrease in area accompanied by
stagnant yield.
Groundnut, til, castor, mustard, niger, sunflower, safflower, soybean, linseed are the
Oilseed crops grown in the State. Out of these, groundnut, til, mustard and niger are
major oilseeds crops grown. Now sunflower is gaining popularity in the state. These
crops are grown in upland during Kharif season and in riverbeds & rice fallows during
Rabi season. Among oilseed crops, area index for groundnut is higher (116.0) followed
by nigerseed (74.5) and sesamum (70.0) with corresponding production indices of 146.6,
79.5 and 54.0 in the early 2000s. Like pulse crops area under all oilseed crops
decreased since 1980s, area under groundnut decreased by 1.75% per annum,
nigerseed decreased by 4.85% per annum and sesamum decreased by 6.73% per
annum. In absolute terms area index for groundnut decreased from 292.3 to 116.0, while
area index for nigerseed decreased from 80.0 to 74.5, and for sesamum from 84.8 to
70.0 since 1980s. Yield index of groundnut increased from 1129 to 1212, nigerseed
yield index decreased from 1210 to 1049 and sesamum yield index decreased from 863
to 766 with annual growth rates of 1.69%, -3.51% and -3.25% respectively. As a result of
higher negative growth rate in area for all oilseed crops, production growth rate is
negative with -0.06 % per annum for groundnut, -8.35% for nigerseed and -9.99 for
sesamum.
In the case of Jute, major commercial crop of Orissa also area index was reduced from
84.3 to 33.3 with a negative growth of 5.83% per annum since early 1970s. However
there is perceptible increase in yield index during the period from 1003 to 1521, with a
growth rate of 2.48% per annum. However because of higher negative growth in area
compared to lower positive growth in yield, the overall production index is reduced from
84.4 to 51.9 with a negative growth of 3.35%.

24
Table 5.1: Index of area, yield and production of crops in Orissa
Crop Period Area Production Yield(Kg/ha) Paddy 1974-80 98.6 114.8 1166 Base year: 1981 1981-90 96.6 143.1 1478 1991-00 101.8 192.2 1888 2001-03 99.8 212.6 2124 Growth (%) 0.15 2.58 2.43 Mung 1981-90 84.2 87.3 1026 Base year: 1981 1991-00 38.9 37.4 937 2001-03 18.8 17.4 929 Growth (%) -7.70 -8.36 -0.66 Urad 1984-90 114.8 108.6 949 Base year 1984 1991-00 53.2 47.4 859 2001-03 28.0 23.7 838 Growth (%) -10.70 -11.99 -1.29 Arhar 1994-00 95.2 83.7 880 Base year 1994 2001-03 75.7 68.8 907 Growth (%) -3.04 -2.36 0.68 Groundnut 1975-80 124.1 107.4 857 Base year 1981 1081-90 292.3 332.0 1129 1991-98 116.0 146.6 1212 Growth (%) -1.75 -0.06 1.69 Sesamum 1997-2000 84.8 73.8 863 Base year 1997 2001-03 70.0 54.0 766 Growth (%) -6.73 -9.99 -3.25 Nigerseed 1997-00 80.0 95.7 1210 Base year 1997 2001-03 74.5 79.5 1049 Growth (%) -4.85 -8.35 -3.51 Jute 1973-80 84.3 84.4 1003 Base year 1981 1981-90 75.3 111.2 1464 1991-96 33.3 51.9 1521 Growth (%) -5.83 -3.35 2.48

25
The nominal cost per unit of output is showing an upward trend in spite of growth in yield
due to technical change. However, the question must be assessed whether the increase
in nominal unit cost of production came mostly from an increase in prices of farm inputs
at a rate higher than the rise in productivity or due to higher use of inputs in real terms
for obtaining the same yield. This question was examined by assessing cost of
production at constant prices. The unit cost of production was deflated by an input price
index series to obtain the cost of production at constant prices. Annual growth rate in
real cost of production is computed and the results are given in Table 5.2.
Real price of inputs (real cost) have been increased for all the crops except arhar and
sesamum. While real price of output increased for only few crops like urad, mung,
groundnut, jute and decreased for paddy, arhar, sesamum and nigerseed. Even for the
crops for which real price is increased, the increase in real price is less than the increase
in the real cost. Which indicates that the terms of trade has gone against agricultural
sector. Real cost of production index for rice increased from 115.4 to 163.3 from 1970s
to early 2000s, the real price increased from 83.9 to 56.0 during the same period with a
growth rate of 1.8% per annum in real cost and –0.85% per annum in real price of output
in paddy.
Among pulses, real cost of production increased for urad and mung from 103.8 to 119.1
and 110.2 to 138.7 respectively since early 1980s. While real price of output for urad and
mung decreased from 104.8 to 94.4 and from 114.3 to 111.8 respectively with a CAGR
of 0.61% and 1.1% respectively. Even though, there is a significant hike in real price of
output during 1990s for both urad and mung, they tapered off in the early 2000s. In the
case of arhar, both real cost and real price of output decreased since early 1990s,
however, decrease in real price is much higher than the decrease in real cost, which
might have effected profitability of arhar adversely.

26
Table 5.2: Real Input-output price parity of crops in Orissa
CROP YEAR Real Price Input Index
Real Price Output Index
Paddy 1974-80 115.4 83.9 1981-90 124.3 75.7 1991-00 163.3 78.1 2001-03 163.3 56.0 Growth (%) 1.80 -0.85 Mung 1981-90 110.2 114.3 1991-00 135.9 140.0 2001-03 138.7 111.8 Growth (%) 1.8 1.1 Urad 1984-90 103.8 104.8 1991-00 124.1 131.1 2001-03 119.1 94.4 Growth (%) 1.39 0.61 Arhar 1994-00 96.7 100.2 2001-03 89.7 73.5 Growth (%) -1.03 -5.78 Groundnut 1975-80 108.1 131.7 1081-90 125.3 138.4 1991-98 168.2 145.6 Growth (%) 2.46 0.74 Sesamum 1997-2000 91.5 94.7 2001-03 84.3 79.0 Growth (%) -1.96 -4.51 Nigerseed 1997-00 119.2 98.5 2001-03 136.8 83.8 Growth (%) 4.91 -3.71 Jute 1973-80 112.7 90.3 1981-90 131.6 85.0 1991-96 158.5 97.5 Growth (%) 2.13 0.65

27
In the case of oilseeds, real price of inputs increased from 108.1 to 168.2 for groundnut,
from 119.2 to 136.8 for nigerseed from 1970s to 1990s. While real input cost is slightly
decreased for sesamum from 91.5 to 84.3 during late 1990s and early 2000. The growth
rate of real input cost is higher for nigerseed (4.91% per annum), followed by groundnut
(2.46) and for sesamum it was negative (-1.96 per annum). Real output price for
sesamum reduced from 94.7 to 79.0, for nigerseed it reduced from 98.5 to 83.8, while for
groundnut it slightly increased from 131.7 to 145.6. For all oilseeds the growth in real
price of output is much less than the growth rate in real input cost. It also indicates that
the prices movement for oilseed farmers is unfavourable during the 1990s and 2000. In
the case of commercial crop jute, real input cost index reduced from 112.7 to 158.5 with
a growth rate of 2.13 % per annum. While the real price of output increased from 90.3 to
97.5 with a growth rate of 0.65% per annum.
The main reason for the raise in real cost of production for most of the crops is due to
increase in use of purchased inputs and also transformation of agricultural sector from
subsistence to commercial farming both input and output side. The adoption of yield
enhancing inputs like HYVs, fertilizer, pesticides, irrigation pump sets, and tractors
increased since early 1980s, even though phase of transformation is slow. However,
growth in yield is slower when compared to increase in input use due to structural
bottlenecks in Orissa agriculture, such as monoculture of paddy, lower level of market
and other agricultural efficiency improving technology. In the 1990s and early 2000s
due to due to liberalization and globalisation, agricultural commodity prices decreased in
Orissa inline with international markets. As a result, real output price for most of the
commodities decreased or increased at slower phase than real cost of production.
Profitability and Costs Profitability and cost of production in nominal terms has been given in Table 5.3.
Profitability of agricultural sector has come down significantly for all crops even in
nominal terms in TE 2003 compared to 1990s. The mean cost of cultivation for paddy in
1980s is Rs.1426.9 per ha, while gross returns are Rs.1745.9 per ha with a resulting
profit margin of 23.1% over costs. But due to growth rate in costs per ha (10.36%) is
much higher than the growth in gross returns per ha (9.43%), the profit margin declined
to 0.6% in early 2000s. The cost per quintal of output increased from Rs.70.4 in 1970s
to Rs.440.6 TE 2003 with a growth rate of 8.6%. While profit per quintal of paddy is

28
increased initially from Rs.15.7 in 1970s to Rs.39.7 in 1990s but again it declined to Rs.
2.5 per ha in TE 2003.
Cost of cultivation for mung increased from Rs.1393.8 per ha in 1980s to Rs.5500 per ha
in TE 2003 with a growth rate of 9.44% per annum. While gross returns per ha increased
from Rs.1766.9 per ha to Rs. 5569.9 per ha during the same period with a growth rate of
8.03% per annum. As growth in costs is higher than growth in gross returns, profit per ha
came down from Rs.373.1 per ha to Rs. 69.9 per ha with a negative growth of 1.41% per
annum. Consequently profit margin declined from 26.8% to 1.3 % over costs. While cost
per quintal of output increased from Rs.429.2 to Rs.1896.5 and profit per quintal of
output declined from a profit of Rs.114.9 to Rs. 24.1 per quintal. Cost per quintal of
output increased by 7.9% per annum, while profit per quintal of output declined by 0.8%
per annum.
Gross returns and costs per ha for urad are somewhat higher side than mung, profit per
ha and profit margin is also slightly higher than mung. Cost per quintal of output is lower
than mung, while profit per quintal is higher than mung. Gross returns per ha increased
from Rs.2341.3 per ha to Rs. 6147.4 per ha from 1980s to TE 2003. The gross returns
per ha increased by 7.17%, while costs per ha increased at higher level (9.54%). As a
result profit margin decreased from 45.1% to 0.8 % over costs. However cost and profit
per quintal is more for both urad and mung compared to main crop paddy. For arhar also
cost of cultivation and cost of production are similar to other pulse crops like urad and
mung. Profitability of arhar and other two pulse crops increased during 1990s and then
after it decreased in 2000s. Increase in growth rate of gross returns per ha is lower
(2.47% per annum) than increase in costs per ha (4.85%). As a result profit margin
decreased from 10.0 % over costs to 0.1 % during the same period.

29
Table 5.3: Profitability of crops in Orissa
CROP
YEAR
Gross Returns Rs./ha
Cost Rs./ha
Profit Rs./ha
Margin%
Cost Rs./q of output
Profit Rs./q of output
Paddy 1974-80 1745.9 1426.9 319 22.4 70.4 15.7 1981-90 4086.6 3393.9 692.7 20.4 126.8 25.9 1991-00 11704.4 10448.8 1255.6 12.0 330.0 39.7 2001-03 15385.5 15300 85.5 0.6 440.6 2.5 Growth (%) 9.43 10.36 -0.93 -3.3 8.6 -0.5 Mung 1981-90 1766.9 1393.8 373.1 26.8 429.2 114.9 1991-00 4416.8 3786.2 630.6 16.7 1284.5 213.9 2001-03 5569.9 5500 69.9 1.3 1896.5 24.1 Growth (%) 8.03 9.44 -1.41 -2.7 7.9 -0.8 Urad 1984-90 2341.3 1614.1 727.2 45.1 338.5 152.5 1991-00 5342.3 4196.9 1145.4 27.3 1023.1 279.2 2001-03 6147.4 6100 47.4 0.8 1509.2 11.7 Growth (%) 7.17 9.54 -2.37 -3.8 8.0 -1.3 Arhar 1994-00 5698.8 5181.3 517.5 10.0 1211.8 121.0 2001-03 6406.1 6400 6.1 0.1 1473.3 1.4 Growth (%) 2.47 4.85 -2.38 -3.9 4.0 -1.3 Groundnut 1975-80 2199.1 1771.1 428 24.2 204.0 49.3 1081-90 6010.6 4165.1 1845.5 44.3 358.9 159.0 1991-98 13700.6 10694.5 3006.1 28.1 881.9 247.9 Growth (%) 10.46 10.4 10.27 -0.14 8.72 8.57 Sesamum 1997-2000 5436.9 4929.7 507.2 10.3 1670.3 171.9 2001-03 5425.3 5400 25.3 0.5 2078.9 9.7 Growth (%) 0.52 5.43 -4.91 -9.4 4.5 -2.7 Nigerseed 1997-00 5043.5 4753.8 289.7 6.1 1123.2 68.4 2001-03 4926.6 4900 26.6 0.5 1406.0 7.6 Growth (%) 0.99 5.56 -4.57 -1.8 4.6 -2.5 Jute 1973-80 2018.7 1704.9 313.8 18.4 132.1 24.3 1981-90 6035.3 4364.9 1670.4 38.3 206.4 79.0 1991-96 13468.3 9994 3474.3 34.8 487.1 169.3 Growth (%) 11.2 10.52 14.89 2.6 7.83 11.16

30
All oilseed crops like groundnut, sesamum and niger are profitable in 1990s, while their
profitability decreased in TE 2003. Among all oilseeds, gross returns and costs per ha
for groundnut is much higher with Rs.13700.6 and Rs.10694.5, with a profit per ha of
Rs.3006.1. Both gross return and cost per ha increased by about 10% per annum from
1975 to 1998. Even though profit margin is consistently higher than other crops for
groundnut, which is 24 % in 1970s, increased to 44 % in the 1980s, however it again
reduced to 28 % in the 1990s its growth rate per annum is negative (-0.14%). Its profit
per quintal of output increased from Rs.49.5 in 1970s to Rs.247.9 in 1990s, with a
CAGR of 8.57%.
Gross returns and also costs per ha for both sesamum and niger are about Rs.5000 to
Rs.6000 during late 1990s and TE 2003. CAGR of costs are much higher (about 5.5%)
while gross returns are less than 1% per annum. As a result profit per ha and profit
margin declined significantly. Cost per quintal of output increased from Rs.1670.3 to
Rs.2078.9 for sesamum and from Rs.1123.2 to Rs.1406.0 for nigerseed with a growth
rate of 4.5 % and 4.6 % per annum respectively. In case of jute gross returns and costs
have been increased in double-digit growth from 1970s to 1990s. Gross returns have
increased from Rs. 2018.7 to Rs.13, 468.3 per ha, while costs per ha increased from
Rs.1704.9 to Rs.9994.0 per ha. Profit margin increased from 18.4 % to 34.8 % during
the same period.
Overall, profitability in absolute terms and also growth rate is higher for groundnut and
jute compared to other crops. While for all other crops even though profitability increased
during 1990s, it came down in TE 2003. For most of the crops, increase in cost per ha is
much higher than the increase in gross revenue hence there is decline in profitability and
profit margins in early 2000s.And the productivity is stagnant for all crops including
paddy which is a major staple crop of Orissa.
Trends in Partial Productivity of Land, labour and Fertilizer The indices of land, labour and fertilizer partial productivity were calculated for all the
years and presented averages and for 1970s, 1980s, 1990s and TE 2003. Annual
growth rates are also calculated for the whole period. The results are presented in Table
5.4. Land productivity was increased for paddy, groundnut and jute, while for pulse crops
(Urad and Mung) land productivity declined. Labour productivity growth again positive for
paddy, groundnut and jute, while negative for urad and mung. While partial productivity

31
growth of fertilizer is positive for urad and for all other crops it was negative. The notable
productivity gains have come from more efficient use of existing inputs of land and
labour. The increased labour productivity was a result of reduced use of labour on
account of mechanization. Similarly, the increase in land productivity has taken place in
the paddy, groundnut and jute on account of increase in land saving modern inputs,
particularly fertilizer. It is to be noted that there is significant fall in the productivity of
fertilizer because increasing amounts of fertilizer are being used to maintain current yield
levels. The achievement of relatively high levels of fertilizer use on paddy has shifted
concern from simply increasing the level of use to improving the efficiency of fertilizer
use. Yield-based growth has rapidly increased nutrient removal from the soil at a rate
that has not been matched by balanced growth in the supply of nutrients through
chemical and organic fertilizers. The result of unbalanced application of fertilizers has
been a decline in the efficiency of fertilizer use over time (Kumar and Mruthyunjaya
1992).

32
Table 5.4: Indices of Partial factor productivity of labour, fertilizer and land in Orissa CROP YEAR Land Labour Fertilizer
Paddy 1974-80 116.6 96.4 114.4 1981-90 147.8 106.5 73.3 1991-00 188.8 133.0 39.6 2001-03 212.4 146.6 30.7 Growth (%) 2.43 1.68 -5.43 Arhar 1994-00 92.5 103 247.0 2001-03 119.8 116.8 230.5 Growth (%) -0.22 -0.30 0.17 Mung 1981-90 102.6 96.8 13.0 1991-00 93.7 97.5 5.4 2001-03 92.9 89.7 4.0 Growth (%) -0.66 -0.38 -3.20 Urad 1984-90 94.9 92.8 68.0 1991-00 85.9 73.6 163.0 2001-03 83.8 76.2 271.4 Growth (%) -1.29 -1.86 6.61 Groundnut 1975-80 85.7 97.4 90.9 1081-90 112.9 128.7 75.7 1991-98 121.2 213.7 41.5 Growth (%) 1.69 2.86 -5.05 Jute 1973-80 100.3 102.3 61.2 1981-90 146.4 148.4 44.7 1991-96 152.1 163.9 32.8 Growth (%) 2.48 2.66 -4.38
Trends in Total Factor Productivity and Real Cost of Production
The average annual growth rates of output, inputs, TFP and real cost of production
indices are given in Table 5.5. The results revealed that for paddy, the input index during
1974-2003 has risen at the rate of 1.49% whereas it declined for all other crops, (-) 7.16
percent for mung, (-) 9.74 percent for urad, (-) 3.47 percent for arhar, (-) 1.12 percent for
groundnut, (-) 5.60 percent for sesamum, (-) 6.86 percent for nigerseed and (-) 4.99
percent for Jute. With the increase in inputs, output growth of paddy increased by
2.57% per annum, output growth of groundnut is also in the positive range due to
positive technological change is higher than negative growth in input index. For mung,

33
urad, sesamum and nigerseed output declined by more than 5 per cent per annum,
while for jute and arhar decline in output index is less than 5 percent. Overall TFP index
is raised by 1.08 per cent for paddy, by 1.13 percent for Arhar, by 1.21 percent for
groundnut and by 1.56 percent for jute. While TFP index is declined by 1.17 percent for
mung, by 2.44 percent for urad, by 4.37 percent for sesamum and by 1.62 percent for
nigerseed. Real cost of production per quintal is declined by 1.53 percent for paddy, by
2.29 percent for arhar, by 1.77 percent for groundnut, by 3.98 percent for nigerseed, and
by 2.26 percent for jute, while it is increased by 2.55 percent for sesamum, by 1.83
percent for urad and 0.82 percent for mung. The productivity or technical change is
responsible for 41.97 percent of output growth for paddy, 13.99 percent for mung and
20.0 percent for urad. The productivity change or technological change is responsible for
41 percent of total output growth in paddy.
The stagnation in Orissa agricultural sector further accentuated by slow growth in TFP
growth (1.08% per annum) of paddy in the state, which occupy about 80% of the
cropped area. Negative TFP growth in major pulse and oilseed crops like mung, urad,
sesamum and niger, discouraged crop diversification towards these crops. Which
ultimately effected expansion of area under these crops, and hindered growth in gross
cropped area and cropping intensity. Cropping intensity is still far less than easily
achievable 200% in water abundant state.

34
Table 5.5: TFP and cost of production per unit of output at constant price
Crop Period Input Index
Output Index
TFP Indice
s
Real cost of production
at constant price (Rs/Q)
Paddy 1974-80 108.0 114.6 106.0 55.2 1981-90 122.3 142.4 115.8 47.0 1991-00 143.5 191.1 133.9 39.7 2001-03 152.7 212.3 138.7 38.0 Growth 1.49 2.57 1.08 -1.53 Mung 1981-90 90.8 87.6 95.3 285.3 1991-00 43.3 37.8 85.2 310.2 2001-03 22.7 17.3 77.2 324.7 Growth -7.16 -8.33 -1.17 0.82 Urad 1984-90 117.0 108.0 92.7 262.8 1991-00 60.4 46.1 72.1 322.4 2001-03 32.7 23.0 69.8 326.7 Growth -9.74 -12.18 -2.44 1.83 Arhar 1994-00 84.4 83.0 98.5 1056.3 2001-03 67.0 68.7 103.8 969.3 Growth -3.47 -2.34 1.13 -2.29 Groundnut 1975-80 117.3 107.3 90.4 174.0 1081-90 303.8 336.4 110.9 135.6 1991-98 125.0 150.0 122.3 123.5 Growth -1.12 0.09 1.21 -1.77
Sesamum 1997-2000 83.5 74.3 88.3 1654.3
2001-03 70.3 54.3 77.0 1802.8 Growth -5.60 -9.97 -4.37 2.55 Nigerseed 1997-00 77.8 96.0 127.1 858.8 2001-03 66.7 79.3 118.0 742.5 Growth -6.86 -8.48 -1.62 -3.98 Jute 1973-80 93.8 84.6 91.3 85.9 1981-90 91.4 110.5 119.7 55.9 1991-96 41.3 51.3 120.5 55.7 Growth -4.99 -3.43 1.56 -2.26

35
Inter-district and regional variations
It is observed that there are wide variations in agricultural performance in Orissa across
zones and districts. There are broadly four agro-climatic zones in Orissa : Northern
Plateau, Central Table Land, Eastern Ghat and Coastal Plain. Though Orissa has 30
districts since 1993, we have presented the data for the old undivided 13 districts for the
purpose of showing changes in different agricultural indicators since 1971 onwards and
also for application of econometric analysis. Table 5.6 shows that during 2006 yield rate
of foodgrains was the highest in Coastal Plain followed by Central Table Land, Eastern
Ghat and Northern Plateau in that order. Inter-district comparison in yield rate of food
grains shows that it ranges from the highest 1481 kg/ha in Baleswar to the lowest 880.5
kg/ha in Kalahandi. Irrigation is the most important determining factor of agricultural
productivity. GIA as per cent of GCA is the highest, 54.2 per cent, for Baleswar district
and the lowest, 23.9 per cent, for Kendujar. The districts baleswar and sambalpur are
ranked highest in fertilizer consumption per ha GCA with 98.8 kg per ha and 77.1 kg per
ha respectively. While districts Dhenkanal and Phulbani are ranked lowest with 22.0 and
20.6 kg per ha. In the same way coastal (53.4kg/ha) and central (48.5kg/ha) regions
ranked highest in fertilizer consumption per ha, while northern plateau region ranked
lowest with 30 kg per ha as in the case of yield of food grains. Baleswar (Rs.5338 per
ha) and Dhenkanal (Rs.4379 per ha) are highest in credit uptake per ha of GCA, while
Kalahandi (Rs.1333.8) and Phulbani(Rs.1171.8) are ranked lowest. Central region
ranked highest, while eastern region ranked lowest in credit uptake per ha of GCA.
Cuttack, Puri and baleswar three coastal districts ranked highest in rural literacy rate,
while Korapur, Kalahandi and Mayurbhan are ranked lowest. As expected coastal region
ranked highest in rural literacy, while eastern ghat region ranked lowest.
A careful analysis of the data for different districts reveals that the four coastal districts
(Balasore, Cuttack, Puri and Ganjam) and two districts of Central Table Land Area
(Sambalpur and Bolangir) are agriculturally more advanced than other districts. The
agricultural success of four coastal districts is due to well-developed irrigation facilities
and vast tracts of plain and fertile land comprising alluvial soil. Districts of northern
plateau zone namely Mayurbhanj, Keonjhar and Sundergarh, and Koraput of eastern
ghat area are found to be the most backward districts.

36
Table 5.6. Inter-regional and inter-district variations in important agricultural sector indicators TE 2006 Food
grain (000 ha)
Food grain Yield
(kg/ha)
Food grain
production (000
tonnes)
NSA (000 ha)
GCA (000 ha)
Cropping intensity
(%)
Fertilizer Consumption
(Mt)
Fertilizer Consumption
per ha (kg/ha)
Rainfall (mm)
GIA (000 ha)
GIA%/GCA crop loan (Rs./ha)
average farm size (ha)
% rural Literacy
I NORTHERN PLATEAU
982.4 1206.1 1184.8 961.0 1285.0 100.0 38724.0 30.1 342.4 26.6 2127.5
1.4 32.6
1 Mayurbhanj 394.4 1395.6 550.44 380 488.94 128.7 17846.0 36.5 1029.6 143.33 29.31 1885.1 1.25 28.8 2 Kendujhar 294.49 1084.7 319.43 281 421.05 149.8 11805.0 28.0 1006.9 101.02 23.99 1964.8 1.28 34.5 3 Sundargarh 293.48 1073.1 314.93 300 374.97 125.0 9073.0 24.2 1090.5 98.03 26.14 2626.1 1.73 34.4 II CENTRAL
TABLE LAND
1663.3 1341.1 2230.6 1432.0 2203.6 100.0 106874.0 48.5 699.1 31.7
3023.3
1.5 37.0
4 Bolangir 525.07 1279.4 671.76 437 660.29 151.1 21001.0 31.8 862.0 181.82 27.54 1531.6 1.61 30.5 5 Sambalpur 738.42 1581.1 1167.5 637 941.67 147.8 72630.0 77.1 1059.6 368.5 39.13 3202.9 1.71 38.3 6 Dhenkanal 399.79 978.9 391.34 358 601.63 168.1 13243.0 22.0 1090.1 148.75 24.72 4379.3 1.22 42.3 III EASTERN
GHAT 1684.2 1107.2 1864.8 1459.0 2291.8 100.0 87349.0 38.1 681.9 29.8
1432.4 1.7 22.4
7 Koraput 804.18 1273.5 1024.11 737 1127.48 153.0 43240.0 38.4 1151.0 324.07 28.74 1581.0 1.7 14.3 8 Kalahandi 668.81 888.3 594.13 523 839.3 160.5 37427.0 44.6 1051.0 278.29 33.16 1333.8 1.89 23.5 9 Phulbani 211.16 1167.5 246.53 199 324.97 163.3 6682.0 20.6 1043.9 79.51 24.47 1171.8 1.38 29.5 IV COASTAL
PLAIN 2510.1 1202.3 3017.8 1802.0 3180.1 100.0 169929.0 53.4 1426.0 44.8
3854.7 1.10 45.8
10 Baleswar 467.24 1481.3 692.1 403 575.66 142.8 56849.0 98.8 1203.5 312.05 54.21 5338.4 1.19 48 11 Cuttack 802.19 1023.1 820.75 549 1028.64 187.4 43427.0 42.2 1371.9 480.44 46.71 3539.3 1.05 51.5 12 Puri 597.43 1115.7 666.55 397 740.41 186.5 32282.0 43.6 1043.9 313.81 42.38 3586.7 1.01 50.9 13 Ganjam 643.2 1303.5 838.41 453 835.34 184.4 37371.0 44.7 1149.5 319.67 38.27 3458.2 1.03 32.7 Orissa 6839.86 1206.0 8297.98 5654 8960.35 158.5 402876 45.0 3149.29 35.15 2783.0 1.34 34.5

37
Table 5.7: District-wise trends in Production (000 t), and yield (quintals/ha) of cereals, pulses, oilseeds and other crops
Period Northern Plateau Central Table Land Eastern Ghat Coastal Plain Cereal production
Mayurbhanj Keonjhar SundergarhDhenkanal BolangirSambalpurKoraput KalahandiPhulbani Balasore Cuttack Ganjam Puri 1971-80 308.1 191.2 198.7 259.3 267.1 569.0 363.6 219.9 98.7 360.4 607.1 365.9423.9 1981-90 345.6 193.9 193.1 261.3 360.0 672.9 438.0 251.3 127.1 416.4 649.1 455.3479.4
1991-2000 423.0 236.4 217.7 336.1 425.6 764.1 609.7 409.4 225.8 562.5 584.0 523.5581.8 2001-05 503.2 297.1 240.0 403.2 487.4 1020.3 757.0 438.2 191.7 730.6 608.5 534.9566.7
Pulses production 1971-80 4.8 2.1 4.4 4.5 2.9 3.3 21.3 10.1 5.6 1.2 12.3 6.1 3.8 1981-90 10.6 7.3 7.5 14.1 10.1 5.7 35.4 22.2 11.7 1.7 15.4 14.1 5.2
1991-2000 7.9 7.1 6.7 10.2 7.7 7.7 31.5 19.4 6.7 1.7 23.2 14.5 9.6 2001-05 7.3 8.1 4.0 8.6 11.5 7.7 21.3 23.2 7.1 1.7 23.6 22.1 10.0
Oilseed production 1971-80 6.3 3.5 5.7 24.7 13.9 36.4 15.7 16.6 7.7 6.6 53.6 30.8 16.8 1981-90 12.7 15.6 14.7 89.5 42.0 76.9 29.9 42.2 17.0 32.1 171.8 75.9 42.9
1991-2000 8.0 5.5 6.5 26.8 17.5 43.6 26.2 17.0 13.3 10.2 42.3 19 21.7 2001-05 2.8 0.6 1.5 4.8 10.1 20.8 8.1 2.2 1.0 3.4 8.6 7.4 4.9
Cereals Yield 1971-80 8.27 7.97 7.67 7.86 8.29 9.59 8.51 7.24 8.02 8.34 9.46 10.00 9.89 1981-90 10.15 8.77 8.27 10.4 11.16 13.51 11.00 7.97 10.77 10.59 11.71 14.2511.97
1991-2000 20.07 12.12 8.99 12.91 16.13 14.62 12.43 11.11 12.34 13.81 12.57 15.7113.41 2001-05 14.95 13.72 10.04 13.88 14.00 18.42 13.36 11.35 13.99 17.91 16.24 16.1014.79
Pulses Yield 1971-80 1.25 0.79 1.37 0.6 0.51 0.69 2.36 0.92 1.27 0.32 0.53 0.31 0.22 1981-90 11 1.15 1.26 0.86 0.73 0.49 2.25 1.11 1.39 0.19 0.5 0.63 0.27
1991-2000 3.75 3.68 2.71 1.79 1.74 2.09 8.87 2.49 2.12 1.52 3.03 1.51 1.29 2001-04 6.92 7.65 5.33 4.48 4.48 3.72 6.09 5.63 6.07 2.95 3.43 3.34 2.13
Oilseed Yield 1971-80 6.85 4.45 5.78 6.87 5.73 9.48 5.19 4.93 3.3 6.96 11.28 7.35 6.82

38
1981-90 7.07 6.49 6.43 9.68 7.01 9.21 5.66 6.43 4.68 9.76 14.22 9.6 9.78 1991-2000 8.63 4.51 4.58 5.6 5.41 16.21 6.59 6.99 3.89 7.92 8.46 8.01 6.99
2001-05 8.19 3.24 3.41 4.43 6.36 6.97 4.35 4.01 1.88 6.92 10.39 7.23 7.76

39
A significant proportion of gross cropped area in these districts is under rainfed
agriculture and, thus, drought prone. Phulbani is the only district having sliding or
worsening food grain production over the reference time period (Table 5.7). District-wise
production and yield trends of major crops from 1971 to 2004 have been presented in
Table 5.7. In case of cereal production, Sambalpur ranked first with 1020.3 thousand
tones, followed by Koraput (757 thousand tones), Balasore (730.6 thousand tones), and
Cuttack (608.5 thousand tones). Except phulbani, in all districts cereal production
increased significantly during reference period. While in case of pulse crops, Cuttack
(23.6 thousand tones) followed by kalahandi (23.2 thousand tones), Koraput(21.3
thousand tones) and Ganjam (22.1 thousand tones) are major producers. Among these
districts Koraput showed significant decline in production.
Cuttack, Sambalpur, Ganjam and Dhenkanal are major oilseed producers in 1970s.
Production of oilseeds drastically reduced in all the districts since 1990s. Now only
Sambalpur and Bolangir are having significant production of oilseeds, while all other
districts contributes very little oilseed production. Cereal yield is highest in Sambalpur
(18.42 q/ha) followed by Balasore (17.91 q/ha) and Cuttack (16.24 q/ha). While pulses
yield is highest in Koenjhar (7.65 q/ha ), Mayurbhanj(6.92 q/ha), koraput (6.09 q/ha) and
phulbani (6.07 q/ha). Yields of pulses are as low as 2.13 q/ha and 2.95 q/ha in puri and
balasore respectively. Yield of oilseeds is as high as 10.39 q/ha in Cuttack, 8.19 q/ha in
Mayurbhanj and 7.76 q/ha in puri. While in some districts it is as low as 1.88 q/ha in
Phulbani, 3.24q/ha in Keonjhar and 3.41 q/ha in Sundergarh. To know the factors
responsible for the inter-district production functions, we have employed frontier
production function with time-invariant production function (Table 5.8). As expected all
the variables included in the production function are having positive elasticities except
cattle population. Rural literacy, Rural agricultural workers, number of tractors are
significant positive coefficients with respective elasticieties of 0.70, 1.02, 0.095
respectively. The mean efficiency estimates have been given in Table 5.9. In terms of
technical efficiency (%) the mean efficiency of districts is very low (only 36%), it indicates
that without increasing input resources and with the existing technology districts gross
value from agricultural sector can be increased by 64%. The highest efficiency has been
showed by Phulbani(91%), followed by Sundergarh(63%) and Konjhar(61%). While
lowest efficiency has been recorded in Ganjam(15%), Cuttack(11%) and Puri(19%),
which are abundant in water. It may be due to inefficiency in use of water.

40
Orissa District Map

41
Table 5.8. Results of Frontier Production Function (Time-invariant inefficiency model)
Dependent variable
Log of (Agricultural Value) produced in the district
Number of obs 455Number of groups (district) 13Observations per district 35Wald 2382.43Prob > chi2 0Log likelihood 100.04
Coef. Std.Err. ln_GIA 0.0183 0.05 ln_TOTCTL -0.0957 0.09 ln_NPK_Q 0.0668 0.04 ln_RAINL_1 0.0974 0.06 ln_HYV 0.1047 0.06 ln_RURLIT 0.7039** 0.16 ln_RURGAR 1.0221** 0.35 ln_LROAD 0.0463 0.09 ln_TRACTOR 0.0951 0.31 cereal_a 0.5148** 0.06 pulse_a 0.1007** 0.03 oil_a 0.0195 0.02
_cons -
2.8678** 1.4 /mu 1.1277** 0.34 /1nsigma2 -0.725 0.49 /ilgtgamma 1.6377** 0.59 Sigma2 0.4842** 0.24Gamma 0.8372** 0.08 Sigma_u2 0.4054 0.24Sigma_v2 0.0788** 0.01
Crop Diversification & Benefits In Orissa, Kharif Paddy is grown on all types of lands irrespective of its suitability. Paddy
grown on high lands under rainfed conditions is most vulnerable to moisture stress,
leading to drastic yield reduction in years of poor rainfall. It is therefore necessary to
diversify this area. The extent of high land paddy in the state is about 10.37 lakh ha. It
was programmed to divert 4.89 lakh ha. of this high land paddy to non- paddy crops like
pulses, oilseeds, cotton and vegetables during Kharif season.

42
Table 5.9: Mean efficiency estimates of districts in Orissa
Districts Mean efficiency Balasore 0.24 Bolangir 0.39Cuttack 0.11
Dhenkanal 0.32 Ganjam 0.15
Kalahandi 0.39 Keonjhar 0.61 Koraput 0.21
Mayurbhanj 0.33 Phulbani 0.91
Puri 0.19 Sambalpur 0.20 Sundergarh 0.62
Total: 0.36
Recently cultivation of commercial crops likes sugarcane, jute, mesta, cotton, soyabean,
groundnut, potato, chilly and onion etc. encouraged by the state government. In low
rainfed areas of Kalahandi, Koraput, Nabarangpur and Rayagada, cotton cultivation is
given more attention. In the coastal districts, riverbed potato cultivation is being
promoted by providing certified potato seeds and other inputs. Progress in crop
diversification due to diversion of kharif paddy area to non-paddy crops has been
presented in Table 5.10.
Table 5.10. Rice area diverted to non-rice area (hectares) during kharif season in ha Sl.No. Crop 2005 2006 20071 Cereals 16693 18188 182062 Pulses 31698 35741 565853 Oilseeds 15093 9105 254234 Fibres 14282 6687 30365 Sugarcane 12792 4244 58366 Vegetables 19109 15005 335777 Spices 3124 2504 25338 Horticultural crops 4518 2816 1210
Total 117309 94290 146406

43
Table 5.11: Marketed Surplus elasticities of Crops in Orissa Paddy Mung Urad Arhar Groundnut Sesamum Nigerseed Jute
Marketed surplus ratio 0.650 0.510 0.600 0.740 0.890 0.740 0.940 0.950 Consumption-marketed surplus ratio 0.538 0.961 0.667 0.351 0.124 0.351 0.053 0.053 Share of gross output in net income 2.397 2.160 3.150 2.942 2.047 2.481 3.542 1.821 Price elasticity of demand -0.553 -1.303 -1.303 -1.303 -0.538 -0.538 -0.538 -1.017 Income elasticity of demand 0.455 0.713 0.713 0.713 0.755 0.755 0.755 0.234 Price elasticity of marketed surplus -0.289 -0.228 -0.629 -0.279 -0.124 -0.469 -0.114 0.031 Price effect on marketed surplus 0.298 1.252 0.869 0.458 0.066 0.189 0.029 0.054 Income effect on marketed surplus -0.587 -1.479 -1.497 -0.737 -0.191 -0.658 -0.142 -0.022 Total effect -0.289 -0.228 -0.629 -0.279 -0.124 -0.469 -0.114 0.031

44
Elasticities of marketed surplus ratios have been calculated and presented in Table 5.11.
Marketed surplus ratio (M/QP) is large for commercial crops like groundnut ((0.89),
nigerseed (0.94), jute (0.95). For major staple crop paddy marketed surplus ratio is 0.65,
while for pulse crops it rages from 0.51 for mung to 0.74 for arhar. The consumption to
marketed surplus ratio (C/M) is higher for pulse crops with 0.96 for mung and 0.66 for
Urad. For paddy consumption to marketed surplus ratio is hovering around 0.53.
Consumption-marketed surplus ratios for oilseed crops are slightly lower at 0.12 for
groundnut, 0.35 for sesamum and 0.053 for nigerseed. For pure commercial crop
nigerseed it was 0.053. Share of gross output in net income (QP/I) ranges form 3.54 for
nigerseed to 1.8 for jute. As expected price elasticity of demand is negative for all crops,
which ranged from (-) 1.303 for pulse crops to (-) 0.538 for oilseed crops. While price
elasticity of demand is (-) 0.553 for major staple crop paddy. As expected, income
elasticity of demand is positive for all crops, which is ranged from 0.234 for jute to 0.755
oilseed crops, while it is hovering around 0.713 for pulse crops, and for paddy it was
0.455.
The price elasticity of marketed surplus is positive for jute with 0.031, while for all other
crops it was negative. It ranges from highest for (-) 0.629 for urad, followed by (-) 0.469
for sesamum, (-) 0.289 for paddy, (-) 0.279 for arhar, (-) 0.228 for mung, (-) 0.124 for
groundnut and (-) 0.114 for nigerseed. Further, price elasticity of marketed surplus is
decomposed into price effect on marketed surplus and income effect on marketed
surplus. As expected price effect on marketed surplus is positive for all crops due to
positive price supply response, which is highest for mung with 1.252, followed by 0.869
for urad and arhar (0.458), while income effect on marketed surplus is negative. As
income increase subsistence farmers retained more quantity for self-consumption and
hence marketed surplus declined. The income effect dominates the price effect for all
crops except jute. Hence with the crop price inflation on marketed surplus is negative for
essential commodities in food basket of the subsistence farmers. Which indicates at
least in the short-term (in the coming decade) as price of agricultural commodities
increases, due to higher income effect, the marketed surplus will decrease. This leads to
shortage of essntial commodities like pulses and oilseeds, as they are already short in
supply than demand unless efforts are made in improve the TFP trend of these essential
commodities.
Table 5.12 presented estimates of marketed surplus for paddy, cereals, pulses and
oilseeds from 2001-2 to 2006-7. Which also reveals the fact that, in year 2002-03,

45
Orissa suffered from serious shortage of all agricultural commodities including major
staple paddy. However, marketed surplus increased afterwards for all crops, but it is still
a large negative for oilseed crop. Which indicates that there is a need for large scale
diversification from paddy to non-paddy crops especially for oilseeds in terms of food
security point of view.
Keeping this in view we have calculated elasticities and marginal effects from one ha
shift in area from the existing cropping pattern to cereals, pulses and oilseeds and
presented in table 4.10. These figures indicate that, area elasticity of agricultural value is
0.515 for cereals, 0.101 for pulses and 0.02 for oilseeds. The marginal effect due to shift
in area from the existing land allocation to cereals, pulses and oilseeds on agricultural
value per hectare is found to be Rs.404.8, Rs.983.3 and Rs.582.7 Table 5.13). which
indicates that there is not only gains in terms of food security at macro-level, there is
direct benefit to farmers in terms of increase in gross value in shifting to pulses and
oilseeds.

46
Table 5.12. Estimates of Marketable Surplus of Rice, Cereals, Pulses and Oilseeds from 2001-02 to 2006-7 Year Projected
Population (lakh)
Adult Equivalent
(Laks) 88%
Total Consumption Requirement (Lakh tons)
Total Requirement
(including seed, feed &
wastage) (lakh tones)
Production(lakh
tones)
Surplus/ deficit (lakh
tones)
Requirement 400 gms per adult per day(Rice)
2001-02 371.03 326.51 47.7 54.34 71.48 17.14
2002-03 377.06 331.81 48.4 55.23 32.44 -22.79
2003-04 383.19 337.21 49.2 56.12 67.34 11.22
2004-05 389.41 342.68 50.0 57.04 65.37 8.33
2005-06 395.74 348.25 50.8 57.96 69.63 11.67
2006-07 402.16 353.90 51.7 58.90 69.28 10.38
Requirement 500 gms per adult per day(Cereals)
2001-02 371.03 326.51 59.6 68.53 75.36 6.83
2002-03 377.06 331.81 60.6 69.64 35.86 -33.78
2003-04 383.19 337.21 61.5 70.77 71.14 0.37
2004-05 389.41 342.68 62.5 71.92 69.64 -2.28
2005-06 395.74 348.25 63.6 73.09 74.26 1.17
2006-07 402.16 353.90 64.6 74.27 74.32 0.05
Requirement 50 gms per adult per day(Pulses)
2001-02 371.03 326.51 8.46 9.67 6.97 -2.70
2002-03 377.06 331.81 8.60 9.83 4.58 -5.25
2003-04 383.19 337.21 8.74 9.99 6.23 -3.76
2004-05 389.41 342.68 8.88 10.15 6.25 -3.90
2005-06 395.74 348.25 9.02 10.32 7.94 -2.38
2006-07 402.16 353.90 9.17 10.48 8.66 -1.82
Requirement 45 gms of oil per adult per day(Oilseeds)
2001-02 371.03 326.51 16.24 18.52 5.40 -13.12
2002-03 377.06 331.81 16.51 18.82 3.23 -15.59
2003-04 383.19 337.21 16.78 19.13 4.98 -14.15
2004-05 389.41 342.68 17.05 19.45 5.28 -14.17
2005-06 395.74 348.25 17.33 19.76 5.51 -14.25
2006-07 402.16 353.90 17.61 20.09 6.00 -14.09
Source: Department of Agriculture, Orissa

47
Table 5.13. Marginal effects on increase in gross revenue from a one hectare increase in area in different districts (average for 2001-2005)
District
Agril. Cereal Pulses Oils Elasticity
Marginal increase in Value Area Area Seeds Gross Revenue Rs. per ha (1000 Rs.) (1000 ha) (000 ha) (000 ha) Cereal Pulses Oilseeds Cereal Pulses Oilseeds
Balasore 355568.2 405.6 5.9 4.8 0.515 0.101 0.02 451.5 6086.8 1481.5 Bolangir 248854.3 346.5 25.4 15.6 0.515 0.101 0.02 369.9 989.5 319 Cuttack 346901.6 374.1 69 8.1 0.515 0.101 0.02 477.6 507.8 856.5
Dhenkanal 215555.9 291.2 18.4 11 0.515 0.101 0.02 381.2 1183.2 391.9 Ganjam 310766 326.3 66.2 10.1 0.515 0.101 0.02 490.5 474.1 615.4
Kalahandi 291135.5 382.6 41.1 5.5 0.515 0.101 0.02 391.9 715.4 1058.7 Keonjhar 143663.5 215.2 10.6 1.8 0.515 0.101 0.02 343.8 1368.9 1596.3 Koraput 437070.4 581.5 34.5 17.5 0.515 0.101 0.02 387.1 1279.5 499.5
Mayurbhanj 231297.8 334 10.6 3.2 0.515 0.101 0.02 356.6 2203.9 1445.6 Phulbani 115616 134 11.8 5.4 0.515 0.101 0.02 444.3 989.6 428.2
Puri 286388.3 380.7 46.6 6.3 0.515 0.101 0.02 387.4 620.7 909.2 Sambalpur 486149.9 552.9 20.7 29.4 0.515 0.101 0.02 452.8 2372 330.7 Sundergarh 117489.7 237.8 7.6 4.4 0.515 0.101 0.02 254.4 1561.4 534
Orissa 3586457 4562.4 368.4 123.1 0.515 0.101 0.02 404.8 983.3 582.7 Source: Authors calculations

48
Chapter-VI Conclusion and Policy Implication
Over the last three decades there has been stagnation in agriculture in Orissa. From
early 1970s to late 1990s the growth rates food grains in area, yield rate and production
are found to be 0.54, 1.34 and 1.88 respectively. During the period 1996 to 2003 the
growth rate is negative in area, production and yield for all major crops. Only after 2003
there is some positive growth rates seen in Orissa agricultural sector. These growth
rates particularly up to 2003 are much lower in comparison to other Indian states and all-
India average. It shows that in production of oilseeds and pulses Orissa recorded a
negative growth rate, while in production of food grains it recorded positive growth,
mainly because of increase in area under food grains, especially paddy crop. It also
indicates that, during the last decade there is an increase in concentration in Orissa
agrarian economy towards paddy with significant decline in area under other crops
particularly oilseed crops. The TFP growth rates also shows that except paddy,
groundnut and jute, all other crops recorded negative growth. It may be due to the
increase in real cost of production and relative decline in price of output. If this stagnate
and negative growth in TFP continues, already food deficit state will see further increase
in shortage of food crops, especially pulses and oilseeds if not paddy. There is an urgent
need to increase TFP growth in all crops especially in pulses and oilseeds to make their
cultivation profitable and to increase crop diversification and optimal utilization of land
and water resources. It was observed that there is inverse relationship between TFP
growth and real cost of production among all the crops. It is necessary to reduce the real
cost of production to arrest decline in TFP growth rate in Orissa agriculture. Partial
productivity of land and labour increased significantly due to the increased use of
modern inputs per unit of labour and land, while partial productivity of fertilizer declined
for all the crops due to increased dosage of fertilizers in recent years and unbalanced
use of fertilizers.
Any future projection for agricultural development of the state has to take into account
the population growth and its food requirement. The population of Orissa, which was
367.07 lakh in 2001. Based on the projected growth rate it is estimated that population
would be 424.60 lakh in 2021. Based on the projected demand and supply, Orissa will
be surplus in cereals especially in paddy production, while projected pulses demand is
11.1 lakh tones, with a shortage of 2.4 lakh tones, while projected demand for oilseeds is
21.2 lakh tones, with a shortage of 15.2 lakh tones. These figures indicates that, Orissa
Comment [A1]:
Comment [A2]:
Comment [A3]:

49
needs to increase significantly its area under both pulses and oilseeds in the long run to
make it self-sufficient and to increase food and nutrition security.
As study indicates the TFP growth of all crops, except paddy, groundnut and jute has
declined with negative growth. Concentration of cropped area is increased in paddy
cultivation. With consequent adverse effects on gross irrigated area and cropping
intensity, as paddy is a water intensive crop. For achieving the desired level of food
production keeping in mind the dietary requirement, we need to raise GCA and cropping
intensity, which, in turn, depends on increase in crop diversification towards pulses and
oilseeds. The results also shows that there is significant monetary benefits to farmers
through crop diversification to pulses and oilseeds, in addition to food security.
The results also reveal the fact that, in year 2002-03, Orissa suffered from serious
shortage of all agricultural commodities including major staple paddy. However,
marketed surplus increased afterwards for all crops, but it is still a large negative for
oilseed crop. Which indicates that there is a need for large-scale diversification from
paddy to non-paddy crops especially for oilseeds in terms of food and nutrition security
point of view.
Keeping this in view we have calculated elasticities and marginal effects from a one ha
shift in area from the existing cropping pattern to cereals, pulses and oilseeds. These
figures indicate that, area elasticity of agricultural value is 0.515 for cereals, 0.101 for
pulses and 0.02 for oilseeds. The marginal effect due to shift in area from the existing
land allocation to cereals, pulses and oilseeds on agricultural value per hectare is found
to be Rs.404.8, Rs.983.3 and Rs.582.7. Which indicates that there is not only gains in
terms of food security at macro-level, there is direct benefit to farmers in terms of
increase in gross value in shifting to pulses and oilseeds.
To sustain the agricultural production, we need enhanced supply of inputs like seed,
fertilizer and pesticides and irrigated area. Seed replacement ratio is less than 20% for
most of the crops, which needs to be increased by development of innovative supply
chains for certified seed. Total seed supplied for all crops in 2005-06 is 62, 000 tonnes,
projected demand for seed is 72, 568 tonnes for 2011-12. Likewise fertilizer
consumption per ha. of GCA was 70 kg for year 2005-06, projected to increase further
to 134 kg for the year 2011-12. Infrastructure items such as farm energy and power,
agricultural credit, marketing, warehousing and extension support need to be developed

50
concurrently to sustain agricultural growth at desired level. Based on performance of
banking sector, credit supply in the year 2001-02 is Rs.2100.16 crore rupees, and
projected credit demand is Rs. 5906.82 crore rupees for 2011-12. To bridge this
increase in credit demand, wide network of bank branches and also micro-finance
network needs to be build up.
Literacy rate, % agricultural workers, irrigation, electricity used for agricultural purpose,
marketing infrastructure and transport facilities are crucial for increasing agricultural value
from districts. Steps to be taken to improve conditions in the above aspects. Efficiency level
at district level is very low only at 36%. Which indicates that, with the existing resources and
technology, districts agricultural value product can be increased by 64% with proper
adjustment and operationalisation of best practices.

51
References
1. Behrman, J.R. (1966). Price Elasticity of Marketed Surlus of a Subsistance Crop,
Journal ofFarm Economics, Vol. 48, No.4, November 1966, pp. 875-893 2. Cassman, K.G., and P.L. Pingali. 1995. “ Extrapolating Trends from Long-Term
Experiments to Farmers’ Fields : The Case of Irrigated Rice Systems in Asia.” In V. Barnett, R. Payne and R. Steiner (eds), Agricultural Sustainability in Economic, Environmental, and Statistical Terms. London: John Wiley and Sons, Ltd.
3. Chavas, J.P. and T.L. Cox. (1988), A Nonparametric Analysis of Agricultural Technology. American Journal of Agricultural Economics, 70: 303-310
4. Christensen, L.R. (1975), Concepts and Measurement of Agricultural Productivity, American Journal of Agricultural Economics, 57:910-15.
5. Coelli Tim J. & Rao, D.S. Prasada. (2003) Total Factor Productivity Growth in Agriculture: A Malmquist Index Analysis of 93 Countries, 1980-2000. International Association of Agricultural Economics Conference held in Durban, August.
6. Cox, T.L. and J.P. Chavas. (1980), A Nonparametric Analysis of Agricultural Technology: The case of U.S. agriculture. European Review of Agricultural Economics, 17: 449-464
7. Diewert, W.E. (1976), Exact and Superlative Index Numbers. Journal of Econometrics 4: 115-145
8. Diewert, W.E. (1978), Superlative Index Numbers and Consistency in Aggregation, Econometrica, 46: 883-900.
9. Ethui, S.K., and D.S.C. Spencer. 1993. “Measuring the Sustainability and Economic Viability of Tropical Farming Systems: A Model From Sub-Saharan Africa.” Agricultural 9: 279-296
10. Evenson, R.E. & D. Jha. (1973), The Contribution of the Agricultural Research System to Agricultural Production in India. Indian Journal of Agricultural Economics 28(4):212-230.11. Griliches, Z. (1964), Research expenditures. education and the aggregate agricultural production function. American Economic Review 54: 961-974.
11. Alain de Janvry and P. Kumar, "The Transmission of Cost Inflation in Agriculture with Subsistence Production:A Case Study in Northern India", Indian Journal of Agricultural Economics. 36(3):1-14, 1981.
12. Krishna (1962) A Note on the Elasticity of the Marketable surplus of a subsistence Crop Indian Journal of Agricultural Economics, Vol. XVII, No.3, July- September 1962, pp. 79-84
13. Kumar, P. & Mruthyunjaya, (1992), Measurement and Analysis of Total Factor Productivity Growth in Wheat, Indian Journal of Agricultural Economics 47(7):451-458.
14. Kumar, P. and Mark W. Rosegrant (1994),Productivity and Sources of Growth for Rice in India, Economic and Political Weekly, 29 (52): A183-A188.
15. Kumar, P., P. K. Joshi, C. Johansen and M.Asokan (1998), "Sustainability of Rice-Wheat Based cropping system in India", Economic and Political weekly, XXXIII: A-152-A-158.

52
16. Kuznets, S. (1986), Modern Economic Growth: Rate, Structure, and Spread. New Haven: Yale University Press.
17. Lynam, J.K., and R.W. Herdt (1989),“Sense and Sustainability: Sustainability as an Objective in International Agricultural Research.” Agricultural Economics.3:381-398.
18. Rao, C.H. Hanumantha Rao (1994) Policy Issues Relating to Irrigation and Rural Credit in India, in “Economic Liberalisation and Indian Agriculture, G S Bhalla (ed.) Institute for Studies in Industrial development, New Delhi.
19. Schultz, T.W. (1953), Economic Organization of Agriculture, New York: McGraw-Hill Co.
20. Shah, S.L. and V.K.Pandey (1976) study of Marketed Surplus of Wheat in critical areas of India, G.B.Pant University of Agriculture and Technology, Pantnagar, 1976
21. Solow, R.M. (1957), Technical Change and Aggregate Production Function, Review of Economics and Statistics 39(3):312-320

53
Appendix Table1. Use of inputs per ha by crops in orissa
CROP YEAR Seed Human labour Bullock labour FYM Fertiliser kg/ha hrs/ha hrs/ha q/ha kg/ha
Paddy 1974-80 92.39 941.83 231.17 25.93 15.04 1981-90 89.26 1034.76 274.36 26.18 33.47 1991-00 91.51 1069.32 221.79 22.48 64.48 2001-03 91.27 1095.09 186.49 24.47 90.27 Growth 0.03 0.67 -0.79 -0.77 7.85 Mung 1981-90 29.96 350.89 122.61 1.24 1.19 1991-00 28.88 333.26 99.38 0.65 0.60 2001-03 29.64 349.00 94.90 0.98 1.28 Growth -0.20 -0.04 -1.44 -2.83 2.54 Urad 1984-90 31.70 347.55 101.95 2.02 1.66 1991-00 31.93 402.73 100.05 1.05 1.67 2001-03 32.21 380.51 84.77 1.38 0.97 Growth 0.07 0.75 -1.19 -7.30 -7.91 Arhar 1994-00 22.79 489.05 139.00 0.77 0.89 2001-03 22.61 428.93 124.77 0.24 0.98 Growth -0.17 -3.19 -0.09 -11.09 1.85 Groundnut 1975-80 111.73 1097.11 201.23 12.58 17.95 1081-90 121.90 1067.03 197.66 13.47 32.55 1991-98 125.97 922.55 197.14 19.71 57.61 Growth 0.73 -1.95 -0.14 2.76 6.74 Sesamum 1997-2000 10.65 476.54 133.60 0.13 0.71 2001-03 10.25 418.94 142.62 0.00 0.57 Growth -1.06 -2.92 1.51 7.43 6.60 Nigerseed 1997-00 10.84 320.81 143.34 2.22 0.00 2001-03 10.62 287.41 136.07 0.00 0.00 Growth -1.03 -3.14 -2.30 -26.62 0.00 Jute 1973-80 9.49 1471.32 182.62 24.84 16.07 1981-90 8.20 1505.47 176.49 21.14 40.96 1991-96 7.64 1467.91 119.46 23.30 43.53 Growth -1.21 0.01 -2.16 0.17 6.86

54
Appendix Table 2: Index of input used in crops, Orissa CROP YEAR Seed Human Labour Bullock labour Machine labour FYM NPK Irrigation Plant protection Traditional Modern inputs
Paddy 1974-80 107.8 120.1 130.3 100.4 78.6 115.7 58.4 36.1 108.6 95.4 1981-90 104.2 131.9 154.7 151.2 79.3 257.5 49.7 25.5 119.0 168.1 1991-00 106.8 136.3 125.0 342.4 68.1 496.0 63.9 52.3 133.2 365.1 2001-03 106.5 139.6 105.1 565.0 74.2 694.4 120.6 144.5 137.0 548.3 Growth 0.03 0.67 -0.79 6.75 -0.77 7.85 2.06 6.35 1.05 7.39 Mung 1981-90 99.5 108.4 105.2 100.2 772.9 3951.8 67.1 21.1 89.6 95.1 1991-00 95.9 102.9 85.3 102.7 407.3 2000.0 52.8 9.3 43.0 44.7 2001-03 98.5 107.8 81.5 249.9 614.6 4277.8 153.0 95.2 22.0 50.7 Growth -0.20 -0.04 -1.44 2.46 -9.49 2.54 -1.18 1.37 -7.18 -5.29 Urad 1984-90 99.8 102.0 95.1 119.2 121.9 168.1 21.4 87.9 116.1 132.4 1991-00 100.5 118.2 93.3 158.4 63.3 168.5 32.8 29.7 58.9 78.5 2001-03 101.4 111.7 79.0 260.3 83.3 97.6 67.4 3.3 32.0 57.3 Growth 0.07 0.75 -1.19 3.09 -7.30 -7.91 4.08 -24.00 -9.79 -8.92 Arhar 1994-00 91.7 81.4 130.4 54.8 26.5 35.6 0.0 0.0 86.9 50.7 2001-03 91.0 71.4 117.1 77.2 8.3 39.4 0.0 0.0 68.3 54.7 Growth -0.17 -3.19 -0.09 2.55 -8.94 4.09 0.00 0.00 -3.41 -0.91 Groundnut 1975-80 103.8 84.5 99.2 104.1 62.4 94.8 16.7 16.7 116.7 122.0 1081-90 113.2 82.2 97.5 141.4 66.8 172.0 15.5 34.7 287.7 499.8 1991-98 117.0 71.1 97.2 199.8 97.8 304.3 225.0 273.2 115.0 333.3 Growth 0.73 -1.95 -0.14 3.60 2.76 6.74 26.22 25.87 -1.56 4.47 Sesamum 1997-2000 235.8 100.2 95.2 0.0 89.6 25.0 0.0 94.1 83.3 86.0 2001-03 190.0 107.0 135.7 0.0 165.1 0.0 0.0 90.6 69.0 104.7 Growth 48.10 1.51 10.38 0.00 14.98 -49.34 0.00 -1.06 -6.12 6.27 Nigerseed 1997-00 0.0 91.6 100.5 0.0 88.0 50.0 0.0 94.1 78.3 80.3 2001-03 0.0 87.0 129.3 0.0 92.5 0.0 0.0 92.2 68.0 95.3 Growth 0.00 -2.30 7.05 0.00 1.85 -64.38 0.00 -1.03 -6.53 2.14 Jute 1973-80 185.2 95.8 96.5 32.1 244.2 169.1 54.9 78.1 92.1 128.0 1981-90 471.9 92.6 110.2 112.5 466.2 143.9 2.3 67.4 88.1 221.5 1991-96 501.4 62.7 215.6 30.7 1126.7 158.6 3.1 62.8 38.3 144.8 Growth 6.86 -2.16 4.30 1.95 9.48 0.17 -11.30 -1.21 -5.34 0.58

55
Appendix Table 3: Input share in total cost by crops in Orissa
CROP YEAR SHL SBL SML SSEED SFERT SFYM SIRR SPPSRVOL SINT TC Paddy 1974-80 0.30 0.14 0.02 0.07 0.05 0.06 0.00 0.01 0.30 0.06 1426.94 1981-90 0.33 0.12 0.02 0.05 0.05 0.05 0.01 0.00 0.30 0.06 3393.87 1991-00 0.36 0.10 0.03 0.04 0.06 0.04 0.00 0.00 0.29 0.06 10448.78 2001-03 0.39 0.13 0.04 0.03 0.07 0.03 0.01 0.01 0.23 0.07 17034.78 Growth 1.13 -0.90 3.39 -2.98 1.87 -2.05 -0.51 1.78 -0.81 0.71 10.36 Mung 1981-90 0.25 0.12 0.05 0.13 0.01 0.00 0.00 0.00 0.32 0.11 1393.76 1991-00 0.32 0.12 0.04 0.14 0.00 0.00 0.00 0.00 0.30 0.08 3786.20 2001-03 0.33 0.17 0.07 0.11 0.00 0.00 0.00 0.00 0.23 0.09 6279.24 Growth 2.08 1.28 -0.87 -0.81 -3.39 2.61 -4.81 17.68 -1.53 -2.33 9.44 Urad 1984-90 0.26 0.10 0.04 0.11 0.01 0.01 0.00 0.01 0.38 0.08 1614.14 1991-00 0.32 0.11 0.04 0.12 0.00 0.00 0.00 0.00 0.33 0.08 4196.89 2001-03 0.36 0.14 0.06 0.10 0.00 0.01 0.00 0.00 0.25 0.08 6267.61 Growth 2.27 1.82 -0.45 -0.15 -8.94 -7.43 8.34 -14.22 -2.29 -0.50 9.54 Arhar 1994-00 0.34 0.15 0.04 0.07 0.00 0.00 0.00 0.00 0.29 0.10 5181.25 2001-03 0.35 0.17 0.05 0.06 0.00 0.00 0.00 0.00 0.24 0.12 6646.77 Growth 0.19 5.70 1.59 -2.73 -13.27 -9.04 0.00 0.00 -3.42 2.28 4.85 Groundnut 1975-80 0.30 0.09 0.02 0.20 0.05 0.02 0.00 0.00 0.28 0.05 1771.07 1081-90 0.27 0.07 0.02 0.18 0.04 0.02 0.00 0.00 0.36 0.05 4165.11 1991-98 0.30 0.07 0.02 0.16 0.05 0.03 0.00 0.00 0.32 0.04 10694.51 Growth 0.09 -1.29 0.48 -1.20 1.28 1.77 -26.33 -31.70 0.49 -0.71 10.40 Sesamum 1997-2000 0.41 0.17 0.03 0.05 0.00 0.00 0.00 0.00 0.28 0.07 4929.70 2001-03 0.39 0.20 0.03 0.04 0.00 0.00 0.00 0.00 0.23 0.11 5972.84 Growth -1.79 5.10 7.64 -2.63 -44.81 -70.04 0.00 0.00 -5.13 9.65 5.43 Nigerseed 1997-00 0.35 0.20 0.03 0.04 0.00 0.01 0.00 0.00 0.31 0.07 4753.84 2001-03 0.24 0.21 0.03 0.02 0.00 0.00 0.00 0.00 0.44 0.05 5272.96 Growth -8.55 1.77 -1.63 -10.68 0.00 97.81 0.00 0.00 9.32 -9.43 5.56 Jute 1973-80 0.39 0.12 0.02 0.02 0.04 0.06 0.00 0.00 0.31 0.06 1704.91 1981-90 0.40 0.09 0.02 0.02 0.05 0.03 0.00 0.00 0.35 0.04 4364.88 1991-96 0.45 0.06 0.02 0.02 0.04 0.03 0.00 0.00 0.33 0.04 9994.03 Growth 0.73 -4.08 1.77 -0.63 1.28 -3.72 3.60 18.37 0.55 -0.99 10.52

56
Appendix Table 4: Index of input and output prices of crops in Orissa CROP YEAR IPHL IPBL IPSEED IPFERT IPFYM IPIRR IPML IPPP IPINT IRVOL IPINPUT IPRICEPaddy 1974-80 142.1 163.4 141.1 92.9 141.1 130.5 136.8 122.7 105.2 114.0 128.9 92.7
1981-90 342.0 285.6 255.7 115.0 295.5 349.0 287.6 234.9 101.0 270.9 276.1 164.5 1991-00 1120.4 958.3 594.3 212.6 1242.3 664.4 557.5 411.9 100.2 786.3 816.3 386.9 2001-03 1893.1 2265.1 802.9 268.7 1040.4 866.4 722.0 478.8 98.4 1029.1 1291.7 442.3 Growth 10.82 10.25 7.35 4.37 9.08 7.79 6.99 5.78 -0.29 9.54 9.62 6.97
Mung 1981-90 178.2 113.5 149.5 18.6 121.4 129.4 140.4 133.3 92.6 155.7 148.6 156.0 1991-00 633.5 386.2 414.0 19.0 357.1 246.4 272.1 233.8 91.9 383.8 415.3 424.9 2001-03 1038.5 920.4 543.1 28.7 752.8 321.4 352.4 271.9 90.2 491.2 667.7 536.8 Growth 11.57 12.17 8.84 3.51 9.01 5.82 6.13 4.77 -0.31 7.92 9.53 8.84
Urad 1984-90 135.7 141.5 118.1 106.9 107.4 116.3 118.7 114.8 98.8 124.6 127.3 128.8 1991-00 372.6 404.6 318.4 230.6 263.4 206.1 210.1 188.3 100.2 280.7 315.0 332.8 2001-03 661.1 925.2 402.3 357.1 424.2 268.8 272.2 218.9 98.4 328.2 476.7 376.7 Growth 11.00 12.49 9.26 8.45 9.36 5.82 5.95 4.58 -0.16 7.19 9.30 8.52
Arhar 1994-00 130.5 143.5 107.7 116.7 159.9 114.8 121.5 91.3 97.3 115.0 116.7 119.3 2001-03 192.0 221.6 120.8 63.9 214.0 137.1 142.5 98.9 99.3 123.7 157.3 129.0 Growth 8.26 10.67 2.33 -6.36 10.31 3.79 3.92 0.87 -0.17 1.46 6.07 1.32

57
Appendix Table 4: Index of input and output prices of crops in Orissa Cont.. CROP YEAR IPHL IPBL IPSEED IPFERT IPFYM IPIRR IPML IPPP IPINT IRVOL IPINPUT IPRICE
Groundnut 1975-80 125.6 125.2 114.1 104.0 142.8 127.2 113.1 117.0 106.0 111.0 118.2 143.9 1081-90 267.8 238.5 215.8 109.1 330.1 323.9 222.7 214.0 102.6 337.9 265.9 294.6 1991-98 1729.3 621.6 508.9 246.8 745.6 592.4 416.7 374.9 102.3 780.9 749.1 638.5 Growth 12.63 9.44 8.66 5.14 9.60 8.62 7.47 6.59 -0.23 11.08 10.49 8.77
Sesamum 1997-2000 102.6 115.3 102.5 83.4 107.8 104.8 104.4 100.3 95.0 94.0 101.5 105.1 2001-03 132.5 150.9 116.5 72.6 127.7 117.7 113.6 109.7 99.2 93.2 126.3 118.1 Growth 6.46 8.92 3.77 -5.34 4.88 3.29 2.60 2.30 0.81 0.21 6.23 3.68
Nigerseed 1997-00 132.3 141.6 106.7 0.0 173.9 104.8 104.4 100.3 95.0 153.8 134.0 109.4 2001-03 147.9 224.8 112.0 0.0 229.8 117.7 113.6 109.7 99.2 316.6 204.0 125.4 Growth 5.87 15.35 1.63 0.00 11.17 3.29 2.60 2.30 0.81 20.60 13.09 4.48
Jute 1973-80 173.8 204.4 213.0 116.1 162.3 187.3 163.7 175.2 112.7 130.1 154.5 122.3 1981-90 451.1 404.6 611.5 166.1 283.2 534.3 363.3 355.9 110.0 379.0 372.2 241.4 1991-96 1173.4 818.2 1335.4 294.9 477.0 907.5 614.8 597.8 113.5 847.2 868.8 545.7 Growth 11.19 8.56 11.06 4.89 6.58 9.49 7.95 7.30 0.01 11.02 10.09 8.61

58
Appendix Table 5 Price of inputs (Rs.) deflated by whole sale price index in Orissa
CROP YEAR RPFERT RPHL RPBL RPML RPLAB RPPP RPIRRPaddy 1974-80 83.9 127.6 146.4 122.5 132.1 109.9 115.3 1981-90 54.7 151.9 129.8 131.3 143.3 108.0 160.6 1991-00 43.4 222.3 188.0 113.2 202.4 85.2 135.4 2001-03 34.0 239.1 286.6 91.2 230.9 60.5 109.6 Growth -3.44 3.00 2.43 -0.83 2.54 -2.04 -0.03 Mung 1981-90 16.6 130.5 84.2 105.2 109.9 100.6 97.8 1991-00 6.3 205.4 122.9 90.7 162.5 79.4 82.4 2001-03 6.0 215.5 191.6 73.1 192.8 56.4 66.7 Growth -4.26 3.80 4.40 -1.64 3.67 -3.00 -1.95 Urad 1984-90 88.8 110.2 114.9 97.7 109.6 94.6 96.2 1991-00 88.5 145.1 154.5 84.0 136.8 76.7 82.7 2001-03 89.6 164.1 231.9 67.7 163.5 54.4 66.9 Growth 0.54 3.08 4.58 -1.96 2.90 -3.33 -2.09 Arhar 1994-00 97.4 107.6 116.7 101.0 110.9 76.9 95.6 2001-03 36.5 109.1 126.9 81.2 113.7 56.3 78.2 Growth -13.46 1.16 3.58 -3.17 1.76 -6.22 -3.31 Groundnut 1975-80 96.8 115.0 115.0 103.6 115.0 107.0 114.6 1081-90 53.7 126.1 112.5 107.3 121.6 103.8 157.2 1991-98 55.5 375.9 137.9 93.8 260.4 85.4 133.8 Growth -2.88 4.61 1.41 -0.55 3.67 -1.44 0.60 Sesamum 1997-2000 76.4 92.6 103.3 94.2 95.7 90.7 94.5 2001-03 48.8 88.7 100.5 76.1 91.1 73.5 79.0 Growth -13.53 -1.72 0.74 -5.59 -1.17 -5.88 -4.90 Nigerseed 1997-00 0.0 117.8 126.1 94.2 119.4 90.7 94.5 2001-03 0.0 99.6 149.3 76.1 115.1 73.5 79.0 Growth 0.00 -2.32 7.16 -5.59 1.47 -5.88 -4.90 Jute 1973-80 85.7 125.9 148.5 119.1 130.4 127.3 134.1 1981-90 62.0 159.2 142.8 130.6 157.2 128.8 193.6 1991-96 53.6 215.9 153.6 112.8 205.1 110.1 166.7 Growth -3.06 3.24 0.61 0.00 2.78 -0.65 1.53

59
Annexure Table 6. Descriptive statistics of variables taken in efficiency frontier production function (District-wise)
Period/ District
Agril. Value (Rs.00)
Rural Literates (000)
Total Agricultural Workers (000)
Length of Road(km)
Cereal Area (00 ha)
Pulses Area (00 ha)
Oils Seeds (00 ha)
Others Area (00 ha)
Fertilizer Consumption (tones) (N+1.2K+1.5K)
Cattle Population(00)
Tractor (00 numbers)
Rainfall(mm)
GIA (00 ha)
Balasore 1971-80 56254.8 649.9 194.8 1933.5 436.9 42.9 9.5 5.1 4732.9 915.8 4.2 1335.1 97.4 1981-90 105181.2 942.9 241.0 4145.0 399.3 91.7 32.4 6.3 13941.7 1128.9 13.2 1509.9 208.8 1991-2000 234448.0 1476.0 294.5 6105.0 406.7 53.9 12.0 4.1 44669.5 1061.9 43.7 1706.7 259.2 2001-04 355568.2 2014.8 336.7 9401.1 405.6 5.9 4.8 12.7 44284.8 970.0 134.9 1611.3 314.6 Total 163905.2 1164.6 256.8 4824.0 413.0 54.7 16.1 6.2 24424.7 1026.2 36.7 1530.7 206.5 Bolangir 1971-80 44895.4 252.6 238.9 4018.4 320.0 59.9 24.5 8.1 4029.7 626.4 3.5 1050.8 95.0 1981-90 112309.0 377.3 277.5 8910.7 321.3 138.3 59.9 12.3 8569.2 976.6 13.2 1200.5 178.1 1991-2000 215106.8 603.7 315.511211.4 308.6 85.0 26.3 9.8 11909.8 907.9 26.1 1341.6 179.9 2001-04 248854.3 881.9 338.513757.7 346.5 25.4 15.6 2.2 16998.2 906.4 53.6 1337.5 182.2 Total 141925.3 478.5 286.1 8862.7 320.9 84.5 33.9 8.9 9430.8 846.9 19.9 1217.6 155.5 Cuttack 1971-80 113139.4 1470.0 324.4 3232.7 643.0 246.8 49.9 11.2 14860.5 1556.6 4.9 1288.7 340.0 1981-90 246683.5 2100.9 389.8 7098.2 551.0 308.6 120.3 11.7 23469.4 1786.5 24.1 1438.7 523.8 1991-2000 315926.4 2532.1 399.413679.1 464.7 184.3 39.2 10.6 37664.5 1298.4 83.1 1538.7 524.6 2001-04 346901.6 2603.0 353.520445.1 374.1 69.0 8.1 7.7 26438.0 1295.0 213.6 1640.4 699.0 Total 242628.6 2115.6 368.7 9780.7 527.3 221.2 61.0 10.7 25489.5 1511.1 62.6 1453.2 496.6 Dhenkanal 1971-80 47853.6 408.1 160.8 4307.9 330.3 77.2 37.1 6.3 2304.7 792.0 367.4 1192.9 53.7 1981-90 124599.7 601.1 195.4 9447.9 250.3 163.6 93.7 9.6 5812.1 958.2 459.0 1366.3 118.7 1991-2000 187239.0 894.3 231.013717.6 265.1 103.3 41.1 7.1 9964.7 892.2 494.3 1460.0 162.1 2001-04 215555.9 1250.7 257.318787.4 291.2 18.4 11.0 6.2 13609.9 999.8 528.0 1387.8 336.6 Total 133562.9 722.5 204.510533.5 283.3 101.0 50.7 7.4 7110.4 897.8 452.8 1346.6 143.7

60
Ganjam 1971-80 65399.5 521.3 421.3 4655.4 366.8 197.5 42.7 5.7 10811.0 1088.4 3.8 1212.8 241.6 1981-90 155539.8 738.6 494.110221.9 315.4 235.8 79.8 9.1 22912.3 1180.7 12.9 1286.0 341.8 1991-2000 264005.3 1111.8 578.614601.6 335.5 171.1 23.9 7.9 31781.3 1057.5 20.0 1316.2 306.8 2001-04 310766.0 1605.6 645.218717.6 326.3 66.2 10.1 5.8 48972.2 1163.7 27.2 1314.4 329.1 Total 182950.8 907.0 519.011096.5 337.4 182.2 43.3 7.3 25711.6 1116.7 14.4 1277.8 301.4 Kalahandi 1971-80 42003.6 174.1 280.7 5288.4 302.0 114.7 34.5 9.7 500.4 707.7 3.5 1235.6 40.0 1981-90 91421.2 275.0 328.711612.1 315.4 203.5 65.3 9.2 2449.3 864.3 12.9 1324.3 87.8 1991-2000 215559.3 459.2 388.316201.6 361.8 155.9 24.2 13.1 12712.5 819.5 21.8 1559.9 148.0 2001-04 291135.5 704.5 435.220691.5 382.6 41.1 5.5 17.3 27968.0 835.4 27.2 1643.9 275.3 Total 141300.5 360.1 347.212413.7 334.4 141.3 36.3 11.6 8470.3 802.6 14.8 1411.9 118.1 Keonjhar 1971-80 28565.6 219.3 148.4 1212.2 238.1 28.3 8.5 1.5 1052.5 558.5 2.5 1294.2 16.8 1981-90 52545.3 329.9 175.3 2661.4 221.1 65.0 23.1 2.1 3121.7 682.9 9.3 1565.5 64.6 1991-2000 104212.7 505.2 207.7 3805.0 204.1 34.1 9.5 1.2 6285.3 716.8 18.5 1363.9 110.1 2001-04 143663.5 723.1 233.2 4894.3 215.2 10.6 1.8 1.3 10184.7 621.0 26.0 1491.3 104.4 Total 73473.0 404.6 185.2 2893.1 220.2 37.9 12.0 1.5 4443.4 648.2 12.4 1419.8 69.6 Koraput 1971-80 65122.8 198.6 472.5 4783.2 425.4 93.9 32.4 11.1 2580.3 1400.9 37.6 1371.3 45.4 1981-90 136699.2 315.0 573.810502.7 396.5 157.9 52.4 15.2 7480.3 1409.0 70.2 1377.2 127.9 1991-2000 345099.3 522.3 682.121501.7 494.9 107.2 36.9 17.2 19759.2 1639.1 79.5 2099.7 310.7 2001-04 437070.4 862.8 762.637317.4 581.5 34.5 17.5 10.3 34687.5 2567.8 89.2 2845.0 332.4 Total 218701.9 419.2 602.815841.8 459.3 107.5 37.3 13.9 13475.3 1638.0 66.2 1791.6 185.8 Mayurbhanj 1971-80 46371.7 286.0 267.8 4702.5 374.3 40.0 9.4 2.3 1555.3 1166.5 4.4 1415.3 44.6 1981-90 78611.8 418.2 306.110325.3 340.7 69.7 17.8 3.2 4396.8 894.2 8.6 1493.1 107.4

61
1991-2000 173797.5 651.3 362.814054.7 304.4 38.6 9.0 1.8 10609.3 1077.6 11.8 1390.7 141.7 2001-04 231297.8 963.7 410.214831.4 334.0 10.6 3.2 1.0 14358.2 1333.7 15.9 1518.4 145.1 Total 118408.6 525.0 326.210428.1 339.0 43.9 10.8 2.2 6783.0 1087.2 9.4 1445.2 104.6 Phulbani 1971-80 17086.7 137.8 115.7 7409.7 119.3 46.0 23.1 2.7 682.3 514.4 21.7 1186.3 43.8 1981-90 41914.1 201.3 136.216269.8 116.8 84.0 36.8 3.0 1605.5 557.4 26.6 1387.0 71.2 1991-2000 101447.2 313.2 162.622272.0 168.9 42.4 21.9 1.8 3783.7 715.0 28.8 1468.2 80.0 2001-04 115616.0 470.0 184.124062.9 134.0 11.8 5.4 3.2 7448.8 923.5 32.0 1472.5 80.6 Total 62358.9 253.5 144.716566.6 134.9 51.0 24.1 2.6 2798.8 642.5 26.6 1365.1 67.2 Puri 1971-80 71551.6 845.2 184.4 6294.6 425.7 184.6 24.4 7.5 6164.9 1082.1 17.4 1174.4 330.5 1981-90 135886.4 1226.6 228.513821.8 400.4 201.2 43.4 10.0 17978.6 1144.7 21.7 1279.8 410.9 1991-2000 274041.7 1723.5 275.616063.5 430.9 122.8 24.6 7.0 25781.0 1099.4 48.7 1839.9 421.8 2001-04 286388.3 2241.8 311.824584.0 380.7 46.6 6.3 5.5 28664.0 1695.8 107.1 1878.9 328.8 Total 178478.2 1404.6 241.313849.1 413.5 152.0 27.3 7.8 18359.0 1192.6 40.4 1495.3 379.3 Sambalpur 1971-80 93903.0 477.3 321.2 8616.9 588.2 51.4 39.2 8.9 15148.1 1221.1 9.8 1171.7 219.9 1981-90 187183.2 703.9 389.015340.6 520.2 119.4 82.5 9.0 42669.3 1218.8 32.0 1242.0 343.0 1991-2000 361762.1 1052.6 451.121127.7 512.8 84.5 49.8 5.4 60065.6 1168.6 40.7 2014.5 372.3 2001-04 486149.9 1457.3 495.328686.7 552.9 20.7 29.4 3.2 79596.5 1447.8 63.8 2660.9 365.5 Total 253120.9 846.4 402.516979.6 542.2 75.9 53.2 7.1 45051.8 1237.8 32.7 1645.3 319.4 Sundergarh 1971-80 29453.3 192.9 140.1 3575.7 252.0 33.7 9.8 2.2 1323.8 590.2 2.1 1127.9 25.3 191-90 51259.0 295.3 173.6 7851.0 233.6 62.3 22.7 2.9 5605.2 710.6 3.3 1245.2 64.8 1991-2000 99055.7 444.8 203.111072.4 242.8 39.0 10.4 1.8 6324.9 909.5 5.7 1349.3 88.9 2001-04 117489.7 621.8 227.313497.3 237.8 7.6 4.4 2.1 8686.7 957.1 9.7 1194.2 101.1 Total 68146.5 355.4 180.1 8356.5 242.1 39.6 12.9 2.3 5027.8 768.2 4.6 1234.1 65.6

62