Research Proposal: Pollution In The Lower Cuyahoga River ... · Research Proposal: ... Geological...
27
Research Proposal: Pollution In The Lower Cuyahoga River – A 40 Year Assessment Written and Presented by Inta Mitterbach, student The University of Akron – Fall 2007 Research Methods in Geography and Planning Professor: Dr. R. Kent December 03, 2007
-
Upload
hoanghuong -
Category
Documents
-
view
215 -
download
2
Transcript of Research Proposal: Pollution In The Lower Cuyahoga River ... · Research Proposal: ... Geological...

Research Proposal:
Pollution In The Lower Cuyahoga River –
A 40 Year Assessment
Written and Presented by Inta Mitterbach, student
The University of Akron – Fall 2007
Research Methods in Geography and Planning
Professor: Dr. R. Kent
December 03, 2007

Mitterbach
- i -
Table of Contents
Title Page
Table of Contents .........................................................................................................................i
Abstract ......................................................................................................................................1
Research Question.......................................................................................................................1
Significance ................................................................................................................................1
Introduction ................................................................................................................................2
Literature Review........................................................................................................................3
Methodology.............................................................................................................................14
Conclusion................................................................................................................................19
Appendix A – Sources...............................................................................................................20
Appendix B – Contacts .............................................................................................................24
Handout Sheet...........................................................................................................................25
Illustrations – Pictures – Tables – Charts
Lower Cuyahoga River Map ......................................................................................... Title Page
Fire On The Cuyahoga River.......................................................................................................1
Catfish With Tumors On The Cuyahoga......................................................................................2
Cuyahoga River Industrial Valley ...............................................................................................3
Water Pollutants Chart ................................................................................................................5
Cuyahoga River Industrial Valley With Jacobs Field...................................................................6
USGS Water Sample Test Variable Levels Table ......................................................................17
Sample Linear Regression Chart ...............................................................................................18

Mitterbach
- 1 -
Abstract
By using water sample tests that have been performed over the past 40 years by the U.S.
Geological Survey in a portion of the Cuyahoga River near Lake Erie, this research proposal
intends to analyze the change in pollution and water quality levels that has occurred in the past
40 years, and to forecast the levels that will exist in the future. By performing this analysis, it can
be determined at what point the river will be restored to a healthy waterway.
Research Question:
What is the current status of the condition of the Cuyahoga River in Ohio, has
improvement been made, and how much improvement is yet to be made to restore the river to a
healthy waterway? Can it be predicted as to how long it will take to restore the river, and if so
how long? What has the effect on the condition of the river been due to the changes in policy that
have occurred over the past 40 years?
Significance:
In 1969, the Cuyahoga River (also known as the
Crooked River) was so polluted that it caught on fire. The
fire was an event that initiated the enactment of the Clean
Water Act in 1972. Since the fire, a tremendous effort has
been made to clean up the river, but there is still a great
deal of pollution in the river that needs to be corrected. One of the largest contributors to the
pollution is sewage. Despite the regulations that exist for sewage, there are still companies and
communities that are not within compliance. In addition to the chemical pollution that exists,

Mitterbach
- 2 -
bacterial pollution is present. The pollution has endangered the wildlife that exists in the
Cuyahoga as well as threatening the clean water source for the areas surrounding the Cuyahoga
and around Lake Erie. Additionally, recreational activities such as fishing, boating and
swimming have suffered due to the pollution.
Introduction:
Contaminants to the Cuyahoga River include
formaldehyde, chromium, lead and cyanide, all of which
have been shown to cause cancer. According to an article
written by John Flesher of the Associated Press on
December 24, 2006, pollutants include phosphorus,
mercury, polychlorinated biphenyls (PCBs) – a toxic
organic compound that was banned in the 1970s, dioxins,
and Dichloro-Diphenyl-Trichloroethane (DDT) – a synthetic pesticide that was banned in 1972.
Although the condition of the river has improved since the Clean Water Act, there is still a great
deal of pollution in the Cuyahoga River. The effects have been the degradation of fish
populations, fish tumors and deformities, degradation of wildlife populations, bird and animal
deformities and reproduction problems, loss of fish and wildlife habitat, beach closings and
recreational access prevention.
In addition to the chemical contaminants, bacteria and viruses have been found in the
river. Included are Escherichia coli (E. coli), Salmonella, Hepatitis A virus, Cryptosporidium,
and others. The presence of these biological contaminants has been used as a test variable to
indicate the health of the river.

Mitterbach
- 3 -
In Ohio for the period of July 2003 through December 2004, there were 2,656 violations
for exceeding permitted levels of chemical dumping into waterways. Sewage systems that have
not kept up with urban growth are dumping huge amounts of untreated sewage into the river. In
addition to the limitations of the existing sewage systems, contaminants are quickly corroding
the existing sewage systems. Municipalities do not have the funding to improve the systems and
are expecting to be fined heavily for not coming into wastewater compliance. The cost of
bringing the Akron sewage system into compliance is anticipated to be $384 million.
Additionally, water quality is impaired by farm runoff, contaminated soils, and urban stormwater
runoff. Cleveland alone discharges 4.9 billion gallons of untreated sewage.
Optimum levels of bacteria, habitat, phosphorus and biocriteria have been determined by
the Ohio Environmental Protection Agency (OEPA), Division of Surface Water. By reviewing
the water test data over the past 40 years and tabulating the major contributors to the chemical
and biological pollution of the river, the progress or deterioration of the river can be assessed.
After assessing the trend of improvement or deterioration, the forecasted and hoped for
restoration of the river to a healthy waterway using a linear regression can be determined.
Literature Review:
A monumental effort to restore the Cuyahoga
River to a healthy waterway has been made over the past
thirty eight years, since the most recent fire that occurred
in 1969. The fire burned chemicals and debris on the
surface of the river for 24 minutes. Prior to the 1969 fire,
the river had caught fire twice previously: in 1936 and
Mitterbach
- 4 -
1952. The City of Cleveland began using the Cuyahoga River as a sewer in 1860 (Thomas,
2000). Numerous agencies and organizations have been established or redirected to address the
needs that exist for the restoration of the river to occur.
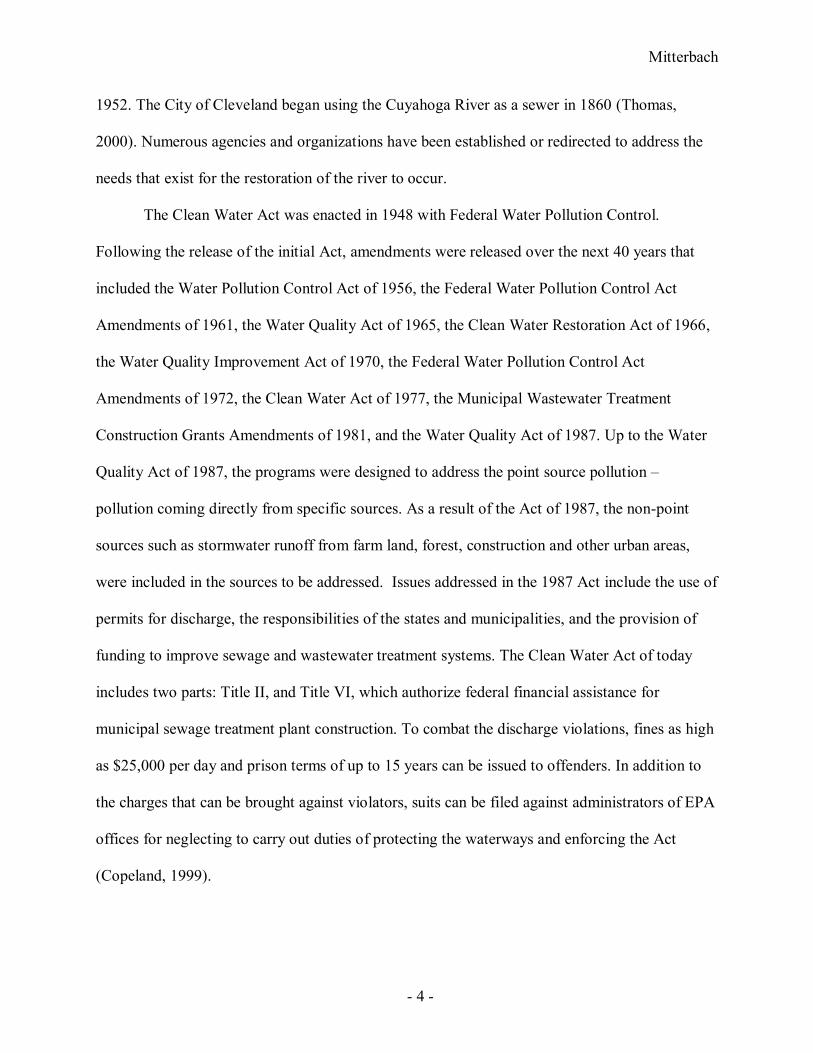
The Clean Water Act was enacted in 1948 with Federal Water Pollution Control.
Following the release of the initial Act, amendments were released over the next 40 years that
included the Water Pollution Control Act of 1956, the Federal Water Pollution Control Act
Amendments of 1961, the Water Quality Act of 1965, the Clean Water Restoration Act of 1966,
the Water Quality Improvement Act of 1970, the Federal Water Pollution Control Act
Amendments of 1972, the Clean Water Act of 1977, the Municipal Wastewater Treatment
Construction Grants Amendments of 1981, and the Water Quality Act of 1987. Up to the Water
Quality Act of 1987, the programs were designed to address the point source pollution –
pollution coming directly from specific sources. As a result of the Act of 1987, the non-point
sources such as stormwater runoff from farm land, forest, construction and other urban areas,
were included in the sources to be addressed. Issues addressed in the 1987 Act include the use of
permits for discharge, the responsibilities of the states and municipalities, and the provision of
funding to improve sewage and wastewater treatment systems. The Clean Water Act of today
includes two parts: Title II, and Title VI, which authorize federal financial assistance for
municipal sewage treatment plant construction. To combat the discharge violations, fines as high
as $25,000 per day and prison terms of up to 15 years can be issued to offenders. In addition to
the charges that can be brought against violators, suits can be filed against administrators of EPA
offices for neglecting to carry out duties of protecting the waterways and enforcing the Act
(Copeland, 1999).

Mitterbach
- 5 -
Over the past 20 years, billions of dollars have
been spent on cleaning up the Lower Cuyahoga River –
the section in Cleveland with the greatest shoreline
industrial development. The sediments in the navigational
channel are churned up in dredging operations and have
been found to contain PCBs and are not able to sustain
aquatic life due to the reduced levels of dissolved oxygen.
Other pollutants in the river which have been found to
contaminate fish include polycyclic aromatic hydrocarbons (PAHs) and alkylphenol-ethoxylates
(APEs) (Mitchelmore, 2006). The dredging is maintained by the U.S. Army Corps of Engineers.
The natural depth of the river is 3-6 feet, but the dredging maintains a depth of up to 27 feet
(Life).
According to an assessment of the Cuyahoga River from 1973 to 1974, dissolved oxygen
levels in the river fell to 2.0 mg/L at times – healthy range being 4.0-6.0. Also found were
nitrogen levels of 0.35 to 3.8 mg/L, phosphate levels from 0.33 to 1.33 mg/L, and residue levels
from 119 to 930 mg/L. During this time, heavy metals, lead, cadmium, chromium, nickel and
zinc were found in water samples, and the water pH ranged from 7.1 to 8.7. Of the bacterial
measurements that were tested, fecal levels were found to be in the range of 4,000 to 11,000
colonies per 100 mL (Olive, 1974).
In 1985, the Ohio Administrative Code, Chapter 3745-1-26, known as the Cuyahoga
River Drainage Basin law, became effective. The law has been revised and updated six times and
provides for the guidelines with regard to the use of the Cuyahoga River channels for
recreational and commercial use. Written into the law are the effects on the river fauna in

Mitterbach
- 6 -
spawning and migration. Of importance is the fluctuation in the level of dissolved oxygen due to
dredging activities (Lawriter, 2007).
The Cuyahoga Remedial Action Plan Coordinating Committee (CCC) established an
Area of Concern (AOC) in 1988 that includes a 45 mile portion of the Cuyahoga River.
Significant milestones that have been followed by the CCC over the past 37 years include
preparation and release of Remedial Action Plans, designation of the Cuyahoga as one of
fourteen American Heritage Rivers in the nation, the 2001 State of the River Symposium, a
Habitat Feasibility Study completed by the US Army Corps of Engineers (USACE) in 2004, and
the reestablishment of nesting bald eagles along the Cuyahoga (USEPA, Great Lakes).
In the past, LTV Steel had been a major
contributor to the pollution of the Cuyahoga, adding
ammonia and cyanide to the collection of chemical
pollutants. In 1992 and 1993, the coking ovens were
removed from the plant and the pollution was reduced
significantly. Two of the scores used to gauge the water
quality of the river include the Index of Biological
Integrity (IBI), and the Qualitative Habitat Evaluation
Index (QHEI). These two indices have been found to
decline significantly as the mouth of the river is
approached. The number of fish species able to live in the
river has increased from eight in 1987 to 22 in 1996. The fish found in the river include the
Common Carp, Gizzard Shad, Emerald Shiner, White Bass, and White Perch.

Mitterbach
- 7 -
In 1994 and 1995, testing was conducted on the Cuyahoga River at three locations in
Cleveland by the combined efforts of the U.S. Geological Survey, Northeast Ohio Regional
Sewer District (NEORSD), and the Ohio Water Development Authority. Water samples were
collected for bacterial and chemical analysis. According to the tests that were conducted,
dissolved oxygen levels ranged from 4.3 to 8.5 mg/L, nitrates ranged from 0.86 to 4.5 mg/L,
ammonia-nitrogen ranged from 0.12 to 0.42 mg/L, phosphorus ranged from 0.1 to 1.3 mg/L, and
total organic carbon was found to range from 4.7 to 12.8 mg/L. The 1996 report identifies three
types of water contact standards: “bathing water” – typically suitable for swimming and allowing
up to 400 colonies of bacteria per 100 mL of water; “primary contact water” – suitable for
swimming, scuba diving, and canoeing with an allowance of up to 2,000 colonies of bacteria per
100 mL of water; and “secondary contact water” – suitable for partial body contact such as
wading, with an allowance of 5,000 colonies of bacteria per 100 mL of water (Francy, 1996).
Some of the concerns that exist with regard to the pollution levels in the Cuyahoga are in
the effects of smaller streams connected to the major arteries of the Cuyahoga. The Cuyahoga
Valley National Park (CVNP), a scenic area used for fishing and water recreation, is being
directly impacted by the pollution levels on the river. Fecal contamination testing is being
conducted in the CVNP. One of the indicators of water health and safety levels has been found to
be bacterial level testing. E. coli is a major problem in the CVNP, and an indication that
contamination from human and animal waste exists in the river. Development of a “Rapid Test
Method” has enabled more timely readings on the condition of the water. The Rapid Test can
provide results within a few hours. To further the research being conducted on the Rapid Test
process, the University of Michigan has tested other Great Lakes beaches and the Huron River.
These tests included water samples that were collected in 2004 and 2005 on the Cuyahoga River

Mitterbach
- 8 -
within CVNP. In 1998, the EPA established the 100 mile long Cuyahoga River as one of the 14
American Heritage Rivers, but the use of the river for canoeing, swimming, and wading has been
discouraged due to the levels of bacterial pollutants. The National Park Service has found that
stormwater, combined-sewer overflows, and wastewater from urban areas have contributed to
the plight (Bushon, 2007).
In an article for the U.S.Geological Survey in 2007, the water quality of the Cuyahoga
River and the effects of water pollution on the Cuyahoga Valley National Park (CVNP) are
reviewed. Studies and testing was conducted in 2000 at four test sites and in 2002 at three test
sites. The tests were specifically looking for E. coli, Salmonella, F-specific and Somatic
Coliphage, Entirovirus, Hepatitis A virus, Clostridium perfringens (C. perfringens),
Cryptosporidium, and Giardia. These tests can determine the safety levels of the water for
human contact. A twenty-three mile segment of the Cuyahoga River flows through the CVNP. In
addition to the bacteria and virus levels tested, chemical composition was also analyzed. The
pollution being found throughout the CVNP on the river have been detected to originate from
sewage outflow upstream to the park. The Ohio EPA has designated the CVNP river segment of
the Cuyahoga a recreational area which mandates that conditions for safe recreation be
monitored.
Studies ranging from 1984 to 2003 show some improvement in the water quality which
has been attributed to improved sewage treatment and disinfection. According to a report
published by the USGS in 2002, the water would be ideally tested for microbiological indicators
and pathogens, but that the testing required is cost prohibitive and budgets in both dollars and
time allow for the less broad spectrum monitoring of specific pathogens that generally give an
overall indication of the water quality. In 1986, the U.S. Environmental Protection Agency
Mitterbach
- 9 -
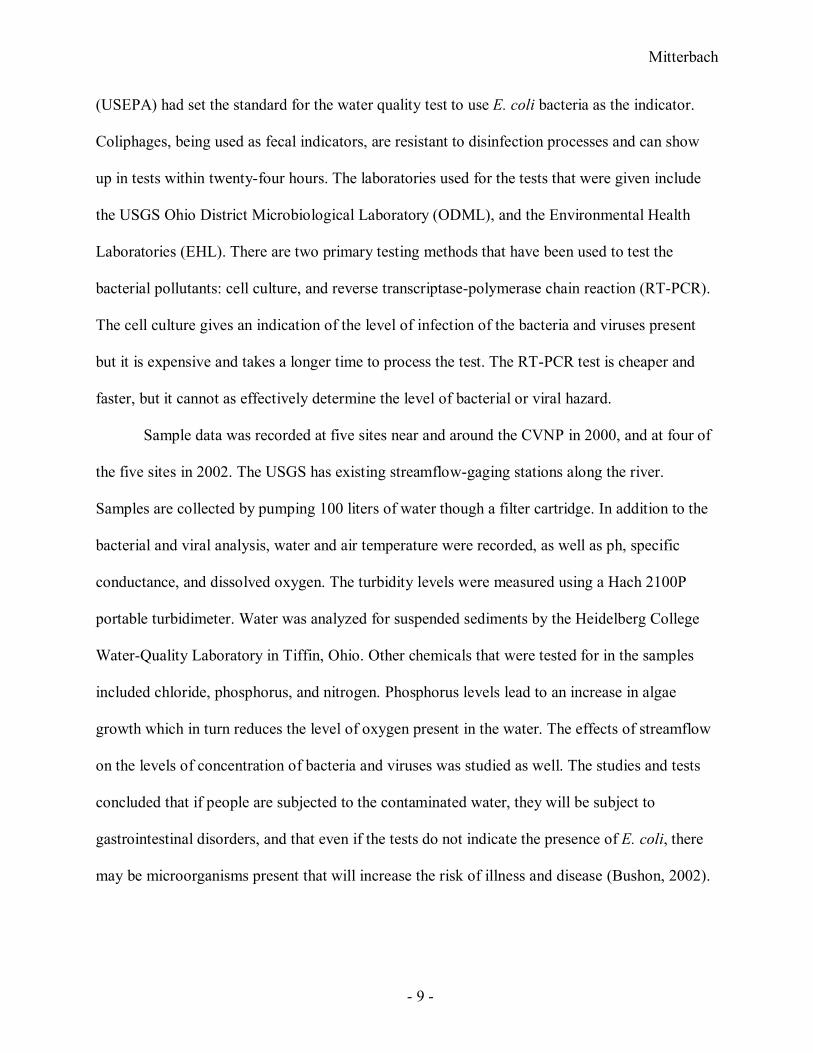
(USEPA) had set the standard for the water quality test to use E. coli bacteria as the indicator.
Coliphages, being used as fecal indicators, are resistant to disinfection processes and can show
up in tests within twenty-four hours. The laboratories used for the tests that were given include
the USGS Ohio District Microbiological Laboratory (ODML), and the Environmental Health
Laboratories (EHL). There are two primary testing methods that have been used to test the
bacterial pollutants: cell culture, and reverse transcriptase-polymerase chain reaction (RT-PCR).
The cell culture gives an indication of the level of infection of the bacteria and viruses present
but it is expensive and takes a longer time to process the test. The RT-PCR test is cheaper and
faster, but it cannot as effectively determine the level of bacterial or viral hazard.
Sample data was recorded at five sites near and around the CVNP in 2000, and at four of
the five sites in 2002. The USGS has existing streamflow-gaging stations along the river.
Samples are collected by pumping 100 liters of water though a filter cartridge. In addition to the
bacterial and viral analysis, water and air temperature were recorded, as well as ph, specific
conductance, and dissolved oxygen. The turbidity levels were measured using a Hach 2100P
portable turbidimeter. Water was analyzed for suspended sediments by the Heidelberg College
Water-Quality Laboratory in Tiffin, Ohio. Other chemicals that were tested for in the samples
included chloride, phosphorus, and nitrogen. Phosphorus levels lead to an increase in algae
growth which in turn reduces the level of oxygen present in the water. The effects of streamflow
on the levels of concentration of bacteria and viruses was studied as well. The studies and tests
concluded that if people are subjected to the contaminated water, they will be subject to
gastrointestinal disorders, and that even if the tests do not indicate the presence of E. coli, there
may be microorganisms present that will increase the risk of illness and disease (Bushon, 2002).

Mitterbach
- 10 -
According to the U.S. Geological Survey, testing conducted in 2000 indicated Salmonella
present in 68 percent of the samples. Colliphage, a virus that indicates the presence of viral
contamination, was found in 100 percent of the samples. Infectious enteroviruses were present in
56 percent of the samples. The sampling occurred on a twenty-three mile segment of the
Cuyahoga River that flows through the Cuyahoga Valley National Park. The tests conducted in
2000 were part of the National Park Service (NPS) U.S. Geological Survey (USGS) Water
Quality Monitoring and Assessment Partnership. In addition to this project, The Cuyahoga
American Heritage River Navigator assists in the efforts. The river is specifically tested more in
the CVNP area due to its recreational activities. The viruses that have been found in the test area
are known to have caused upper respiratory infections with fever, muscle aches and rashes. Some
people have contracted viral meningitis, myocarditis (a heart condition), encephalitis, and
paralysis. The National Park Service does not recommend recreational use of the park segment
of the Cuyahoga River due to the lack of prediction available for safe levels of use. In 2002, a
meeting was held by the Midwest Natural Resources Group that included representatives from
the US EPA, Ohio EPA, US Fish and Wildlife Service and the National Park Service (NPS).
There was a 3-page handout prepared for and distributed at the meeting. The USGS recommends
that the quality of the fish in the river segment would best be identified by the Ohio EPA. In
addition to the testing indicated above, tests for Cryptosporidium and Giardia were conducted in
2000 which take about six months to get results. A final report was released in September 2003.
Future testing will include that of the Norwalk virus (City of Akron, 2002).
In water quality data from 1996 and 2000, analysis did not indicate that there were
“exceedences” of phenols which contribute to tainting to fish and game. The 2003 Lower
Cuyahoga River Total Maximum Daily Load (TMDL) Report gave an evaluation as “NOT

Mitterbach
- 11 -
IMPAIRED.” A 45 mile section of the river was tested in various sites and received an upgraded
evaluation from “IMPAIRED” to “IMPAIRED IN PLACES.” The report reviewed the status of
wildlife in the area, including the presence of bald eagles, great blue heron, and osprey with an
evaluation of probably “NOT IMPAIRED.” Amphibians along and within the waterway have
been monitored and showed no population changes over a ten year period. Fish tumors and
deformities were still being found including eroded fins and lesions, and although they have
declined the evaluation is still listed as “IMPAIRED.” According to the report, the sediment in
the river is heavily polluted with metals and is disposed of in a Cleveland facility. Additionally,
the dissolved oxygen level was reported to have been extremely impaired (Cuyahoga River
Beneficial Use Impairments). The 2003 report includes the year 2000 Exceedences of Ohio
Water Quality Chemical and Physical Standards, Permitted Dischargers, Current Projects,
Phosphorus Concentrations, Causes and Sources of Impairment, Water Quality Standards, and
Nutrients (OEPA, Div of Surface Water).
In 2002, a study was conducted by the Ohio EPA to sample and analyze organic and
inorganic water and sediment samples. The study focused on the chemical and biological effects
of APEs (alkylphenol-ethoxylates) in river water, sediment, and fish tissue. The sampling was
taken from seven sites along a 74-mile stretch of the Cuyahoga. Carp were used for blood and
tissue samples. One of the challenges in conducting the study was in sampling fish of similar size
and weight – the study was unable to regulate this factor. Nonylphenol ethoxylates (NPEs) levels
in fish were found to have been of the highest reported in the United States. One of the effects of
the pollution to the fish is the decrease in fish reproductivity (Mitchelmore, 2006). An
assessment data report was prepared by the US EPA in 2002 that includes segments of the river

Mitterbach
- 12 -
and the “Water Status.” Indicators include “Good” and “Impaired,” and causes and sources of
impairment are listed (US EPA, 2002).
The Cuyahoga Valley National Park provided a Water Quality Report in 2002 and 2005.
According to the report, pathogens present in the water are microorganisms that can cause
disease. They include certain types of bacteria, viruses and protozoans. The tests available for
pathogens are usually more expensive and time consuming and “indicator organisms” are usually
used to determine the safety levels of the water quality. Indicators that are used for the tests
include Escherichia coli (E. coli) – a bacteria found in the gastrointestinal tract and feces of
warm-blooded animals that indicates presence of sewage or animal waste contamination and can
lead to death, Coliphage – not harmful to humans, and Clostridium perfringens – a spore forming
bacterium that is more resistant to disinfection. The pathogens that exist include Salmonella –
one of the main causes of diarrheal illness in humans worldwide, Enterovirus – a group of
viruses that attack the gastrointestinal tracts of mammals and cause upper respiratory problems,
Hepatitis A virus – a virus that infects the human liver and causes illness, Cryptosporidium – a
protozoan parasite that causes diarrheal illness, dehydration, weight loss, fever, nausea, and
vomiting in humans, and Giardia – a protozoan parasite that causes diarrheal illness, gas,
stomach cramps and nausea in humans. According to the report, a safe level of E. coli is not
higher than 298 colonies per 100 mL. The report indicated Coliphage present in all samples,
Salmonella was detected in 52 percent of the river samples, Enteroviruses were detected in 90
percent of the samples, 6 out of 21 samples that were tested for Hepatitis A were found to be
positive, and Giardia was detected in 44 percent of the samples. The sources of pollution are
upstream and are indicated in the report to include poorly functioning septic systems, farm
runoff, contaminated soils, urban stormwater runoff, and combined sewer overflows.

Mitterbach
- 13 -
The City of Akron has a combined sewer overflow called “Rack 40” which is the worst
combined sewer in the Akron wastewater-treatment system. The Rack 40 overflows into the
Cuyahoga on average of 65 times per year and discharges 461 million gallons a year of sewage
and stormwater into the river. “As much as 3 billion gallons a year of stormwater contaminated
with raw sewage discharge to the Cuyahoga River and cause high levels of bacterial and viral
pathogens to be present in the river.”
According to Ahmed Said, in a 2004 article for Environmental Management, the water
quality indicators are identified to use as a gauge for measuring the water quality index.
Atrazine, Chlorpyrifos, Pesticides, Fish Toxicity, and Polycyclic Aromatic Hydrocarbon (PAH)
average values and ratings are included in the list of variables provided by Said (Said).
Despite the progress being made in testing and enforcement, Ohio has been ranked as the
number one worst nationally in water pollution according to a report released by The Ohio
Public Interest Research Group (PIRG) in March 2006. Ohio discharge permit holders reported
205 instances in which the level of discharge permitted was exceeded by at least 500 percent.
Ohio PIRG prepared a report entitled Troubled Waters: An Analysis of Clean Water Act
Compliance. According to Ohio PIRG, the Cuyahoga is polluted with toxic chemicals including
lead and cyanide. State Representative W. Scott Oelslager, of Plain Township, introduced
legislation to require sewer utilities to notify the Ohio EPA, local health departments, the news
media and the public when overflows occur. Discharges into Lake Erie and streams from
Cleveland, Akron and nine other communities were in excess of 8 billion gallons annually.
According to Ohio PIRG, pollutants include chromium, cyanide, lead and formaldehyde
(Downing, 2006).

Mitterbach
- 14 -
One of the recent solutions proposed for the City of Akron with regard to the sewage
overflow is the installation of a new $248 million system. The anticipated timeline for the
construction of the sewage line spans over 35 years in the future, which does not comply with the
the federal and state timeline of 15 years. Problems that occur with the sewage overflow include
a decreased oxygen level in the water and an increased bacterial level. The City of Akron filed a
report with the EPA regarding the combined sewer overflows. The plan proposed by Akron
includes the construction of two tunnels: one 20 feet in diameter, 5,000 feet long, capable of
storing 238 million gallons, and costing $93 million; the other 10 feet in diameter, 5,000 feet
long, capable of storing 24 million gallons, and costing $28 million. The plan also incorporates
the installation of 11 underground concrete storage basins to store and chemically treat the
runoff. The largest basin would hold 30 million gallons and cost $12 million. If the
improvements are made, the volume of overflow would be reduced by 41 percent: from 2.4
billion gallons to 1.4 billion gallons, and the level of pollution in the river would be reduced by
49 percent (Downing, 2006).
Methodology
Although the condition of the Cuyahoga River remains seriously polluted, there are
numerous agencies and organizations that are trying to coordinate efforts and bring the pollution
under control. Research and testing has been conducted on the Cuyahoga over the past 50 years
by the U.S. Geological Survey. The test data collected by the USGS has been provided online
with over 400 water test variables to view. The data can be accessed by state and county,
providing test sites and the number of samples that have been collected over a period of time.
Mitterbach
- 15 -
Two hundred six samples were collected at the West Third Street Bridge in Cleveland (USGS
Site Number 04208506) from January 1967 to August 1995 (USGS).
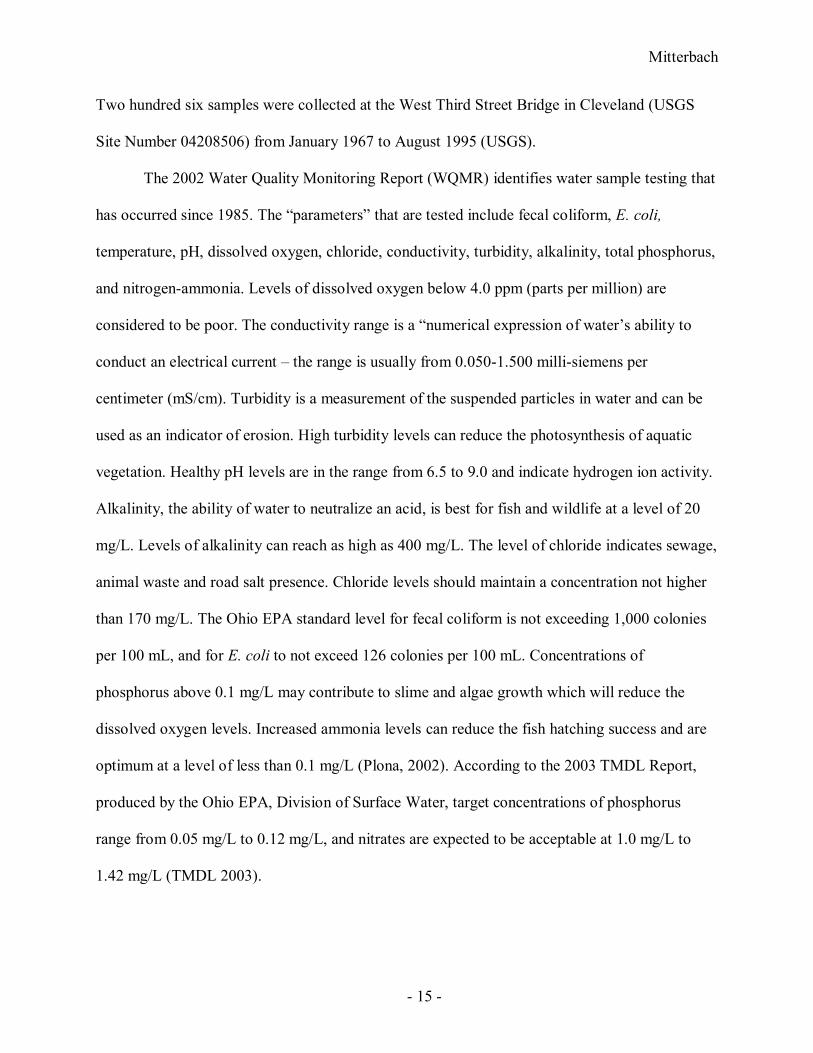
The 2002 Water Quality Monitoring Report (WQMR) identifies water sample testing that
has occurred since 1985. The “parameters” that are tested include fecal coliform, E. coli,
temperature, pH, dissolved oxygen, chloride, conductivity, turbidity, alkalinity, total phosphorus,
and nitrogen-ammonia. Levels of dissolved oxygen below 4.0 ppm (parts per million) are
considered to be poor. The conductivity range is a “numerical expression of water’s ability to
conduct an electrical current – the range is usually from 0.050-1.500 milli-siemens per
centimeter (mS/cm). Turbidity is a measurement of the suspended particles in water and can be
used as an indicator of erosion. High turbidity levels can reduce the photosynthesis of aquatic
vegetation. Healthy pH levels are in the range from 6.5 to 9.0 and indicate hydrogen ion activity.
Alkalinity, the ability of water to neutralize an acid, is best for fish and wildlife at a level of 20
mg/L. Levels of alkalinity can reach as high as 400 mg/L. The level of chloride indicates sewage,
animal waste and road salt presence. Chloride levels should maintain a concentration not higher
than 170 mg/L. The Ohio EPA standard level for fecal coliform is not exceeding 1,000 colonies
per 100 mL, and for E. coli to not exceed 126 colonies per 100 mL. Concentrations of
phosphorus above 0.1 mg/L may contribute to slime and algae growth which will reduce the
dissolved oxygen levels. Increased ammonia levels can reduce the fish hatching success and are
optimum at a level of less than 0.1 mg/L (Plona, 2002). According to the 2003 TMDL Report,
produced by the Ohio EPA, Division of Surface Water, target concentrations of phosphorus
range from 0.05 mg/L to 0.12 mg/L, and nitrates are expected to be acceptable at 1.0 mg/L to
1.42 mg/L (TMDL 2003).

Mitterbach
- 16 -
By using a portion of the water test sample data that has been collected over the past 40
years by the USGS, the condition of the water can be assessed and forecasted to determine the
time period over which a healthy ecosystem can be achieved. In first selecting a small control
group of test variables from the 411 test variables available that have been found in water
samples of the Cuyahoga River, the general health of the river over the past 40 years can be
determined. Following the assessment of the river, using a linear regression, the timeframe for
the return of the river to a healthy waterway can be established.
Objective:
The objective in forecasting the health of the river, is to determine the progress of the
Lower Cuyahoga to a waterway with nearly no contaminants based on a perceived trend of
improvement that has occurred over the past 40 years.
Data Source:
Water Quality Samples for Ohio
USGS 04208506 Cuyahoga River at West 3rd Street Bridge in Cleveland, Ohio
Beginning Date: 01/10/1967
Ending Date: 08/31/1995
Samples: 206
Note: The West 3rd Street Bridge location in Cleveland on the Cuyahoga River has been
selected due to the close proximity of the test site to the mouth of the river which empties into
Lake Erie.

Mitterbach
- 17 -
Water Sample Parameters:
The control group test variables to be used in this project include: 1) Specific
Conductance, 2) Dissolved Oxygen, 3) pH, 4) Ammonia, 5) Nitrate, 6) Phosphate,
7) Phosphorus, and 8) Mercury.
The following table identifies the levels of test variables found in the river within the
Cleveland, Ohio segment over the past 40 years. The water samples were collected by the USGS.
USGS WATER SAMPLE TEST VARIABLE LEVELS Test Variable Lowest
Measurement Highest Measurement
Average Measurement
Optimum Level
Specific Conductance (millisiemens/cm)
0.386 1.860 0.947 0.050-1.500
Dissolved Oxygen (mg/L)
0.4 9.6 4.8 >4.0
pH 5.9 8.5 7.3 6.5-9.0 Ammonia (mg/L) 1.8 9.7 5.9 NGT 0.1 Nitrate (mg/L) <0.010 0.47 0.1325 1.0-1.42 Phosphate (mg/L) 0 2.2 0.9275 0 Phosphorus (mg/L) 0.06 1.2 0.35 0.05-0.12 Mercury (micrograms/L)
0 1.5 0.6 0
Analysis Software:
Microsoft Excel
Computational Procedure:
Using MS Excel to import the USGS data, select the test variables that have been
identified in the preceding table and run the FORECAST utility to determine the future date of
ideal water quality conditions.

Mitterbach
- 18 -
The equation for FORECAST is y = a + bx, (linear regression).
a = the known dependent array of data
b = the known independent array of data
y = the linear projection that will provide the plot for future data points
Sample Linear Regression Chart:
Policy Trend Analysis:
Using MS Excel to import the USGS data, create a graph that reflects the changes in
water quality that have occurred over the past 40 years to identify the effects of the water
policies upon water quality. Incorporate the policy timeline into the water quality graph to
illustrate the changes that have occurred.
Mitterbach
- 19 -
Conclusion:
By completing this evaluation of the Cuyahoga River Water Quality that has been tested
over the past 40 years, it is hoped that a pattern of improvement can be determined. By
reviewing the policy changes that have occurred in relation to the changes in pollution levels,
this study will show whether the efforts that have been made have had an effect.

Mitterbach
- 20 -
Appendix A - Sources:
1. Akron Beacon Journal, OH. Editorial: Sewage runneth over: Untreated waste often flows into the Cuyahoga River. The expensive cleanup requires a large federal role. 02 May 2006. http://web.ebscohost.com.proxy.ohiolink.edu:9099/ehost/detail?vid=5&hid=113&sid=b1b... Retrieved 27 Sep 2007.
2. Bushon, Rebecca N., Amie M.G. Brady, and Meg B. Plona. Using a rapid method to predict recreational water quality at Cuyahoga Valley National Park, Ohio. Park Science, Volume 24, Number 2, Winter 2006-2007. http://www2.nature.nps.gov/parkscience/index.cfm?ArticleID=150. Retrieved 28 Sep 2007.
3. Bushon, Rebecca N. and G.F. Koltun (USGS). Microbiological Water Quality in Relation to Water-Contact Recreation, Cuyahoga River, Cuyahoga Valley National Park, Ohio, 2000 and 2002. http://pubs.usgs.gov/wri/wri034333/. Retrieved 28 Sep 2007.
4. City of Akron. Questions and Answers Concerning Cuyahoga River Water Quality. 01 Jul 2002. http://www.ci.akron.oh.us/News_Releases/2002/062802.html. Retrieved 28 Sep 2007.
5. CLEVNET Consortium. Hitlist. Library Catalog search for ““Cuyahoga River” and pollution.” http://search1.clevnet.org/web2/tramp2.exe/do_keyword_search/A25d8rtu.000. Retrieved 12 Oct 2007.
6. Copeland, Claudia. CRS Report for Congress. Clean Water Act: A Summary of the Law. 20 Jan 1999. http://www.ncseonline.org/NLE/CRSreports/water/h2o-32.cfm. Retrieved 28 Sep 2007.
7. Cuyahoga River Beneficial Use Impairments. http://www.epa.gov/glnpo/cuyahoga/Cuyahoga-AOC_BUIs.pdf. Retrieved 28 Sep 2007.
8. Cuyahoga Valley National Park. Water Quality in Cuyahoga Valley National Park January, 2005. http://www.nps.gov/archive/cuva/management/rmprojects/wquality.htm. Retrieved 28 Sep 2007.
9. Downing, Bob. Akron to Pay $1/4 Billion to Clean-Up Sewage. http://waterindustry.org/New%20Projects/Akron-1%20.htm. Retrieved 28 Sep 2007.
10. Downing, Bob. Clean test studied at Cuyahoga River: Researcher sees hope in new measurement. Akron Beacon Journal, OH. 19 Oct 2006. http://web.ebscohost.com.proxy.ohiolink.edu:9099/ehost/detail?vid=4&hid=113&sid=b1b... Retrieved 27 Sep 2007.
Mitterbach
- 21 -
11. Downing, Bob. Ohio ranks 1st in water pollution: Report says state has most violations in U.S. of clean-water rules. Akron Beacon Journal, OH. 24 Mar 2006. http://web.ebscohost.com.proxy.ohiolink.edu:9099/ehost/detail?vid=5&hid=113&sid=b1b... Retrieved 27 Sep 2007.
12. Downing, Bob. Overflows of sewers pose risk, group says: Pollution in Cuyahoga River, Lake Erie cited; public notice sought. Akron Beacon Journal, OH. 22 Apr 2006. http://web.ebscohost.com.proxy.ohiolink.edu:9099/ehost/detail?vid=5&hid=113&sid=b1b... Retrieved 27 Sep 2007.
13. Environment Ohio. Environment Ohio Research & Policy Center. http://www.environmentohio.org/center. Retrieved 12 Oct 2007.
14. Environment Ohio and Environment Ohio Research and Policy Center. Sewage Overflow – Billions of Gallons of Sewage Contaminate Lake Erie. May 2007. http://www.environmentohio.org/uploads/Sn/yY/snyYReFcvglvs5A6AqZmVA/Sewage-Overflow-Report.pdf. Retrieved 12 Oct 2007.
15. Flesher, John. Great Lakes Cleanup: Mission Partly Accomplished. 24 Dec 2006. http://archives.record-eagle.com/2006/dec/24lakes.htm. Retrieved 28 Sep 2007.
16. Francy, Donna S., Teresa L. Hart, and Cathy M. Virosteck. (U.S. Geological Survey, Water-Resources Investigations Report 96-4199.) Effects of Receiving-Water Quality and Wastewater Treatment on Injury, Survival, and Regrowth of Fecal-Indicator Bacteria and Implications for Assessment of Recreational Water Quality. 1996. http://oh.water.usgs.gov/reports/111/rpt96.4199.html. Retrieved 28 Sep 2007.
17. Klosterman, Richard E., Richard K. Brail, and Earl G. Bossard, eds. Spreadsheet Models for Urban and Regional Analysis. Center for Urban Policy Research, New Brunswick, NJ. 1993.
18. Lawriter. Ohio Administrative Code. Chapter 3745-1-26 Cuyahoga river drainage basin. (Effective 01 Apr 2007.) http://codes.ohio.gov/oac/3745-1-26. Retrieved 28 Sep 2007.
19. Life Depends On Water. Cuyahoga River. http://www.wviz.org/edsvcs/water/watershedcuyahoga.htm. Retrieved 28 Sep 2007.
20. Liu, J. and L.G. Leff. Temporal Changes in the bacterioplankton of a Northeast Ohio River. Hydrobiologia. Vol 489, Issue 1-3. Dec 2002. http://journals.ohiolink.edu/ejc/article.cgi?issn=00188158&issue=v489i1-3&article=151_.... Retrieved 27 Oct 2007.
21. Lo, Howard H. and Ahlene A Shong. Geochemical Investigation of the Lower Cuyahoga River, Cleveland, Ohio. Ohio Journal of Science, Vol. 76, Issue 2. 1976. https://kb.osu.edu/dspace/bitstream/1811/22353/1/V076N2_057. Retrieved 01 Dec 2007.

Mitterbach
- 22 -
22. Mitchelmore, Carys L. and Clifford P. Rice. Correlations of nonylphenol-ethoxylates and nonylphenol with biomarkers of reproductive function in carp (Cyprinus carpio) from the Cuyahoga River. The Science of the Total Environment, Vol. 371, Issue 1-3. Dec 2006. http://journals.ohiolink.edu/ejc/article.cgi?issn=00489697&issue=v371i1-3&article=391_... Retrieved 27 Oct 2007.
23. Mitsch, William J., Li Zhang, and Amanda M. Nahlik. Designing a regeneration zone for the Cuyahoga River Valley: Ecological restoration. https://kb.osu.edu/dspace/bitstream/1811/24108/1/%2805%29+6.04+Cuyahoga.pdf. Retrieved 28 Sep 2007.
24. Ohio EPA, Division of Surface Water. The Lower Cuyahoga River Watershed TMDL. http://www.epa.state.oh.us/dsw/tmdl/CuyahogaRiverLowerTMDL.html. Retrieved 28 Sep 2007.
25. Ohio EPA, Division of Surface Water. Total Maximum Daily Loads for the Lower Cuyahoga River, Final Report. Sep 2003. http://www.epa.state.oh.us/dsw/tmdl/CuyahogaRiverLowerTMDL.html. Retrieved 28 Sep 2007.
26. Ohio EPA, Ecological Assessment Unit, Division of Surface Water. The State of the Aquatic Ecosystems: Ohio Rivers & Streams: Causes and Sources of Impairment. http://www.epa.state.oh.us/dsw/documents/fs10mas98.pdf. Retrieved 28 Sep 2007.
27. Olive, John H. (Department of Biology, University of Akron). Chemical-Physical and Biological Assessment of Water Quality in the Cuyahoga River (1973-1974). https://dspace1.ohio-state.edu/dspace/bitstream/1811/22338/1/V076N1-005. Retrieved 28 Sep 2007.
28. Plona, M.B. 2002 Water Quality Monitoring Report. http://www.nps.gov/archive/cuva/management/rmprojects/waterquality.htm. Retrieved 28 Sep 2007.
29. Rice, Clifford P., Isabelle Schmitz-Afonso, Jorge E. Loyo-Rosales, Edward Link, Roger Thoma, Laura Fay, Dave Altfater, and Mary J. Camp. Alkylphenol and Alkylphenol-Ethoxylates in Carp, Water, and Sediment from the Cuyahoga River, Ohio. Environ. Sci. Technol. Vol. 37, Issue 17. 2003. http://pubs.acs.org.proxy.ohiolink.edu:9099/cgi-bin/abstract.cgi/esthag/2003/37/i17/abs/e... Retrieved 27 Oct 2007.
30. Said, Ahmed. Environmental Assessment. An Innovative Index for Evaluating Water Quality in Streams. Environmental Management. Vol. 34, No3. http://journals.ohio.link.edu/ejc.article.cgi?issn=0364152x&issue=v34i0003&article=406_aiifewqis&redir=bad_tracker. Retrieved 17 Oct 2007.

Mitterbach
- 23 -
31. Thomas, Stacy. The Foundation for Economic Education. (Published in The Freeman: Ideas on Liberty – May 2000.) http://www.jcu.edu/chemistry/naosmm/2007/Cuyahoga%20Revisited.htm. Retrieved 28 Sep 2007.
32. Tuckerman, Steven A. Environmental Restoration of the Cuyahoga River Through Dam Removal. North-Central Section – 40th Annual Meeting (20-21 April 2006), Paper No. 14-2. http://gsa.confex.com/gsa/2006NC/finalprogram/abstract_102924.htm. Retrieved 28 Sep 2007.
33. U.S. Environmental Protection Agency. Great Lakes Pollution Prevention and Toxics Reduction. Cuyahoga River Area of Concern. http://www.epa.gov/glnpo/aoc/cuyahoga.html. Retrieved 28 Sep 2007.
34. U.S. Environmental Protection Agency. National Assessment Database, Assessment Data for Ohio, Cuyahoga Watershed, Year 2002. http://oaspub.epa.gov/tmdl/w305b_report_v2.huc?p_huc=04110002&p_state=OH. Retrieved 28 Sep 2007.
35. U.S. Geological Survey. NWISWeb Tutorial. How to access real-time water-quality data in your watershed. http://nwis.waterdata.usgs.gov/tutorial/realtime_qw.html. Retrieved 13 Oct 2007.
36. U.S. Geological Survey. USGS Protocol Method Codes (proto_org). http://nwis.waterdata.usgs.gov/nwis/help/?read_file=proto_org&format=table. Retrieved 13 Oct 2007.
37. U.S. Geological Survey. USGS Water Quality Samples – 80 sites found. http://nwis.waterdata.usgs.gov/oh/nwis/qwdata?county_cd=39035&format=station_list&sort_key=site_no&group_key=huc_c... Retrieved 13 Oct 2007.
38. U.S. Geological Survey. Water Quality Samples for Ohio. USGS 04208000 Cuyahoga River at Independence OH. http://nwis.waterdata.usgs.gov/oh/nwis/qwdata?site_no=04208000&agency_cd=USGS&f... Retrieved 13 Oct. 2007.
39. U.S. PIRG (Public Interest Research Group). Sewage Overflow: Billions of Gallons of Sewage Contaminate Lake Erie. 23 May 2007. http://www.uspirg.org/home/reports/report-archives/our-rivers-lakes-and-streams/our-river... Retrieved 28 Sep 2007.

Mitterbach
- 24 -
Appendix B - Contacts: Organizations and individuals working to help clean up the Cuyahoga River include: Cuyahoga River Remedial Action Plan (RAP), (216) 241-2414. Cuyahoga Valley National Park Association (CVNPA), (330) 657-2909. Friends of the Crooked River, (330) 657-2055 or (440) 234-5427. National Council for Science and the Environment (NCSE). 1725 K. Street, Suite 212, Washington, D.C. 20006. Telephone: 202-530-5810. [email protected]. National Park Service Biologist, Meg Plona, (330) 342-0764 (CVNP). Northeast Ohio Regional Sewer District. 3900 Euclid Avenue, Cleveland, Ohio 44115-2506. Erwin J. Odeal (Executive Director), [email protected]. Jeannie Chapman (pollution reports), telephone 216-881-6600 (ext. 6853). Kim Jones (communications and community). Telephone: 216-881-6600, Fax: 216-881-7644. www.neorsd.org. Northeast Ohio Regional Sewer District (Water Quality and Industrial Surveillance, Environmental and Maintenance Services Center), 4747 East 49th Street, Cuyahoga Heights, Ohio 44125. Elizabeth Toot-Levy. Telephone: 216-641-6000. www.neorsd.org. USGS Hydrologist, Rebecca Bushon, (614) 430-7783.

Mitterbach
- 25 -